1. Introduction
Electricity markets structured around a predominantly hydro-thermal generation mix, as in Colombia, are significantly exposed to both endogenous and exogenous factors. These include the availability and cost of primary energy resources, hydrological conditions, climate variability, and macroeconomic dynamics, all of which may increase price volatility and generate asymmetric risks in price formation. The 1992 electricity crisis constitutes a historical benchmark of the Colombian power system’s vulnerability to adverse hydrological shocks associated with the El Niño phenomenon, which resulted in reduced river inflows and severe constraints on hydroelectric generation [
1]. The institutional response led to market liberalization within a framework of regulated competition and state oversight [
2]. Within this design, the market is divided into a regulated segment—primarily serving households and small enterprises through retailers operating under regulated tariffs—and a non-regulated segment, composed of large consumers with demand exceeding 100 kW or 55 MWh per month, who freely negotiate prices and quantities [
3]. Energy traded through contracts for the regulated market accounts for 44.87% of total transactions, while the non-regulated market represents 55.13%. This architecture was intended to simultaneously ensure reliability, efficiency, and continuity of supply, while enabling market-based mechanisms to reveal costs and allocate risks.
Despite the societal and economic relevance of the regulated market—given its large share in the total number of users and its substantial contribution to national electricity consumption—the available academic literature has focused predominantly on price formation in the spot and non-regulated markets, examining the transmission of supply shocks (hydrology, fuel prices), demand fluctuations, and technological risks [
4]. This emphasis leaves a significant gap in identifying the determinants associated with bilateral contract prices in the regulated market. Long-term bilateral contracts are the primary hedging instrument used to mitigate the high spot price volatility characteristic of hydro-thermal systems that depend heavily on hydrological conditions. Contract price formation, however, does not respond solely to the interaction of supply and demand. Tariff regulation, cross-subsidies, incentive mechanisms (such as the reliability charge), and the competitive structure among market participants interact with external determinants (fuel costs, exchange rate movements, inflationary pressures, and climate shocks) that shape price dynamics over time [
5]. In addition, regulatory instruments such as Resolución CREG 020 de 1996 (as amended by Resolución CREG 167 de 2008), along with more recent guidelines governing conduct and procurement procedures in the regulated market, have established price-based merit allocation rules and transparency standards aimed at preventing the exercise of market power and promoting efficiency in electricity purchases for regulated users [
6,
7]. In this setting, understanding the formation of regulated contract prices is relevant not only from a market-design perspective, but also for assessing how contractual mechanisms absorb, redistribute, or dampen pressures originating in the broader economic environment.
The electricity generation matrix of the Colombian system further heightens the market’s exposure to volatility shocks originating both within the power sector and the broader economy. Hydroelectric generation accounts for the majority of installed capacity (65%), while thermal sources—used primarily as backup—represent the second largest share (29%), thereby tightly linking electricity price behavior to climatic conditions [
8]. The combination of climate shocks, demand fluctuations, macroeconomic shifts, and variations in fuel costs creates a risk-intensive environment for generators and retailers, incentivizing the use of bilateral contracts as stabilization mechanisms [
9]. Accordingly, contract dynamics are linked to hydrological cycles, which determine dispatch conditions. Dry shocks reduce reservoir levels, increase thermal generation, and raise marginal costs, thereby exerting upward pressure on spot prices and on the risk premiums embedded in contracts [
10]. On the demand side, economic cycles also influence price volatility: industrial expansions and higher temperatures stimulate electricity consumption, increasing participation in the spot market and the demand for contractual hedging [
11]. The integration of renewable energy sources introduces additional uncertainty due to their weather dependence; in the absence of adequate flexibility mechanisms, this may increase premiums and additional costs associated with managing variability [
12]. At the macroeconomic level, factors such as inflation, interest rates, exchange rate movements, and international fossil fuel prices affect generation, transmission, and retailing costs. Through contractual indexation mechanisms, these cost variations are gradually passed on to regulated users [
13,
14]. Moreover, recent experience with extraordinary shocks—most notably the COVID-19 pandemic—demonstrated that non-energy exogenous disturbances (health-related, logistical, and macroeconomic) can simultaneously disrupt demand, cost structures, and operational risks, producing heterogeneous effects on electricity price formation [
15,
16]. Taken together, these features suggest that regulated contract prices should be understood as the outcome of a layered environment in which technological conditions, institutional rules, and macroeconomic signals interact over time rather than as the mechanical result of any single market force.
All these elements underscore the need for a more detailed understanding of the determinants shaping bilateral contract price formation in the regulated market and, in particular, how the volatility of these factors is transmitted across different segments of the price distribution. From a conceptual and methodological standpoint, this requires tools capable of capturing heterogeneous effects along the price distribution, as well as nonlinearities and complex interdependencies among variables. To this end, Quantile Regression (QR) has been employed, as it enables the estimation of relationships across different quantiles and identifies how economic and technological determinants exert differentiated effects at low, medium, and high price levels. This approach is especially valuable in markets characterized by pronounced asymmetries and extreme events [
17]. QR has been applied in energy markets to model trading periods and to assess sensitivity to gas and coal prices, demand conditions, and reserve levels [
18,
19]. It has also been used to quantify the impact of solar and wind generation on spot market outcomes [
20]. In Colombia, QR has been implemented to estimate the nonlinear effects of demand, reservoir levels, and fuel costs. During the COVID-19 crisis, the methodology revealed that variations in regulated demand increased spot price variability; however, this shock was partially mitigated by bilateral contracting, while the primary transmitter of volatility was the hydrological shock associated with the El Niño phenomenon [
16,
21]. Therefore, in a hydro-thermal system, bilateral contracts in the regulated market internalize hydrological, demand, fuel, and indexation risks. The existing evidence supports the use of QR as a suitable framework for analyzing the conditional distribution of prices (not merely their mean) and for capturing volatility transmission mechanisms in energy markets. In that sense, the contribution of QR in this paper is not to impose a fully structural causal interpretation, but rather to recover economically meaningful distributional patterns that may remain hidden under mean-based approaches.
In addition to technological factors, a broad set of macroeconomic variables has been identified as determinants of bilateral contract prices in the regulated market. To this end, we rely on the database compiled by Osorio-Ramírez [
22], which contains 153 monthly frequency variables and provides a comprehensive framework for characterizing both Colombia’s domestic and international economic dynamics. Given the high dimensionality of this dataset, autoencoder-based dimensionality reduction techniques have been implemented. These methods offer a flexible nonlinear alternative to linear approaches such as Principal Component Analysis (PCA), as they allow complex dependence patterns in high-dimensional macroeconomic information to be summarized into latent indices that can be incorporated parsimoniously into the empirical model [
23,
24]. In this study, however, the autoencoder is used primarily as a parsimonious dimensionality-reduction device rather than as an end in itself. Its role is to summarize broad macroeconomic co-movements into a reduced set of latent representations that can be incorporated into the quantile framework without overparameterizing the model. Thus, the latent factors are interpreted as synthetic indicators of macroeconomic conditions, not as structural shocks or exact economic primitives. The integration of quantile regression and nonlinear dimensionality reduction enables a richer assessment of the underlying determinants and their heterogeneous effects across the price distribution, preserving relevant macroeconomic signals while enhancing the explanatory capacity of the conditional price distribution.
The contribution of this paper should not be understood as the isolated use of quantile regression, but rather as the application of a distributional framework to a relatively underexplored segment of the electricity market: regulated bilateral contract prices. By combining electricity-market fundamentals with a high-dimensional summary of macroeconomic conditions, the paper provides evidence on whether regulated contract prices respond uniformly to broad economic pressures or whether these effects are concentrated in specific price regimes.
The main empirical contribution is that macroeconomic conditions do not appear to affect regulated contract prices uniformly. Their role is weak, localized, and mostly visible in upper quantiles, while electricity-market fundamentals remain more consistently associated with price formation.
Analyzing the determinants of bilateral contract prices in the regulated market provides valuable input for public policy discussions on the balance between reliability and affordability. For instance, if spot prices are found to transmit volatility to contractual prices at upper quantiles positively, this would support policies aimed at fostering greater technological and hedging diversification or at refining allocation mechanisms to reduce exposure to extreme market conditions. Conversely, if demand exhibits stabilizing effects in the upper tail of the distribution, the role of demand-side management and energy efficiency policies could be further explored as complementary instruments to smooth tariff extremes. In all cases, evidence on the distribution of impacts (rather than solely on mean effects) is crucial for calibrating regulatory and market-based measures under criteria of efficiency and equity. At the same time, the empirical strategy adopted here should be read as an explanatory distributional approach aimed at characterizing heterogeneous associations across price regimes, which is especially useful in regulated electricity markets where indexation rules, forward contracting, and operational risk jointly shape contractual outcomes.
Based on the estimation of the QR model using monthly data for the period 2009–2021, the dynamics of the weighted price of bilateral contracts in the regulated market are explained by the following technological and economic factors: demand exhibits a negative effect in the upper tail (95th percentile), suggesting that increases in consumption are associated with lower extreme prices; the spot price shows a positive effect between the 85th and 95th percentiles, indicating volatility transmission under stressed market conditions; hydro and thermal generation display a positive effect in the lower tail (5th–35th percentiles), consistent with periods of greater resource availability and lower marginal costs; and (iv) the exchange rate presents a negative and statistically significant effect between the 75th and 85th percentiles, implying that macroeconomic pressures captured by the index contribute to moderating prices at relatively high levels. Taken together, these findings reveal meaningful asymmetries with implications for risk management and tariff policy in the regulated market. More broadly, they suggest that electricity-system fundamentals remain more consistently associated with regulated contract prices than the broader macroeconomic environment, whose role appears more limited and uneven across quantiles. They also support the use of methodologies capable of capturing the whole structure of the price distribution, as well as the underlying macroeconomic complexity.
2. Methodology
The approach adopted to evaluate the determinants of bilateral contract prices in the regulated market is Quantile Regression. In addition, to examine the effects of macroeconomic variables, the database compiled by [
22] was employed. This dataset contains 153 monthly frequency variables and provides a comprehensive framework for characterizing the dynamics of the Colombian economy. The following section presents the methodological description of the quantile regression framework and the autoencoder method, which is applied to reduce the dimensionality of the macroeconomic variable dataset.
The integration of quantile regression and autoencoder-based dimensionality reduction follows directly from the empirical structure of the problem. On the one hand, regulated electricity contract prices may respond differently across low-, medium-, and high-price regimes, making a conditional-quantile framework more appropriate than a mean-based specification. On the other hand, the macroeconomic block contains a large number of potentially correlated variables, which cannot be included directly in the quantile-regression model without creating overparameterization, multicollinearity, and unstable estimates.
The autoencoder is therefore used as a first-stage dimensionality-reduction device that compresses the high-dimensional macroeconomic information into a smaller set of latent indicators. These indicators are then incorporated into the quantile-regression model together with the electricity-market controls. From an econometric perspective, this two-step strategy allows the model to preserve broad macroeconomic information while maintaining a parsimonious specification suitable for monthly data. The purpose is not to use the autoencoder as a predictive model, but to obtain a compact representation of macroeconomic co-movements that can be analyzed across the conditional distribution of regulated contract prices.
To assess whether the findings depend on the nonlinear representation produced by the autoencoder, the robustness analysis compares the baseline specification with an alternative model based on Principal Component Analysis. PCA provides a linear benchmark, while the autoencoder allows for a more flexible nonlinear summary of the macroeconomic database.
All empirical computations were carried out using R software version 4.3.2 (R Foundation for Statistical Computing, Vienna, Austria) and Python version 3.10.12 (Python Software Foundation, Wilmington, DE, USA).
2.1. Quantile Regression
As proposed by [
25], quantile regression is based on a flexible semiparametric framework that captures the stochastic relationship between variables, allowing for consistent estimation even in non-Gaussian environments. Moreover, it requires only minimal assumptions about the distribution of the underlying data-generating process.
The primary motivation for adopting this model is its ability to examine how explanatory variables affect different points along the distribution of the dependent variable, rather than focusing solely on its mean. This approach is particularly useful for capturing asymmetric and nonlinear effects that may remain undetected in traditional methods such as linear regression. Moreover, it enables the identification of how the relationship between variables changes under extreme or atypical conditions, thereby providing a more comprehensive and robust perspective on the phenomenon under study [
26]. In this sense, quantile regression constitutes a robust alternative to the classical Ordinary Least Squares (OLS) model.
The analysis begins with the definition of a quantile. Ref. [
27] states that, given a sample of observations of a variable
Y with distribution
,
It will be that the quantile of the sample, with , will be the value b that leaves a proportion of observations below b and another proportion above. In the case of the median (), 50% of the data will lie below and another 50% above. If we use the first quartile (), 25% of the values of Y will lie below and 75% above; and similarly, but in reverse, for the third quartile.
Following [
28], the quantile regression model is based on the idea of estimating a conditional quantile
for the
i-th observation, by fitting a parameter vector such that the expected loss function is minimized.
where:
: Represents the conditional quantile of order of the dependent variable , given the set of covariates .
: Corresponds to the vector of covariates, which includes the intercept and the explanatory variables associated with observation i.
: Is the vector of estimated parameters for the quantile level , which varies according to the quantile considered.
Once the theoretical model is defined, the values of the parameters that best fit the model to the -th quantile are determined. The procedure mimics the approach of classical linear regression, in which the parameter vector is fitted by minimizing the sum of squared residuals, corresponding to a quadratic loss function.
In this way, the parameter vector
is obtained by solving the following optimization problem:
where
is the loss function associated with the quantile level
, defined as:
The function , known as the pinball function, penalizes errors asymmetrically. When the residual is negative, the penalty is ; whereas if the residual is positive, the penalty is .
In the context of this study, the quantile regression framework is used to characterize how electricity-market fundamentals and summarized macroeconomic conditions are associated with different segments of the distribution of regulated contract prices. Given the contractual nature of the dependent variable and the monthly frequency of the data, the estimated coefficients are interpreted as conditional distributional associations rather than as fully structural causal effects. This makes the approach especially useful for identifying heterogeneous patterns across low-, medium-, and high-price regimes in a regulated hydro-thermal electricity market.
2.2. Autoencoders
Autoencoders are an artificial neural network architecture primarily used for unsupervised learning of efficient data representations. Ref. [
29] explains that their main function is to encode the input data into a lower-dimensional latent representation, and then reconstruct the original input from this representation. In this way, the model learns a compressed encoding that preserves the most relevant information from the dataset.
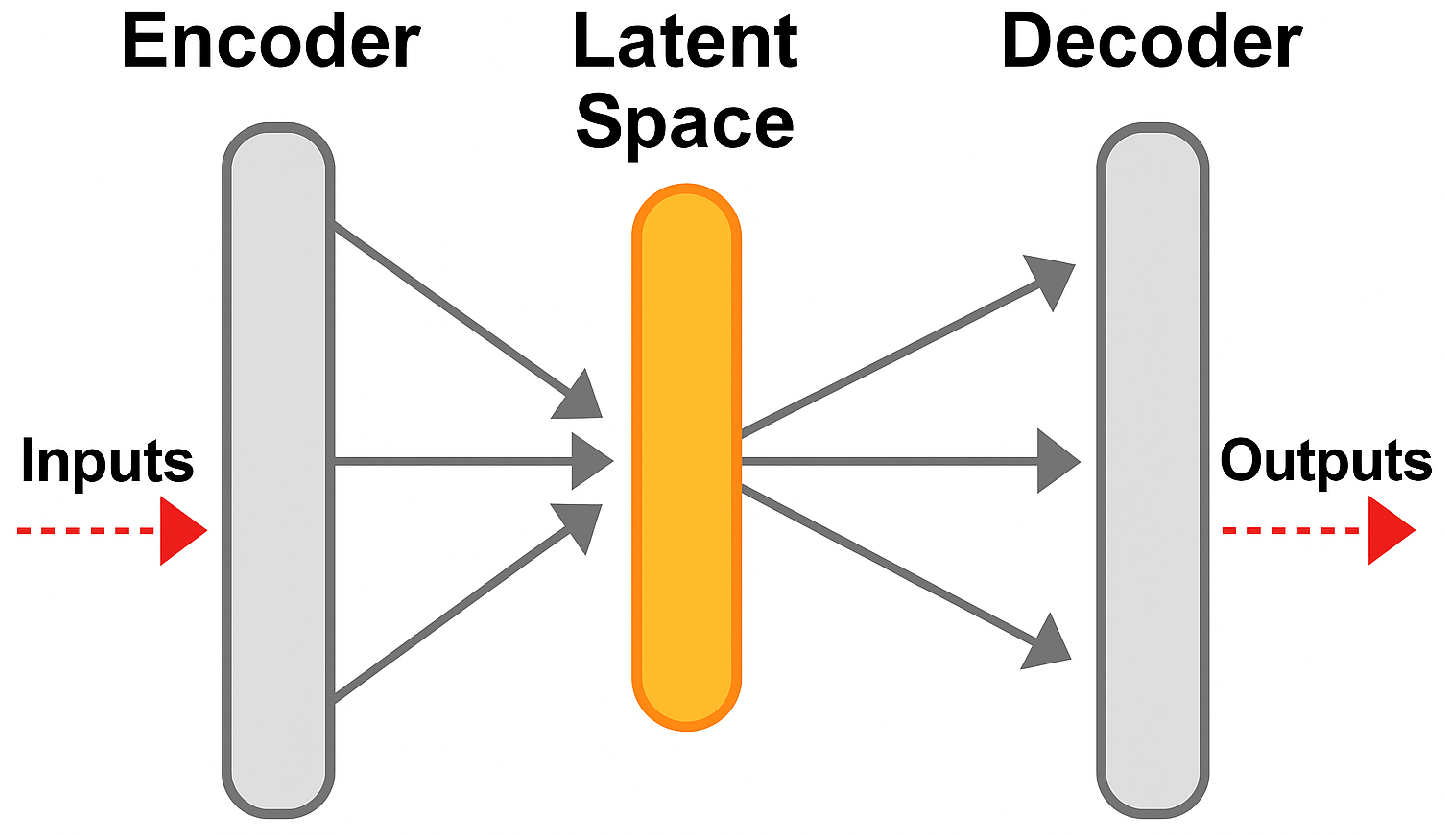
As shown in
Figure 1, in the encodingphase, an autoencodermaps an input vector through an encoding function. In the decodingphase, the model maps the encoded vector to the output vector in order to reconstruct the input data through a decoding function.
In this study, the autoencoder is used as a dimensionality-reduction device to summarize the information contained in a large set of monthly macroeconomic variables. Rather than treating the latent representations as structural shocks, the purpose is to obtain a reduced set of synthetic indicators that preserves relevant co-movement patterns in the data while avoiding overparameterization in the quantile regression model. In this sense, the autoencoder serves as an intermediate representation tool that facilitates the incorporation of broad macroeconomic information into the empirical analysis of regulated electricity contract prices.
The function of an autoencoder can be written as:
where
represents the
i-th dimension of the training sample,
represents the
i-th dimension of the output data, and
n is the total number of training data points. The term
l refers to the reconstruction error between the input and output, defined as:
The mapping functions of the encoder and the decoder are expressed as:
and
where
s is a nonlinear activation function,
W and
are the weight matrices, and
b and
are the bias vectors.
During training, the autoencoder’s weights and biases are adjusted to minimize reconstruction error using an optimization algorithm. Once trained, the model learns to represent the input data in a compressed latent space and to reconstruct it with minimal loss [
30].
The autoencoder was implemented as a shallow neural network designed exclusively for dimensionality reduction. The input layer contains the 153 transformed and scaled macroeconomic variables. The encoder maps this input into a ten-dimensional latent representation through a dense layer with ReLU activation, while the decoder reconstructs the original 153-dimensional input through a dense output layer, also with ReLU activation. The model was trained by minimizing the mean squared reconstruction error using stochastic gradient descent, with a learning rate of 1.5 and 10 epochs. Since the database had already been scaled, no additional normalization was applied during the autoencoder training stage. The complete architecture and training parameters are reported in
Table A1 in
Appendix A.1.
Accordingly, the economic interpretation of the autoencoder-derived factors should be understood as exploratory rather than structural. Since the latent dimensions are not directly observed macroeconomic variables, their labels were assigned ex post by examining the original variables with the highest absolute correlations with each retained factor. These components are therefore interpreted as synthetic indicators mainly associated with broad macroeconomic dimensions, not as structural shocks or exact economic primitives. To improve transparency,
Appendix A.2 reports the representative macroeconomic indicators associated with each retained latent factor and the corresponding economic label.
3. Data
The data used in this study come from two main sources. First, information on the Colombian electricity market was obtained from the Sinergox platform of XM [
31]. This database includes monthly information on the weighted-average price of bilateral contracts in the regulated market, electricity demand, the spot price, and electricity generation disaggregated by hydro and thermal sources. The analysis period spans from April 2009 to July 2021. A descriptive summary of the variables used is presented in
Table 1.
The selection of representative variables for the electricity market is based on the existing literature, particularly the studies by [
4,
21]. These works identify that the main determinants of electricity prices in Colombia are associated with supply- and demand-side factors, among which the level of electricity demand, the availability of water resources (reflected in reservoir capacity and operation), and the use of fossil-fuel-based thermal generation stand out. Taken together, these variables adequately capture the structural dynamics of the Colombian electricity market and allow its medium- and long-term behavior to be analyzed.
The selection of electricity-market variables follows the objective of the paper, which is not to reproduce a full operational dispatch model, but to control for the main aggregate market conditions that may be associated with regulated contract prices. The spot price is included as a proxy for short-term market stress and marginal-cost pressures in the wholesale market. Electricity demand captures aggregate consumption conditions and potential pressure on contractual requirements. Hydropower and fossil-fuel generation are included as aggregate indicators of the hydro-thermal composition of the system, reflecting the relative availability of water-based generation and the use of thermal backup. These variables are therefore interpreted as market-level controls rather than as a complete engineering representation of system operation.
The macroeconomic variables were not selected individually in order to avoid imposing an arbitrary small set of indicators or excluding relevant sources of macroeconomic co-movement. Instead, the study uses a broad macroeconomic database and summarizes its information through dimensionality-reduction techniques. This strategy is consistent with the purpose of evaluating whether broad macroeconomic conditions, rather than isolated macroeconomic variables, are reflected in regulated contract prices.
The transformation of non-stationary series was motivated by both statistical and economic considerations. From a statistical perspective, differencing reduces the risk of spurious relationships driven by common trends among prices, macroeconomic aggregates, and electricity-market variables. From an economic perspective, the transformed series emphasize short- and medium-term changes in macroeconomic conditions, which are more consistent with the idea of assessing whether variations in the economic environment are associated with changes in regulated contract-price regimes. Therefore, stationarity transformations are not only a technical requirement, but also help align the empirical specification with the economic interpretation of the model.
It is important to clarify the role of the electricity-market variables included in the empirical specification. The objective of this paper is not to reproduce the physical operation of the Colombian hydro-thermal power system or to estimate a dispatch, reliability, or congestion model. Rather, the electricity-sector variables are included as aggregate market-level controls that capture broad conditions under which regulated contract prices are formed. In this sense, hydropower and fossil-fuel generation are interpreted as aggregate indicators of the hydro-thermal composition of the system, while demand and spot prices capture market pressure and short-term stress conditions.
More detailed engineering variables, such as reservoir levels, inflow conditions, generation constraints, congestion indicators, or reliability measures, would undoubtedly enrich an operational analysis of the Colombian power system. However, these variables are not consistently available with the same historical coverage, frequency, and compatibility required for the macroeconomic database used in this study. Therefore, their exclusion should be understood as a limitation of the present analysis rather than as an assumption that such variables are irrelevant. Future research could extend this framework by incorporating detailed operational and reliability indicators when longer and harmonized historical series become available.
Second, 153 monthly macroeconomic variables compiled by [
22] were used for the period from April 2009 to July 2021. These series were subjected to a dimensionality reduction process using autoencoders in order to extract representative factors summarizing the main comovement patterns of the Colombian economy. Non-stationary series were differenced to ensure statistical stability and, since the data were already scaled, no additional normalization procedure was applied during model training.
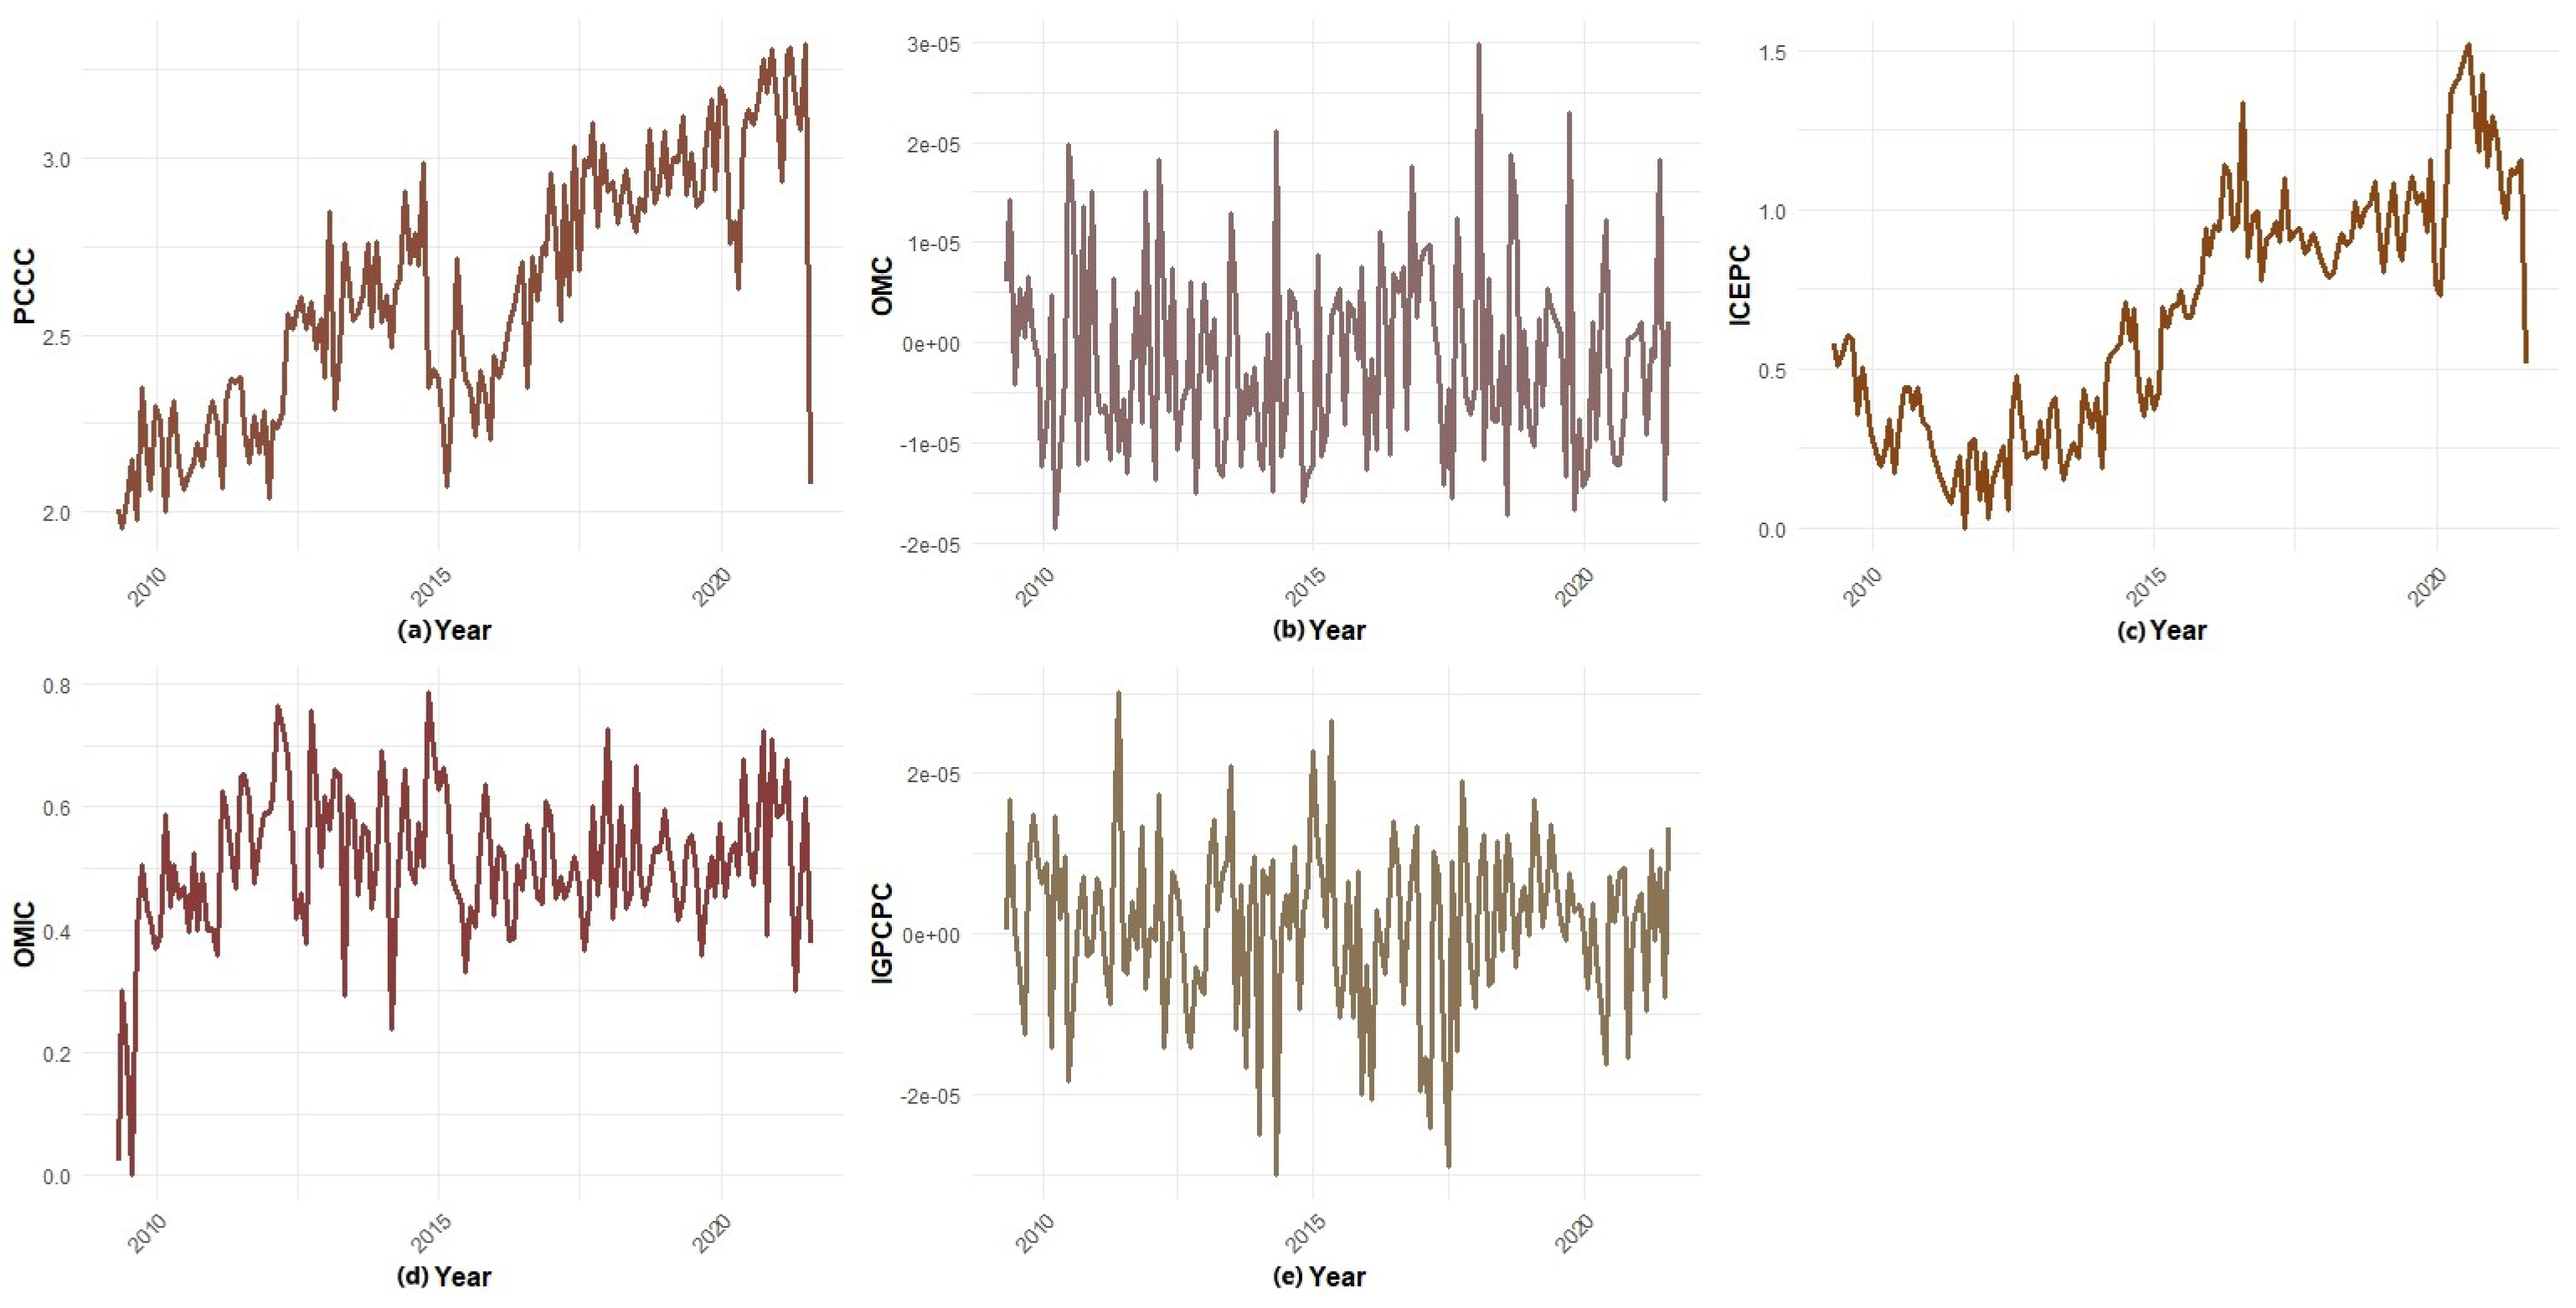
From the ten latent variables generated by the encoder network, five components were selected for inclusion in the econometric model. This selection was based on a correlation analysis between each latent factor and the original macroeconomic series, identifying, for each component, the five variables with the highest absolute correlation. This procedure made it possible to infer the predominant economic interpretation of each factor.
Figure A1 in
Appendix A presents the evolution of the macroeconomic variables obtained from the autoencoder architecture, while
Table A2 reports the representative original indicators used to support the interpretation of each retained factor.
The first autoencoder showed a high correlation with consumer price indicators and construction cost measures, particularly the Consumer Price Index (CPI) by sectors (housing, health, and education) and the housing construction cost index. For this reason, it was labeled Consumer Prices and Construction (PCCC). The second component was mainly associated with the monetary aggregates M0, M1, M2, and M3, reflecting the dynamics of liquidity and money availability in the Colombian economy; accordingly, it was identified as Money Supply (OMC).
The third autoencoder showed stronger correlations with exchange-market variables, such as the COP/USD exchange rate and the nominal and real effective exchange rates (NEER and REER), and was therefore labeled Effective Exchange-Rate Indicators (ICEPC). The fourth component was related to both monetary aggregates and the value of imports recorded in the balance of payments, and was therefore identified as Money Supply and Imports (OMIC). Finally, the fifth autoencoder was associated with fiscal and producer-price variables, including central government financing, the Producer Price Index (PPI), and core CPI, and was labeled Government, Consumer, and Producer Price Indicators (IGPCPC). A detailed description of these variables is presented in
Table 2.
Finally, based on the five latent components obtained through the autoencoder architecture and the variables from the Sinergox platform, a consistent and coherent database was consolidated for the study period from April 2009 to July 2021.
Table 3 presents the descriptive statistics, the correlations with the weighted-average price (WAP) of regulated-market contracts, and the results of the Augmented Dickey–Fuller (ADF) unit-root test for each variable.
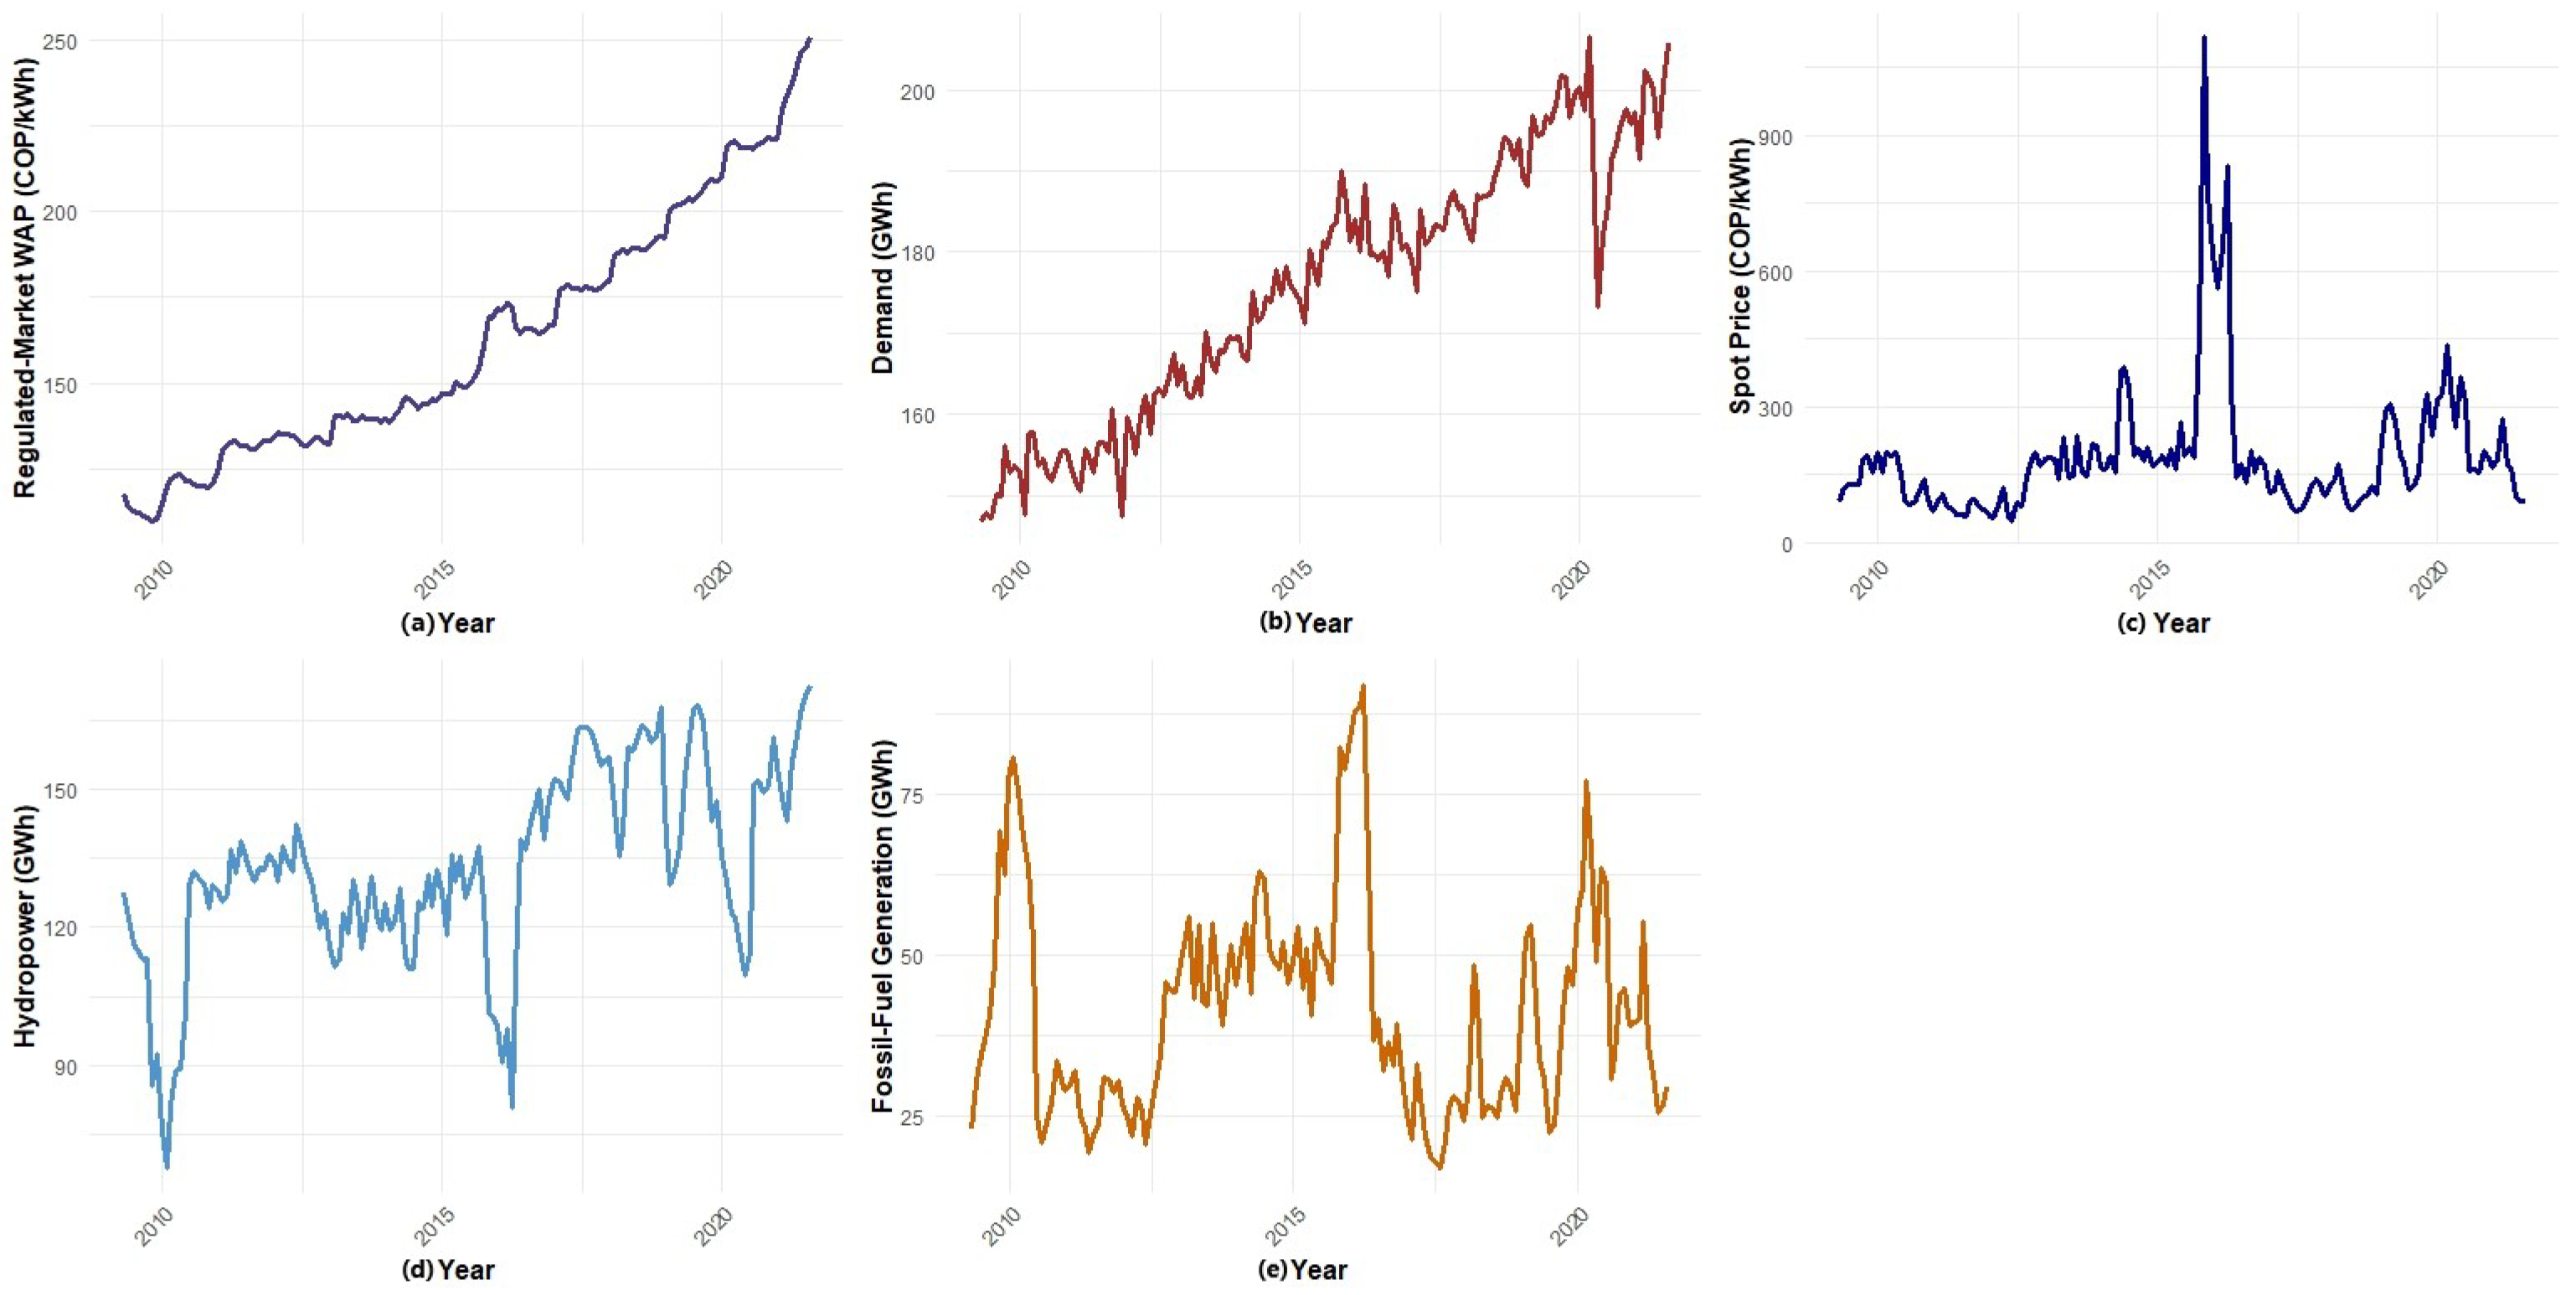
Figure 2 illustrates the time evolution of the electricity-market series during the sample period. Between 2009 and 2021, the regulated-market WAP recorded an average price of 163 COP/kWh, with moderate variability, reaching its historical maximum in July 2021, when it closed at 251 COP/kWh. It also exhibits a steadily increasing trend, consistent with the contractual and indexed nature of the regulated market and with its limited response to climatic shocks (2009–2010 and 2015–2016), the 2021 rebound driven by higher thermal generation costs, and the recovery in demand after COVID-19 [
32,
33,
34].
Electricity demand in the National Interconnected System (NIS) shows low variability and a mean of 175.64 GWh, being the variable with the highest positive correlation with the regulated-market WAP. This result suggests that increases in demand tend to coincide with higher contractual prices, possibly as a consequence of supply pressures during periods of high demand [
35,
36,
37]. In turn, the spot price exhibits high volatility, largely explained by the effects of the ENSO phenomenon, with the most notable peak recorded in October 2015, when it reached 1117 COP/kWh. However, its low correlation with the WAP indicates that the regulated market is relatively protected from these fluctuations, given the long-term nature of contracts [
33,
38,
39,
40].
Hydropower generation showed a positive correlation with the regulated-market WAP; however, this relationship should be interpreted with caution, since contractual prices mainly respond to expectations of hydrological risk, scarcity conditions, and thermal backup costs rather than to contemporaneous generation levels. In this context, hydro generators tend to favor medium- and long-term contracts as a hedging mechanism against spot-market volatility, which may lead to high contractual prices even during periods of abundant water availability [
32,
41,
42]. In contrast, fossil-fuel generation has a mean of 41.79 GWh and low variability, with a near-zero and slightly negative correlation with the WAP, suggesting a weak association consistent with the contractual and regulated nature of this market [
43].
Regarding the factors derived from the autoencoders, the PCCC and ICEPC components exhibit low variability and a high positive correlation with the regulated-market WAP, suggesting that consumer prices, construction costs, and effective exchange-rate indicators are associated with the formation of contractual prices. In contrast, the OMC, OMIC, and IGPCPC factors show low correlation with the WAP, indicating a limited influence of money supply, imports, and fiscal conditions on regulated contract prices, which reinforces the relatively stable and weakly sensitive nature of this market to this type of covariates.
Additionally, the ADF test was applied to the final set of series used in the empirical analysis, and the results show evidence against the presence of a unit root at the 1% and 5% significance levels. Therefore, after the required transformations and the extraction of latent factors, the resulting variables do not require further transformations before estimating the econometric model.
In this way, the quantile regression model can be represented as a linear function of the response variable and its predictors:
where
is the response variable and corresponds to the weighted-average price of contracts destined for the regulated market;
represents the spot price;
corresponds to electricity demand;
denotes hydropower generation;
denotes fossil-fuel generation; and
,
,
,
, and
correspond to the variables obtained through the autoencoder methodology: PCCC (autoencoder 1), OMC (autoencoder 2), ICEPC (autoencoder 3), OMIC (autoencoder 4), and IGPCPC (autoencoder 5), respectively.
The empirical specification should be interpreted as a reduced-form distributional model rather than as a causal or structural model of contract price formation. Potential simultaneity may exist among regulated contract prices, spot prices, demand, and other electricity-market variables. For this reason, the estimated coefficients are interpreted as conditional associations across price regimes, not as causal effects. This point is particularly relevant in regulated electricity-contract markets, where prices are shaped by long-term procurement decisions, indexation rules, risk-management mechanisms, and expectations rather than by contemporaneous market-clearing conditions alone. A full treatment of endogeneity and dynamic adjustment would require valid instruments, a structural market model, or a dedicated dynamic specification, which lies beyond the scope of this study.
4. Results and Discussion
The selected quantile range has a practical interpretation in the context of regulated electricity contract prices. Lower quantiles represent relatively low-price contract regimes, central quantiles capture more typical market conditions, and upper quantiles reflect high-price regimes in which scarcity expectations, risk premia, or short-term market stress may become more relevant. Therefore, the quantile-regression framework allows us to examine whether electricity-market fundamentals and macroeconomic conditions are associated with contract prices uniformly across the distribution or mainly under specific price regimes.
Before discussing the quantile-regression results, it is useful to clarify how the included electricity-market variables relate to basic power-system operation principles. In a hydro-thermal system such as Colombia’s, short-term spot prices are closely linked to the system’s marginal operating conditions. During periods of abundant water availability, hydropower can supply a larger share of demand at relatively low marginal cost, reducing the need for thermal backup. Conversely, under dry conditions or hydrological stress, thermal generation becomes more relevant, increasing expected operating costs and raising the risk premia that market agents may incorporate into contract negotiations.
Regulated bilateral contract prices do not mechanically follow the spot price because they are shaped by long-term procurement decisions, indexation rules, and hedging arrangements. However, spot-market conditions still provide information about system stress, expected marginal costs, and the opportunity cost of contracting. In this sense, the spot price, hydropower generation, fossil-fuel generation, and demand are interpreted here as aggregate market-level indicators that connect the econometric model with the operational logic of the hydro-thermal system, without attempting to reproduce a full dispatch optimization, congestion, or reliability model.
From an operational perspective, the significance of the spot price in the upper quantiles can be interpreted as evidence that contract prices become more sensitive to short-term marginal-cost signals when the system is under stress. This does not imply a one-to-one pass-through from the spot market to regulated contracts, but rather that high-price contract regimes may incorporate information about expected scarcity, thermal backup costs, and risk premia.
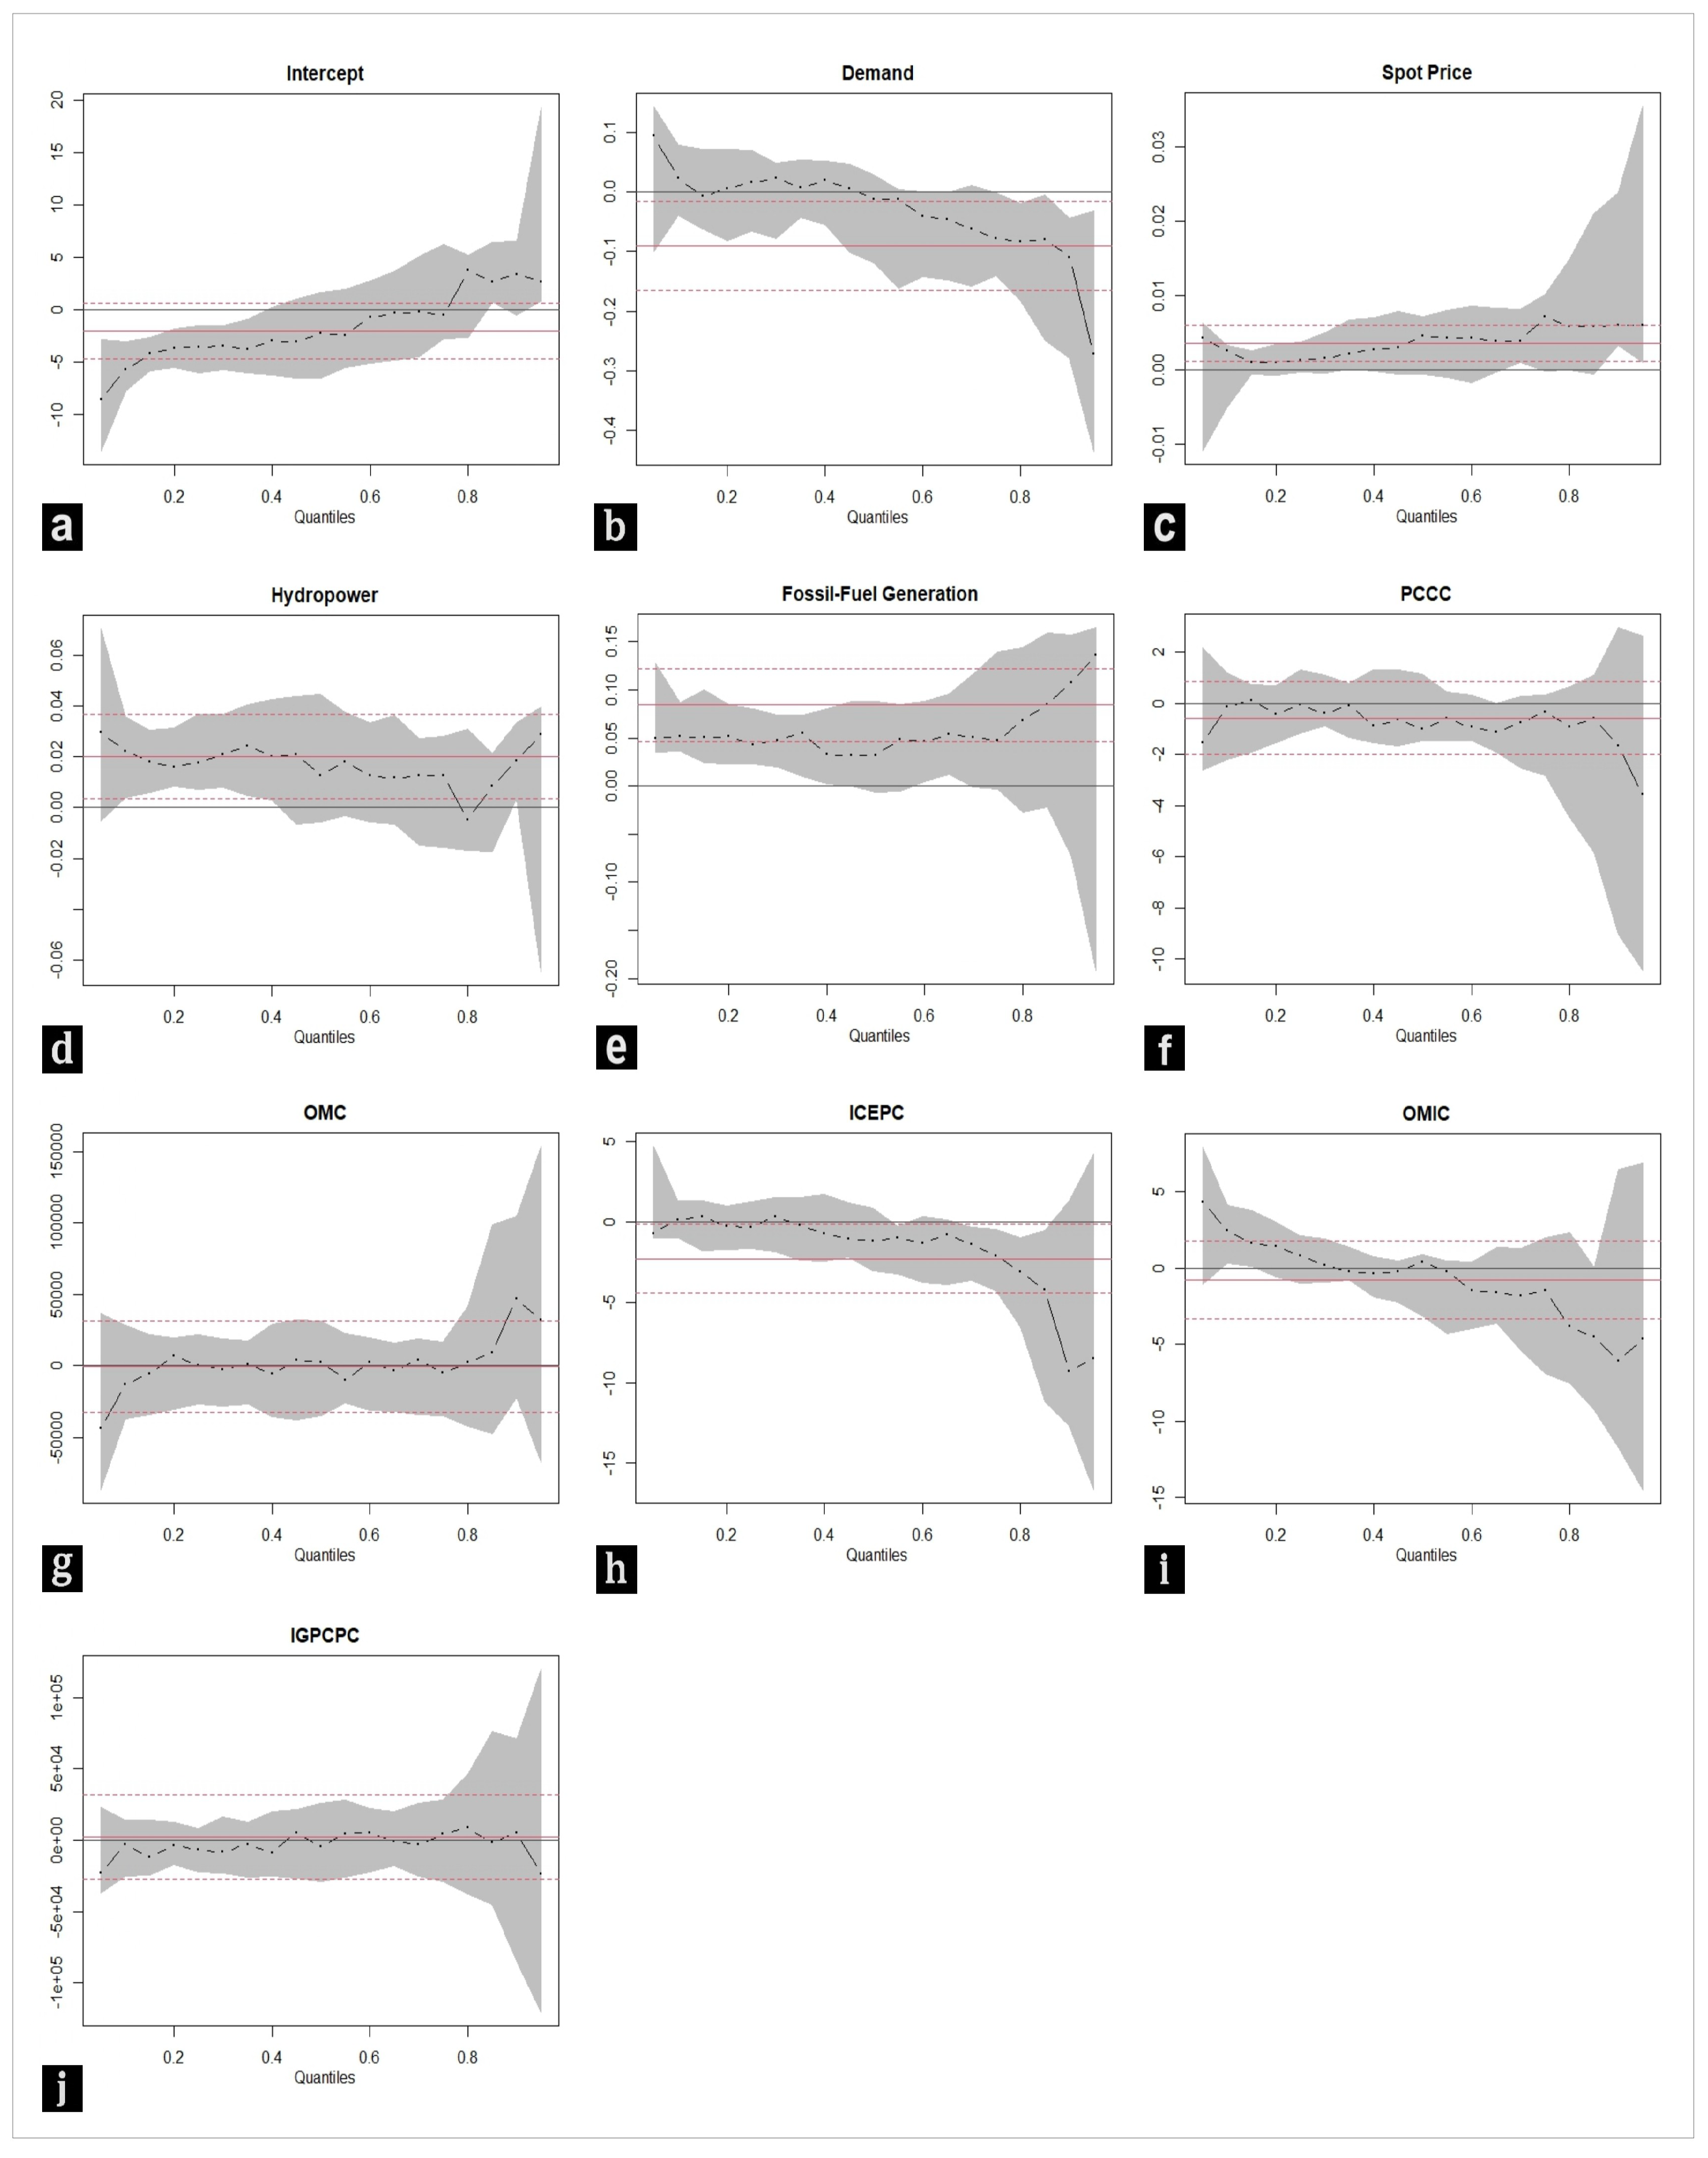
This section presents the results of the quantile regression model estimated for different quantiles of contract prices, allowing us to examine how the associations of demand, the spot price, hydropower generation, fossil-fuel generation, and the macroeconomic factors vary across the distribution of regulated contract prices over the period from April 2009 to July 2021. The main results are summarized in
Figure 3, and the quantile regression coefficients are reported in
Table 4. Because these variables belong to the same market environment, the coefficients are interpreted as conditional distributional associations rather than as fully identified causal effects. This perspective is particularly relevant in a regulated hydro-thermal system, where contract prices are shaped jointly by forward-looking negotiations, indexation rules, and operational conditions.
In panel (b) of
Figure 3, electricity demand is largely non-significant across the lower and middle parts of the distribution, which is consistent with the nature of regulated bilateral contracts, in which prices and quantities are set in advance and short-run demand adjustments are limited [
44,
45]. A statistically significant negative association only appears in the right tail, at the 95th percentile, where an increase of 1 GWh in demand is associated with an approximate reduction of 0.271 in contract prices. Rather than suggesting a general inverse demand effect, this result should be read as a localized upper-tail pattern. One possible interpretation is that this segment of the distribution reflects periods in which exceptional market conditions, including those observed during the COVID-19 shock, altered the usual interaction between regulated demand and contractual pricing [
16].
In panel (c) of
Figure 3, the spot price exhibits a positive association with the price of bilateral contracts, although statistical significance is concentrated between the 85th and 95th percentiles. Within this range, an increase of 1 COP/kWh in the spot price is associated with an approximate increase of 0.006 in contract prices, which points to a partial pass-through of limited magnitude. This upper-tail pattern is consistent with periods of heightened system stress—such as the hydrological pressures observed during El Niño episodes—when market agents may incorporate higher expected costs and risk premia into contractual arrangements [
46]. Across the rest of the distribution, the absence of statistical significance is consistent with a regulated scheme in which indexation formulas and tariff stabilization mechanisms dampen the direct influence of short-run spot-price volatility [
47].
In turn, hydropower generation, shown in panel (d) of
Figure 3, exhibits a positive association with regulated contract prices throughout the distribution, although statistical significance is concentrated in the left tail, particularly between the 5th and 35th percentiles. Within this range, an additional increase of 1 GWh in hydropower generation is associated with small increases in contract prices, ranging from 0.016 to 0.029. Given the contractual and forward-looking nature of the regulated market, this pattern should not be read as a contemporaneous marginal-cost effect. A more cautious interpretation is that periods of stronger hydro participation may coincide with contracting environments in which expectations about hydrological risk, opportunity costs, and hedging considerations remain relevant for price formation. In that sense, the positive coefficient is more consistent with the broader contracting logic of hydro-based firms than with a direct causal effect of current hydro generation on contract prices [
48,
49,
50].
Likewise, fossil-fuel generation, shown in panel (e) of
Figure 3, exhibits a positive association with regulated contract prices throughout the distribution, although significance is again localized in the left tail, specifically between the 5th and 35th percentiles. Within this range, an additional increase of 1 GWh in fossil-fuel generation is associated with small increases in contract prices, ranging from 0.043 to 0.055. This result is consistent with the role of thermal generation as a backup technology in the Colombian hydro-thermal system. Even when the effect is localized, greater thermal participation may be associated with operating environments in which agents internalize higher expected costs related to fuel use, reliability, and hedging needs in contract negotiations. In that sense, the coefficient is better interpreted as evidence of a pricing environment linked to higher expected operating costs than as a purely contemporaneous production effect. In the middle and upper quantiles, the lack of statistical significance suggests that the role of fossil-fuel generation is less clearly distinguishable from other determinants of contract pricing, including hydrological risk, contractual indexation, and medium- and long-term expectations [
49,
51].
On the other hand, the factors derived from the autoencoders show differentiated but generally limited associations with regulated contract prices. Autoencoder 1 (PCCC), associated with consumer prices and construction costs, exhibits a non-significant effect across the distribution. This pattern is consistent with the long-term nature of contracts and with the presence of indexation and regulatory mechanisms that dampen the direct influence of domestic price shocks [
52]. Similarly, Autoencoder 2 (OMC), associated with monetary aggregates, remains broadly non-significant across quantiles, suggesting that aggregate monetary liquidity is not clearly transmitted to contract prices within the empirical structure considered here [
53].
By contrast, Autoencoder 3 (ICEPC), related to exchange-rate indicators, exhibits a negative and statistically significant association in the right tail of the distribution, particularly between the 75th and 85th percentiles. This result is consistent with the idea that more favorable exchange-rate conditions may help contain imported cost pressures associated with fuels, inputs, and machinery when contract prices are already relatively high; in the lower and middle quantiles, however, this pattern is not clearly distinguishable [
54,
55]. In turn, Autoencoder 4 (OMIC), linked to money supply and imports, shows a non-significant effect throughout the distribution. This suggests that this macroeconomic dimension is not strongly reflected in regulated contract prices once electricity-system variables are taken into account [
56].
Autoencoder 5 (IGPCPC), associated with government, consumer, and producer price indicators, also exhibits a non-significant effect across the distribution of contract prices. This pattern is consistent with a tariff-regulation scheme aimed at efficient costs and at limiting the direct pass-through of broad macroeconomic shocks to regulated users [
57,
58].
The autoencoder-based factors summarize macroeconomic co-movements without overloading the model and, in the baseline specification, reveal mostly null or localized effects. Among them, the exchange-rate-related component (ICEPC) is the only one that becomes clearly relevant under relatively high contract-price conditions. Taken together, these results suggest that regulated contract prices are more consistently associated with electricity-system conditions and contractual arrangements than with broad macroeconomic influences, whose role appears more limited and uneven across quantiles.
Robustness Analysis
The robustness analysis is designed to assess whether the main empirical patterns depend on the specific way in which the high-dimensional macroeconomic information is summarized. For this reason, the baseline autoencoder specification is compared with an alternative model based on Principal Component Analysis (PCA). This exercise provides a linear benchmark for the nonlinear dimensionality-reduction strategy used in the main specification. If the main conclusions remain broadly similar under both representations, this suggests that the results are not driven exclusively by the architecture or interpretation of the autoencoder-derived factors.
In addition, the model is not evaluated only at a small number of selected quantiles. The quantile-regression estimates are obtained across a broad grid ranging from the 5th to the 95th percentile. This allows us to examine whether the estimated associations correspond to isolated coefficient movements or to broader distributional patterns across low-, medium-, and high-price regimes.
Although additional subsample analyses for hydrological-stress periods or the COVID-19 shock could provide further insights, the monthly frequency of the data and the sample period from April 2009 to July 2021 limit the reliability of such exercises, particularly for tail quantile estimation. Splitting the sample into narrower regimes would substantially reduce the number of observations available within each quantile and could lead to unstable coefficients. For this reason, we use the full-sample quantile framework and interpret the estimated lower- and upper-tail effects as evidence of heterogeneous price-regime behavior, while leaving more detailed crisis-specific or hydrological-regime estimations for future research with longer or higher-frequency datasets.
To evaluate the results obtained from the quantile regression model, a robustness analysis was conducted using an alternative dimensionality-reduction methodology applied to the macroeconomic variables used in this study. In the baseline model, the information was integrated from two sources. The first source, obtained from [
31], included technological and economic variables related to the National Interconnected System (NIS), such as hydropower generation, fossil-fuel generation, the weighted-average price of regulated-market contracts, the spot price, and electricity demand. The second source consisted of the 153 macroeconomic variables obtained from [
22], which were processed through an autoencoder architecture to reduce dimensionality and extract their most informative latent representations.
For this robustness analysis, Principal Component Analysis (PCA) was used as a linear alternative for reducing the dimensionality of the 153 macroeconomic variables. It is important to note that each method relies on different principles of information extraction: whereas the autoencoder seeks to reconstruct the inputs through nonlinear functions, PCA linearly projects the data onto the directions of highest variance. Comparing both approaches is useful because each one synthesizes macroeconomic information differently, making it possible to assess whether the main empirical patterns of the model remain broadly stable when the macroeconomic representation changes across dimensionality-reduction methodologies. Additionally, prior to applying PCA, the stationarity of the macroeconomic series was verified using the Augmented Dickey–Fuller test, and those series requiring transformation were differenced [
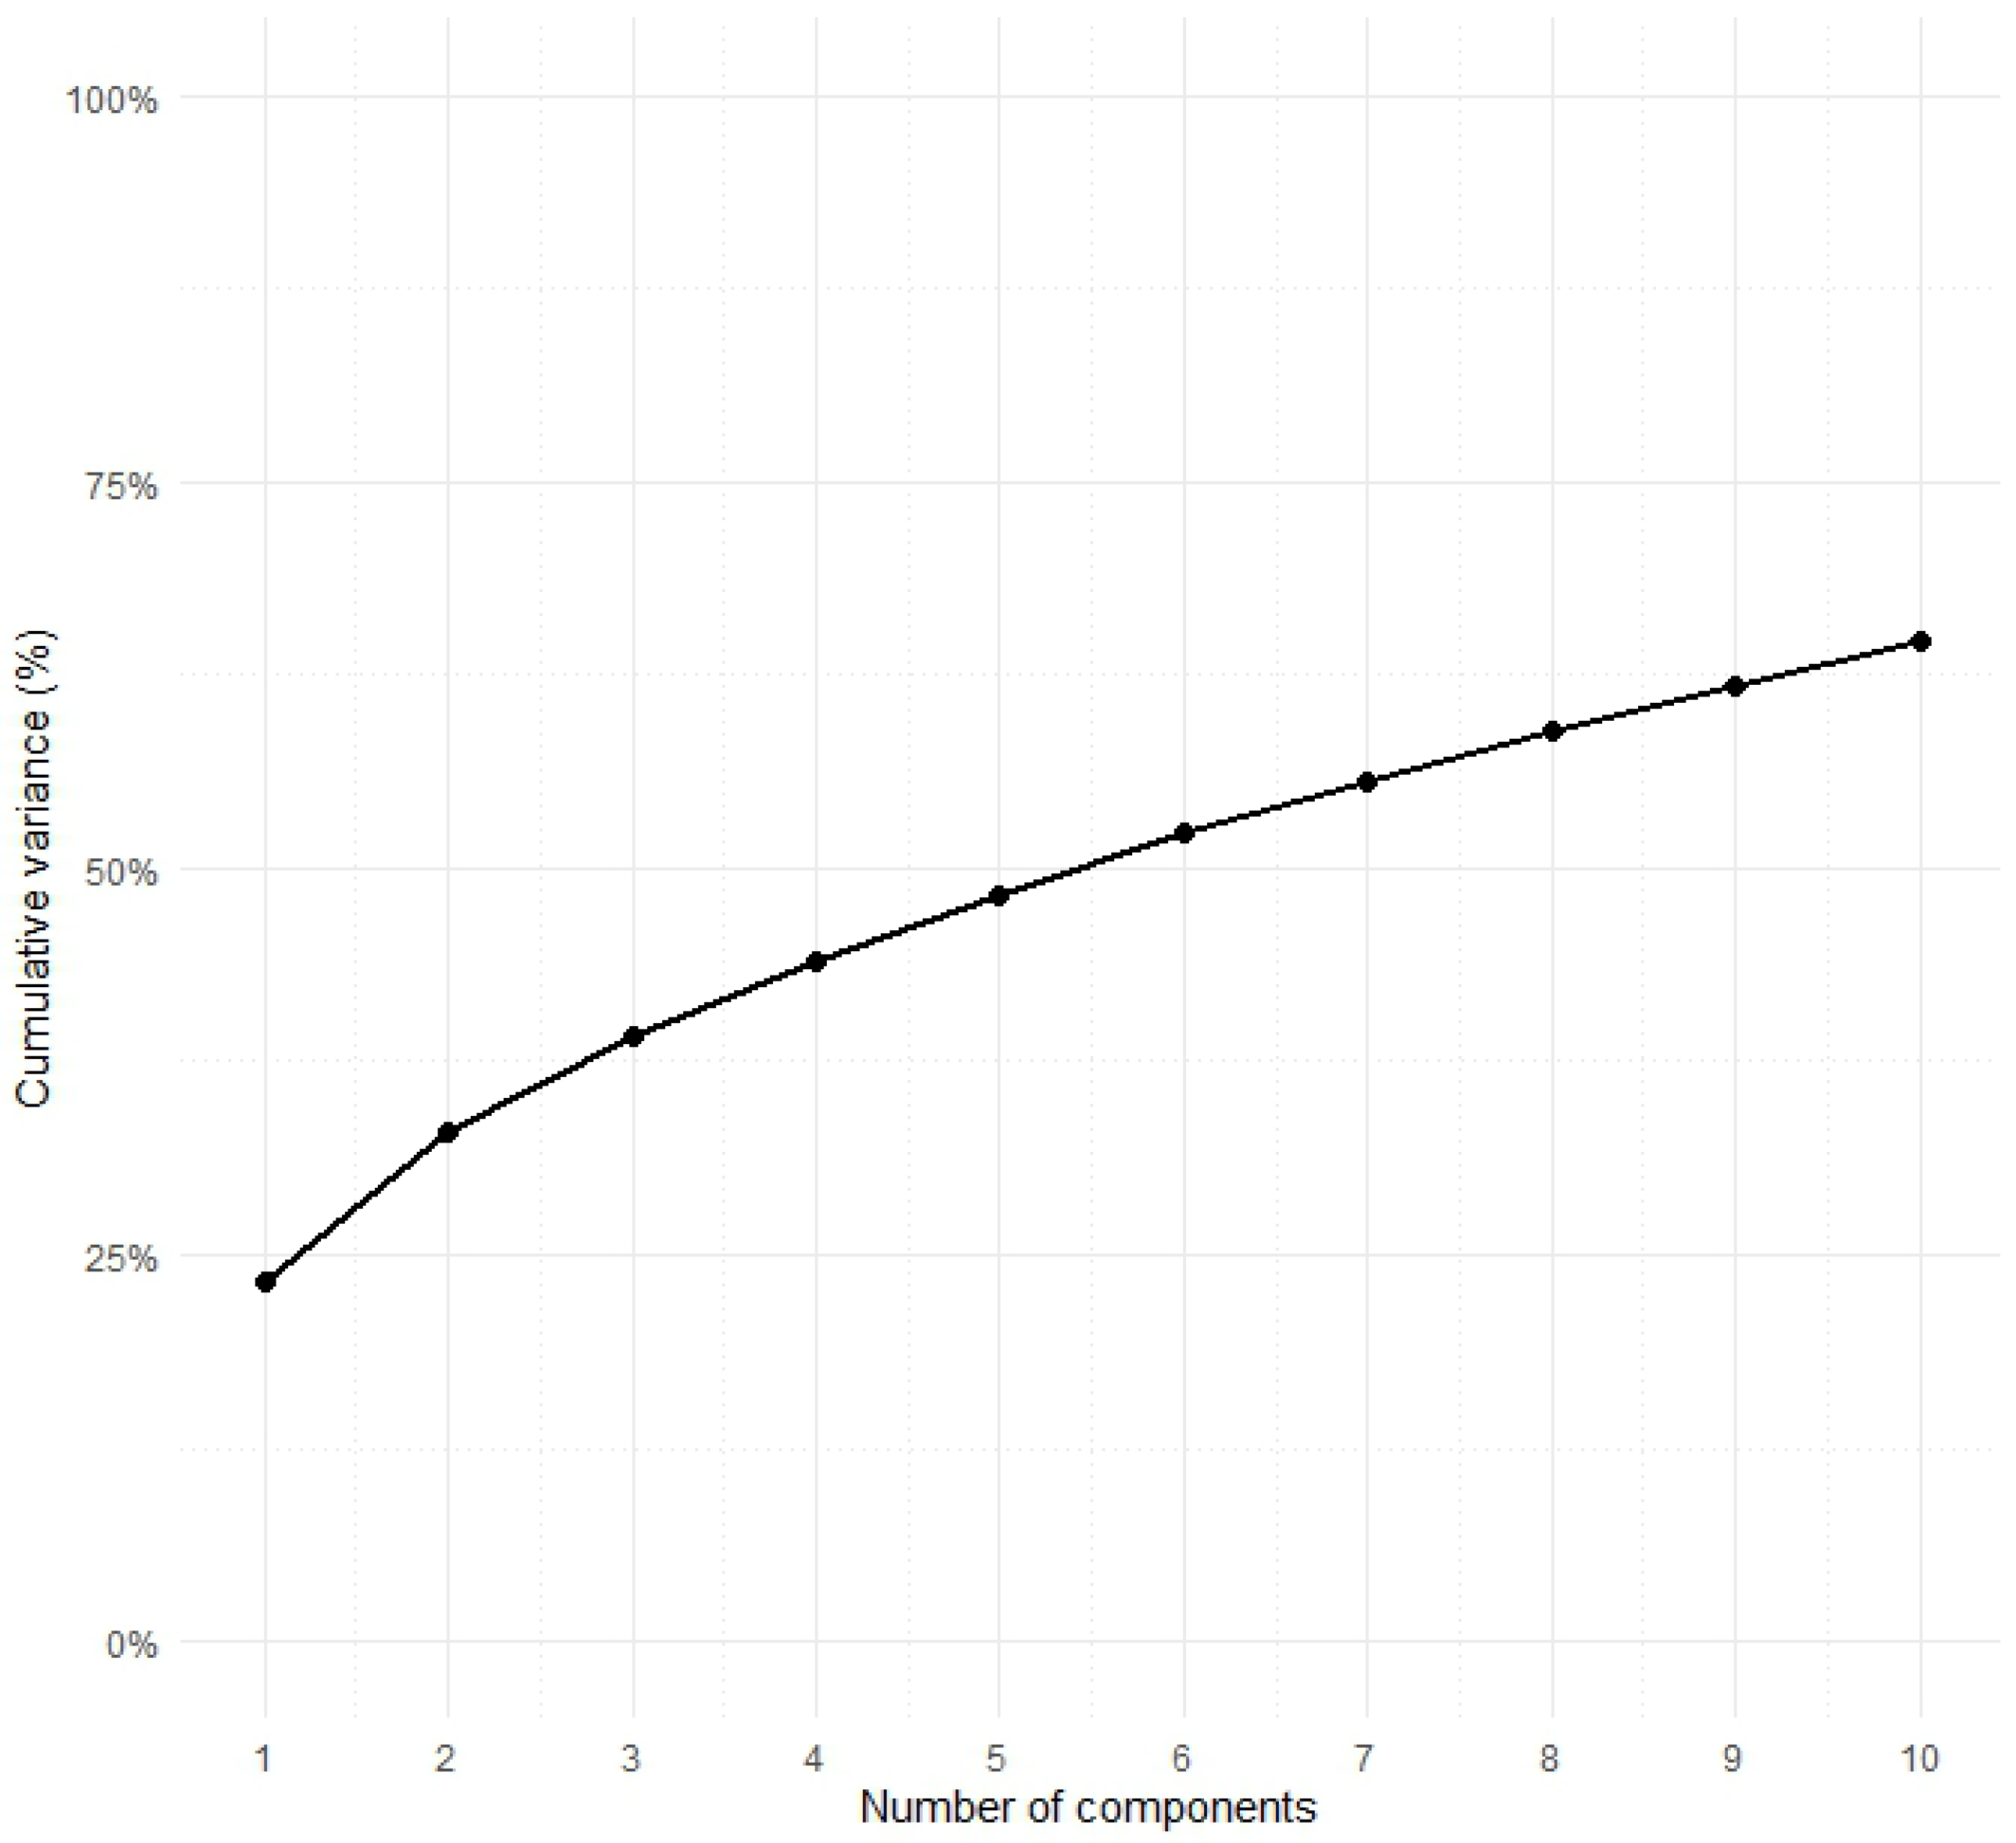
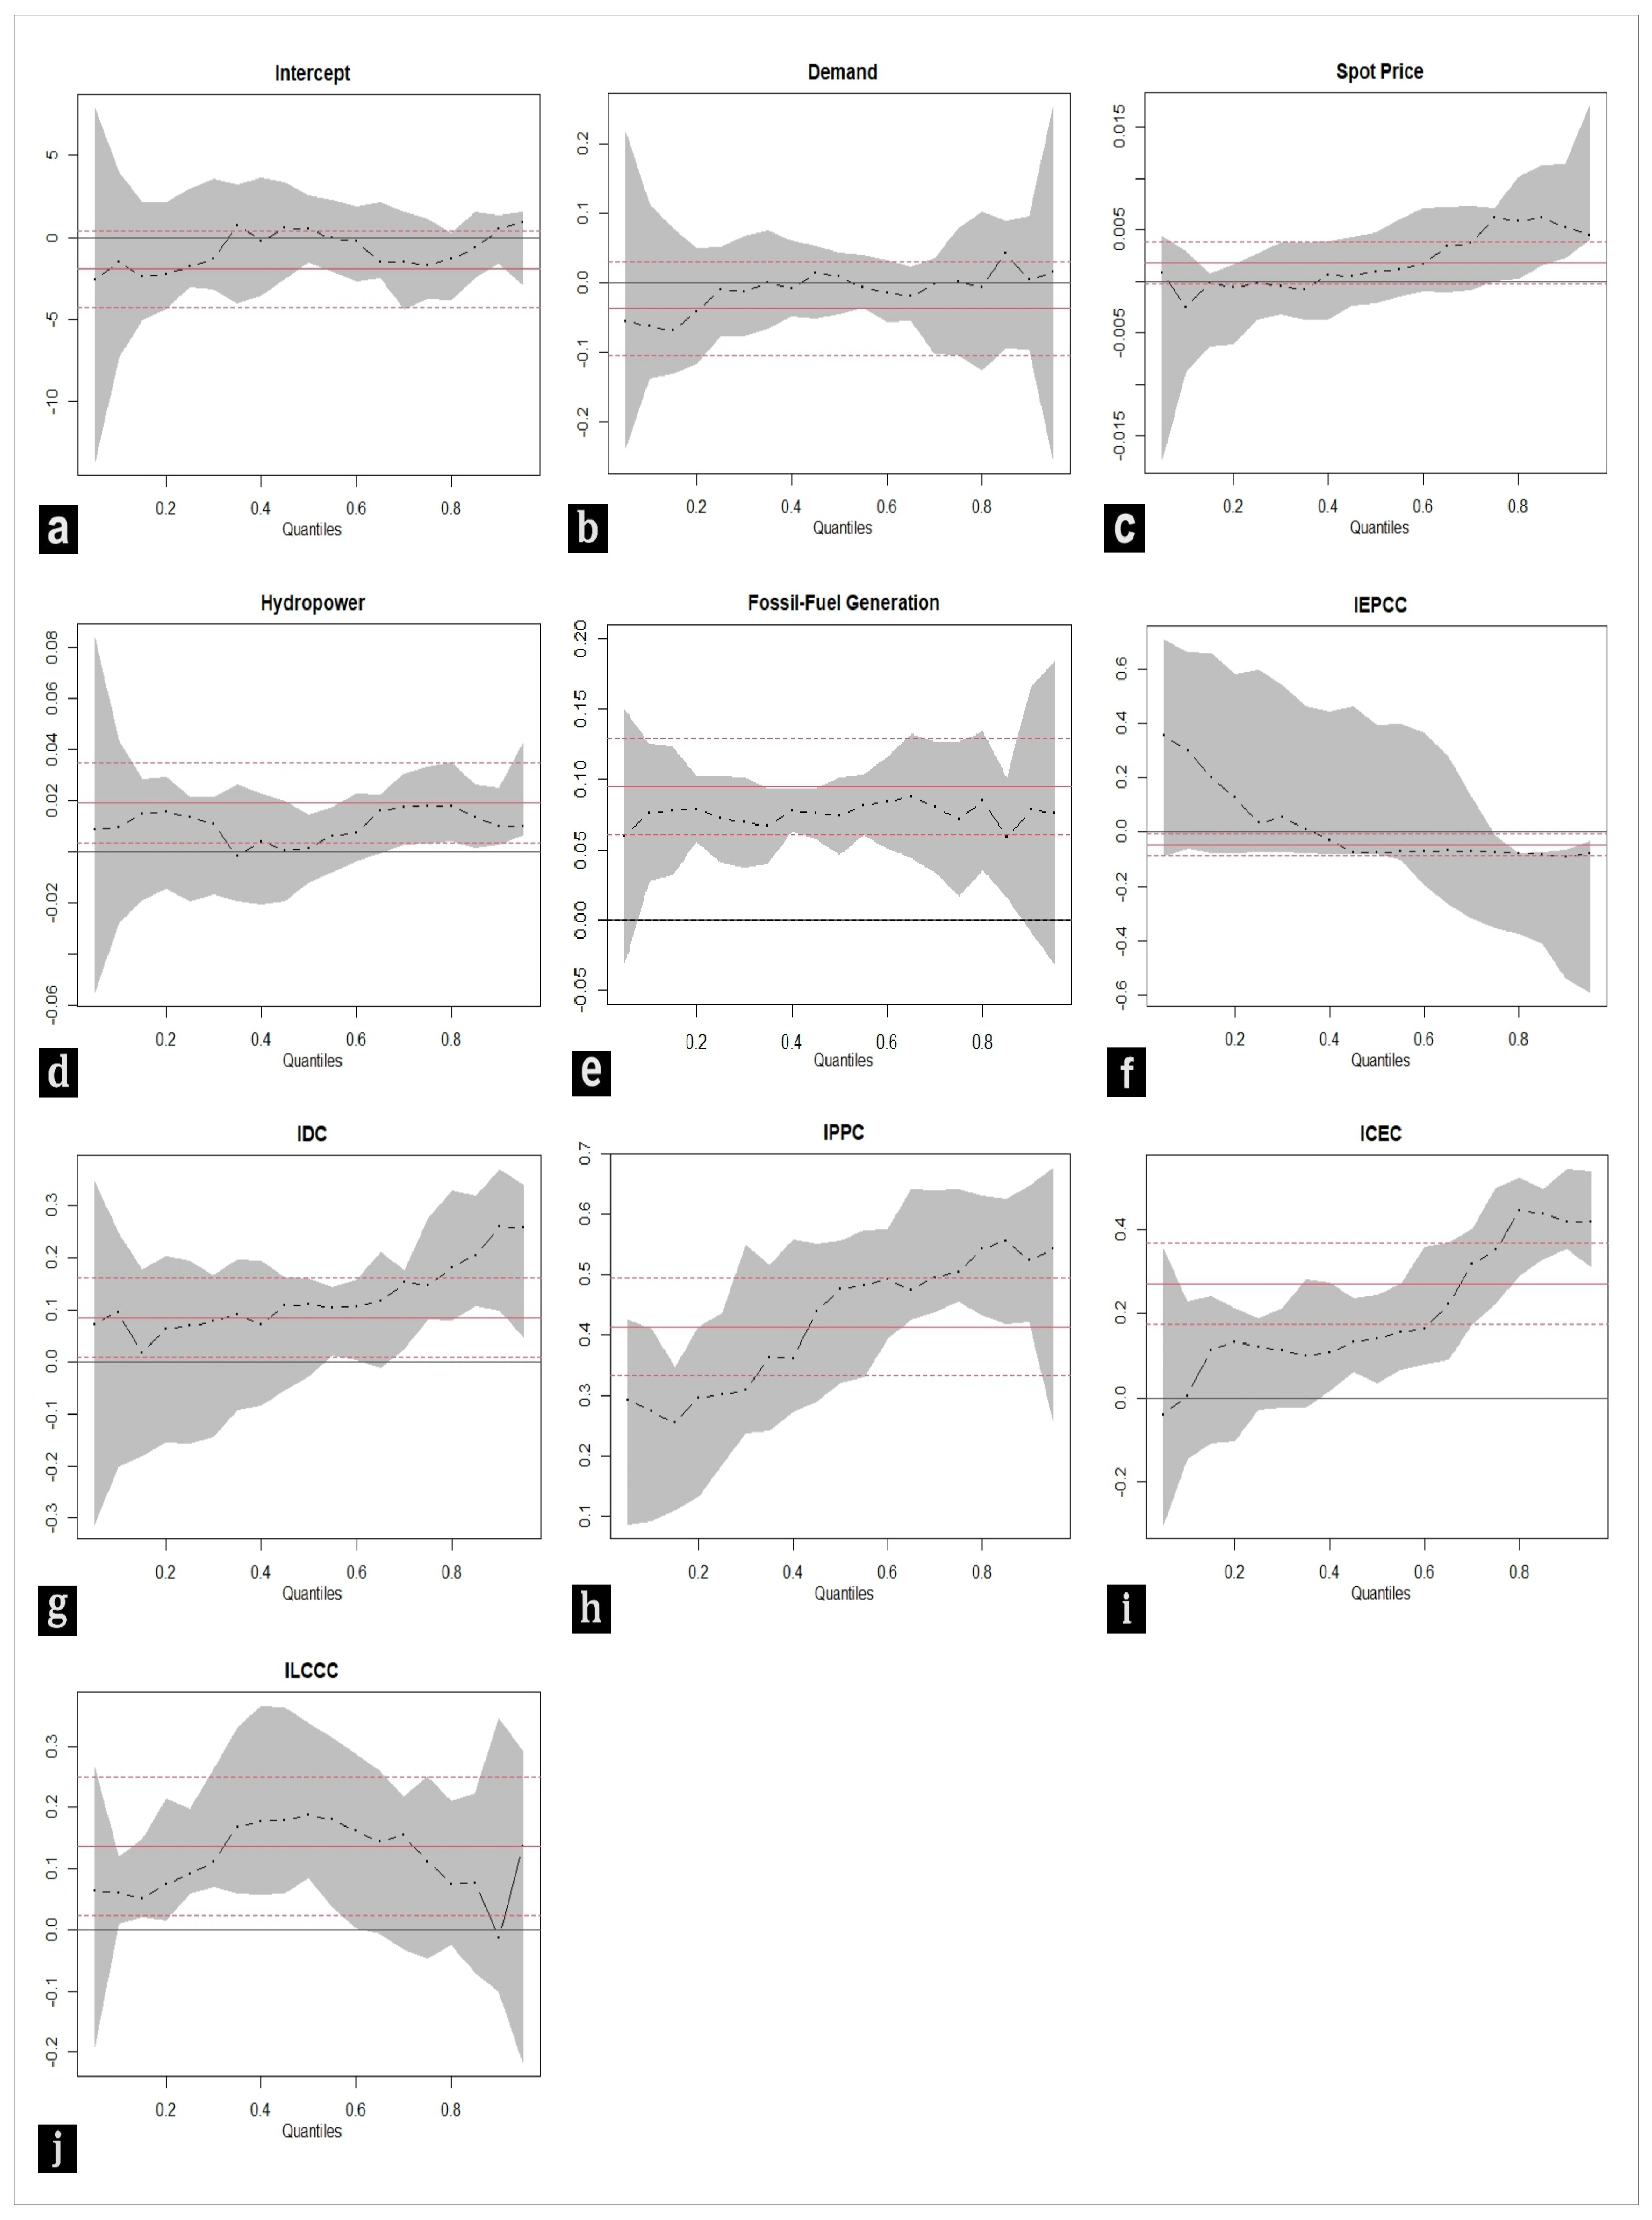
59]. Once the PCA methodology was applied, the components were obtained, and their cumulative explained variance is shown in
Figure 4. In this study, the number of components required to reach approximately 50% of the explained variance of the Colombian macroeconomic variables used in the analysis was selected [
60]. It was observed that, after the fifth component, the contribution of each additional component to total variability declined.
The variables contributing most strongly to each principal component were examined in order to assign an economically meaningful interpretation to each one. The first component is mainly associated with consumer prices, overall economic activity, and monetary liquidity; it was therefore labeled Economic and Consumer Price Indicators (IEPCC). The second component is represented primarily by unemployment measures and was labeled Unemployment Indicators (IDC).
The third component is dominated by Producer Price Index (PPI) measures and was labeled Producer Price Indicators (IPPC). The fourth component is associated with exchange-rate conditions, construction costs, and external-sector dynamics, and was labeled Exchange-Rate and Export Indicators (ICEC). Finally, the fifth component groups variables related to liquidity, the exchange rate, and activity in the construction sector, and was labeled Liquidity, Exchange-Rate, and Construction Indicators (ILCCC).
Table 5 presents the description of each variable, together with its acronym and the principal component to which it corresponds.
In this way, the linear quantile regression model can be written as a function of the response variable and its predictors as follows:
where
is the response variable and corresponds to the weighted-average price of contracts for the regulated market;
represents the spot price;
corresponds to electricity demand;
denotes hydropower generation;
denotes fossil-fuel generation; and
,
,
,
, and
correspond to the variables summarized through the principal components IEPCC (first component), IDC (second component), IPPC (third component), ICEC (fourth component), and ILCCC (fifth component), respectively.
For the estimation of this new quantile regression model, the full sample period was again used, from April 2009 to July 2021. The results are summarized in
Figure 5, and the quantile regression coefficients are reported in
Table A3 in
Appendix A.
The PCA-based quantile regression results show that electricity-market variables and macroeconomic components remain associated with the conditional structure of regulated contract prices in a heterogeneous way. Overall, panels (b)–(j) of
Figure 5 indicate that the technical variables of the system—spot price, hydropower generation, and thermal generation—continue to display differentiated patterns across the distribution, whereas the macroeconomic components exhibit effects that are uneven across quantiles and more dependent on the way the information is summarized. In panel (b), electricity demand remains non-significant across quantiles, which is consistent with the long-term and regulated nature of these contracts. In panel (c), the spot price again becomes relevant only in the upper quantiles, where increases in the spot price are partially associated with higher contract prices, a pattern that is consistent with episodes of greater system stress. In panels (d) and (e), hydropower and thermal generation continue to display non-uniform effects across the distribution, although the location of significance differs from the baseline specification.
The macroeconomic factors derived from PCA also display differentiated patterns. IEPCC (panel f), associated with consumer prices, aggregate economic conditions, and monetary liquidity, shows a negative and significant effect in the upper part of the distribution, suggesting that this broad macroeconomic dimension may be linked to some moderation of contract prices when these are already relatively high. IDC (panel g), linked to labor-market conditions, becomes more relevant in the right tail, indicating that labor-market stress may matter mainly under high-price regimes. IPPC (panel h), associated with producer prices, exhibits a positive and significant association across a broad part of the distribution, which suggests that production-cost conditions may be more visible under the PCA representation than under the autoencoder-based one. ICEC (panel i), related to exchange-rate conditions and external-sector dynamics, becomes significant from the middle quantiles onward and gains strength in the upper tail, reinforcing the idea that exchange-rate-related conditions may become more relevant when contract prices are already elevated. Finally, ILCCC (panel j), associated with liquidity, exchange-rate conditions, and construction activity, is more relevant in the middle part of the distribution and loses importance toward the upper tail, indicating a more localized association with contract prices.
Taken together, the robustness exercise suggests that the main qualitative message of the paper remains broadly stable across dimensionality-reduction methods, although not all coefficient paths replicate identically. In both specifications, demand remains weakly associated with contract prices, the spot price becomes more relevant in the upper tail, and the effects of hydropower, thermal generation, and macroeconomic conditions are concentrated in specific segments of the distribution rather than uniformly across quantiles. In that sense, the robustness analysis should be interpreted as showing broad consistency in the empirical narrative rather than exact equivalence between the autoencoder- and PCA-based representations.
The comparison between both approaches is also informative because it reveals that the estimated importance of some macroeconomic dimensions depends on how the information set is summarized. Autoencoders concentrate macroeconomic variation into factors that are mostly non-significant, except for the exchange-rate-related component under relatively high contract-price conditions. Under PCA, some components associated with producer prices, liquidity, and exchange-rate conditions become more visible in specific quantile ranges. Rather than invalidating the baseline specification, this suggests that broad macroeconomic influences are present in a non-uniform way and are more sensitive to representation choices than electricity-system variables, whose qualitative role is more stable across specifications.
These findings are consistent with regulatory instruments such as CREG Resolution 129 of 2019, Ministry of Mines and Energy Resolution 40590 of 2019, and the CREG tariff framework (2005), which establish regulated contracts as hedging mechanisms against spot-price volatility. The literature points in the same direction: ref. [
61] highlights the role of long-term contracts in tariff stability; Refs. [
46,
62] show that hydrology and thermal generation generate operational tensions, although these are dampened by the contractual regulatory framework; and ref. [
63] emphasizes that stability also arises from agents’ negotiation strategies. Taken together, the evidence suggests that, regardless of whether PCA (linear) or autoencoders (nonlinear) are used, regulated contract prices remain more consistently associated with electricity-system conditions and contractual arrangements than with broad macroeconomic influences. The latter do not disappear from the analysis, but their role appears more localized, representation-dependent, and uneven across quantiles.
The empirical findings offer several policy implications for the Colombian regulated electricity market. First, the fact that spot prices become relevant mainly in the upper quantiles suggests that short-term market stress is transmitted to regulated contract prices only under relatively high-price regimes. This supports the need for regulatory monitoring tools focused on upper-tail price behavior, especially during periods of hydrological stress, high thermal generation, or exceptional market conditions. Rather than treating average contract prices as the only relevant indicator, regulators could monitor distributional price indicators to detect when risk premia begin to accumulate in regulated contracts. Second, the limited and uneven role of the macroeconomic factors suggests that regulated contracts partially insulate final users from broad macroeconomic fluctuations. This is consistent with the stabilizing role of long-term contracting and tariff indexation mechanisms. However, the relevance of the exchange-rate-related factor in the upper part of the distribution indicates that external cost pressures may still matter when contract prices are already elevated. In this context, policy discussions on contract indexation should pay particular attention to imported-cost channels, especially those associated with fuels, equipment, and exchange-rate movements. Third, the localized effects of hydropower and fossil-fuel generation indicate that the hydro-thermal composition of the system remains relevant for contract-price formation, even if the regulated market does not fully mirror spot-market volatility. This suggests that procurement rules for regulated users should continue to encourage long-term hedging, technological diversification, and mechanisms that reduce exposure to hydrological and thermal backup risks. In practical terms, the results support policies aimed at improving the design of regulated-market auctions, strengthening risk-allocation mechanisms in bilateral contracts, and incorporating stress indicators into regulatory monitoring.
5. Conclusions
This study examined the price formation of regulated electricity contracts in Colombia over the period 2009–2021 using a quantile-regression framework that combines electricity-market variables with a reduced representation of macroeconomic conditions. By focusing on the conditional distribution of contract prices rather than on their average behavior alone, the analysis provides a more detailed view of how regulated prices are associated with different market conditions. The results show that these relationships are heterogeneous across quantiles. In particular, the spot price becomes relevant only in the upper tail of the distribution, where it appears to operate as an indicator of system stress and higher expected operating costs. Hydropower and thermal generation also display localized effects, suggesting that their role in contract pricing is not uniform across market conditions. By contrast, broad macroeconomic influences appear less stable and more uneven across quantiles, with the exchange-rate-related component standing out as the only factor that becomes clearly relevant under relatively high contract-price conditions.
Taken together, these findings suggest that regulated contract prices in Colombia are more consistently associated with electricity-system conditions and contractual arrangements than with broad macroeconomic fluctuations. This result is consistent with the regulated nature of the market, in which forward contracting, indexation rules, and risk-management practices help contain the direct transmission of short-run shocks to contractual prices. At the same time, the evidence does not point to a complete insulation of the regulated market from the broader economic environment. Rather, it suggests that macroeconomic conditions may still matter, but in a more localized and non-uniform way, especially when contract prices are already under relatively high-pressure regimes. In that sense, the paper contributes to the understanding of regulated electricity markets as environments in which stability is not absolute, but institutionally mediated through contractual design and market structure.
From a policy and market-design perspective, the results support the view that regulated contracts play an important stabilizing role in hydro-thermal electricity systems. The limited pass-through of spot-price volatility across most quantiles, together with the localized role of hydropower and thermal generation, suggests that the regulated segment is able to absorb part of the operational stress that characterizes the Colombian electricity market. For market participants, this reinforces the importance of long-term contracting as a mechanism for hedging risk and supporting tariff stability. For regulators, the findings highlight the relevance of preserving contractual and indexation frameworks that reduce exposure to extreme price conditions while maintaining incentives for reliability and efficient procurement.
Some limitations should also be acknowledged. First, the analysis is based on monthly data and on a reduced-form quantile specification, so the estimated coefficients should be interpreted as conditional distributional associations rather than as fully identified structural effects. Second, the macroeconomic factors obtained through dimensionality reduction summarize broad information sets, but they do not by themselves isolate precise transmission channels. Future research could extend this framework by incorporating dynamic specifications or higher-frequency data. This would make it possible to examine temporal adjustment mechanisms more explicitly and to analyze short-term responses during hydrological-stress episodes, regulatory changes, or crisis periods such as COVID-19. Such extensions would complement the present reduced-form distributional approach by providing a more detailed view of how regulated contract prices adjust over time.