
1. Introduction
Urbanization is accelerating, and the urban population is growing continuously. Urban rail transit, characterized by large capacity and high efficiency, has become an indispensable component of the modern urban public transport system [
1,
2,
3]. However, the accompanying energy consumption and environmental impact issues have grown increasingly prominent. Thus, the green and low-carbon operation of rail transit has emerged as a key problem that the industry urgently needs to resolve [
4]. As the energy artery of subway operations, the traction power supply system accounts for more than 50% of the subway’s total energy consumption [
5].
Traditional DC traction power supply systems are typically equipped with diode rectifier units (RU), enabling only unidirectional energy flow [
6]. When a large amount of regenerative energy generated by braking trains cannot be promptly absorbed by adjacent traction trains on the line, the catenary voltage will rise. Once the catenary voltage exceeds the threshold, the excess energy can only be dissipated as heat through braking resistors [
7]. This not only results in enormous energy waste but also increases the burden of tunnel ventilation and heat dissipation [
8]. Meanwhile, the severe catenary voltage fluctuations induced thereby pose a threat to the operational safety of both trains and the power supply system.
Two primary technical paths exist to enhance regenerative energy utilization and reduce system energy consumption: optimizing train operation strategies [
9,
10,
11] and adopting energy-saving equipment [
12,
13,
14]. For train operation strategy optimization, existing research focuses on two core dimensions: single-train energy-saving driving and multi-train timetable coordination [
15]. The former targets source reduction of traction energy demand. It optimizes the train’s speed-position trajectory and rationally schedules the timing of traction and coasting phases. The latter involves fine-tuning train headways or station dwell times. It achieves temporal overlap between the regenerative braking window of on-line trains and the traction current-taking window of adjacent trains [
16]. This enhances the real-time utilization of regenerative energy [
17].
However, such control methods are often subject to multiple rigid constraints in practical engineering. For instance, timetable formulation must first meet passenger flow demands across different time periods [
18]. This leaves extremely limited margin for energy-saving adjustments. Additionally, actual train operation is prone to uncertain disturbances. These include passenger flow fluctuations and temporary speed limits [
19]. As a result, maintaining the preset “traction-braking” coordination during long-term dynamic operation becomes challenging. This presents significant challenges to the precise implementation of optimization schemes.
Compared with the complex optimization of operation strategies, configuring energy-saving equipment in the traction power supply system offers a more direct solution. Current energy-saving equipment is mainly categorized into energy storage type [
20,
21] and energy feedback type [
22,
23,
24]. Ref. [
25] incorporates energy storage systems into the traction power supply system, thereby achieving large-scale and efficient utilization of regenerative braking energy. Ref. [
26] summarizes the applications of photovoltaic power in different types of traction power supply systems and analyzes critical issues such as power quality. Ref. [
27] enables energy-efficient operation of traction power supply systems with the integration of photovoltaic generation. Ref. [
28] puts forward a bi-level optimization model for the capacity configuration of photovoltaic-energy storage systems, which revises the system capacity parameters based on daily operational performance via an energy management strategy. Although on-board or ground-based energy storage devices can store regenerative energy through physical media, on-board energy storage significantly increases train weight and traction energy consumption [
29]. Ground-based energy storage, on the other hand, faces issues such as high construction costs and large floor space requirements. Meanwhile, capacity attenuation with the number of charge–discharge cycles is another major factor limiting its widespread application [
30].
Energy feedback type realizes bidirectional transmission between regenerative energy and the medium-voltage network by virtue of power electronic technology, with energy feedback devices and BCD being the research focuses at present. Ref. [
23] proposes a joint optimization method based on RU and energy feedback devices for the optimal design of traction power supply systems with RS. Ref. [
31] establishes an optimal siting and sizing model for traction power supply systems with RS, with the objectives of minimizing the investment cost of energy feedback devices and maximizing the utilization efficiency of regenerative braking energy. Ref. [
32] performs optimization on the siting and control parameters of BCDs in substations to minimize the daily average cost but only optimizes the siting and droop rate of BCD. In terms of planning models for traction power supply systems, two-stage planning models have been designed from the perspectives of the “N-1” and life-cycle cost optimization [
33]. In addition, integrated planning models suitable for traction power supply systems have been constructed by combining multi-energy systems including electricity, gas, heat, and photovoltaic power [
34]. Meanwhile, intelligent optimization algorithms such as the improved genetic algorithm [
31], dual-population fusion algorithm [
32], and grey wolf optimizer [
35] have been widely adopted in the planning and operation of traction power supply systems, owing to their advantages of requiring no model linearization and possessing strong global search ability.
Unlike energy storage equipment, BCDs do not require additional energy storage media and can directly achieve real-time energy conversion and transmission, enabling energy sharing between substations [
36,
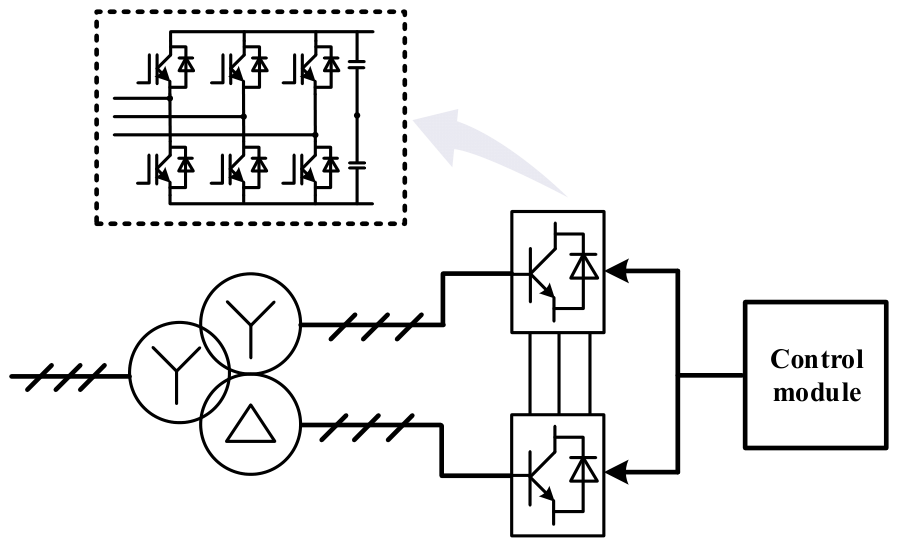
37]. The core component of the BCD is a three-phase voltage-source PWM rectifier. Due to its limited individual power rating, it cannot directly replace megawatt-level RU. Therefore, capacity-upgrading techniques are required in practical engineering applications. Three-level topologies and power device paralleling can be adopted to equivalently increase the converter capacity. However, three-level topologies introduce higher structural complexity and potentially compromise system reliability. Direct device paralleling tends to cause severe circulating currents that degrade operational stability. At present, the scheme based on paralleling with isolation transformers is widely adopted, as shown in
Figure 1.
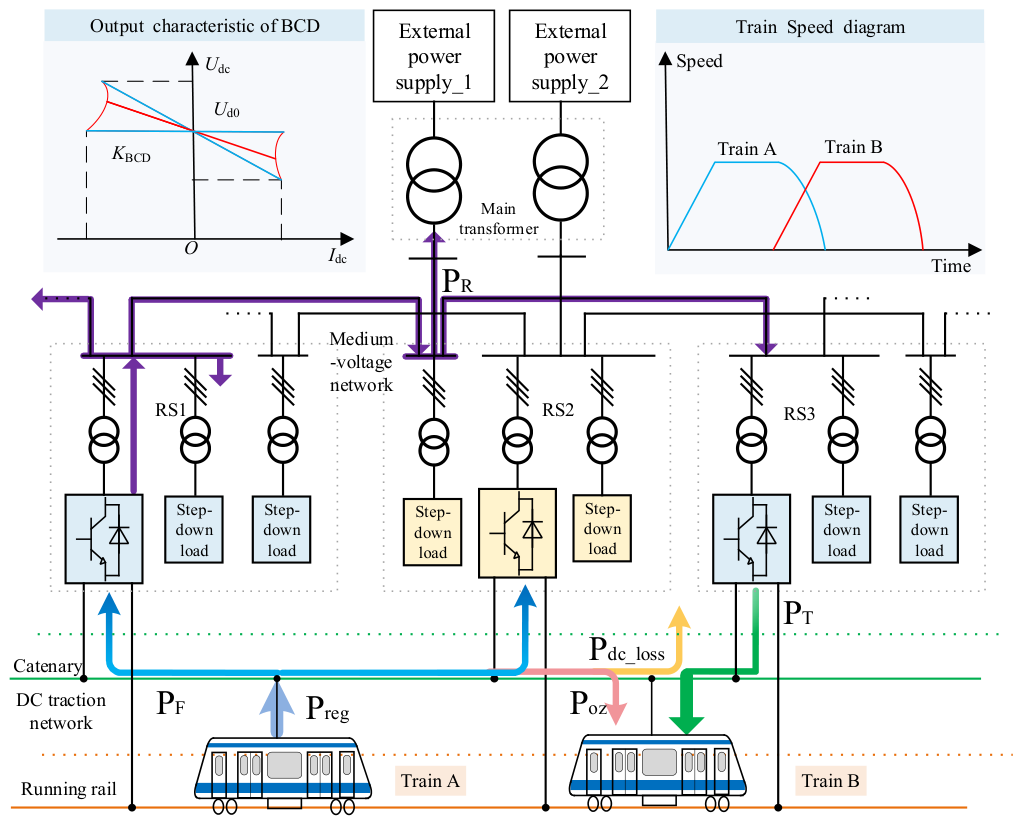
To clearly illustrate the operating mechanism of the BCD-equipped RS system,
Figure 2 presents the architecture and energy flow diagram of the BCD-equipped RS traction power supply system.
As shown in
Figure 2, with the introduction of BCD, the traditional unidirectional DC power supply network is transformed into a “source-network-train” coupled system with bidirectional energy flow capability. When train A on the line operates in braking mode and generates regenerative power
Preg, this energy is first transmitted via the DC catenary to supply adjacent traction train B. Regenerative energy not absorbed by adjacent trains can flow into traction substations equipped with BCD. Taking RS1 as an example,
PF denotes the feedback power flowing into RS1. Through the inversion technology of BCD, this DC energy is converted into AC power after accounting for partial equipment losses. This portion of energy can be utilized by other traction substations, station loads, lighting loads, etc., via the medium-voltage network. If the feedback energy cannot be fully absorbed, it may also flow back to the main substation
PR, i.e., be fed back to the power grid. Energy fed back to the power grid is regarded as ineffective energy and cannot reduce cost.
Furthermore, the efficient operation of BCD relies on a droop control strategy [
38], as depicted in the output characteristic curve at the top-left corner of
Figure 1. The core principle is to establish a linear correlation between voltage and output current by setting the no-load voltage and droop rate. Specifically, when the catenary voltage is lower than
Ud0, the converter operates in the rectification droop region, where the output current increases linearly with decreasing voltage to provide traction energy for trains. When the voltage is higher than
Ud0, the converter switches to the inversion droop region, where the output current increases linearly with increasing voltage to feed regenerative energy back to the medium-voltage network [
39]. However, existing studies often assume that converters have infinite capacity or ideal linear characteristics during modeling, ignoring the operational constraints of actual physical equipment. In reality, when the system power flow demand exceeds the rated capacity of the device, the control strategy of the BCD is forced to switch from the linear region to the constant power region.
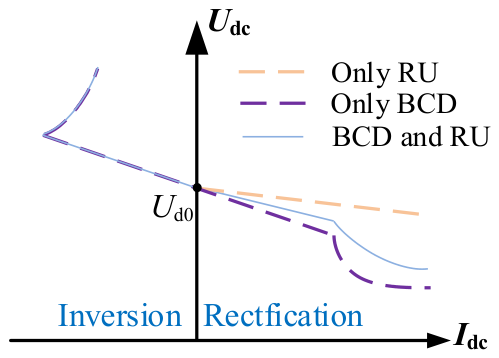
In systems where traditional diode RUs coexist with BCD, the BCDs operate in parallel with RU. Under normal traction conditions, both RUs and BCDs supply power to the DC network. During regenerative braking, when the catenary voltage rises, the BCDs operate in inversion mode to feed excess energy back to the medium-voltage network, while the RUs remain inactive due to their unidirectional power flow characteristic. This cooperative operation ensures seamless integration with legacy setups without requiring additional control. When the no-load voltage of the RU is equal to that of the BCD, the output characteristic of the traction substation is shown in
Figure 3.
Despite the significant advantages of BCDs, their high initial investment cannot be overlooked [
40]. Affected by line gradients, station spacing, and traffic density, regenerative energy exhibits a distinct spatial heterogeneous distribution along the line. Blindly configuring BCDs uniformly in all substations maximizes the energy-saving rate. However, it inevitably leads to unbalanced equipment utilization. This drastically increases the LCC. Additionally, there exists a non-linear coupling between the site selection of RS and characteristic parameters of BCD: location and capacity determine the potential for energy recovery, while parameter configuration dictates the actual recovery efficiency and voltage stabilization effect. Although existing studies have explored converter parameters, there remains a lack of a comprehensive optimization method that can simultaneously consider equipment capacity determination, site selection, and control parameter coordination. Such a method is essential to achieve the optimal comprehensive system benefits at the minimum economic cost while ensuring the safe operation of the system.
Most existing studies have focused on the siting and capacity configuration of RS equipped with energy feedback devices, while research on the optimization of RS with BCD—advanced power electronic equipment capable of bidirectional power regulation for rectification and inversion—remains scarce. In addition, most existing studies target the renovation of existing lines, where traditional RUs still operate in parallel with energy feedback devices. As a high-performance power electronic device, BCD can realize both rectification and inversion simultaneously and offers significant advantages in energy utilization efficiency, DC-side voltage fluctuation suppression, and rail potential limitation [
41]. Most existing studies focus on the retrofitting of existing lines and only optimize the siting and droop rate of BCD without considering the capacity sizing of BCD. Furthermore, there are few studies involving the coordinated optimization of both the no-load voltage and droop rate of BCD under different headways. Therefore, this paper focuses on newly built urban rail transit lines and adopts a traction power supply architecture consisting exclusively of BCD with no traditional RU. Planning-level decisions are made regarding the siting of RS and the capacity configuration of BCD. Meanwhile, the no-load voltage and droop rate of BCD are optimized at the operation level under different headways, thereby achieving deep coordination between planning and operation. The main contributions of this paper are summarized as follows:
A two-layer optimization model is constructed, where the upper-level objective is to minimize the LCC, and the lower-level objective is to minimize the annual operating cost. At the upper layer, the model makes discrete decisions on the site selection of RS and the capacity of BCD. At the lower layer, it continuously optimizes the control parameters of the devices for different departure intervals. A closed loop is formed through iterative feedback, realizing a comprehensive trade-off between initial investment costs and long-term operational benefits.
Aiming at the mixed variable types and non-convex nature of the optimization model, ISSA is proposed as a unified solver. The improvement measures include population initialization based on Tent chaotic mapping to enhance global exploration capability and the introduction of the Levy flight strategy to enhance the global exploration capability. The superiority of the improved algorithm is verified through standard test functions.
Comparative experiments and result analyses were conducted on a real-world subway engineering case, which validates the effectiveness of the proposed method in reducing the LCC, decreasing the system’s operating energy consumption, and maintaining power supply reliability.
The rest of this paper is organized as follows. The two-layer optimization model is described in detail in
Section 2.
Section 3 presents the improved optimization algorithm and its performance tests. In
Section 4, the problem is addressed and discussed based on the data from an actual subway line. Finally, conclusions are drawn in
Section 5.
2. Two-Layer Optimization Model of the BCD-Equipped RS Traction Power Supply System
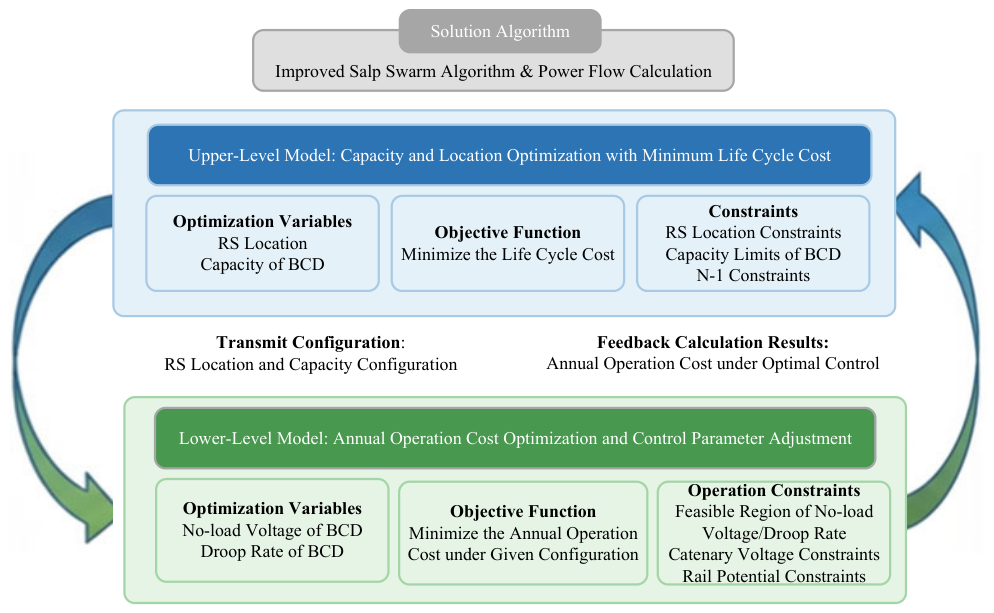
This section establishes the two-layer coordinated optimization model as illustrated in
Figure 4. Adopting a leader–follower game logic, this model decouples the problem into two subproblems: the upper-layer planning subproblem and the lower-layer operation subproblem.
The upper layer serves as the leader layer. Its global objective is the minimization of the system’s LCC. Its decision variables are discrete. On the premise of satisfying constraints such as the N-1 operating condition, it determines the optimal configuration scheme for the installation sites and rated capacities of BCD in the traction power supply system and transmits this scheme to the lower layer.
Acting as the follower layer, the lower layer targets the minimization of the annual operating energy consumption cost, based on the configuration scheme transmitted by the upper layer. This layer mainly deals with continuous decision variables: through AC-DC hybrid power flow calculation, it optimizes the no-load voltage and droop rate of the devices. While ensuring that the catenary voltage and rail potential remain within their safe thresholds, it feeds back the optimal operating cost to the upper-layer model.
The upper and lower layers form an iterative interaction until the LCC converges to an optimal stable value, thereby achieving the coordinated optimization of BCD configuration and control parameters and realizing the optimization of the system’s long-term comprehensive benefits.
2.1. Upper-Level Model
The upper-level model optimizes traction station locations and BCD capacities to minimize LCC, as shown in Equation (1).
where
is as shown in Equation (2).
is defined as the position of the i-th station, and L is the total line length. is defined as the siting decision variable for the i-th traction substation, where 1 represents being selected. is defined as the capacity of BCD at the i-th traction substation, meaningful only at . are the lower and upper limits for capacity.
Furthermore, represents the civil engineering cost for traction or step-down substations. represents the investment cost for BCD in traction substations. represents the annual maintenance cost of the system, and represents the annual operating cost of the entire system.
where N is the number of stations in the system.
is the civil engineering cost for a single traction substation.
is the civil engineering cost for a single step-down substation. b is the discount rate.
is the entire project cycle. The term
represents the capital recovery factor (CRF), which is used to convert the total one-time civil engineering investment into equivalent annual costs over the project lifecycle.
where
is the base cost of BCD.
represents the unit capacity cost of BCD.
is the service life of the BCD. Similarly, the factor
is the CRF, applied to annualize the initial BCD investment cost over its service life, aligning the cost accounting with the time value of money.
where
is the maintenance cost per unit capacity for BCD.
- 4.
System Annual Operating Cost;
denotes the output power of the traction substation,
represents the feedback power of the traction substation, and
stands for the power fed back to the power grid through the main substation.
is difficult to utilize by the power grid, so this portion of energy is regarded as ineffective energy and cannot reduce the cost of the system. The instantaneous power consumed by the traction power supply system at time t, denoted as
can be derived. The energy consumption at a headway of T is
W, as shown in Equation (6) [
42].
where M denotes the number of distinct headways.
represents the system energy consumption for the respective headway.
stands for the annual operating hours corresponding to the respective headway, and
denotes the electricity tariff per kilowatt-hour.
- 5.
Upper-Level Model Constraints;
where
represents the set of selected traction Station positions.
is the set of all station positions.
are the upper and lower limit capacity constraints of BCD, and considering the standardized selection of power equipment, it is ensured that the selected capacity is the specification available in the market. The capacity of BCD is selected as an integer multiple of 1000 kVA within the upper and lower limit range.
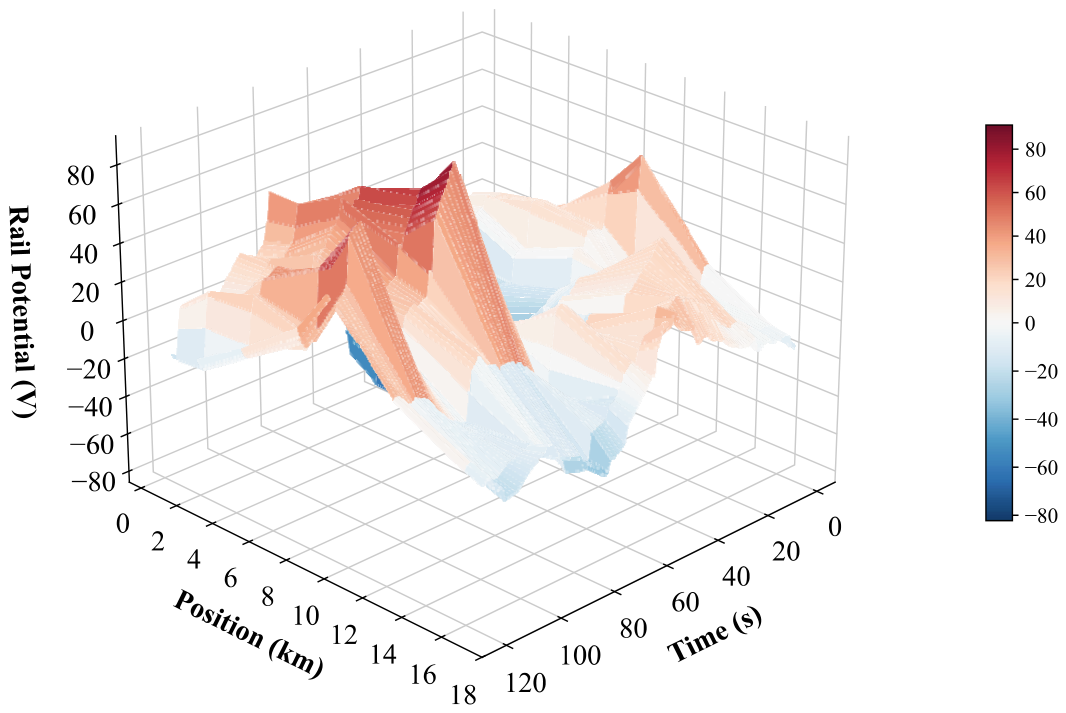
In traction power supply systems, the rail serves as the return path for traction current. Due to its inherent impedance and the influence of stray currents, a ground potential difference is generated, known as rail potential. Excessively high rail potential can pose risks to personnel safety, damage equipment insulation, and accelerate corrosion of nearby metal structures caused by stray currents. An upper limit must be imposed on rail potential under normal operating conditions to ensure it does not exceed the safety threshold, thereby guaranteeing the operational safety and reliability of the system.
where
are the rail potential at any time t, and
is the maximum allowable value of the rail potential.
In the planning and design of the traction power supply system, the “N-1” safe operation criterion must be satisfied. This criterion specifies that if any traction substation in the system fails and is out of service, the remaining substations shall have sufficient power supply capacity. They shall compensate for the power support lost due to the fault. This ensures the catenary voltage along the entire line is consistently maintained within the allowable range. It also guarantees the continuous and reliable operation of trains under various operating scenarios.
where
represent the catenary voltage at any time t after the p-th traction station exits operation, and
is the safe range of the catenary voltage.
2.2. Lower-Level Model
The configuration scheme provided by the upper-layer model is input to the lower-layer model. Based on the operating characteristics of BCD, the lower-layer model reduces the system’s energy consumption by optimizing the droop rate and no-load voltage for different headways, thereby finding the optimal annual operating cost. Accordingly, the mathematical description of the lower-layer model is as follows:
where
and
are shown in the following formula:
is the no-load voltage of BCD in the i-th traction substation, and
denotes the droop rate of BCD in the i-th traction substation, while Z represents the total number of traction substations. Each control parameter must be adjusted within the engineering feasible range. Accordingly, the constraints on the decision variables of the lower-layer model are as follows:
where
and
represent the maximum and minimum values of the no-load voltage, and
is the maximum value of the droop rate.
Similarly, in the lower-level model, it is also necessary to ensure that the rail potential and the catenary voltage meet the safety operation constraints.
where
represents the values of the catenary voltage at any time t under normal operating conditions.
3. ISSA-Based Solution Strategy
The upper-layer decision variables include the location and capacity of traction substations, both of which are discrete variables. The upper layer transmits the configuration information of traction substations to the lower layer. Based on the configuration of traction substations and different headways, the lower layer obtains the optimal control parameters of BCD in each traction substation, so as to achieve the objective of minimizing the annual operating cost. The involvement of power flow simulation introduces nonlinearity and non-convexity into the problem. Therefore, ISSA and traction power supply system power flow simulator are adopted to solve the optimization model.
3.1. Improved SSA Algorithm
Salps are transparent barrel-shaped marine invertebrates that move and forage in a chain-like structure in the deep sea. Based on this biological behavior, scholar Seyedali Mirjalili et al. proposed the salp swarm algorithm (SSA) [
43], which simulates the swarming behavior of salps during navigation and foraging in the ocean. When establishing the mathematical model, the salp swarm is divided into leaders and followers. Leaders are located at the head of the salp chain, responsible for global exploration and moving toward the food source. Followers move following the leaders, undertaking local exploitation to perform refined search around the leaders.
The leader’s position update formula is as follows:
where
denotes the position of the i-th leader in the j-th dimension at the t + 1 iteration,
represents the position of the food source, and
are the upper bound and lower bound in the j-th dimension, respectively. The control parameters
are random numbers generated within the interval
. The formula for calculating
is given as follows:
where
denotes the maximum number of iterations. The position update of the followers is given as follows:
To enhance the search capability of the SSA, avoid falling into local optima, and explore a broader search space, this paper incorporates population initialization based on the Tent map and the Levy flight strategy into the SSA, aiming to improve the algorithm’s search performance.
Pseudorandom number generators (PRNGs) are the primary method for generating initial populations in most swarm intelligence algorithms, capable of covering promising regions in the search space [
44]. A chaotic number generator is a type of random number generator based on chaotic technology; chaotic maps can replace pseudorandom number generators to generate chaotic numbers with inherent chaotic characteristics. Population initialization using chaotic sequences influences the entire process of the algorithm [
45]. The Tent chaotic map exhibits excellent traversal uniformity and high sensitivity to initial values. It can efficiently cover all regions of the solution space without redundant traversal. Its topological mixing property generates a well-distributed, highly diverse initial population in the early iteration stage. This prevents individuals from clustering in local areas. It lays a solid foundation for subsequent global search. In this paper, the population is initialized based on the Tent chaotic map, whose mathematical expression is given as follows:
where
and is the chaotic parameter. The larger the
is, the more chaotic the system will be. It is set as 2.
is the chaotic sequence in [0,1].
- 2.
Levy Flight Strategy
The Levy flight strategy is a type of random walk strategy that simulates the non-Gaussian random walk pattern adopted by certain organisms in nature during foraging or migration [
46]. Its step size distribution follows the Levy distribution, characterized by the alternation of short-distance and long-distance step sizes, and it is a probability distribution with heavy-tailed characteristics [
47]. Benefiting from its heavy-tailed step distribution, the Levy flight performs frequent small-scale local exploitation with high probability, while generating rare long-distance jumps with a certain probability. This mechanism allows the algorithm to escape from local optima through large mutation steps once trapped in a limited region and quickly moves toward unexplored areas in the solution space. Thus, it effectively balances local exploitation and global exploration and strengthens the ability to jump out of local optimal solutions. The mathematical expression of the Levy flight strategy is as follows:
where
is a normally distributed random number following
, and
is a normally distributed random number following
.
, the smaller its value, the heavier the tail of the distribution, the higher the probability of extremely large step sizes, and the more dispersed the distribution. The commonly used value
can achieve a good balance between exploration (large jumps) and exploitation (small-step movements). After introducing the Levy flight strategy, the updated position formula for the leaders is given as follows:
The procedure of ISSA is as follows:
- (1)
Population Initialization Based on the Tent Map: Initialize a salp swarm based on Equation (19) and the upper/lower bounds.
- (2)
Calculate Initial Fitness: Compute the fitness value of each individual in the salp swarm.
- (3)
Select the Food Source: Sort the salp swarm according to the magnitude of fitness values and set the position of the top-ranked individual as the current food source position.
- (4)
Select Leaders and Followers: After determining the food source position, regard the first half of the sorted swarm as leaders and the second half as followers.
- (5)
Position Update: Update the positions of leaders using Equation (20) improved by the Levy flight strategy, and update the positions of followers using Equation (17).
- (6)
Re-calculate Fitness: Compute the fitness of the updated swarm. Compare the fitness value of each updated salp individual with that of the current food source to redetermine the food source position.
- (7)
Repeat Steps (4)–(6) until a certain number of iterations is reached or the fitness value meets the required standard. Finally, output the current food source position as the estimated position of the target.
3.2. Comparison of Optimization Methods
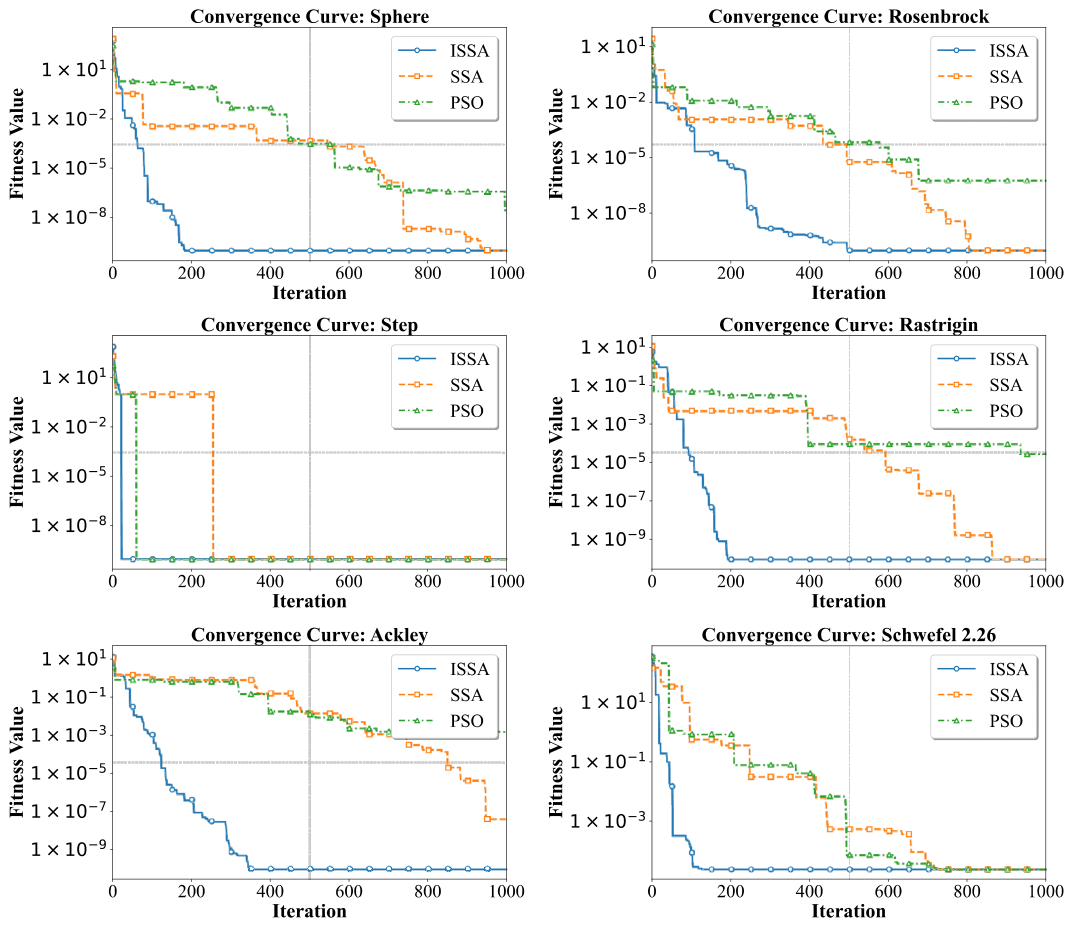
To evaluate the performance of the ISSA, this paper conducts a comparative analysis of the search capability and iteration speed of the ISSA, SSA, and PSO. Specifically, 3 unimodal functions and 3 multimodal functions are selected as the test benchmark functions. The test benchmark functions are listed in
Table 1, and the test results of different algorithms on these benchmark functions are presented in
Figure 5 and
Table 2. The mean value and variance are calculated using the fitness value obtained from the last 100 iterations of the algorithm. The convergence iteration count refers to the number of iterations required for the value of the objective function to reach 10
−3.
Unimodal functions are mainly used to evaluate the computational accuracy and convergence speed of the algorithm, while multimodal functions are mainly adopted to assess its global optimization capability. The results of numerical experiments show that ISSA outperforms the other two algorithms in terms of mean value, variance, and convergence speed.
3.3. Optimization Process
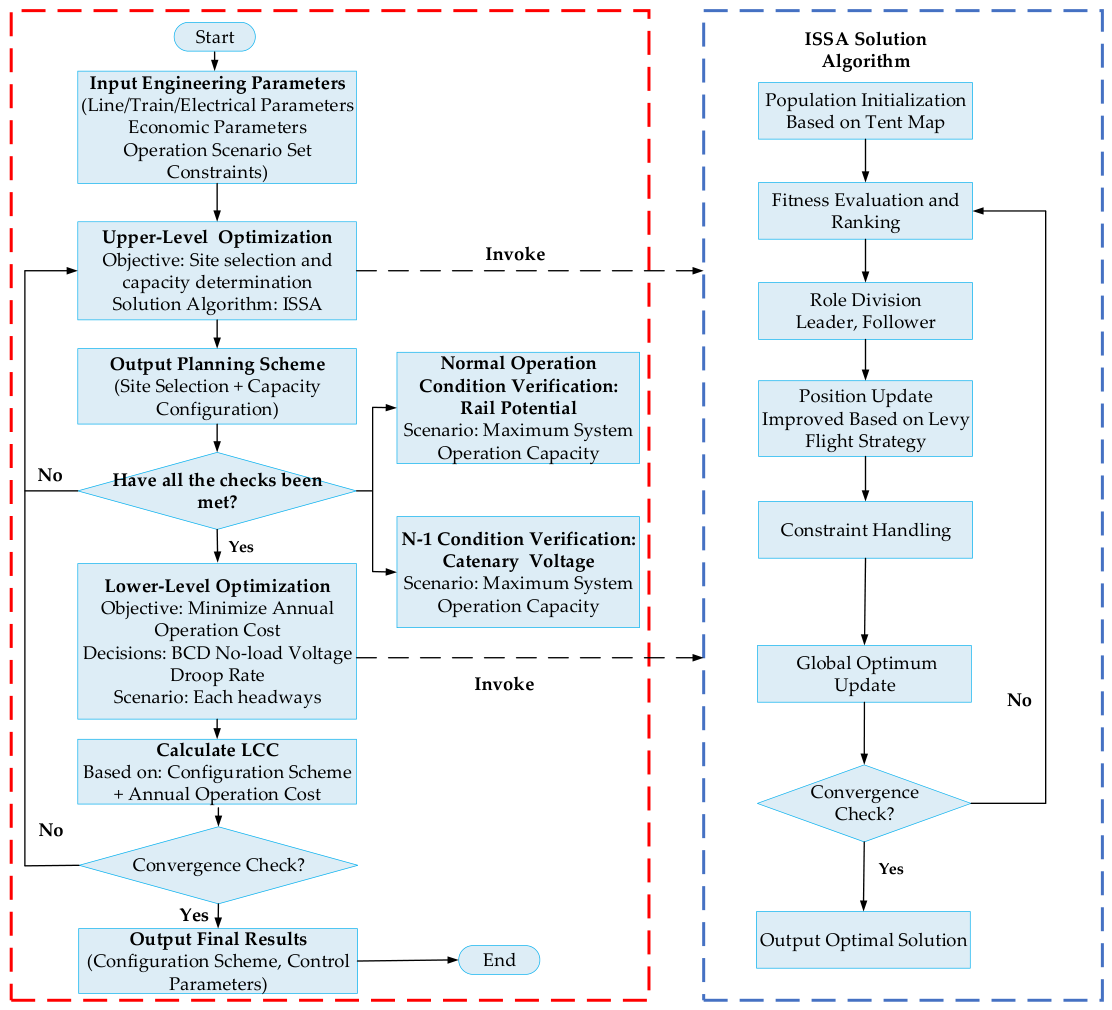
To achieve the coordinated optimization of configuration and control and ensure that the proposed scheme satisfies the operational constraints under both normal and fault operating conditions, this paper constructs a two-layer closed-loop solution process as illustrated in the figure below. This process takes LCC as the upper-layer evaluation index and regards the minimization of annual operating cost as the lower-layer optimization objective. It adopts ISSA as the unified solver and finally outputs the configuration scheme with the minimum life-cycle cost, as well as the optimal control parameters for each departure interval under this configuration scheme. The process is shown in
Figure 6.
The main steps are as follows:
Step 1: First, input the basic parameters of the line and trains, and define the operation scenario set, constraints, and boundaries.
Step 2: In the upper-level model, the ISSA algorithm is invoked, with the upper-level iteration number set as I and the population size as K, to generate an initial planning scheme that includes station selection and capacity configuration.
Step 3: For the planning scheme, verify the rail potential under normal operating conditions and the catenary voltage under N-1 operating condition, in accordance with the system’s maximum operational capacity. Discard the planning scheme if the verification fails; proceed to the next step if the verification is passed.
Step 4: Based on the validated planning scheme, with the objective of minimizing the annual operation cost, the ISSA algorithm is invoked again, where the lower-level iteration number is set as G and the population size as P. The control parameters of BCDs for each headway are subsequently optimized.
Step 5: Calculate the LCC based on the planning scheme provided by the upper layer and the minimum annual operating cost obtained by the lower layer, then judge whether the maximum number of iterations has been reached. If not, return to Step 2; if yes, output the optimal planning scheme and the corresponding control parameters.