Article

Empowering Consumers within Energy Communities to Acquire PV Assets through Self-Consumption

1
Department of Smart Grids, Fraunhofer Institute for Solar Energy Systems, 79110 Freiburg, Germany
2
Department of Business & Information Systems Engineering, University of Bayreuth, 95447 Bayreuth, Germany
*
Author to whom correspondence should be addressed.
These authors contributed equally to this work.
Electricity 2022, 3(1), 108-130; https://doi.org/10.3390/electricity3010007
Submission received: 11 January 2022 / Revised: 16 February 2022 / Accepted: 21 February 2022 / Published: 26 February 2022

Abstract

:
The use of photovoltaic energy (PV) and the involvement of residents within energy communities are becoming increasingly important elements of decentralized energy systems. However, ownership structures are still too complex to empower electricity consumers to become prosumers. We developed a token-based system of the gradual transfer of PV ownership rights, from the initial investor to residential and small-scale commercial consumers. To demonstrate the system, we set up a simulation of a 27-party mixed usage building with different load profiles, ranging from single student apartments to office units with battery electric vehicles, in a German energy community. As a result, we show that the proposed system design is economically viable for all involved stakeholders over the simulation horizon from 2022 to 2036, with a payback time of <5 years, 4 years to distribute 50% of the PV tokens, and an overall self-consumption share of 69%.

1. Introduction

The transition of the German energy sector towards small-scale, distributed electricity resources has led to the strong growth of renewable energy prosumership over the past decade [1,2]. According to [1], a large proportion of the more than 1.6 million installed PV systems is made up of systems with less than 10 kilowatts of peak (kWp) installed generation. The potential for further development is even greater, since more than 3.8 million apartments within residential buildings are suitable for equipment with building-integrated PV systems [3]. Despite their importance and future potential, the expansion of PV systems within renewable energy communities (RECs) is currently proceeding at a slow pace [4]. In addition to the legal framework, this is mainly due to the difficulty of individual residents to acquire shares of PV systems without major organizational or technical effort, and to differentiate the distribution of the generated electricity on a verifiable basis [2]. So, instead of buying individual PV shares, consumers have been sharing PV systems in RECs via so-called "third party ownership” (TPO) models [5]. This can be designed as a “lease” or a “power-purchase agreement” (PPA) [5]. A lease involves the consumer paying the owner of the PV system a fixed monthly amount, regardless of the PV system’s energy production. In a PPA, the consumer pays the owner a predefined fixed price per unit of energy produced [6]. In both cases, however, ownership of the PV system does not transfer to the consumer. Consumers only receive rights of use. This only partially fulfills the goal of an inclusive energy transition according to the UN Sustainable Development Goals [2], as residents are given access to renewable energy, but are denied active participation through the purchase of PV shares. To enable such participation, we developed a blockchain-based system and simulated its technical and economic viability for all stakeholders, based on a mixed residential and commercial building within an REC in Germany. Through this, we answer the following research questions:
RQ1: How can a technical solution for the simple, fast and verifiable acquisition of shared PV systems within an energy community be designed?
RQ2: What are the financial benefits for the involved stakeholders (consumers, energy providers, etc.)?
By enabling real small-scale prosumership, we create financial incentives for demand side management, which we expect to have a positive impact on the overall electricity system. First, this is done using a temporal match of renewable energy production and consumption, which is also applicable to energy communities where production sites are not in direct proximity to the consumption (such as citizen energy communities), and second, it also involves a spatial match within RECs, where the matching also frees up grid capacity.
To answer the research questions, we first conduct a literature review Section 2. In it, we present the current state of RECs in Europe, and describe changes in the business models of energy utilities and the role of blockchain technology in this context. In Section 3, we provide the technical details of the aforementioned showcase building including the energy consumption based on the user behavior of its future residents, PV energy production, and energy management application. In Section 4, we design a system which shows how consumers in such buildings become prosumers, by earning tokens through self-consumption and redeeming them for PV shares. The model is evaluated from an economical and technical perspective within Section 5. We end with a conclusion and an outlook of future applications and extensions.

2. Literature Review

2.1. Energy Communities

Energy communities are on the rise globally, as they enable electricity consumers to advance the decarbonization of the energy system, while benefiting economically [2,7]. In contrast to microgrids, energy communities do not necessarily have to be physically linked, i.e., via a grid infrastructure [8]. Thus, they can involve the collaboration of individual consumers within residential buildings, as well as several neighborhoods, for the common purpose of expanding renewable energy and increasing their own share of locally generated renewable electricity. For example, [9] examine how the expansion of residential PV systems affects electricity self-consumption rates. [1] extend this approach by combining a PV system with a storage system, and calculating the achievable annual savings of residents in energy communities. A similarly designed research issue is investigated by [8,10,11]. Approaches to optimizing energy flows within energy communities are also being developed, studied, and tested in scientific literature [12,13,14,15]. Legal frameworks as well as challenges are explored by [9,16]. Indeed, the lack of sufficient legislation to ensure viability is one of the reasons for the delayed further development of energy communities [17,18]. In addition to these specific research questions, [7] provides a very comprehensive study of energy communities. The study examines not only the social interaction of their members, but also the technological feasibility of such communities, as well as social and technical implications. In this context, [19] perform a techno-economic analysis focusing on the Japanese energy system. An examination of whether RECs, as defined under the European Union’s Renewable Energy Directive (RED II), can be a useful facilitator for future energy systems is provided by [4]. According to Article 22 of RED II, an REC is a community in which consumers can produce, consume, distribute, and trade renewable energy, and in which every member must be able to access and acquire renewable assets co-ownership [4]. In addition to the REC defined in RED II, with the citizen energy community (CEC), the directive on common rules for the internal electricity market [20] provides another construct for energy communities. The main differences are that RECs include all forms of energy and demand within a spatial proximity of the RE project, while CECs only consider electricity, while having no spatial limitations. For this study, we focus on the REC, since it offers the most benefits for the electricity grid when applying a local energy management, however, the structure can be applied on multiple forms of ECs. In a broader sense, our model can be interesting for ECs in rural areas by enabling the members there to first obtain transparency on generated and consumed energy quantities, to obtain ownership of small-scale energy assets, and finally, to build up a local energy market [21].
The way in which renewable energy is generated and distributed within RECs, the benefits for their members and legal challenges, as well as social implications, have already been studied. What is missing, however, is an easily accessible way towards the co-ownership of shared PV systems for consumers within an energy community, as the evolvement of consumers to become prosumers is relevant for the success of a sustainable energy system design [22,23,24,25].

2.2. Novel Energy Business Models and Co-Ownership of PV Assets

In the past, energy utilities made profit by primarily selling electricity and recovering the cost of their investment from standard electricity-tariff consumers [26]. Since RECs are on the rise and electricity self-consumption rates are increasing, less and less electricity will be consumed via standard electricity contracts. Thus, energy utilities are rethinking their business models towards becoming electricity service providers [27]. In this context, the installation of PV systems and the marketing of the electricity generated via TPO is becoming increasingly important [28], both in the commercial and residential sectors. In the commercial sector, for example for industrial customers, there are currently two options: direct ownership (DO) of a PV system or TPO. In the first case, companies purchasing PV systems for industrial buildings, for instance, may receive government subsidies and feed-in tariffs [28]. However, the initial investment and the cost of maintenance and repair can be substantial. This financial risk is considerably reduced by TPO for corporate customers, who either pay a monthly amount and are allowed to use the PV systems (“lease” model, see Section 1), or pay a fixed price per energy generated (PPA model, see Section 1) [5,28]. In a commercial context, the number of PPA-based PV systems is growing steadily [6]; PPA approaches are also beginning to appear in the private sector as part of the installation of PV systems in RECs [5]. However, the creation and execution of PPAs and lease contracts for PV systems are complex and do not meet the requirements of RECs from two perspectives: (1) a transfer of ownership of the PV system between system owner and resident does not take place. While the consumer can increase the share of renewable generated energy, becoming a prosumer is not feasible. (2) Within an REC, changes of residents/consumers within a residential building occur frequently. An administratively and technologically easy and quick transfer of electricity usage rights from PPAs is not possible. To address this problem, the concept of “co-ownership” has evolved [4]. According to [4], “consumer co-ownership” within RECs is understood as “participation schemes that (..) confer ownership rights in [RE] projects (..) to consumers (..) in a local or regional area”. An important criterion of the RED II of the European Clean Energy Package is that individual shareholders may not own more than 33% of the PV system in co-ownership within RECs [4]. One possibility is for members of an energy community to join together at the outset and jointly purchase plant shares in PV plants [29]. However, this is a one-time transfer of ownership that is detached from the future electricity consumption of the members. A possibility for the gradual tokenized transfer of the ownership of PV shares based on electricity consumption is currently lacking, as the technological and administrative implementation of such a stepwise sale and co-ownership is cumbersome [4].
Following the call of [7] for ways of how Energy Communities “consider the procurement of (..) energy infrastructure”, we developed a system for the small-scale, fast and easy purchase of PV assets for residents within energy communities, based on blockchain technology.

2.3. Blockchain in Energy Communities and Use of Tokens

Storing data from distributed PV assets in blockchain networks, which are also organized in a distributed manner, seems to be an obvious approach, and is one of the reasons for the already numerous pilot applications of the use of blockchain technology in the energy industry [30,31]. According to [30], the applications to date can be divided into eight areas, with “decentralized energy trading” making up the largest in terms of the number of applications. For example, [32] are investigating the design of a “local electricity market” built on a peer-to-peer trading mechanism. In the context of an energy community, such a mechanism was studied in [33]. The topic of data security was investigated in [34], resulting in the development of a trading mechanism optimized for security. The use of so-called smart contracts and tokens plays a role in almost all peer-to-peer use cases. A smart contract is a computer program or a transaction protocol which is intended to automatically execute, control or document legally relevant events and actions according to the terms of a contract or an agreement. According to [35], smart contracts are: (a) programs, but not contracts in the legal sense (b) tamper-proof after deployment (c) deterministic. In Germany, smart contracts are considered to follow the expression of a human will that has been anticipated by their programming. Therefore, it is accepted that legally binding agreements can be concluded as smart contracts by automated devices [36,37,38]. As there is currently no standardized definition of tokens [39], we use the term "token" as a representation of electricity usage and asset ownership rights within an energy community [39,40]. Table 1 provides information about the general properties of tokens.
A distinction can be made between native tokens and application tokens [30]. A native token (e.g., Bitcoin or Ether) is a platform’s own currency, and serves its network as an economic incentive to achieve a higher common goal and to sanction manipulation attempts economically [39,41]. Application tokens represent ownership or access rights to digital and physical assets [42]. Within an energy community, native tokens may represent electricity usage rights, while application tokens represent PV asset ownership rights.
The offer of a token can be designed in limited or unlimited quantities, so that the stability of the token value can be regulated. The token transmission can be categorized as linear or circular. A token with a linear transmission will expire after a single use. A token with a circular transmission can be used as often as desired, and expires only when the asset that it represents no longer exists. Furthermore, the validity of a token can be limited in time. To reduce the complexity of creating application tokens within the developer community, numerous de facto token standards (such as ERC 20 and ERC 777) have been created in recent years.
The existing literature focuses on the use of tokens as specific features of blockchain-based energy markets, such as crypto-currencies [43] or data protection measures [44]. The implementation scope hereby ranges from small power markets in private blockchain applications [45] to markets for anonymous emissions trading between independent actors in public blockchains (peer-to-peer trading) [46]. Regardless of the scope and size of the projects, tokens are predominantly used in the form of native tokens (e.g., one kWh corresponds to one token), especially in the peer-to-peer sharing context. The use of utility tokens to represent the ownership rights of PV systems and the exchange of native into utility tokens, however, has not yet been sufficiently addressed.

2.4. Research Contribution

Summing up the literature, it can be stated that RECs are a key feature to fulfill the energy targets set by the EU [4]. However, a large-scale application of RECs is still missing. On the energy utility side, we expect a shift from static energy suppliers to energy service providers. Finally, smart contracts and tokens provide powerful tools within the blockchain toolbox for a variety of energy applications. The most common use case so far is the trade of kWh within a peer-to-peer network, while asset ownership approaches are sparse.
In this work, we design and implement a blockchain-based PV asset ownership system allowing consumers to quickly, easily, and securely obtain PV shares within a potential REC in Germany. Since the German use case is one of the most restricted use cases, the concept is also applicable to a variety of energy community constellations. In the presented approach, the utility becomes a key player that, instead of rejecting the idea of RECs, actively pushes the idea of self-consuming producers. To realize the idea, we define energy tokens that are distributed based on transparent and trustful smart contracts, where instead of enabling a peer-to-peer trading mechanism, an ownership sharing mechanism is applied.

3. Materials and Methods

3.1. Selected Renewable Energy Community

The real-life REC chosen for this study consists of a mixed commercial and residential building, currently located within the so-called “Pfaff” district. It is located in the center of the German city of Kaiserslautern, which has introduced a “Solar Satzung” that requires building owners to dedicate a defined fraction of their rooves to solar systems [47]. This district is being redeveloped into a climate-neutral residential, commercial and technology area within the scope of a national “Lighthouse” research project named “EnStadt:Pfaff” [48]. As a “real laboratory”, the project shall create efficient and innovative infrastructures for electricity, heating, cooling, e-mobility and data, as well as rehabilitating existing buildings with innovative technologies. One of these former office buildings is our choice for the present case study.
The building is the property of one single owner, who plans to split it into 27 units, 16 residential and 11 for offices, as shown in Table 2. The 16 residential units are heterogeneous in their room count, composition, and presumably user behavior. Because of the “real laboratory” character, we assume that all future residents will join the REC. Within the REC, it is the role of the electricity provider to sell shares of the building-integrated PV to the consuming residents, and organize the feed-in of PV surplus, as well as necessary electricity from the grid. Therefore, three roles are present in the community: (1) the building owner, (2) the consumers within the building, (3) the electricity provider. Even though all roles are part of the community, we further employ the term “community members” (or just “members”) to exclusively refer to the use of a case-specific user group of residential consumers.

3.2. Case Study Characteristics

This section provides the main case study characteristics with enough information to have an overview about the electrical and economical assumption, while a comprehensive explanation is provided in Appendix A.
The data set of the building consists of generation profiles for five different PV plants, with a combined nominal power of 40 kW, as well as consumption profiles for each residential and commercial unit in one minute resolution over a period of one year. To analyze the influence of demand-side management, seven battery electric vehicles (BEV) with private charging infrastructure are distributed over the different residents. The annual ratio between total PV production and overall consumption is 40%, while the maximum flexible energy of the electric vehicles makes up 8% of total energy consumption. Those two numbers provide the boundaries in which an incentivized energy management system (EMS) can operate. The simulation setup is shown in Table 2.
To study the different aspects of the energy usage patterns of residents and office workers, the 27 units within the building are represented by 27 individual teams. Each team represents one member of the energy community, and can deploy one to three computing units respectively for the building unit, an electric vehicle, and a PV plant. These computing units measure the electricity consumption which feeds a billing and token system, as described in Section 4.3.
The BEV usage profile is generated using a simulation tool described in [49]. On the aggregated apartment level, the electricity usage profiles for the various user groups are created using a stochastic, bottom-up simulation, presented and validated in [50]. The eleven trade, commercial, and service units were simulated using another stochastic bottom-up simulator presented in [51]. Electricity generation is obtained using a PV model based on [52,53]. With respect to size, azimuth, and the inclination of the PV plants previously described, we created one time series for building-integrated PV production. Further information on the simulation modules is provided in [54].
Prior to economical analyses, we applied an agent-based EMS, with the aim of maximizing PV self-consumption by the controlled charging of the BEVs, incentivized by the Prosumer Asset Ownership system (PAOS) described in Section 4. Each of the agents participates in a two-level optimization, optimizing first at the team level, and then at the community level. The functionality of this decentralized control system is described in [55]. The simulation results without EMS are further referred to as “baseline scenario”, and the active EMS forms the “controlled scenario”.
An overview of the economic assumptions is shown in Table 3. All time series of the economic simulation have a 15 min resolution over one full year. For the simulation horizon of 15 years, we used the same annual time series for loads and production repetitively, year after year. Having the same load and consumption pattern, each year simplifies comparison, and funnels attention to the developed PAOS.

3.3. Definition of Key Performance Indicators

To analyze the benefit of the case study, key performance indicators (KPIs) are defined as follows. For the utility, which in our case is the investor, the return on investment (ROI) is of high importance, while for community members, the electricity bill reduction, together with the acquisition of PV plant shares, is prioritized. Utility and community members both benefit from high PV self-consumption and PV self-sufficiency shares, since they increase the economical (and ecological) impact of the PV plant. The higher the share of self-consumption, the less energy is fed into the distribution grid for a minimum remuneration. The higher the self-sufficiency, the less energy needs to be bought on external markets, saving grid usage costs and additional surcharges. In this context, self-consumption is defined as per Equation (1), as a function of a photovoltaic power p v and consumption c.
s c ( p v , c ) = m i n ( p v , c )
Self-consumption shares for the aggregated community teams S C S T M for all timesteps t within a simulation span T (lower timestamp t l to upper timestamp t u ) and all members m in the team compilation M (Team 1 to 27) are given by Equation (2).
S C S T M = m M t = t l t u s c ( p v t m , c t m ) m M t = t l t u p v t m
When only considering the grid connection point of the building, no individual members are used in the equation; instead, the overall PV power p v t and overall consumption c t are used.
S C S T = t = t l t u s c ( p v t , c t ) t = t l t u p v t
Self-sufficiency share S S S is calculated analogously for the aggregated community share (4) and the overall building share (5), by dividing self-consumption by the consumption, instead of production.
S S S T M = m M t = t l t u s c ( p v t m , c t m ) m M t = t l t u c t m
S S S T = t = t l t u s c ( p v t , c t ) t = t l t u c t m

4. Prosumer Asset Ownership System (PAOS)

The goal of the PAOS is to accelerate the development of RECs, while benefiting all involved stakeholders. It is designed to facilitate the acquisition of PV asset shares by energy community members. We start with an overview of the involved stakeholders by assessing their roles and motivations to be part of the REC. We then explain the chosen overall layer structure and token transmission process of the PAOS before we end this section with an elaboration of the individual layer components and token design.

4.1. Stakeholder

The developed PAOS addresses the needs of all involved stakeholders (as shown in Table 4). The community members would benefit from PV electricity being less expensive than grid electricity, and the ability to acquire PV shares [58]. The energy utility would secure customer relationships over electricity sales volumes, enabling new business models in line with the electrification of other sectors, such as mobility and heating, thus evolving from an electricity provider to a service provider [27].
The primary focus of the energy utility within the PAOS is to bind consumers over an extended period of time, in order to supply the necessary grid electricity and secure operating contracts commissioned by the building owners. The role of the building owner changes from an investor in building-integrated PV to an enabler, by allowing the energy utility to install (and finance) building-integrated PV. Such simplification would shift the investment risk from the building owner to the energy utility, which has the ability to estimate site-specific PV energy production, self-consumption and self-production shares, and therefore, the resulting economic feasibility of the investment. To secure the ROI made by the energy utility and to create the necessary motivator for consumers to adapt their behavior, we propose the PAOS as follows.

4.2. Layer Structure and Token Transmission

The PAOS is structured in two layers as shown in Figure 1: the “Energy Billing Layer” and the “PV Asset Share Layer”. The first contains the independently acting energy agents and a billing smart contract, while in the second, two smart contracts enable community members to become prosumers.
Starting from the “Energy Billing Layer”, each agent is connected to the smart meter of each community member within the building, and communicates its electricity consumption or generation values to a “Billing Contract”. It is exemplary that four agents, with their respective smart meters within the building described in Section 3.1 (green and orange resident households, grid and PV panel), are shown in Figure 1 (step 1).
The billing contract calculates individual consumption values, detailing the exact amount of PV (black arrow) and grid electricity (blue arrow), and transfers those values to the “Green Energy Token Contract”, which is contained in the “PV-Asset Share Layer” (Figure 1, step 2).
Based on these two values, the amount of green energy token (GET) is determined for each community member and transferred to their respective blockchain accounts (Figure 1, step 3).
The collected GET can subsequently be redeemed for shares in the building PV system by using the “Market Place Contract” (step 4 in Figure 1). This contract ensures the transfer of PV shares from the energy utility to the other members of the REC, thus allowing them to become prosumers.
All three developed smart contracts are written in Soliditity, and can be deployed on the Ethereum Virtual Machine, and related software platforms.

4.3. Layer Components and Token Design

4.3.1. Billing Contract

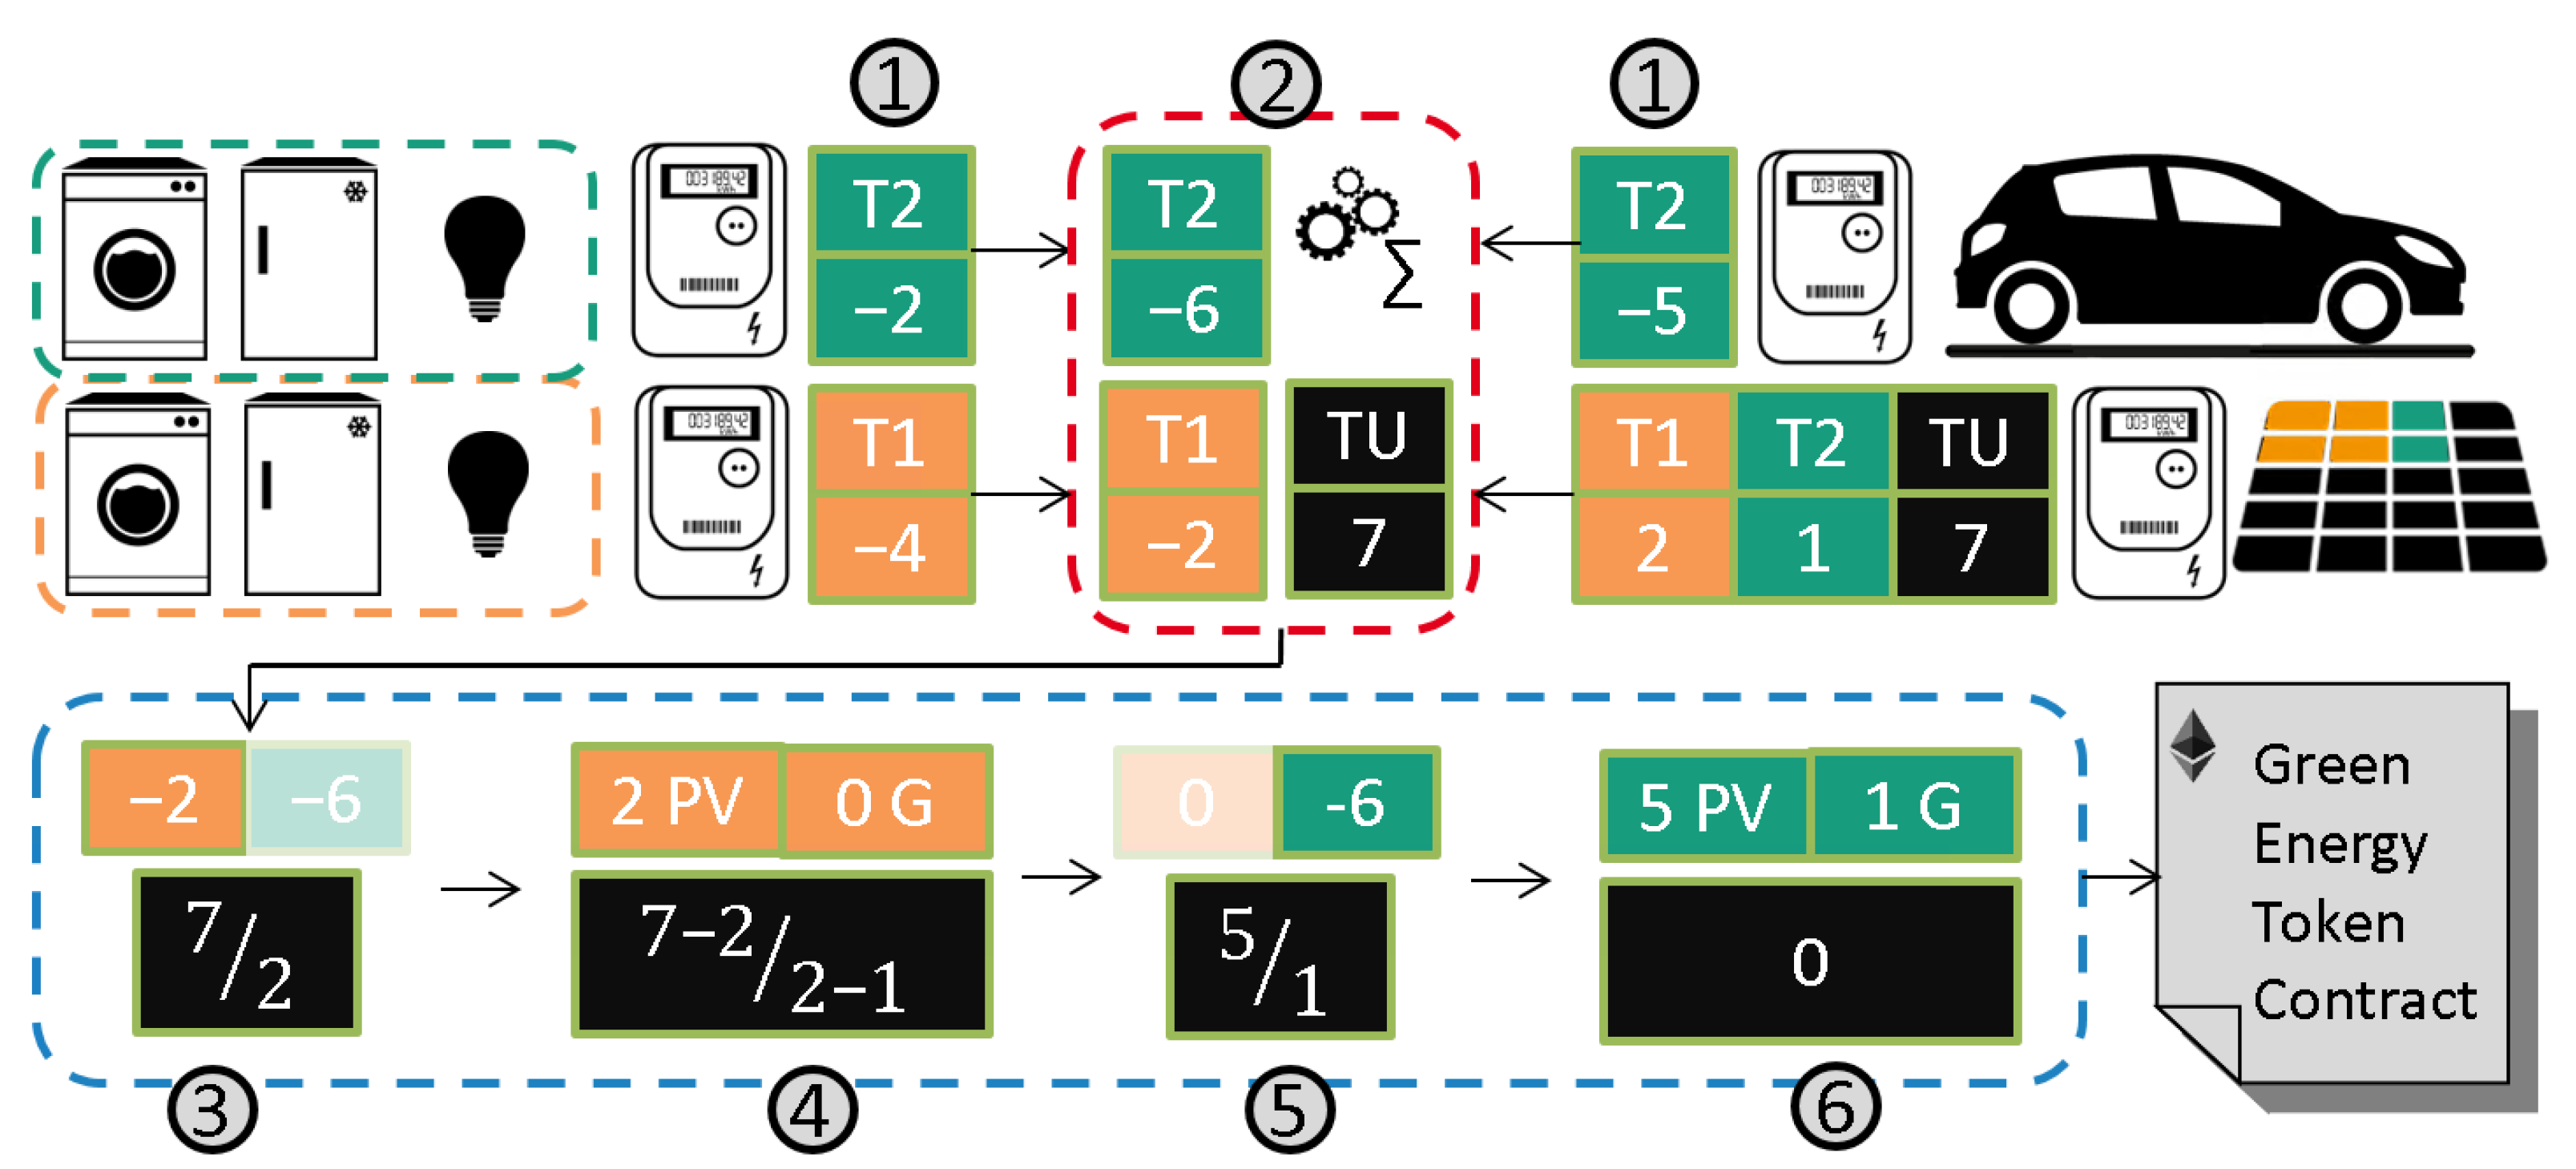
The billing contract hosts an algorithm which, every 15 minutes, first calculates the “real-time” self-consumption share of each member. To do so, the billing contract receives all data of the REC members. These are the consumption values of each smart meter, consisting of all controllable (e.g., BEVs) and non-controllable loads (e.g., apartments), together with the production values of the PV plants. Additionally, the grid connection point could be included, but for the present study, it was calculated. The billing contract is visualized in Figure 2. A smart meter message package consists of a variable length of pairs. Each pair includes a unique team ID and an energy value (e.g., in Figure 2 step 1, the apartment smart meter of the orange team sent a value pair with the ID: “T1” and the value “−4”). A counter within the billing contract checks if all registered smart meters sent a message. Upon validation, the self-consumption and the excess consumption/production of each member is determined (e.g., for Team 1 in Step 2, the self-consumed PV energy is 2 the excess value -2, where a negative value indicates an excess consumption). Initially, the self-consumption of households is zero, since the PV system is exclusively owned by its sole investor, the energy utility.
When, during a 15-min period, a household consumes less electricity than it is entitled to, the electricity surplus is transferred to the energy utility (financially, not as a physical electricity flow). Entitlement is determined on behalf of the PV ownership shares.
The determined electricity surplus is then distributed equally among all households, until either their individual electricity consumption is saturated, or there is no more surplus (blue box in Figure 2). This has been implemented as a loop that starts with the team with the lowest residual consumption, and checks whether the current share (remaining PV energy of the utility divided by the number of remaining teams in the loop that have a consumption surplus) is greater than the current consumption surplus (e.g., in Step 3, the excess consumption of 2 is lower than 3.5, which is calculated by dividing the seven utility PV units equally between two teams). In this case, the consumption surplus is settled using 100% utility PV energy (Step 4), and the next team in the line is calculated (Step 5 and 6). This process repeats until the current share is greater or equal to the current consumption surplus. All remaining teams obtain the current share, and the iteration is finished. Remaining consumption surplus is matched by the community PV surplus or the grid.
For the bill calculation, self-consumption is priced as EUR 0, while all other energy costs a fixed amount, as previously defined by the utility (CT 29.74 in the case study according to Table 3). The amount of utility PV consumed and all remaining energy consumed for each community member are transferred to the Green Energy Token Contract.

4.3.2. Green Energy Token

On the basis of the values received from the billing contract, the GET transfer transaction is created and then signed with the private keys of the blockchain account of the energy utility. To ensure that the GET can only be published by the energy utility in the blockchain network, the energy utility was set as a smart contract owner and the token transfer function was restricted, in that it can only be executed by that owner account. The tokens are eventually transferred from the GET smart contract to the community member blockchain account. In the selected case study for each GET, 1 kWh of utility PV or 10 kWh of grid consumption is needed.
Since those tokens are sent from the GET smart contract, its balance must be sufficiently loaded with GETs. The process of "topping up” the token balance of the smart contract is currently being done manually by transferring them from the blockchain account of the energy utility to the GET smart contract account. The return of tokens from the blockchain account of the community members to the smart contract account in the event of termination of participation in the PAOS is also carried out manually. A termination can be carried out by the community member at any time.

4.3.3. Marketplace Contract

Once the tokens are within the community member account, it is free to redeem them by using the Marketplace Contract. By sending GETs to this contract, they are converted into “PV Asset Tokens” at a ratio of 500 to 1. For 500 GETs, the prosumer receives one share of the building PV system, which corresponds to 0.1 kWp of the installed capacity.
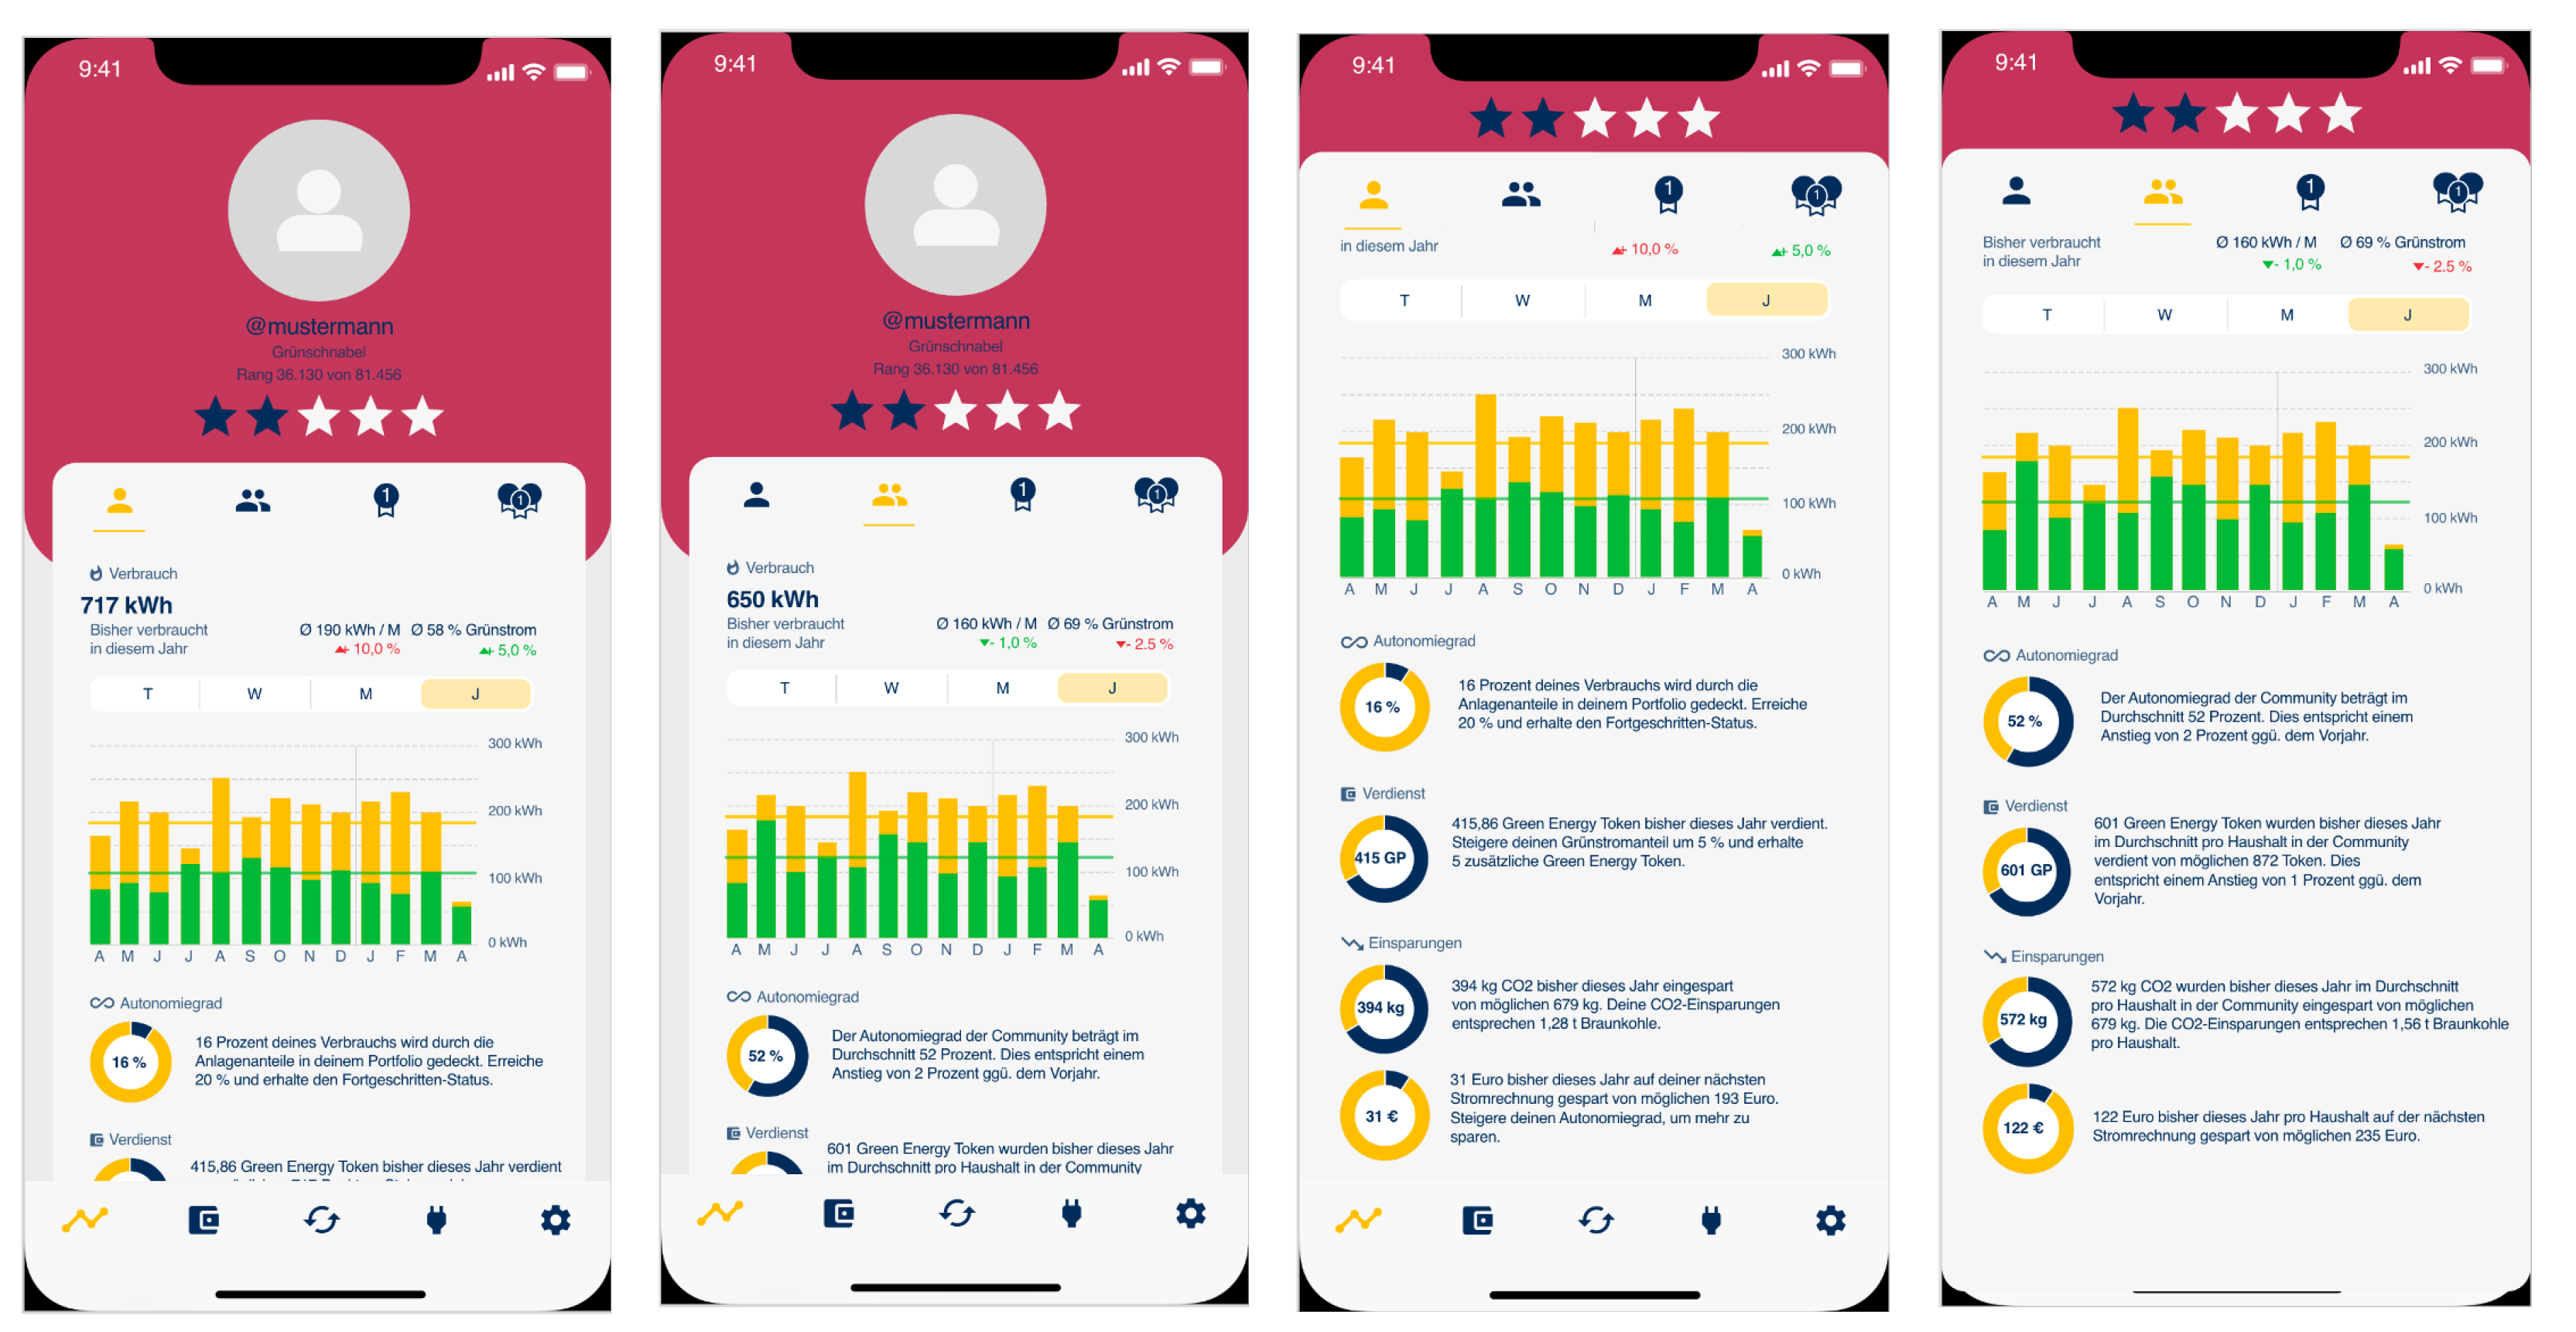
Due to this mechanism, the share of installed PV capacity that is owned by the utility company slowly decreases, while the household shares are increasing. The residents of the households are becoming prosumers, owning their small-scale energy production site. They become virtually entitled to self-consumption. In reality, the households are still legally buying each kWh that they consume. In order to reproduce the benefit of the PAOS into the reality, households pay 0 ct per kWh for their virtual self-consumption. The visualization of their personal status is done through the Pfaff Energy Community App (see Figure 3). A more detailed explanation of the app is presented in Appendix B).

4.3.4. Token Design of GET and Marketplace Contract

The GET contract is implemented as a native token (see Table 5 below). It serves as an incentive to use “green” instead of “grey” electricity. The token is designed in such a way that it is exchangeable for PV asset tokens, is available in unlimited quantities, and is transferable and fungible.
The marketplace contract is implemented as an application token. It represents PV asset shares, which in turn, grant community members a certain amount of electricity from the PV asset. The tokens are fungible, so that even fractions of a PV asset can be purchased. They expire as soon as the PV asset is taken out of operation. The expiration date is therefore written in the asset token specification file. Furthermore, in that file, the quantity of issuable tokens is defined to be linked to the quantity of available PV panels.

4.4. Shifts in Community Structure

As the community composition will vary over time with people being replaced by new residents, the asset token owner structure also changes. The concept behind a renewable energy community requires a regional aspect, meaning that tokens acquired within the PAOS stay within the community, and shall not be bound to a person moving out. Therefore, when people move from the specific location, asset tokens fall back to the utility.

4.5. Additional Use Cases for GET

While there is only a limited amount of PV asset tokens, GET are unlimited. Therefore, further use cases for GET are required to provide a useful token within the EC, when all PV assets are owned by the community. This is closely related to the previously stated assumption that energy utilities within the EC context will become energy service providers instead of simple energy sources (Section 2.2). In the specific case of the project EnStadt:Pfaff, community members are imagined to be able to exchange GET for car sharing usage provided by the utility, and to get a discount on energy-saving smart home devices. Additionally, a community platform was developed where GET is imagined to be a tradeable currency within the community. For example, GETs could be exchanged for credits on electricity accounts or used to pay for other energy-related services. Such an approach could ensure that the energy utilities can provide numerous value-added services based on the collection of the GET.

5. Results and Discussion

The presented PAOS was tested in a techno-economical simulation, as described in Section 3.2, with and without active EMS. This section starts with the key performance indicators of the simulated scenarios, which are listed in Table 6. It is followed by a deeper analysis of one specific community member (Section 5.1), an analysis of the economical viability for the utility (Section 5.2), and a broader economical and technical overview of the community (Section 5.3).

5.1. Selected Member Perspective

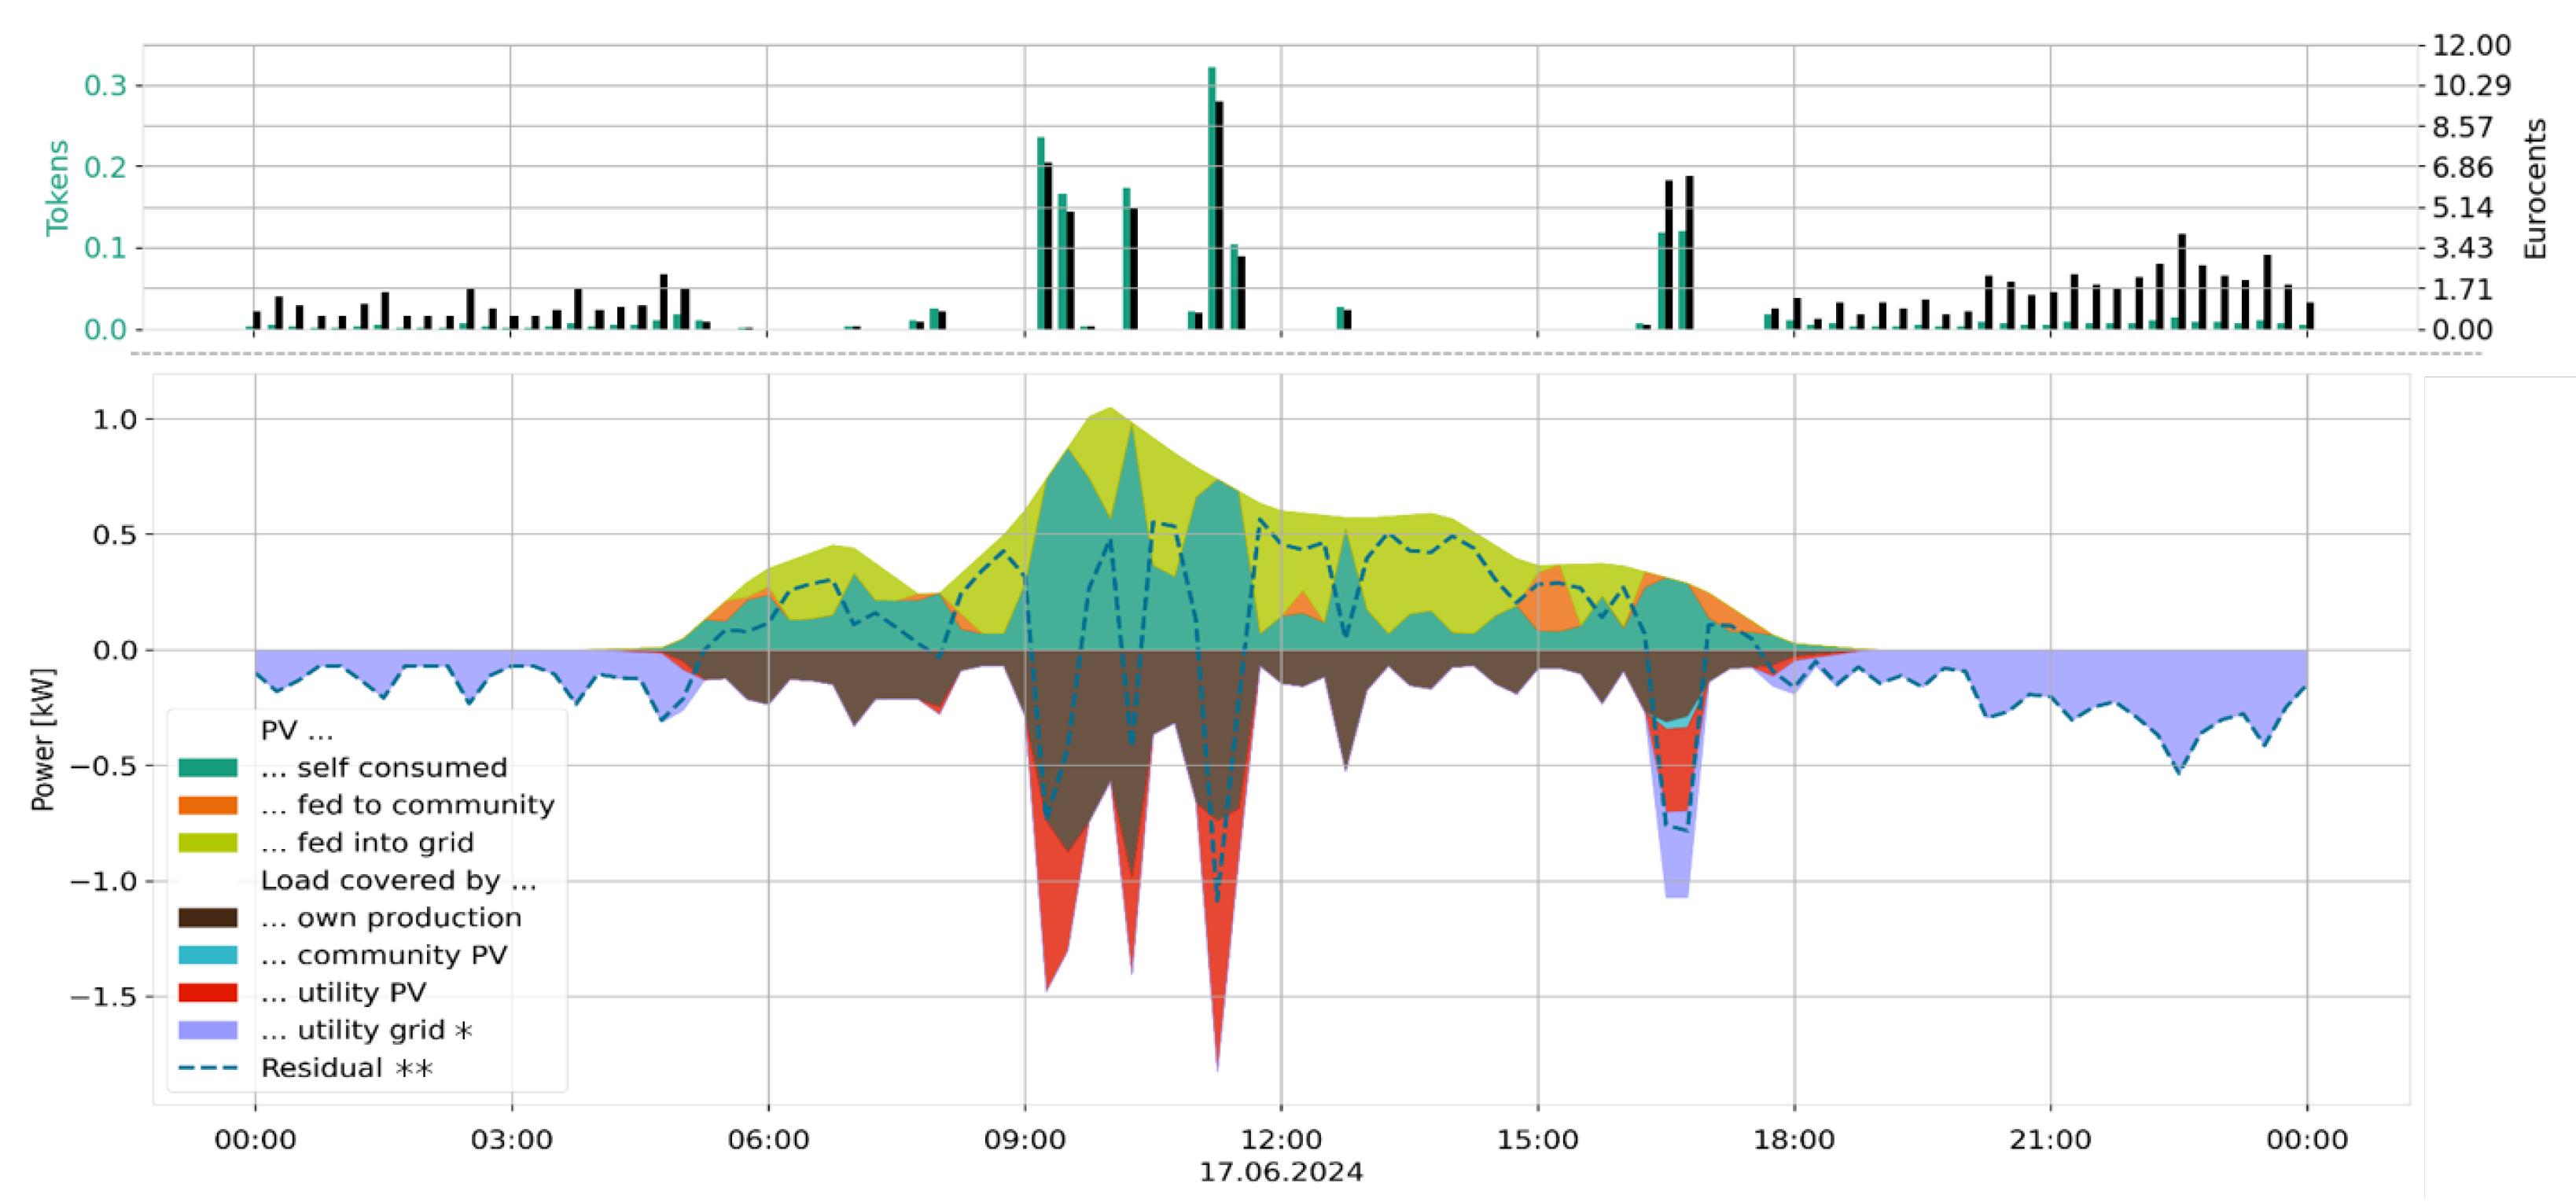
The selected community member we choose to focus on is the family listed as Team 14 in Table 2. In Figure 4, the energy, token and cash flows are shown for one exemplary day. The upper part of the figure shows the token rewards (green bars) and the bill (black bars), which are both resulting from the energy flows represented in the bottom part. The energy flows include PV production, shown as positive values differentiated by its specific use/destination, and loads, shown as negative values differentiated by their source. The residual load is defined as P V + l o a d (with l o a d 0 ), and is visualized by the dashed blue line. When the residual load is positive, the team has a production surplus, and the “real time” bill and the token reward are zero. During a consumption surplus, the energy is first provided by excess community PV (light blue area at 16:00–16:30), for which no tokens are earned, but the end user electricity price is applied (see Table 3), then provided by utility PV (red area), where the same price is applied, and the consumption of PV energy is rewarded by a token and last provided by external utility energy from the grid (purple area), for which, again, the uniform price is used, but a 10 times smaller token reward is gained. It can be seen that shifting energy consumption into times of high production (10:00) benefits the team, independent of whether the team PV or the utility PV is used. In the first case, no costs appear on the bill of the team, whereas in the second case, a high token reward is achieved, which can later be traded for additional PV plant shares.

5.2. Utility Perspective

This section focuses on the utility company which finances and operates the building-integrated PV systems. Following the condition set in Section 4.1, operation is done without pursuing financial profit upon self-consumption by the members. The simulation results show that, despite offering ownership shares over time until the utility company owns no more building-integrated PV, the PAOS is economically viable for utility companies, and provides community members with the necessary PV plant shares to operate self-consumption.
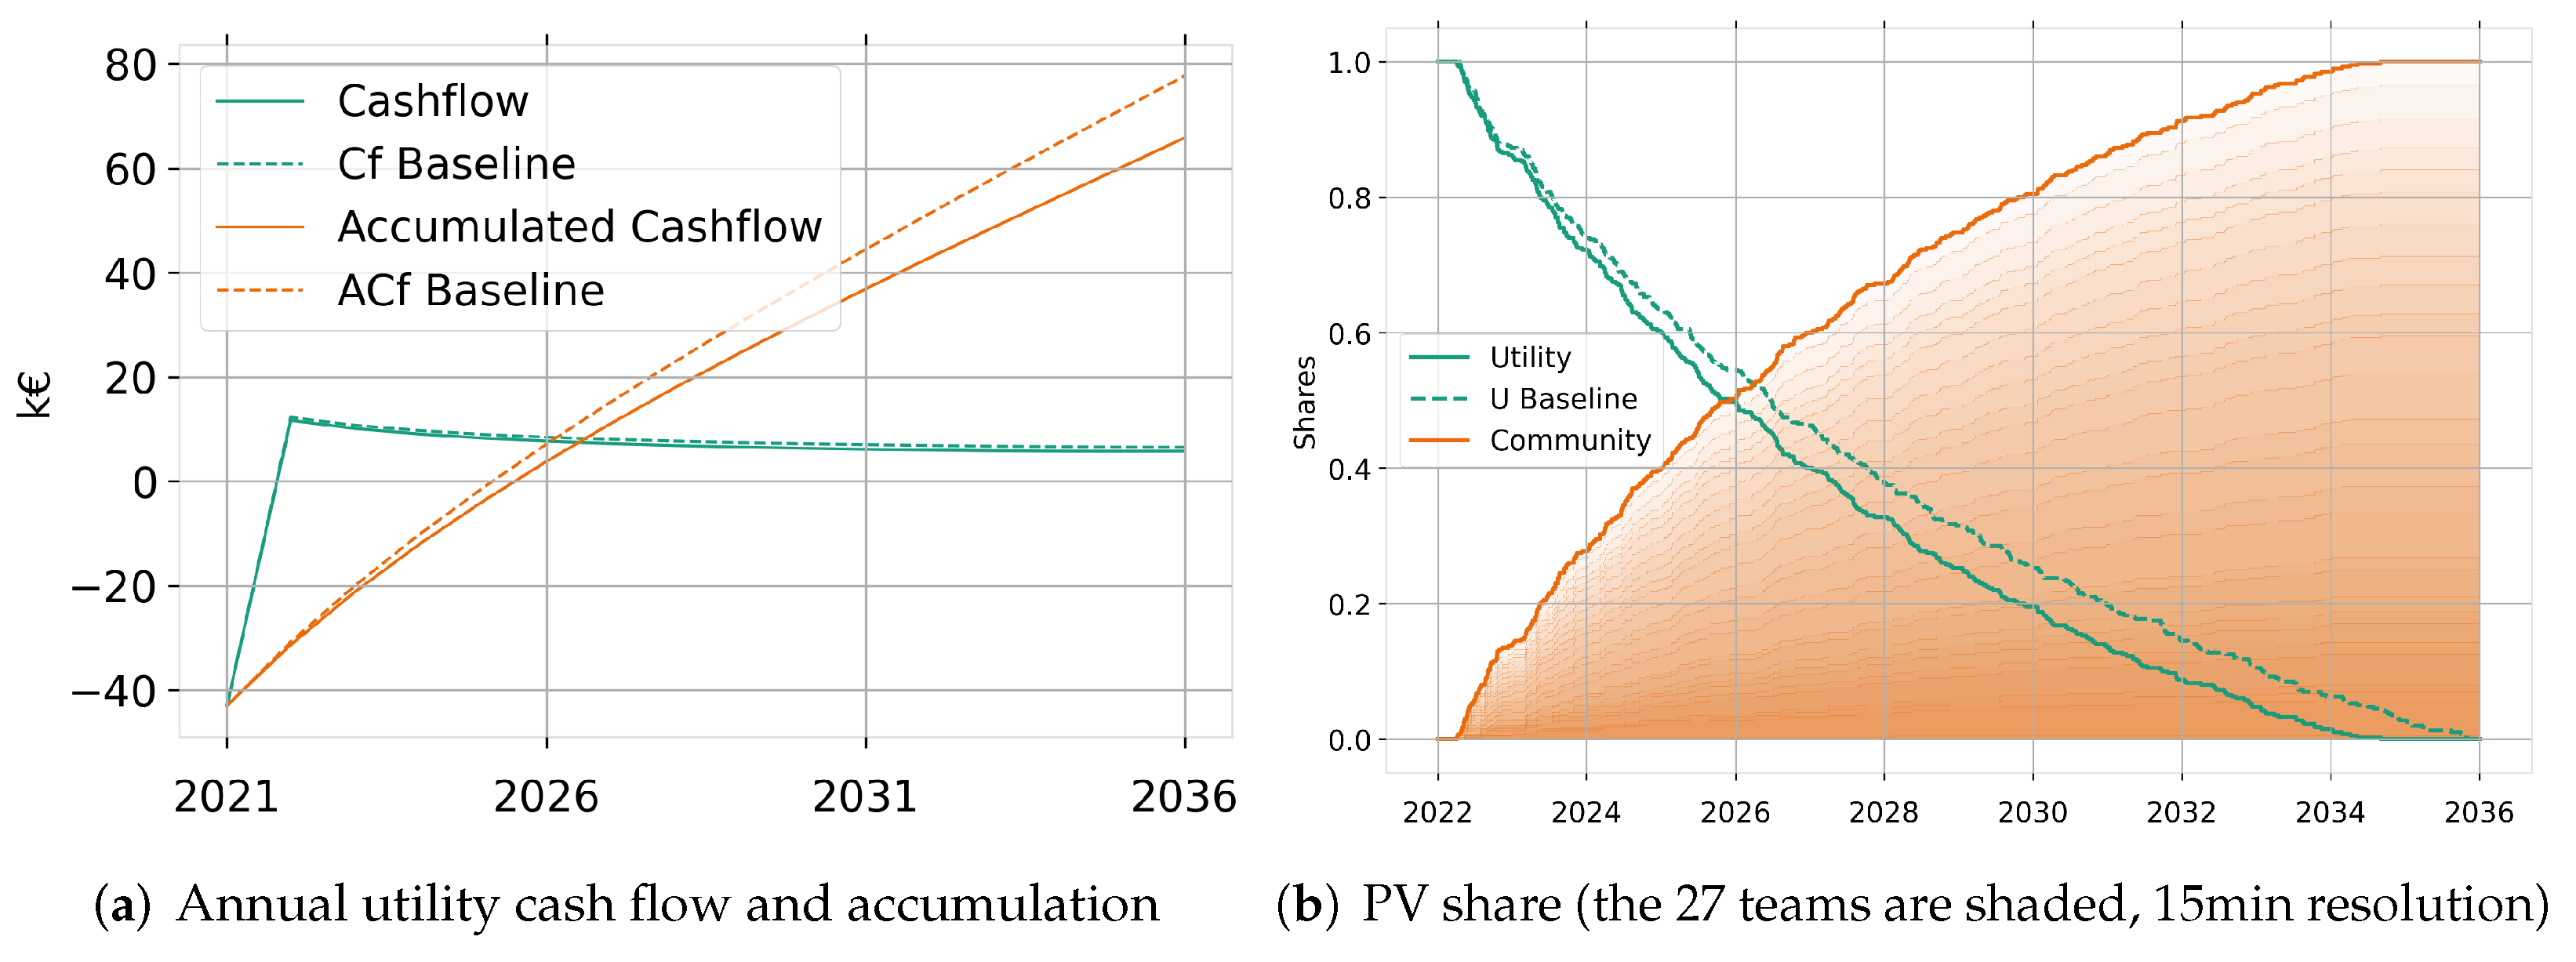
Figure 5a shows the annual net cash flow and the annual cumulative cash flow. At the beginning, an initial investment of EUR 43,000 is required for the PV installation (see Table 3) to integrate PV onto the building. The highest revenue is achieved in the first year, with EUR 11,658 decreasing year after year to reach EUR 5737, when all its PV shares are transferred to the members. With this gradually decreasing but always positive cash flow, the ROI time of the PV plant for the controlled scenario is 4 years and 9 months (considering a best-case scenario with an interest rate of 0). After 10 years’ operation, the overall earnings come to EUR 36,809.
In the baseline scenario (with no active EMS), ROI is achieved 6 months faster. This is due to the fact that the utility owns the PV shares longer, since the community members take more time to earn those. After having transferred all its PV shares to the community, the revenue of the utility company would, compared to the controlled scenario, rise by 14% to EUR 6517, since the members’ self-consumption shares decrease, which results in a higher amount of electricity being provided by the utility. Nevertheless, because active energy management is one key to an overall cost-optimized integration of renewable energy sources [59], and the revenue difference by the utility results in additional incentives for the community, we further focus on the analysis of the controlled scenario.
In any case, a positive cash flow of EUR 5700 provides a reasonable safety margin for the utility, in case the community realizes an even higher self-consumption share due to different energy usage patterns, or an increasing BEV penetration.

5.3. Community Perspective

Seven different REC members were selected to be representative of different typical consumer behavior. Three of those (Teams 2, 10 and 14) own and manage a BEV, and four (Teams 1, 11, 13 and 27) have no BEV flexibility. For comparison, teams 1 and 2 are students, 10 and 11 are full-time workers, 13 and 14 represent families, and 27 is a small office. The annual bills at the end of the first year, after 5 years and after 14 years, are shown in Table 7. The overall column shows values for the REC as a whole.
Overall, the annual electricity bill decreased by 24% in 14 years within the REC. Controlled and baseline scenarios lead to a similar cost reduction. The difference of 1% is due to a different share composition within the community, and an overall increased self-consumption when actively managing BEVs. After five years, a cost reduction of 18% (17% baseline) could be achieved. Using an EMS to time the shift-charging processes of the BEVs results in higher individual self-consumption shares for the teams with flexible loads, even though the effect is subject to usage patterns. Team 2 (Student with BEV), which uses an EMS, doubles the bill reduction (8% baseline vs. 16% controlled). The highest bill reduction is achieved by Team 27, which is an office. This is mainly due to the fact that working hours match the PV curve, even without any flexible loads.
Focusing on the correlated PV plant share distribution, Figure 5b shows the utility PV plant shares for the controlled (solid green line) and the baseline (dashed green line) scenario, together with the accumulation of the different tenant shares for the controlled scenario (solid orange line marks the aggregated shares, and different shades mark individual shares). With active management, after 4 years, 50% of the PV plant is owned by the members. Without active management, the timespan extends by 38% to 5.5 years. The PV share transfer rate continuously decreases over time, since less utility PV energy is consumed, and therefore, fewer tokens are earned by members. After 12 years and 9 months, the PV plant is completely owned by the members.
The PV share distribution within the REC is mainly influenced by an individual consumption pattern. Members with a consumption pattern, in line with the availability of PV electricity, will end up owning more shares of the PV plant. As a result, the individual self-consumptions of members differ in absolute values, but only small deviations are noted when divided by the individual kWh produced (see Equation (2)).
The mean day plots in Figure 6 show the aggregated self-consumption and self-sufficiency shares (for a definition, please see Section 3.3) of the REC. In Figure 6a, a mean summer day after one and a half years indicates that, while the self-consumption share is mostly 100% whenever there is PV available, self-sufficiency is hardly provided. When the PV plant is completely owned by the community (2036 and all following years), this imbalance changes. For summer 2036, Figure 6c, self-consumption and self-sufficiency are quite balanced. Looking at the mean winter day for 2036 Figure 6b, the imbalance is higher again.
In the year 2036, the aggregated individual self-consumption, as defined by Equation (2), is 52%, and the annual overall self-consumption of the building, as defined by Equation (3), is 61%. The difference of 9% profits the utility, since any PV energy that is not self-consumed by the producing member, but is consumed within the community, offers the highest profit margin for the utility. This effect is responsible for the utility to further have a positive cash flow, even after it does not own any shares of the plant anymore. From both the overall and the aggregated individual perspectives, the self-consumption share indicates that the plant size could be further increased. Nevertheless, since teams with a high match between consumption and production will own the larger part of the PV plant, the gap between building optimum and aggregated team optimum is small compared to a simple equal division of the PV plant. During the average summer at noon, Figure 6c self-sufficiency does not reach a maximum of 1, even while on a building level there is an overproduction of PV energy. This means that there is still potential for further individual optimization or collective energy storage. Another improvement could be made by enabling financial incentives for the community to share PV production among members, such as those described by [60].

6. Conclusions

We developed and simulated a blockchain-based prosumer asset ownership system (PAOS), which enables consumers to become prosumers within a renewable energy community (REC).
Answering RQ1 (see Section 1), the developed PAOS incentivizes and incites PV self-consumption, by rewarding it with tokens that can be exchanged for PV plant shares. The system is hosted by an energy utility that invests in a PV installation on a tenant building, operates the plant, and is also responsible for covering the remaining electricity demand from the grid. Community members within such a building participate in an REC, and gain tokens by consuming electricity at times of on-site generation. Gradually, the community members take over the PV plant and increase their individual self-consumption. The PAOS thus fulfills the requirements of a simple, fast, and verifiable transfer of ownership of PV shares.
To evaluate our concept, we conducted a simulation reflecting a building in a German city. The building is currently under renovation within the research project EnStadt:Pfaff. Therefore, we generated 27 different electric consumption profiles corresponding to the individual community members, and a generation profile of building-integrated PV. Additionally, two sets of electric vehicles profiles were simulated, to show the impact of an energy management system (EMS) on techno-economical performance.
Evaluation shows that the PAOS is economically viable for all stakeholders answering RQ2 (see Section 1). Community members can lower their electricity bill by 24%, while electricity providers have a gradually decreasing but always positive annual cash flow, achieving a return on investment after 5 years and 3 months. After 4 years, 50% of the PV plant is owned by the community. Community members with active EMS were able to accelerate the asset share generation, which doubled their individual bill reduction.
Our results are case-specific, and RECs with different electricity generation and consumption patterns, electricity prices, investment costs, stakeholder structures, ownership structures, or regulatory framework may need to adapt the proposed PAOS. In particular, when extending the PV plant (increasing the production/consumption ratio from 40%), the PAOS will become more attractive, since self-consumption in an uncontrolled system decreases the lower production/consumption ratio. The benefit of the PAOS also increases with a larger share of flexible loads. Since the German environment is very restrictive in the matter of RECs, together with the solar radiation in the showcase scenario being above German average but still low on an international scale, the message, that the presented system provides an economical solution for all involved parties, is valid for a broader international application.

7. Outlook

In the future, the described case of using a PAOS within a single residential building could be extended to several buildings within an REC. Here, an energy service provider would operate a renewable energy community, with multiple consumers in one specific area, and finance several PV assets within the community. Gradually, the community members take over the PV plants and become prosumers, even though they do not necessarily own the houses. In this way, a community of prosumers can grow without the need for an initial investment. Additionally, the PAOS could be applied on other devices within the energy system. A promising example would be to distribute shares of a stationary battery storage between the members. We see further research potential in two areas. First, especially in the design of legal framework conditions (e.g., in the German use case an adjustment of the EEG to reward community self-consumption), and, as well, in concepts on how the received green energy tokens can be exchanged, not only for PV assets, but also for other services (e.g., car sharing or smart home systems); second, in the investigation of the acceptance and participation interest in the developed PAOS on the part of the community members. In this regard, building on [61,62], further factors such as salary, leisure time activities, political attitudes, etc. of the 27 residential and business unit residents could be investigated.

Author Contributions

A.S.: Conceptualization, Methodology, Software, Formal analysis, Data Curation, Visualization, Writing—Review and Editing, Project administration. S.P.M.C.: Conceptualization, Methodology, Validation, Resources, Writing—Review and Editing, Project administration. M.U.: Conceptualization, Methodology, Validation, Resources, Writing–Review and Editing, Project administration. R.K.: Funding acquisition, Review and Editing J.S.: Funding acquisition, Review and Editing. All authors have read and agreed to the published version of the manuscript.

Funding

The work presented has been conducted in the EnStadt:Pfaff project. The research leading to these results has received funding from the German Ministry of Education and Research (BMBF) under the funding number 03SBE112G and the Ministry for Economics and Energy (BMWi) under the funding number 03SBE112D.

Institutional Review Board Statement

Not applicable.

Informed Consent Statement

Not applicable.

Data Availability Statement

The simulation data generated for this study are openly available at https://oc.ise.fraunhofer.de/index.php/s/gyFpgCqtMzUAqFH (accessed on 16 February 2022) (Password: paos) and upon request from the corresponding author.

Conflicts of Interest

The authors declare no conflict of interest. The funders had no role in the design of the study; in the collection, analyses, or interpretation of data; in the writing of the manuscript, or in the decision to publish the results.

Appendix A. Detailed Simulation Setup

In Section 3, a compact description of the simulation setup is provided, while this section provides a more in-depth view of the simulation data.

Appendix A.1. Location

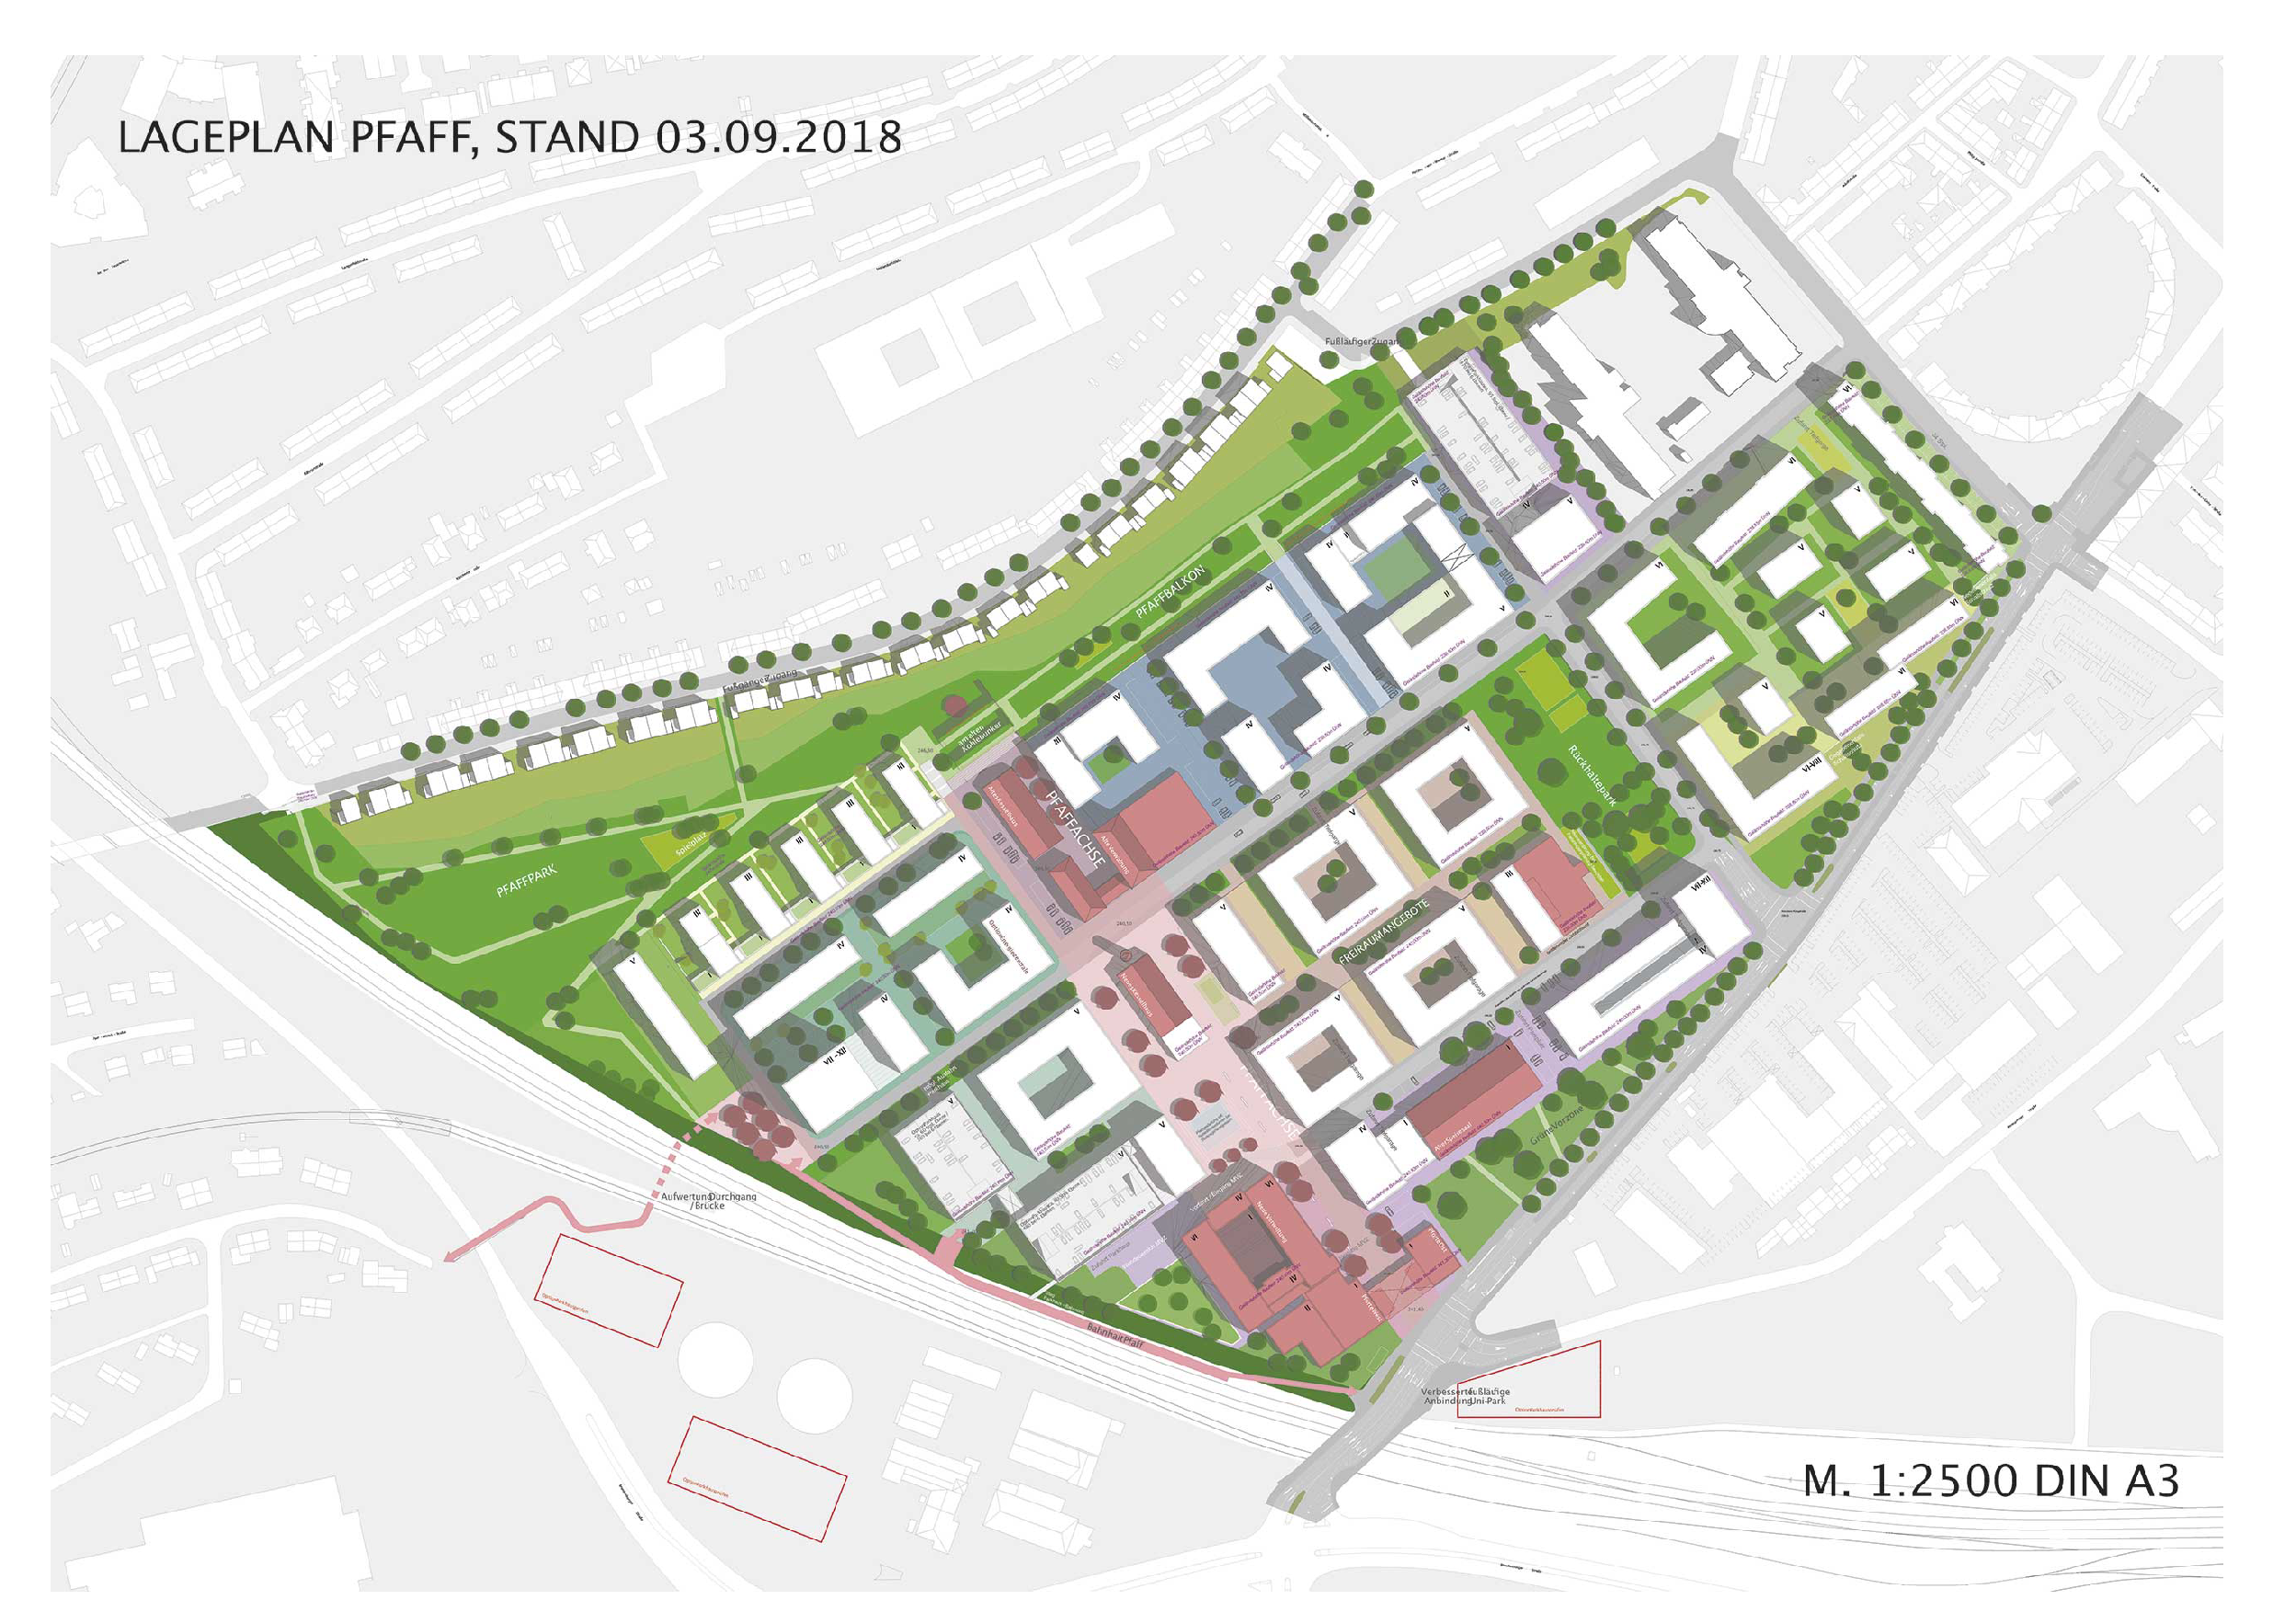
The showcase building is part of the EnStadt:Pfaff project in Kaiserslautern (Germany), located on the former industrial site of the sewing machine producer Pfaff (49.436356, 7.752961). The outline of the neighborhood is shown in Figure A1.
Figure A1. EnStadt:Pfaff project site. [From: https://pfaff-reallabor.de/quartier/umsetzung/ Original source: ASTOC/Mess] (accessed on 16 February 2022).
Electricity 03 00007 g0a1

Appendix A.2. Electric Vehicle Time Series Generation and Control Schemes

The BEV profiles were simulated using the synPRO-emobility tool described in [49]. The specific car usage and driving patterns were generated in accordance with the specific user types, as assigned in Table 2. The following seven electric vehicles were simulated, with all relevant specific attributes, such as battery capacity, available charging powers, and average consumption per distance: Team 2: Tesla, Team 5: Opel Ampera, Team 7: Renault Zoe, Team 10: Opel Ampera, Team 12: Kia Soul, Team 14: Mitsubishi i-Miev, Team 16: Nissan Leaf. The different charging profiles were first generated using a simple “charge upon arrival until the battery is full” heuristic. This scenario was named “baseline”. In a second round, an agent-based EMS was applied, wherein each agent rescheduled the individual teams’ electric vehicle. First, with the aim of utilizing the current individual excess PV production (PV share production subtracted by the uncontrollable apartment loads), and secondly, based on the additional available PV energy from other teams and the utility. This scenario was named “controlled”.

Appendix A.3. PV Time Series Generation
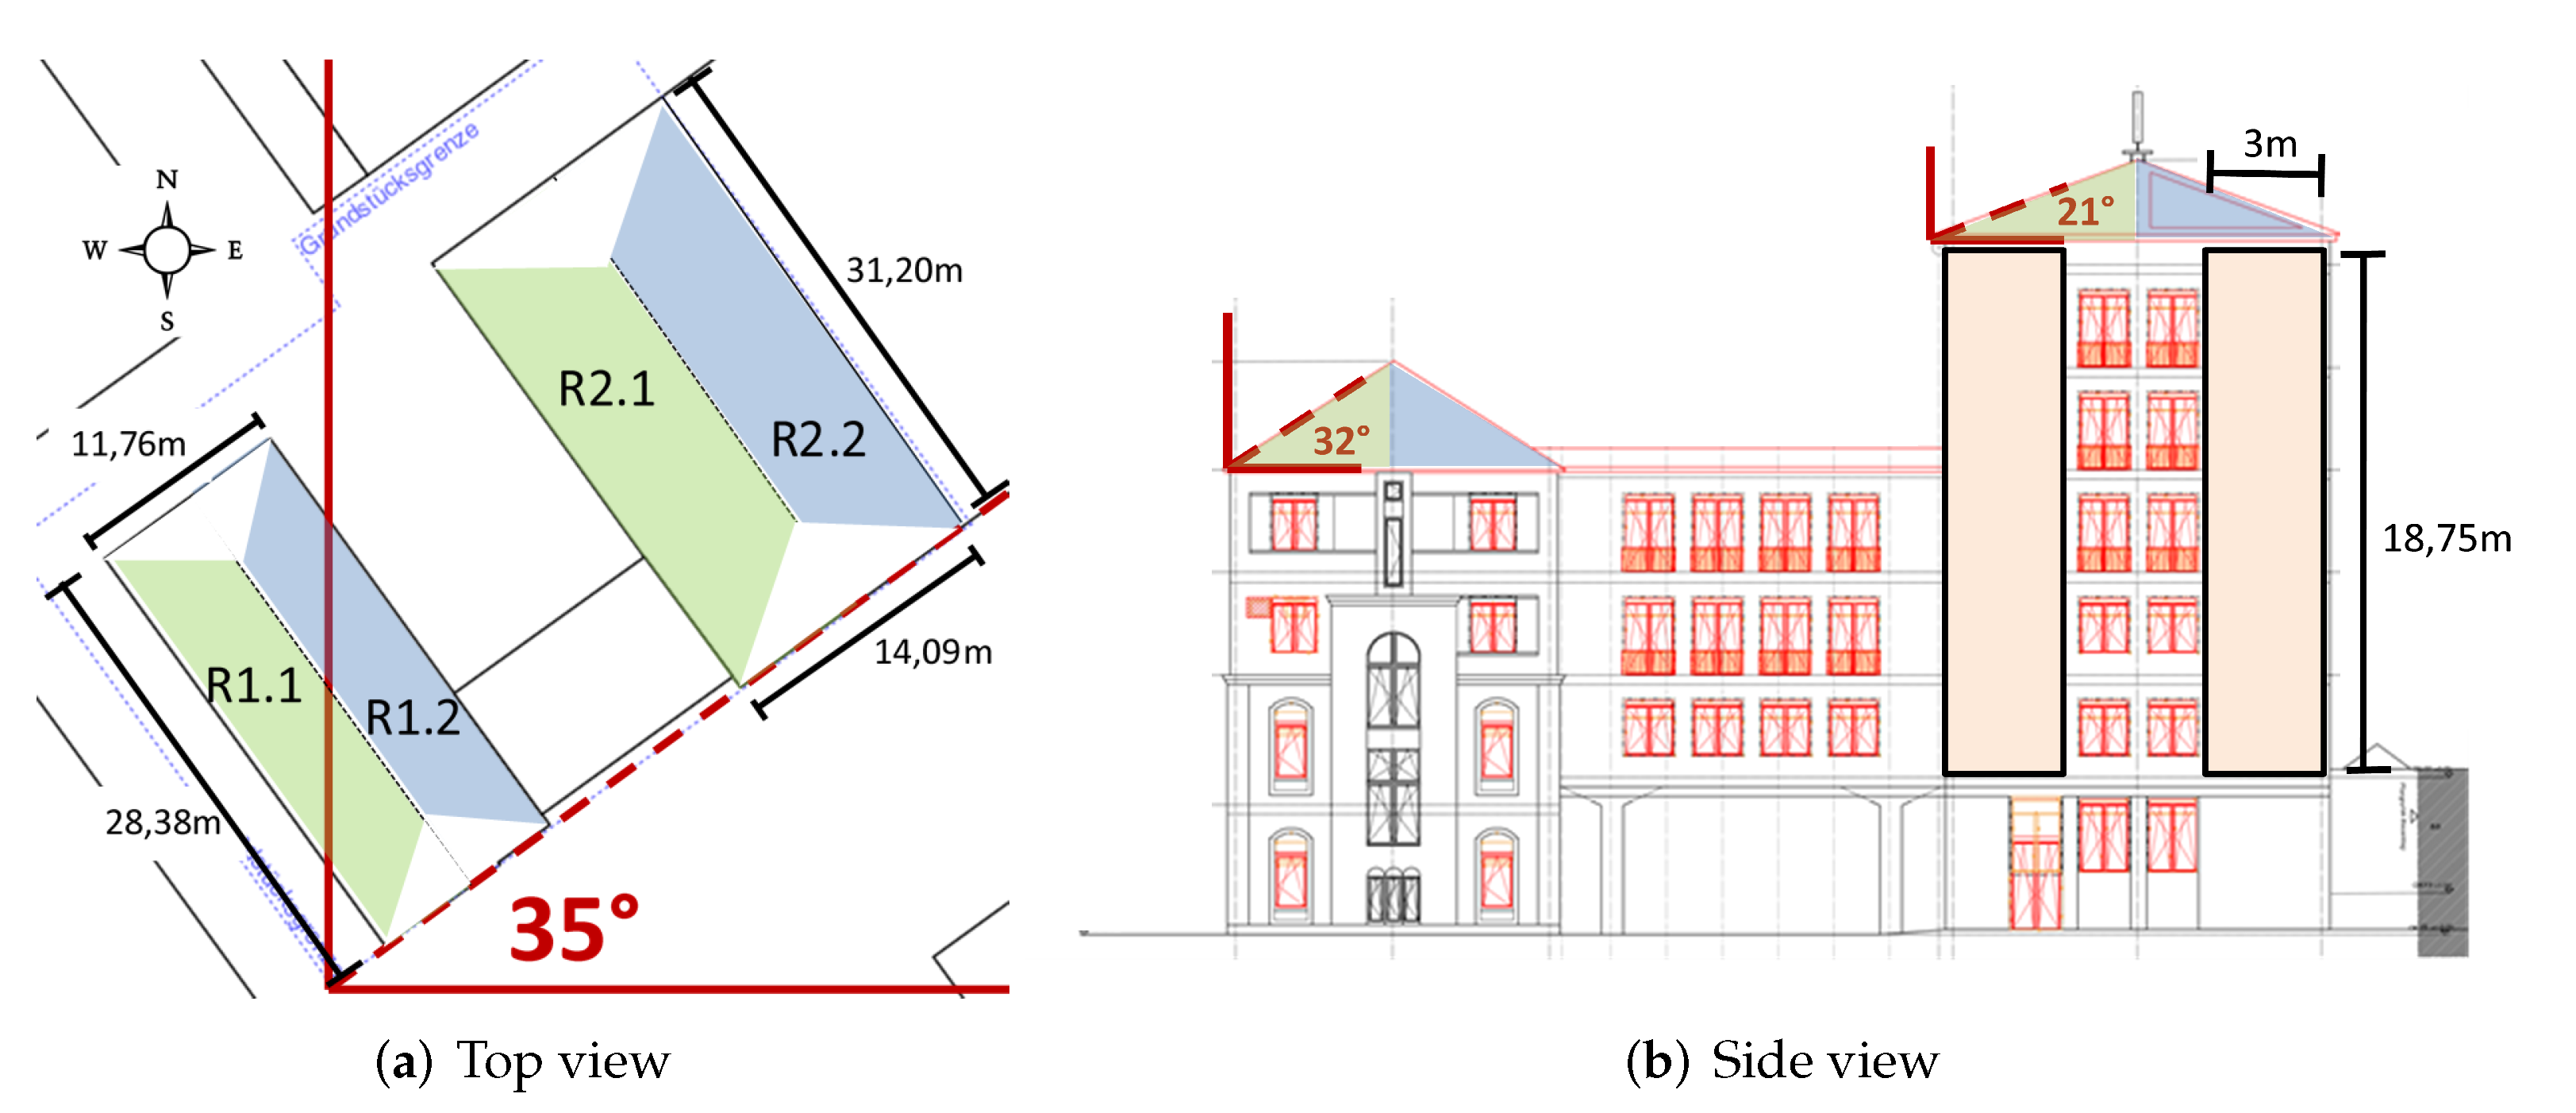
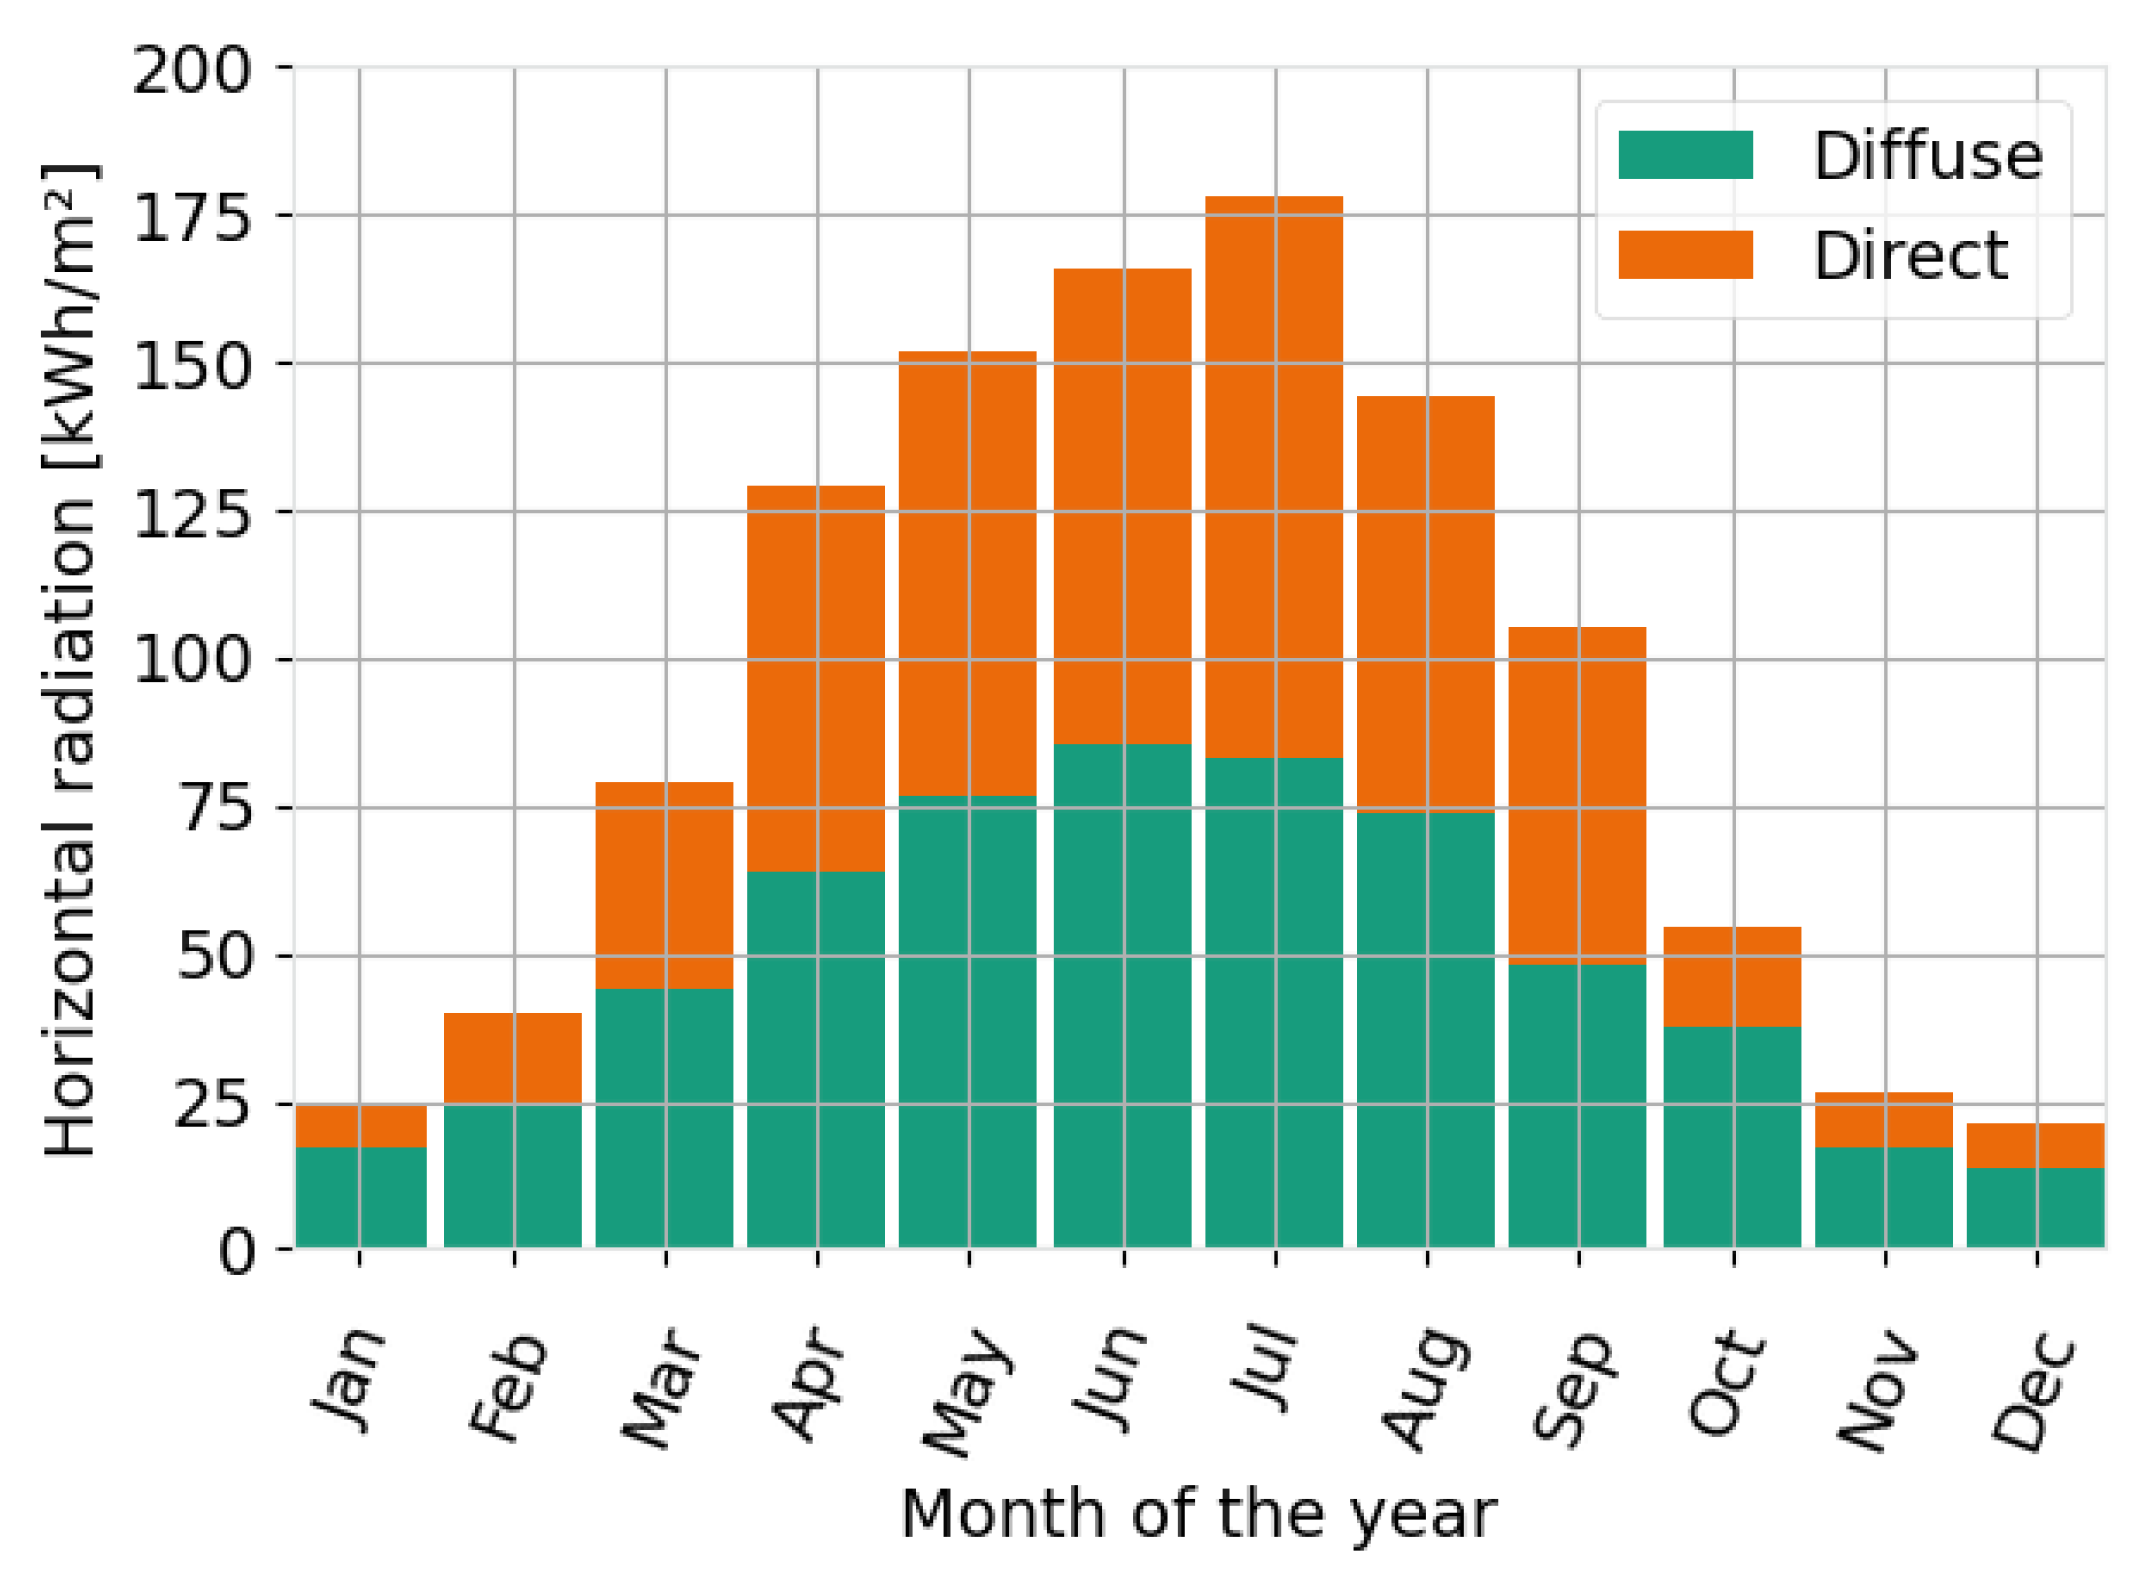
The sizing of the PV system was based on the available roof and facade area for the selected showcase building, and the financial incentive for feed-in enumeration, to limit the size to below 40kWp. Four roof-mounted and one facade PV system with different azimuth and declination angles were simulated. The different available roof areas, together with the number of installed PV panels, are listed in Table A1. The PV module parameters are listed in Table A2. The geometry is shown in Figure A2. For each geometry, a time series was simulated using simulation models based on [52,53]. The input weather data test reference years (TRY) for Kaiserslautern were obtained from the Deutscher–Wetterdienst (DWD) [63]. The corresponding radiation data are shown in Figure A3. All PV modules were positioned so that shading losses were close to zero, since no higher buildings are present in the direct proximity. For the facade-installed PV modules, an albedo of the surrounding area of 0.2 (grass + asphalt) was considered.
Figure A2. PV system geometry of the 5 different areas available for PV, rooftop area shaded in green and blue, facade area shaded in orange.
Electricity 03 00007 g0a2
Figure A3. Solar radiation on horizontal surface for the used test reference year. Annual global radiation sums up to 1120 kWh/m 2 .
Electricity 03 00007 g0a3
Table A1. PV system distribution on the different areas.
Roof/FacadeR1.1R1.2R2.1R2.2FacadeTotal
Max. available area [ m 2 ]1821822752751121026
Number of modules2010361524105
Capacity installed [kWp]7.63.813.75.79.139.9
Table A2. PV module parameters.
AttributeLengthWidthPowerEfficiencyType
Value1763 mm1040 mm380 W21% *Monocrystalline SI
* +power dependant losses of inverters and cables (approx. 95%).

Appendix A.4. Business, Commerce and Service Units

For simplicity reasons, the business, commerce and service units were aggregated into one row for teams 17–27 within Table 2. However, individual units were simulated as listed in Table A3. The areas within the different units were chosen based on the areas available in the construction blueprints, resulting in the following distribution: 27% group offices, 22% staircases, 16% large office area, 7% meeting rooms, 6% lobby, 6% canteen, 5% event rooms, 5% toilets, 3% corridors, 2% kitchens, 1% storage space.
Table A3. Detailed extension of Table 2.
Team171819202122
TypeOfficeOfficeOfficeOfficeOfficeOffice
Annual demand [kWh]262035544086305121833297
Team232425262717-27
TypeOfficeOfficeCoffee shopOfficeOfficeSum
Annual demand [kWh]4797324252344994227339331

Appendix B. Details on the User Interface

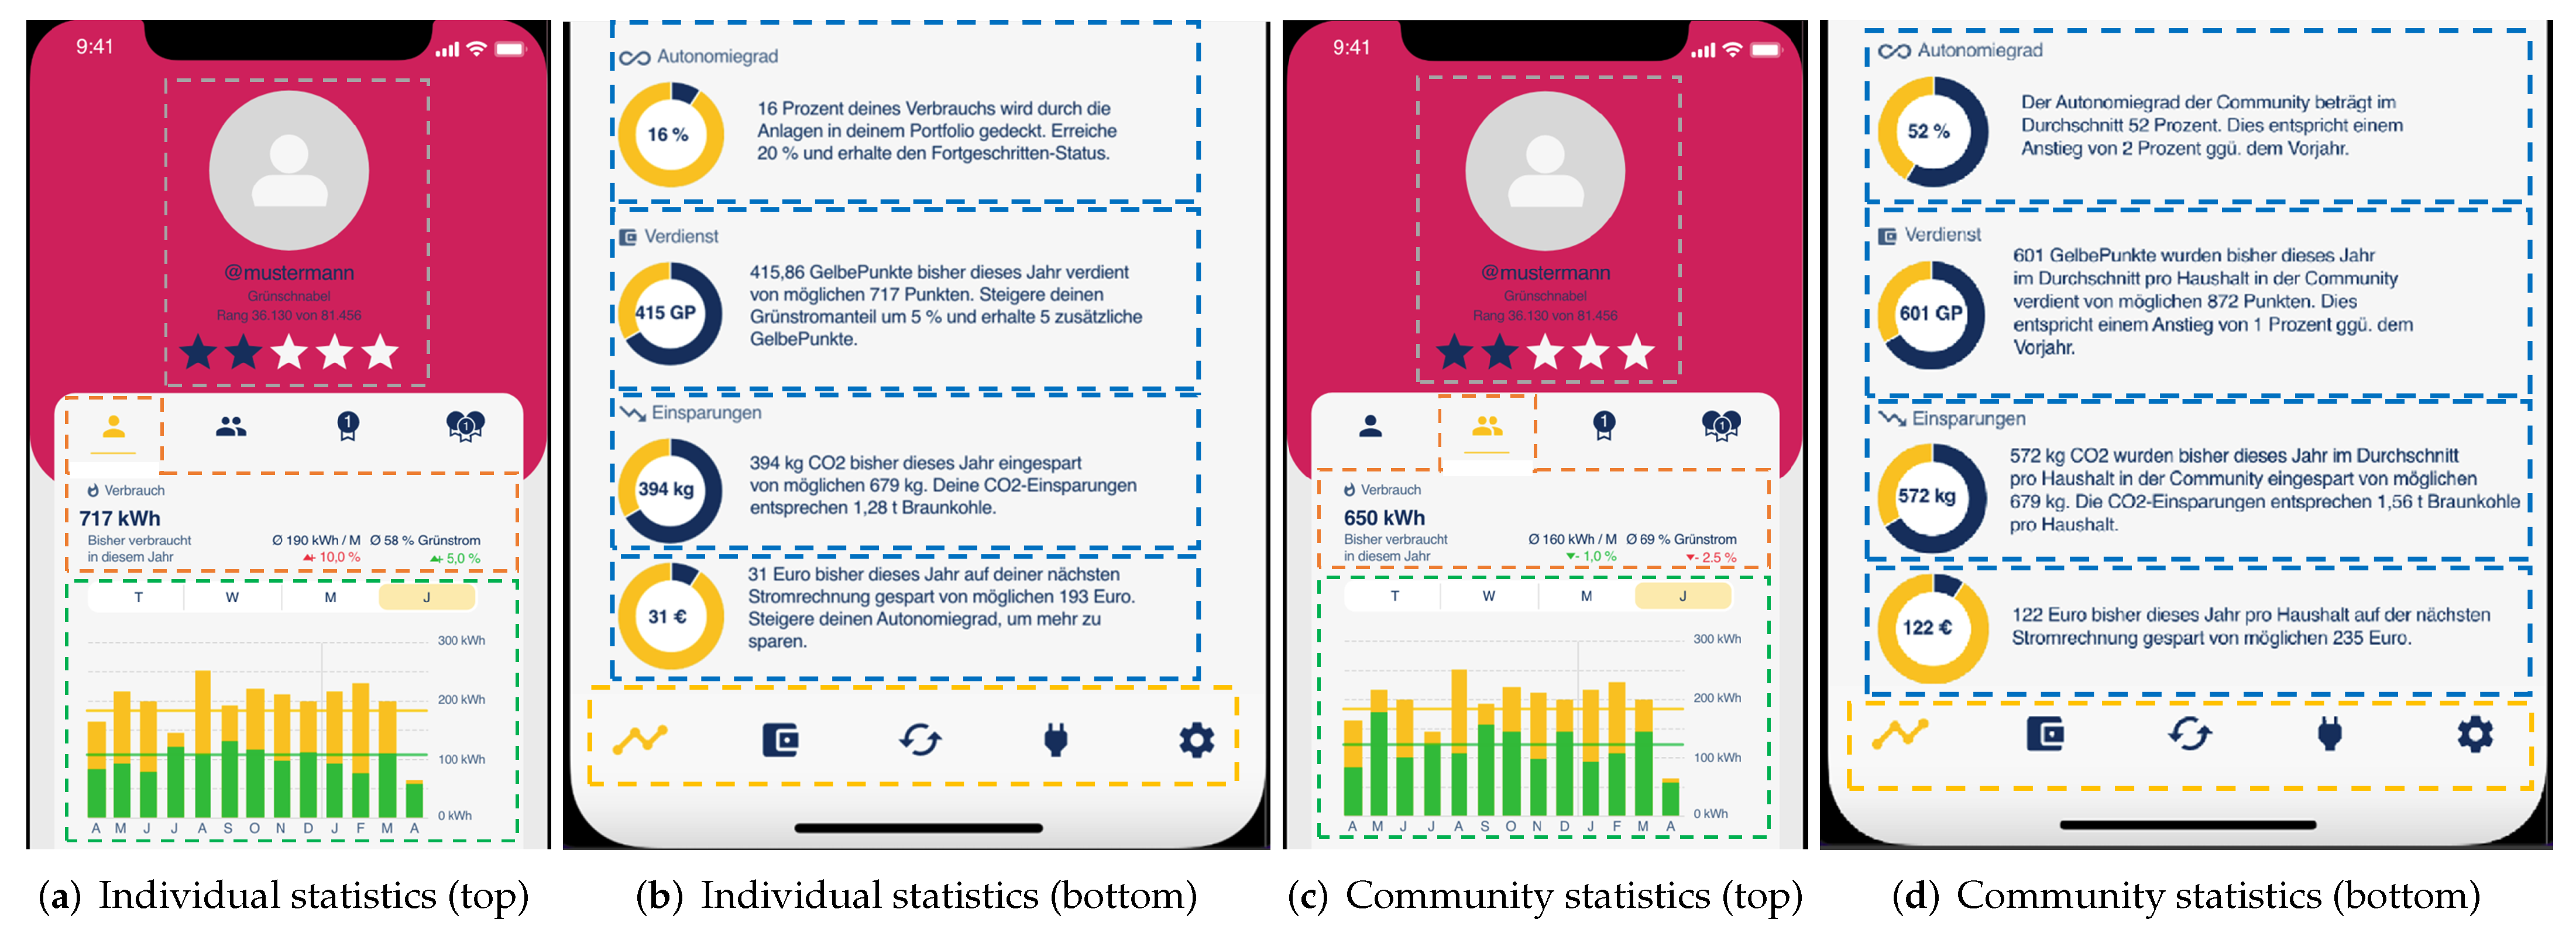
This part provides additional information on the Pfaff Energy Community App, as mentioned in Section 4.3, and briefly shown in Figure 3. In Figure A4a,b, the individual statistics are shown, while Figure A4c,d show the community perspective. The gray boxes (Figure A4a,c) show the user profile and current ranking within the energy community (based on individual PV utilization). In the orange boxes, the annual individual consumption (Figure A4a) and community consumption (Figure A4c) are presented, together with the amount of PV and external grid energy consumed (and the current trend). In the green boxes, a bar plot shows the energy utilization for the past 12 month. The blue boxes list for the individual prosumer (Figure A4b) and the community (Figure A4d) from top to bottom:
  • Self-sufficiency (for the individual view: together with the next target to reach a higher rank)
  • Earned tokens as a share of the maximum possible tokens (when consumption and production match perfectly)
  • C O 2 saved compared to the maximum savings possible when consuming 100% of the local solar production. (Note that this is a theoretical value calculated for the area of the community. In fact it does not matter where the PV energy is consumed as long as PV energy replaces a fossil energy source, so feeding into the grid is still saving C O 2 )
  • Cost savings on the electricity bill
Finally, some functions to exchange green energy tokens for PV asset tokens or to redeem tokens for other bonuses are provided in the yellow box (Figure A4b,d).
Figure A4. Detailed view of the Pfaff Energy Community App.
Electricity 03 00007 g0a4

References

  1. Henni, S.; Staudt, P.; Weinhardt, C. A sharing economy for residential communities with PV-coupled battery storage: Benefits, pricing and participant matching. Appl. Energy 2021, 301, 117351. [Google Scholar] [CrossRef]
  2. Norbu, S.; Couraud, B.; Robu, V.; Andoni, M.; Flynn, D. Modeling economic sharing of joint assets in community energy projects under LV network constraints. IEEE Access 2021, 9, 112019–112042. [Google Scholar] [CrossRef]
  3. BMWi. Mieterstrom: Energiewende im eigenen Haus. 2017. Available online: https://www.bmwi.de/Redaktion/DE/Artikel/Energie/mieterstrom.html (accessed on 16 February 2022).
  4. Lowitzsch, J.; Hoicka, C.E.; van Tulder, F.J. Renewable energy communities under the 2019 European Clean Energy Package—Governance model for the energy clusters of the future? Renew. Sustain. Energy Rev. 2020, 122, 109489. [Google Scholar] [CrossRef]
  5. Davidson, C.; Steinberg, D.; Margolis, R. Exploring the market for third-party-owned residential photovoltaic systems: Insights from lease and power-purchase agreement contract structures and costs in California. Environ. Res. Lett. 2015, 10, 024006. [Google Scholar] [CrossRef]
  6. Bruck, M.; Sandborn, P.; Goudarzi, N. A Levelized Cost of Energy (LCOE) model for wind farms that include Power Purchase Agreements (PPAs). Renew. Energy 2018, 122, 131–139. [Google Scholar] [CrossRef]
  7. Gjorgievski, V.Z.; Cundeva, S.; Georghiou, G.E. Social arrangements, technical designs and impacts of energy communities: A review. Renew. Energy 2021, 169, 1138–1156. [Google Scholar] [CrossRef]
  8. Radl, J.; Fleischhacker, A.; Revheim, F.H.; Lettner, G.; Auer, H. Comparison of profitability of PV electricity sharing in renewable energy communities in selected European countries. Energies 2020, 13, 5007. [Google Scholar] [CrossRef]
  9. Roberts, M.B.; Bruce, A.; MacGill, I. A comparison of arrangements for increasing self-consumption and maximising the value of distributed photovoltaics on apartment buildings. Sol. Energy 2019, 193, 372–386. [Google Scholar] [CrossRef]
  10. Tervo, E.; Agbim, K.; DeAngelis, F.; Hernandez, J.; Kim, H.K.; Odukomaiya, A. An economic analysis of residential photovoltaic systems with lithium ion battery storage in the United States. Renew. Sustain. Energy Rev. 2018, 94, 1057–1066. [Google Scholar] [CrossRef]
  11. Wang, Z.; Gu, C.; Li, F. Flexible operation of shared energy storage at households to facilitate PV penetration. Renew. Energy 2018, 116, 438–446. [Google Scholar] [CrossRef]
  12. Yazdanie, M.; Orehounig, K. Advancing urban energy system planning and modeling approaches: Gaps and solutions in perspective. Renew. Sustain. Energy Rev. 2021, 137, 110607. [Google Scholar] [CrossRef]
  13. Li, S.; Pan, Y.; Xu, P.; Zhang, N. A decentralized peer-to-peer control scheme for heating and cooling trading in distributed energy systems. J. Clean. Prod. 2021, 285, 124817. [Google Scholar] [CrossRef]
  14. Fernandez, E.; Hossain, M.; Mahmud, K.; Nizami, M.S.H.; Kashif, M. A Bi-level optimization-based community energy management system for optimal energy sharing and trading among peers. J. Clean. Prod. 2021, 279, 123254. [Google Scholar] [CrossRef]
  15. Das, L.; Munikoti, S.; Natarajan, B.; Srinivasan, B. Measuring smart grid resilience: Methods, challenges and opportunities. Renew. Sustain. Energy Rev. 2020, 130, 109918. [Google Scholar] [CrossRef]
  16. Warneryd, M.; Håkansson, M.; Karltorp, K. Unpacking the complexity of community microgrids: A review of institutions’ roles for development of microgrids. Renew. Sustain. Energy Rev. 2020, 121, 109690. [Google Scholar] [CrossRef]
  17. Heaslip, E.; Costello, G.J.; Lohan, J. Assessing Good-Practice Frameworks for the Development of Sustainable Energy Communities in Europe: Lessons from Denmark and Ireland. J. Sustain. Dev. Energy Water Environ. Syst. 2016, 4, 307–319. [Google Scholar] [CrossRef] [Green Version]
  18. Reijnders, V.M.; Laan, M.D.V.D.; Dijkstra, R. Energy communities: A Dutch case study. Behind Beyond Meter. 2020, 137–155. [Google Scholar] [CrossRef]
  19. Kobashi, T.; Yoshida, T.; Yamagata, Y.; Naito, K.; Pfenninger, S.; Say, K.; Takeda, Y.; Ahl, A.; Yarime, M.; Hara, K. On the potential of “Photovoltaics+ Electric vehicles” for deep decarbonization of Kyoto’s power systems: Techno-economic-social considerations. Appl. Energy 2020, 275, 115419. [Google Scholar] [CrossRef]
  20. Directive (EU) 2019/944 of the European Parliament and of the Council of 5 June 2019 on Common Rules for the Internal Market for Electricity. Available online: https://eur-lex.europa.eu/legal-content/EN/TXT/?uri=CELEX%3A32019L0944 (accessed on 16 February 2022).
  21. Karystinos, C.; Vasilakis, A.; Kotsampopoulos, P.; Hatziargyriou, N. Local Energy Exchange Market for Community Off-Grid Microgrids: Case Study Los Molinos del Rio Aguas. Energies 2022, 15, 703. [Google Scholar] [CrossRef]
  22. Wolsink, M. Distributed energy systems as common goods: Socio-political acceptance of renewables in intelligent microgrids. Renew. Sustain. Energy Rev. 2020, 127, 109841. [Google Scholar] [CrossRef]
  23. Bandeiras, F.; Pinheiro, E.; Gomes, M.; Coelho, P.; Fernandes, J. Review of the cooperation and operation of microgrid clusters. Renew. Sustain. Energy Rev. 2020, 133, 110311. [Google Scholar] [CrossRef]
  24. Milchram, C.; Künneke, R.; Doorn, N.; van de Kaa, G.; Hillerbrand, R. Designing for justice in electricity systems: A comparison of smart grid experiments in the Netherlands. Energy Policy 2020, 147, 111720. [Google Scholar] [CrossRef]
  25. Jiang, Y.; Zhou, K.; Lu, X.; Yang, S. Electricity trading pricing among prosumers with game theory-based model in energy blockchain environment. Appl. Energy 2020, 271, 115239. [Google Scholar] [CrossRef]
  26. Su, W. The Role of Customers in the U.S. Electricity Market: Past, Present and Future. Electr. J. 2014, 27, 112–125. [Google Scholar] [CrossRef]
  27. Richter, M. Utilities’ business models for renewable energy: A review. Renew. Sustain. Energy Rev. 2012, 16, 2483–2493. [Google Scholar] [CrossRef]
  28. Guajardo, J.A. Third-party ownership business models and the operational performance of solar energy systems. Manuf. Serv. Oper. Manag. 2018, 20, 788–800. [Google Scholar] [CrossRef]
  29. Chronis, A.G.; Palaiogiannis, F.; Kouveliotis-Lysikatos, I.; Kotsampopoulos, P.; Hatziargyriou, N. Photovoltaics Enabling Sustainable Energy Communities: Technological Drivers and Emerging Markets. Energies 2021, 14, 1862. [Google Scholar] [CrossRef]
  30. Andoni, M.; Robu, V.; Flynn, D.; Abram, S.; Geach, D.; Jenkins, D.; McCallum, P.; Peacock, A. Blockchain technology in the energy sector: A systematic review of challenges and opportunities. Renew. Sustain. Energy Rev. 2019, 100, 143–174. [Google Scholar] [CrossRef]
  31. Di Silvestre, M.L.; Gallo, P.; Guerrero, J.M.; Musca, R.; Sanseverino, E.R.; Sciumè, G.; Vásquez, J.C.; Zizzo, G. Blockchain for power systems: Current trends and future applications. Renew. Sustain. Energy Rev. 2020, 119, 109585. [Google Scholar] [CrossRef]
  32. Lüth, A.; Zepter, J.M.; del Granado, P.C.; Egging, R. Local electricity market designs for peer-to-peer trading: The role of battery flexibility. Appl. Energy 2018, 229, 1233–1243. [Google Scholar] [CrossRef] [Green Version]
  33. Tsao, Y.C.; Thanh, V.V. Toward sustainable microgrids with blockchain technology-based peer-to-peer energy trading mechanism: A fuzzy meta-heuristic approach. Renew. Sustain. Energy Rev. 2021, 136, 110452. [Google Scholar] [CrossRef]
  34. Wang, S.; Xu, Z.; Ha, J. Secure and decentralized framework for energy management of hybrid AC/DC microgrids using blockchain for randomized data. Sustain. Cities Soc. 2022, 76, 103419. [Google Scholar] [CrossRef]
  35. Antonopolous, A.M.; Wood, G. Mastering Ethereum: Building Smart Contracts and DApps, 1st ed.; O’Reilly UK Ltd.: Farnham, UK, 2018. [Google Scholar]
  36. Heckelmann, M. Zulässigkeit und Handhabung von Smart Contracts; Neue Juristische Wochenschrift (NJW), Verlag C.H.BECK oHG: München, Germany, 2018; p. 504. [Google Scholar]
  37. Kaulartz, M. Rechtliche Grenzen bei der Gestaltung von Smart Contracts; DSRI-Tagungsband, Verlag C.H.BECK oHG: München, Germany, 2016; p. 504. [Google Scholar]
  38. Köhler, M.; Arndt, H.W.; Fetzer, T. Recht des Internet, 7th ed.; C.F. Müller: Heidelberg, Germany, 2016. [Google Scholar]
  39. Lo, Y.C.; Medda, F. Assets on the blockchain: An empirical study of Tokenomics. Inf. Econ. Policy 2020, 53, 100881. [Google Scholar] [CrossRef]
  40. Esmaeilian, B.; Sarkis, J.; Lewis, K.; Behdad, S. Blockchain for the future of sustainable supply chain management in Industry 4.0. Resour. Conserv. Recycl. 2020, 163, 105064. [Google Scholar] [CrossRef]
  41. Nakamoto, S. Bitcoin: A Peer-to-Peer Electronic Cash System. 2017. Available online: https://bitcoin.org/bitcoin.pdf (accessed on 16 February 2022).
  42. Westerkamp, M.; Victor, F.; Küpper, A. Tracing manufacturing processes using blockchain-based token compositions. Digit. Commun. Networks 2020, 6, 167–176. [Google Scholar] [CrossRef]
  43. Mihaylo, M.; Jurado, S.; Avellana, N.; Van Moffaert, K.; de Abril, I.; Nowe, A. NRGcoin: Virtual currency for trading of renewable energy in smart grids. In Proceedings of the 11th International Conference on the European Energy Market, Krakow, Poland, 28–30 May 2014; pp. 1–6. [Google Scholar] [CrossRef]
  44. Aitzhan, N.; Svetinovic, D. Security and privacy in decentralized energy trading through multi-signatures, blockchain and anonymous messaging streams. Trans. Dependable Secur. Comput. 2018, 15, 840–852. [Google Scholar] [CrossRef]
  45. Sikorski, J.; Haughton, J.; Kraft, M. Blockchain technology in the chemical industry: Machine-to-machine electricity market. Appl. Energy 2017, 195, 234–246. [Google Scholar] [CrossRef]
  46. Al Kawasmi, E.; Arnautovic, E.; Svetinovic, D. Bitcoin-based decentralized carbon emissions trading infrastructure model. Syst. Eng. 2015, 18, 115–130. [Google Scholar] [CrossRef]
  47. EnStadt:Pfaff: Innovatives Energie- und Mobilitätskonzept mit Bundesweiter Strahlkraft. 2020. Available online: https://www.kaiserslautern.de/buerger_rathaus_politik/medienportal/pressemitteilungen/057464/index.html.de (accessed on 16 February 2022).
  48. Pfaff Reallabor. 2022. Available online: https://pfaff-reallabor.de/ (accessed on 16 February 2022).
  49. Fischer, D.; Harbrecht, A.; Surmann, A.; McKenna, R. Electric vehicles’ impacts on residential electric local profiles—A stochastic modelling approach considering socio-economic, behavioural and spatial factors. Appl. Energy 2019, 233-234, 644–658. [Google Scholar] [CrossRef]
  50. Fischer, D.; Härtl, A.; Wille-Haussmann, B. Model for electric load profiles with high time resolution for German households. Energy Build. 2015, 92, 170–179. [Google Scholar] [CrossRef]
  51. Wittwer, C.; Wille-Haussmann, B.; Fischer, D.; Köpfer, B.; Bercher, S.; Engelmann, P.; Ohr, F. synGHD-Synthetische Lastprofile für eine Effiziente Versorgungsplanung für nicht-Wohngebäude; Technical Report; Fraunhofer ISE: Freiburg, Germany, 2020. [Google Scholar] [CrossRef]
  52. Huld, T.; Gottschalg, R.; Beyer, H.G.; Topič, M. Mapping the performance of PV modules, effects of module type and data averaging. Sol. Energy 2010. [Google Scholar] [CrossRef]
  53. King, D.L.; Kratochvil, J.a.; Boyson, W.E. Photovoltaic array performance model. Online 2004, 8, 1–19. [Google Scholar] [CrossRef] [Green Version]
  54. Surmann, A.; Chantrel, S.P.M.; Fischer, D.; Kohrs, R.; Wittwer, C. Stochastic Bottom-Up Framework for Load and Flexibility for Agent Based Controls of Energy Communities; CIRED 2019: Liège, Belgium, 2019. [Google Scholar]
  55. Surmann, A.; Walia, R.; Kohrs, R. Agent-based bidirectional charging algorithms for battery electric vehicles in renewable energy communities. Energy Inform. 2020, 3, 19. [Google Scholar] [CrossRef]
  56. Kost, C.; Shammugam, S.; Fluri, V.; Peper, D.; Davoodi Memar, A.; Schlegel, T. Stromgestehungskosten Erneuerbare Energien. 2021. Available online: https://www.ise.fraunhofer.de/content/dam/ise/de/documents/publications/studies/DE2021_ISE_Studie_Stromgestehungskosten_Erneuerbare_Energien.pdf (accessed on 16 February 2022).
  57. Fraunhofer Institute for Solar Energy Systems ISE. Energy Charts: Annual Electricity Spot Market Prices in Germany. 2020. Available online: https://energy-charts.info (accessed on 16 February 2022).
  58. Renewable Power Generation Costs in 2019. 2020. Available online: https://www.irena.org/publications/2020/Jun/Renewable-Power-Costs-in-2019 (accessed on 16 February 2022).
  59. Sterchele, P.; Brandes, J.; Heilig, J.; Wrede, D.; Kost, C.; Schlegl, T.; Bett, A.; Henning, H.M. Paths to a Climate-Neutral Energy System. The German Energy Transition in Its Social Context; Fraunhofer Institute for Solar Energy Systems ISE: Freiburg, Germany, 2020. [Google Scholar]
  60. Chantrel, S.P.M.; Surmann, A.; Kohrs, R.; Utz, M.; Albrecht, S. Agenten- und Blockchainbasiertes Energiemanagementsystem für Mieterstromobjekte. In Internationaler ETG-Kongress 2019, 08.–09.05.2019 in Esslingen am Neckar; VDE VERLAG GMBH: Esslingen am Neckar, Germany, 2019; pp. 465–470. [Google Scholar]
  61. Koirala, B.P.; van Oost, E.; van der Windt, H. Community energy storage: A responsible innovation towards a sustainable energy system? Appl. Energy 2018, 231, 570–585. [Google Scholar] [CrossRef]
  62. Aikaterini, B.; Jeremy, P.; Sylvester, A. Enabling collective awareness of energy use via a social serious game. EAI Endorsed Trans. Serious Games 2017, 4. [Google Scholar] [CrossRef] [Green Version]
  63. Bundesamt für Bauwesen und Raumordnung, Deutscher Wetterdienst. Ortsgenaue Testreferenzjahre von Deutschland für Mittlere, Extreme und Zukünftige Witterungsverhältnisse. 2017. Available online: https://www.bbsr.bund.de/BBSR/DE/forschung/programme/zb/Auftragsforschung/5EnergieKlimaBauen/2013/testreferenzjahre/01-start.html;jsessionid=5D9912D230EB887C1F831671303A8A0F.live21304?nn=2544408&pos=2 (accessed on 16 February 2022).
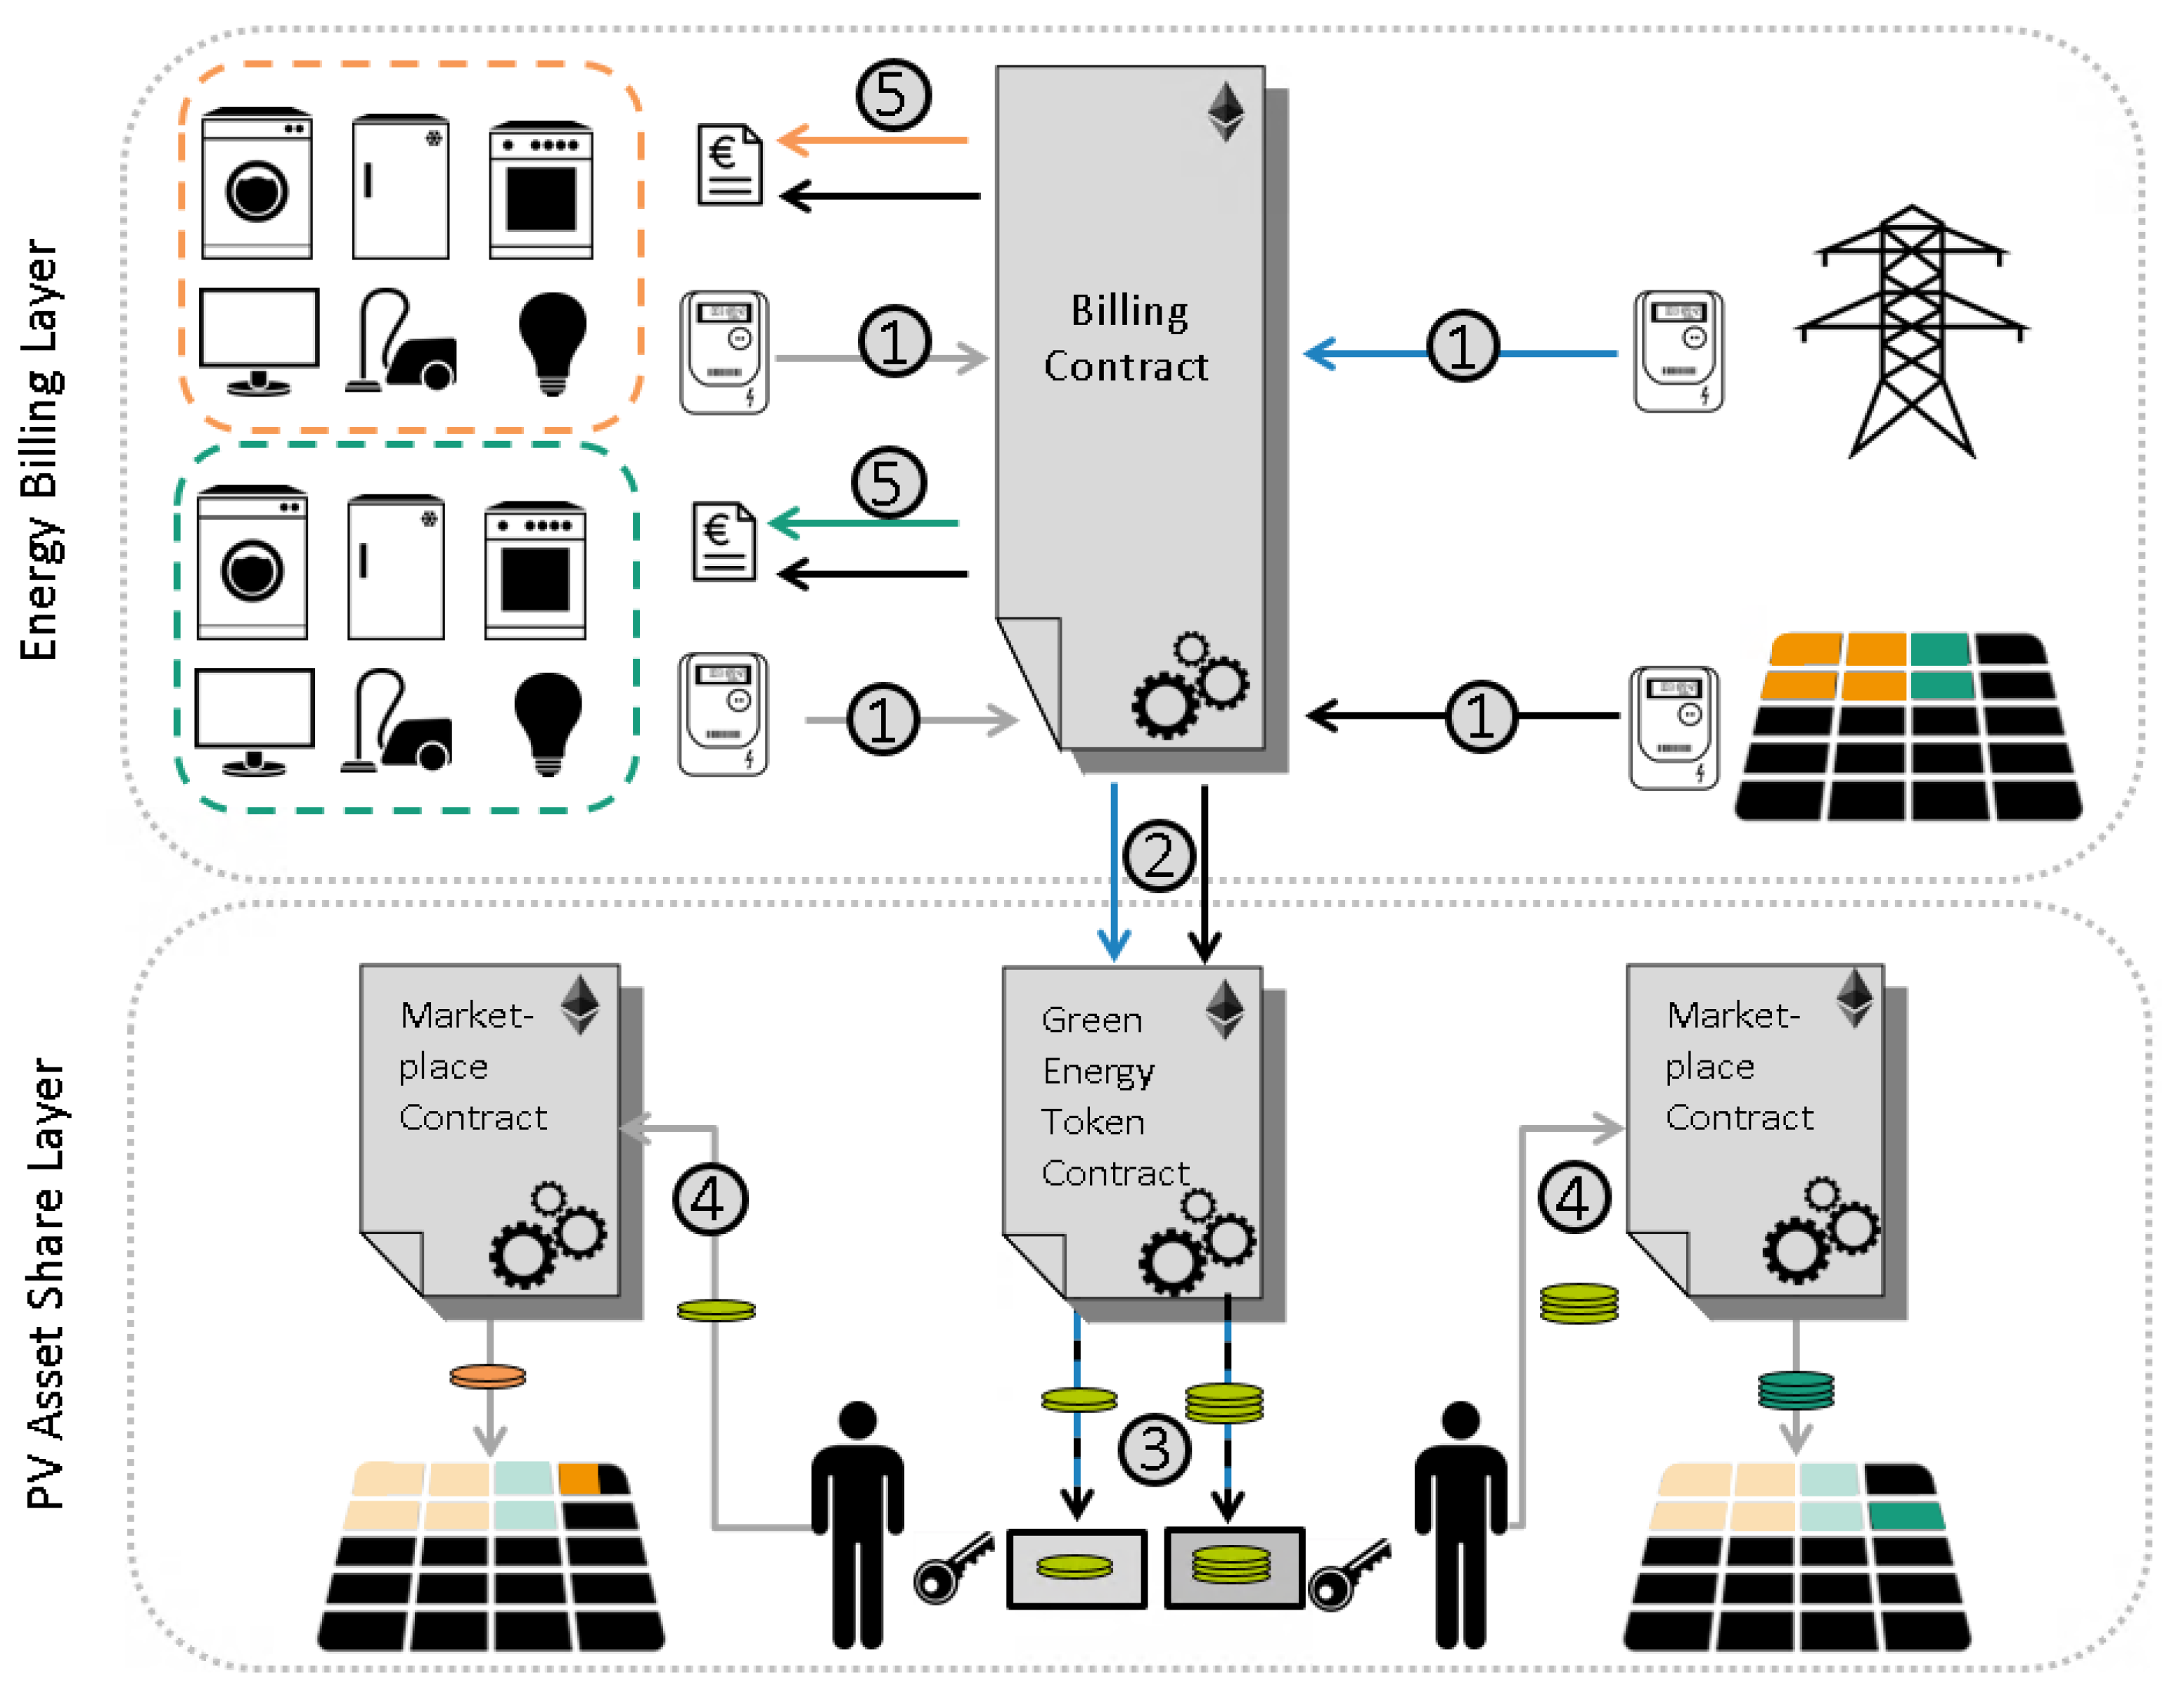
Figure 1. PAOS Software Layers. Orange and green colors represent the device stock, PV shares, asset tokens, and el. bills of two exemplary members. Step 1: El. consumption is sent to billing contract. Step 2: Information on grid and PV el. shares is sent to the GET contract. Step 3: GET are sent to the member wallets. Step 4: GET are redeemed on the market place contract in exchange for PV asset tokens. 5: Bills are calculated and sent to the members.
Electricity 03 00007 g001
Figure 2. Schematic overview of the billing smart contract. Negative values represent consumption, positive production. Smart meter team data aggregation in dotted red box includes: Step 1: transfer of SM measurements. Step 2: Team level aggregation (e.g., T1: −4 + 2 = −2). Utility PV distribution in dotted blue box includes: Step 3 and 4: First iteration (T1: 2 < 3.5 > 2 PV, 0 G, remaining: 5 PV). Step 5 and 6: Second iteration (T2: 6 > 5 > 5 PV, 1 G). (T:Team, U: Utility, PV: PV energy consumed, G: Grid energy consumed).
Electricity 03 00007 g002
Figure 3. Prosumer status in the Pfaff Energy Community App.
Electricity 03 00007 g003
Figure 4. Exemplary stacked energy flows for Tteam 14 on a summer’s day, where 50% of the PV shares are owned by the community. Positive values represent PV energy, and negative value loads. In the upper part, the corresponding token rewards and bills are shown. * Load covered by utility grid includes externally produced energy which is taken from the public grid, ** Residual = ∑ PV + ∑ load (with load < 0). (All data based on 15-min resolution).
Electricity 03 00007 g004
Figure 5. Cash flow and ROI time for the utility and PV share development for utility and community. Dashed lines represent the baseline scenarios; solid lines the managed scenarios.
Electricity 03 00007 g005
Figure 6. Self-consumption share and self-sufficiency share for the overall community, including internally exchanged energy by different teams. Shaded areas represent the 25% and 75% quantile.
Electricity 03 00007 g006
Table 1. Classification of blockchain token.
DescriptionNative TokenApplication Token
Token transmissionlinear or circularlinear or circular
Available Quantityunlimited or limitedlimited
Fungibilityfungiblefungible or non-fungible
Duration of Validityunrestrictedrestricted
Transferabilitytransferabletransferable or non-transferable
Table 2. Simulation setup.
TeamApartment/Commercial UnitBattery Electric Vehicle (BEV)
Type *OccupancyAnnualNominalBatteryAnnual
DemandPowerSizeDemand
[-][-][kWh][kW][kWh][kWh]
1Student1550---
2Student183822852397
3Student11095---
4Apprentice1958---
5Apprentice1142211511354
6Single parent21665---
7Retired217493.76.8479
8Retired21576---
9Part time worker22233---
10Full time worker215921151882
11Full time worker21717--
12Family437642222.951409
13Family43523--
14Family431502213.61663
15Family43400--
16Family436462215.51472
17–27Offices-2183 ... 5234---
OverallBuilding & BEVs-113,531113.8245.859656
UtilityPV-46,112 **40 **--
* Main occupant type is also main user of the BEV. ** Annual PV production provided together with the PV plant nominal power.
Table 3. Economic assumptions.
ParameterValueSource *
Utility costs…
for PV installation1075 €/kWpaverage balance of system costs [56] page 11
for PV O&M860 €/a= 21.5 €/(kW * a) * 40 kW [56] page 13
gifting PV energy7.735 ct/kWh6.5 ct EEG levy + 19% vat
selling PV energy11.25 ct/kWh6.5 ct EEG levy + 19% vat on end user el. price
buying from EPEX3.05 ct/kWhDay ahead average 2020 [57]
selling grid energy23.43 ct/kWhConsidering taxes, surcharges, and EPEX **
Utility profit from…
feed in tariff6.88 ct/kWh= (0.0703 €/kW * 10 kW + 0.0683 €/kW
* 30 kW)/40 kW [Bundesnetzagentur]
selling PV energy18.49 ct/kWh= 29.74 ct/kWh − 11.25 ct/kWh
End user…
electricity price29.74 ct/kWhLocal utility base tariff
monthly fee11.72 €/monthLocal utility base tariff
* All values based on November 2021 data access. ** In detail: EPEX day ahead of price average (3.05 ct), grid usage fee (4.4 ct), concession fee (1.59 ct), EEG surcharge (6.5 ct), KWK surcharge (0.254 ct), §19 StromNEV-Umlage (0.432 ct), offshore grid surcharge (0.395 ct), surcharge for disconnectable loads (0.009 ct), electricity surcharge (2.05 ct), and VAT (19%).
Table 4. Key motivators of the involved community parties.
Building (Co-)OwnerUtility CompanyCom. Members
RoleAllows the installation of building integrated PV systemsFinances, builds, owns and operates the PV plants and the RECIncorporate the REC by being customers of the utility
Motivation & Benefit• Fulfills legal requirements to dedicate a fraction of the roof to solar systems• Becomes a REC service provider• Become prosumers
• Improves rating of the buildings energy performance certificate• Incites prosumers to activate flexibility when needed• Comprehend the fluctuation of renewables and adjust their behavior
• No capital needed• Improves image• Save costs
• Apartments become more attractive• Encourages customers for long term cooperation• Consume local and renewable
• Participates in the energy transition• Scales up its RE production capacity• Participate in the energy transition
Table 5. Classification of green energy and PV asset token.
DescriptionGreen Energy TokenPV Asset Token
Type of useNative Token—rewardApplication Token—
for desired behaviorrepresents PV plant shares
Token Transmissionlinearcircular
Available Quantityunlimitedlimited
Fungibilityfungiblefungible
Duration of Validityunrestrictedrestricted to PV plant lifetime
Transferabilitytransferablenon-transferable
Table 6. Key performance indicators of the simulation results.
ROICommunity el.Self-consumption share (SCS)
Utilitybill reductionBuilding∑ individual shares
Scenario[month]2036All years20212036
controlled5724%69%5%54%
baseline5123%61%5%52%
Time [month] to reachSelf-sufficiency share (SSS)
community PV share ofBuilding∑ individual shares
50%100%All years20212036
controlled4815338%3%30%
baseline6616733%3%29%
Table 7. Development of the tenant annual bills.
TeamMode12 *10 *111314 *27Overall
2022controlled304109887065011651533102328,101
baseline304109286865011651537102328,092
2027controlled2799767545731017129379023,061
baseline27910297915731014135678523,320
2036+**controlled271921710555966120572621,441
baseline2671009768555953128970521,678
2036 2022 2022 controlled–11%–16%–18%–15%–17%–21%–29%–24%
baseline–12%–8%–12%–15%–18%–16%–31%–23%
* These teams own a flexible electric vehicle ** All shares owned by community members result in a constant bill for all following years.
Publisher’s Note: MDPI stays neutral with regard to jurisdictional claims in published maps and institutional affiliations.