
Article

Association Between Air Quality and Major Respiratory Diseases in Relation to Particulate Matter (PM10, PM2.5) and Gaseous Pollutants in Iğdır, Türkiye
by
Melahat Batu Ağırkaya
1,
Fatma Şencan
2 and
Mehmet Ali Çelik
3,4,*
1
Finance, Banking and Insurance Program, Iğdır University, Iğdır 76000, Türkiye
2
Elective Education Center, Istanbul Medipol University; İstanbul 34810, Türkiye
3
Department of Geography, Faculty of Science and Letters, Iğdır University, Iğdır 76000, Türkiye
4
Department of Geography, Nakhchivan State University, AZ 7012 Nakhchivan, Azerbaijan
*
Author to whom correspondence should be addressed.
Pollutants 2026, 6(3), 41; https://doi.org/10.3390/pollutants6030041
Submission received: 17 June 2026 / Revised: 30 July 2026 / Accepted: 3 August 2026 / Published: 5 August 2026

Abstract

This study examines the long-term associations between ambient air pollutants and the burden of major respiratory and infectious diseases in this geographically sensitive region. A retrospective analysis was conducted using ICD-10-coded hospital records of patients diagnosed with asthma, chronic obstructive pulmonary disease (COPD), bronchitis, and tuberculosis from January 2020 to June 2026. These data were integrated with in situ air quality measurements, including PM10, PM2.5, and SO2, as well as satellite-derived Aerosol Optical Depth (AOD) from MODIS. Disease incidence was stratified by year, sex, and age groups (0–85+ years) to assess demographic susceptibility patterns. Respiratory diseases constituted a substantial public health burden over the study period. Asthma showed a marked female predominance (≈29,700 females vs. ≈16,000 males) and a bimodal age distribution with peaks in early childhood (0–5 years) and mid-adulthood (35–50 years). COPD was predominantly observed in males (≈8300 males vs. ≈5500 females), with a higher median age range (≈67–70 years). Bronchitis exhibited a similar bimodal pattern, disproportionately affecting both pediatric and elderly populations, while overall case numbers declined over time. Tuberculosis incidence was approximately threefold higher in males than females, with notable age-related divergence, affecting younger females (≈30–32 years) and middle-aged males (≈42–45 years). The findings suggest a spatial–temporal correspondence between elevated pollutant concentrations and respiratory disease prevalence in the Iğdır Basin. The observed sex- and age-specific disparities underscore the potential value of region-specific environmental health strategies, strengthened air quality management, and continuous epidemiological surveillance in enclosed basin environments.

1. Introduction

Factors such as urbanization, industrialization, economic development and population growth have made air pollution a significant global public health problem [1,2,3]. Air pollution increases the incidence of health problems such as respiratory disorders, stroke, coronary diseases, and dementia [4]. According to the World Health Organization (WHO), millions of premature deaths each year are associated with air pollution, with the respiratory system being the most sensitive target organ system to these pollutants [5,6]. In particular, criterion pollutants such as PM10, PM2.5, and SO2 are associated with the incidence and clinical severity of chronic respiratory diseases such as asthma, COPD, and bronchitis, as well as infectious diseases such as tuberculosis, through oxidative stress, inflammation, and airway remodeling [7,8]. Topographically closed basin systems restrict atmospheric circulation, increasing pollutant accumulation and causing air quality to reach critical levels, especially under temperature inversion conditions [9,10]. This situation leads to the trapping of anthropogenic emissions in near-surface layers, increasing respiratory morbidity on a local scale. The Iğdır Basin in the Eastern Anatolia Region of Türkiye is a typical microclimatic system characterized by a high air pollution load due to its depression morphology surrounded by high mountains and frequent inversion events [11,12,13]. In the region, dust transport increases PM10 levels during the summer months, while intensive fossil fuel use and atmospheric stability increase PM2.5 and SO2 concentrations during the winter months. However, the long-term and holistic health effects of this multiple pollutant exposure have not been adequately established at the regional level. The epidemiology of respiratory diseases shows significant heterogeneity depending on age and gender. While infectious and allergic diseases are dominant in childhood, the burden of chronic respiratory diseases increases in later life due to decreased pulmonary reserve and immunosenescence. Gender-based differences, interacting with biological characteristics, environmental exposures, and occupational risk factors, lead to significant divergences in disease distribution. In addition, possible changes in diagnostic classifications can make epidemiological interpretation difficult, especially among diseases such as asthma and bronchitis [14,15].
The current literature mostly addresses the relationship between air pollution and respiratory diseases with macro-scale, short-term, or single-pollutant-focused approaches [16,17,18]. This study analyzes the relationship between criterion pollutants such as PM10, PM2.5, and SO2 and cases of asthma, COPD, bronchitis, and tuberculosis in the Iğdır Basin during the period 2020–2026 within an integrated framework. The contribution of this study is the integration of long-term epidemiological records with multi-pollutant exposure data (PM10, PM2.5, and SO2) within the topographically enclosed and microclimatically sensitive Iğdır Basin. Specifically, the study aims to (i) examine the relationship between long-term epidemiological records and ambient air pollution data, (ii) characterize disease patterns according to age- and sex-specific demographic characteristics, and (iii) evaluate potential environment–health interactions within a geographically confined watershed. By combining ground-based air quality measurements, satellite-derived aerosol observations, and demographic epidemiological data within an integrated framework, this study seeks to improve the understanding of multi-pollutant exposure patterns and associated health outcomes in enclosed basin environments. The findings may provide region-specific insights that can contribute to future environmental health assessments and air quality management strategies.

2. Data and Methods

2.1. Study Area

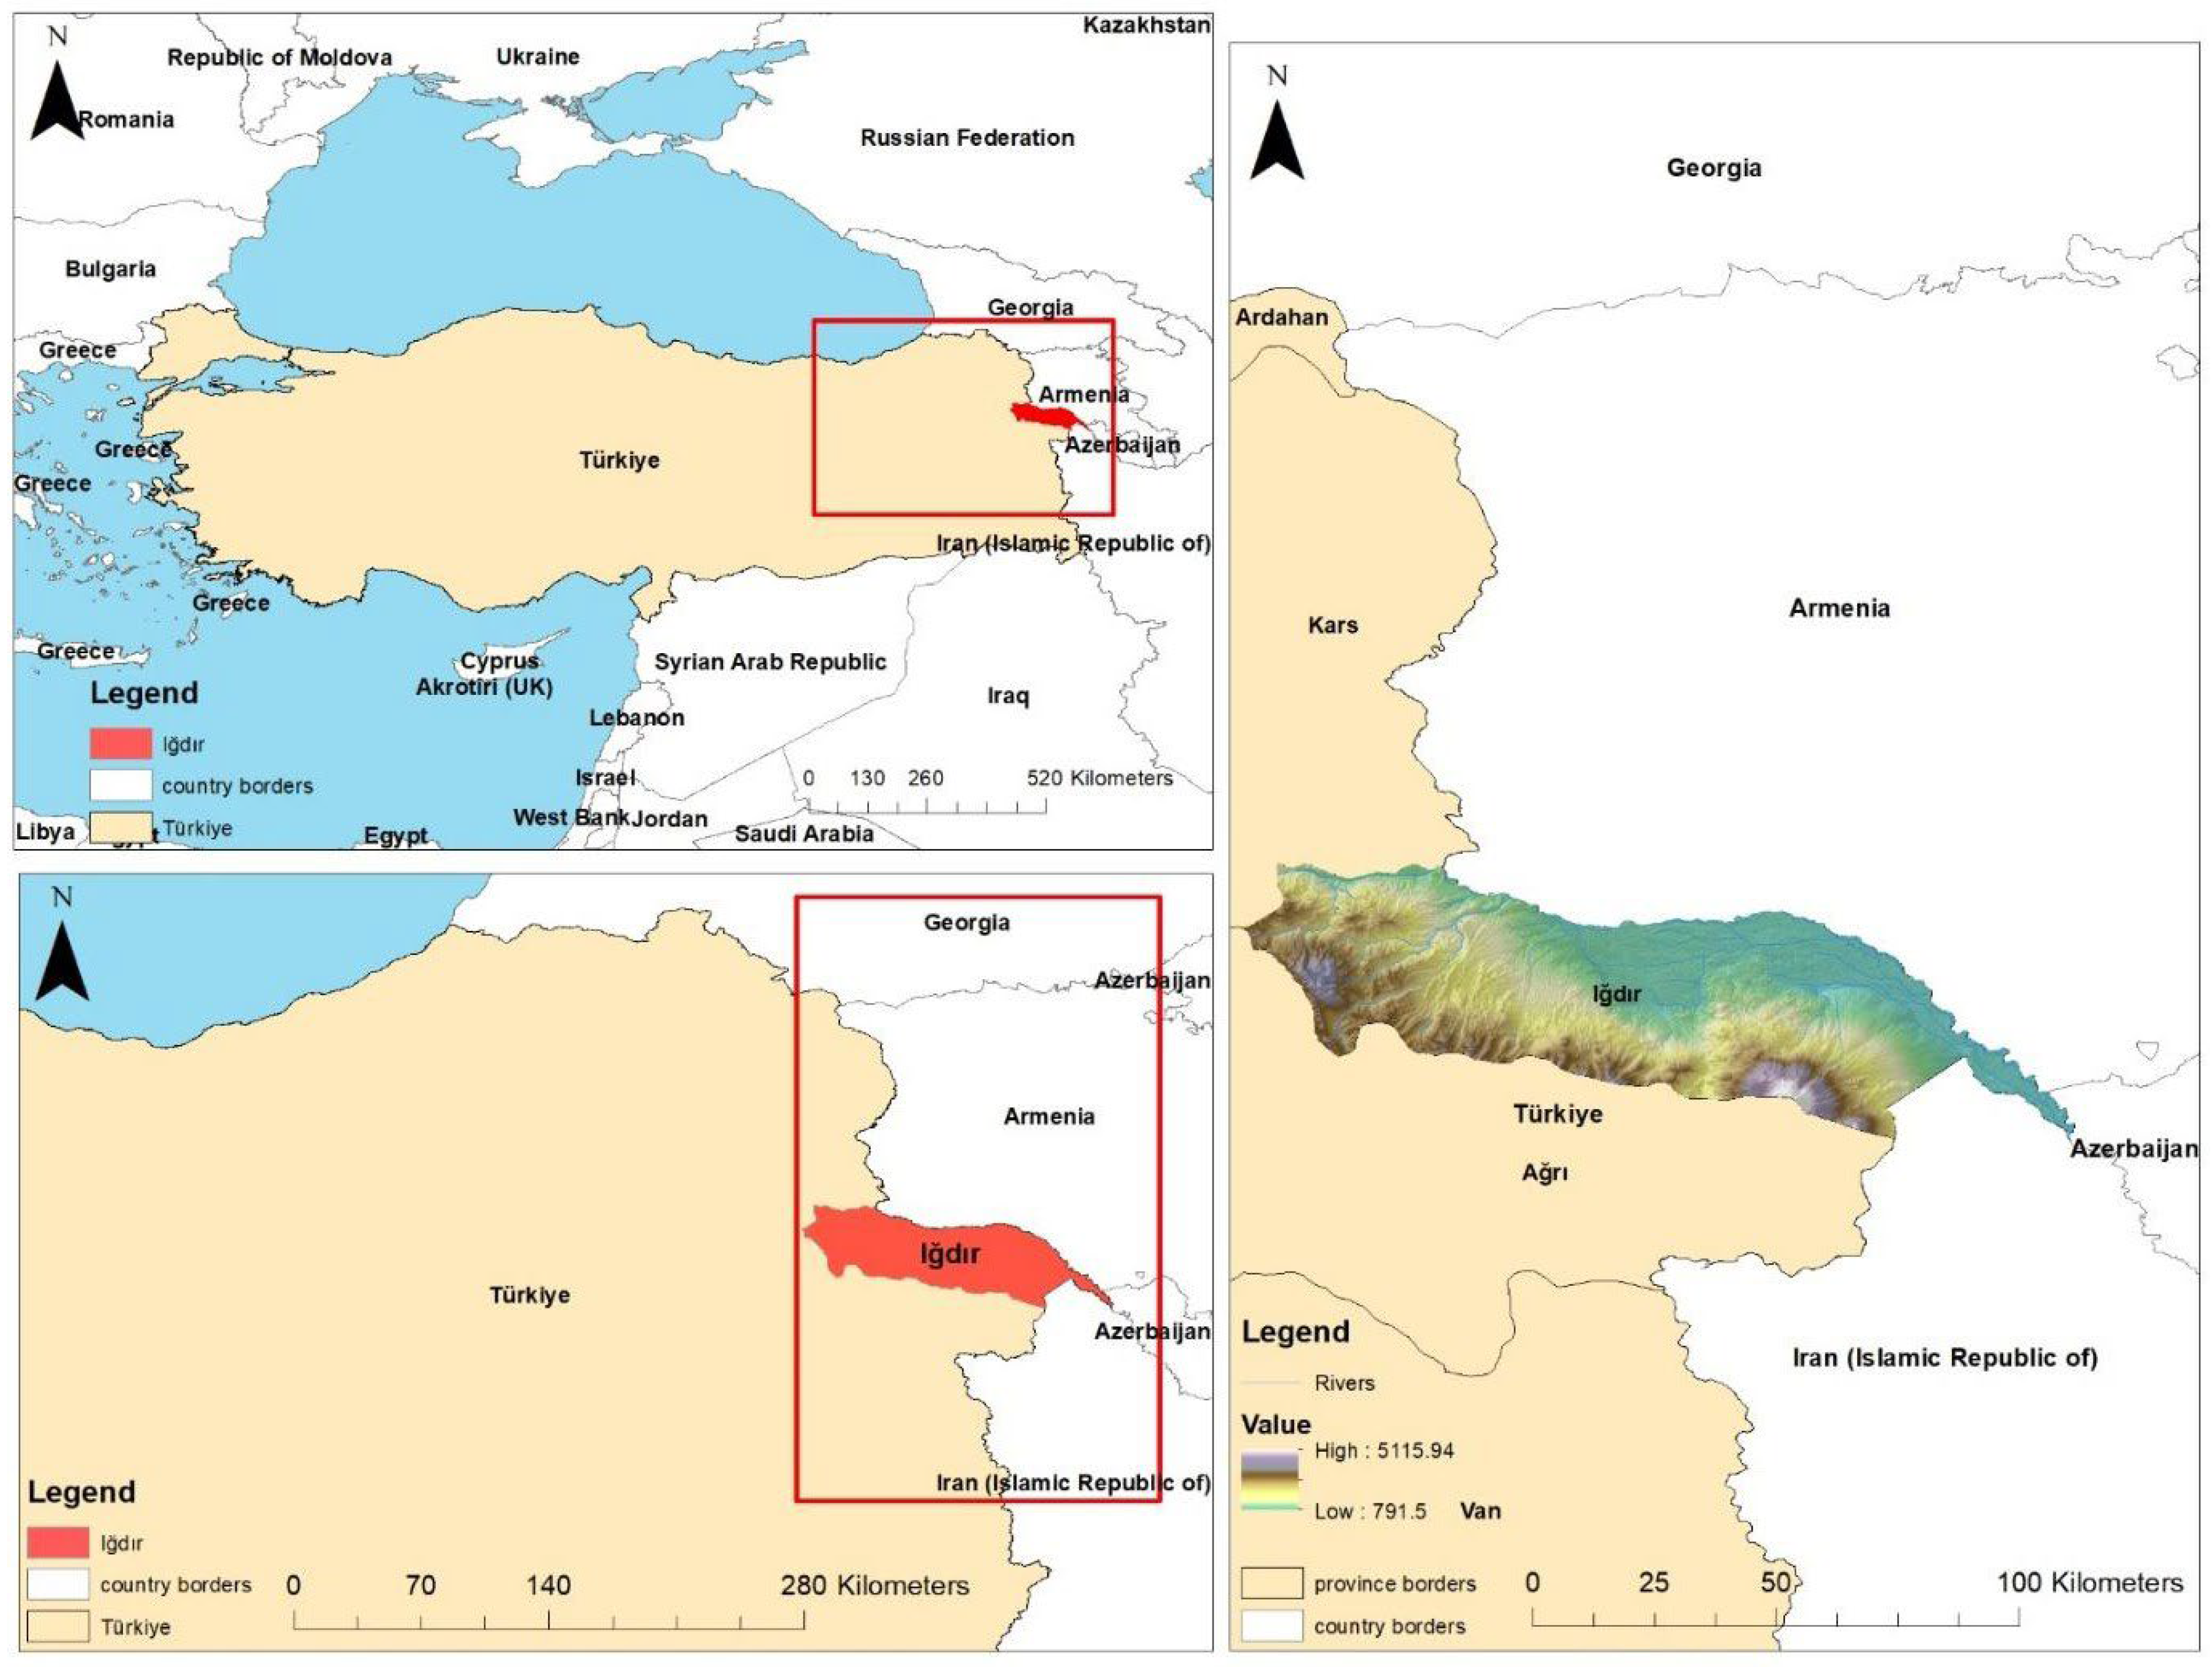
This research was conducted within the borders of Iğdır province in the Eastern Anatolia Region of Türkiye, which exhibits microclimatic basin characteristics and has a depression morphology (Figure 1). Surrounded by high mountain ranges, the research area is a sensitive region (hotspot) where atmospheric pollutants accumulate cumulatively due to its topographic structure that restricts vertical air movements, temperature inversion processes frequently observed in winter months, and surface dust suspensions associated with arid/semi-arid climate characteristics.

2.2. Data and Methods

In this study, two core datasets covering the period from January 2020 to June 2026 were integrated in order to analyze the temporal and holistic dynamics of environment–health interactions (Table 1). This study utilized retrospective patient records from individuals who sought treatment at healthcare facilities in Iğdır Province, covering eight different disease groups (Asthma, COPD, Bronchitis, Tuberculosis, Pneumonia, Lung Cancer, Hydatid Cyst, and Pleurisy) coded according to the International Classification of Diseases, Tenth Revision (ICD-10). The dataset includes demographic information disaggregated by annual case numbers, age groups (0–85+), and gender (female/male). This structure allows for both temporal and population-based analysis of disease burden.
The atmospheric dataset was created from data obtained from the Iğdır measurement station within the scope of the National Air Quality Monitoring Network of the Ministry of Environment, Urbanization and Climate Change of the Republic of Türkiye. In this context, monthly average values of particulate matter concentrations (PM10 and PM2.5) and gaseous pollutants such as SO2 (µg/m3) were included in the analyses. This data allows for the long-term evaluation of regional air quality dynamics.
In addition, MODIS (Moderate Resolution Imaging Spectroradiometer) data were used within the scope of remote sensing-based atmospheric observations. MODIS is a multi-band sensor that monitors atmospheric components on a global scale, and its main products include Aerosol Optical Depth (AOD), cloud properties, water vapor, and atmospheric scattering parameters. MODIS does not directly measure PM2.5 and PM10; instead, it offers an indirect estimation approach through AOD data, which represents the aerosol load in the atmosphere [19,20]. In this approach, AOD values (especially at 550 nm wavelength) are statistically correlated with near-surface particulate matter concentrations; furthermore, PM2.5 and PM10 predictions are improved by including meteorological variables such as humidity, boundary layer height, and temperature in the model. MODIS-based PM products are generally evaluated in two main groups. The first group consists of global-scale model-based products. In these products, PM2.5 concentrations are generated through statistical or machine learning-based models via the integration of MODIS AOD data with meteorological variables and ground station measurements. These products generally provide global PM estimates with spatial resolutions ranging from 0.01° to 0.1°. The second group consists of products based on the MAIAC (Multi-Angle Implementation of Atmospheric Correction) algorithm. This approach provides AOD generation with a resolution of approximately 1 km and obtains higher accuracy PM estimates, especially in urban areas and complex topographic structures. The most important advantages of MODIS-based PM data are its global coverage, its usability in regions where ground station data is limited, and its production of long-term time series extending from 2000 to the present. However, since this data is not direct measurement but model-based indirect estimation, it has some limitations. Factors such as cloud cover, atmospheric conditions, and surface reflectivity can affect accuracy; furthermore, deviations from actual ground-level PM concentrations can be observed. Prediction uncertainty can increase, especially in basin and valley systems with complex topography. In the literature, MODIS-based PM data are widely used in respiratory system diseases (asthma, COPD), air quality trend analyses, long-term air pollution studies, epidemiological modeling, and global mortality research. In this respect, MODIS is considered one of the fundamental remote sensing data sources in large-scale and long-term analyses of environmental exposure–health relationships.
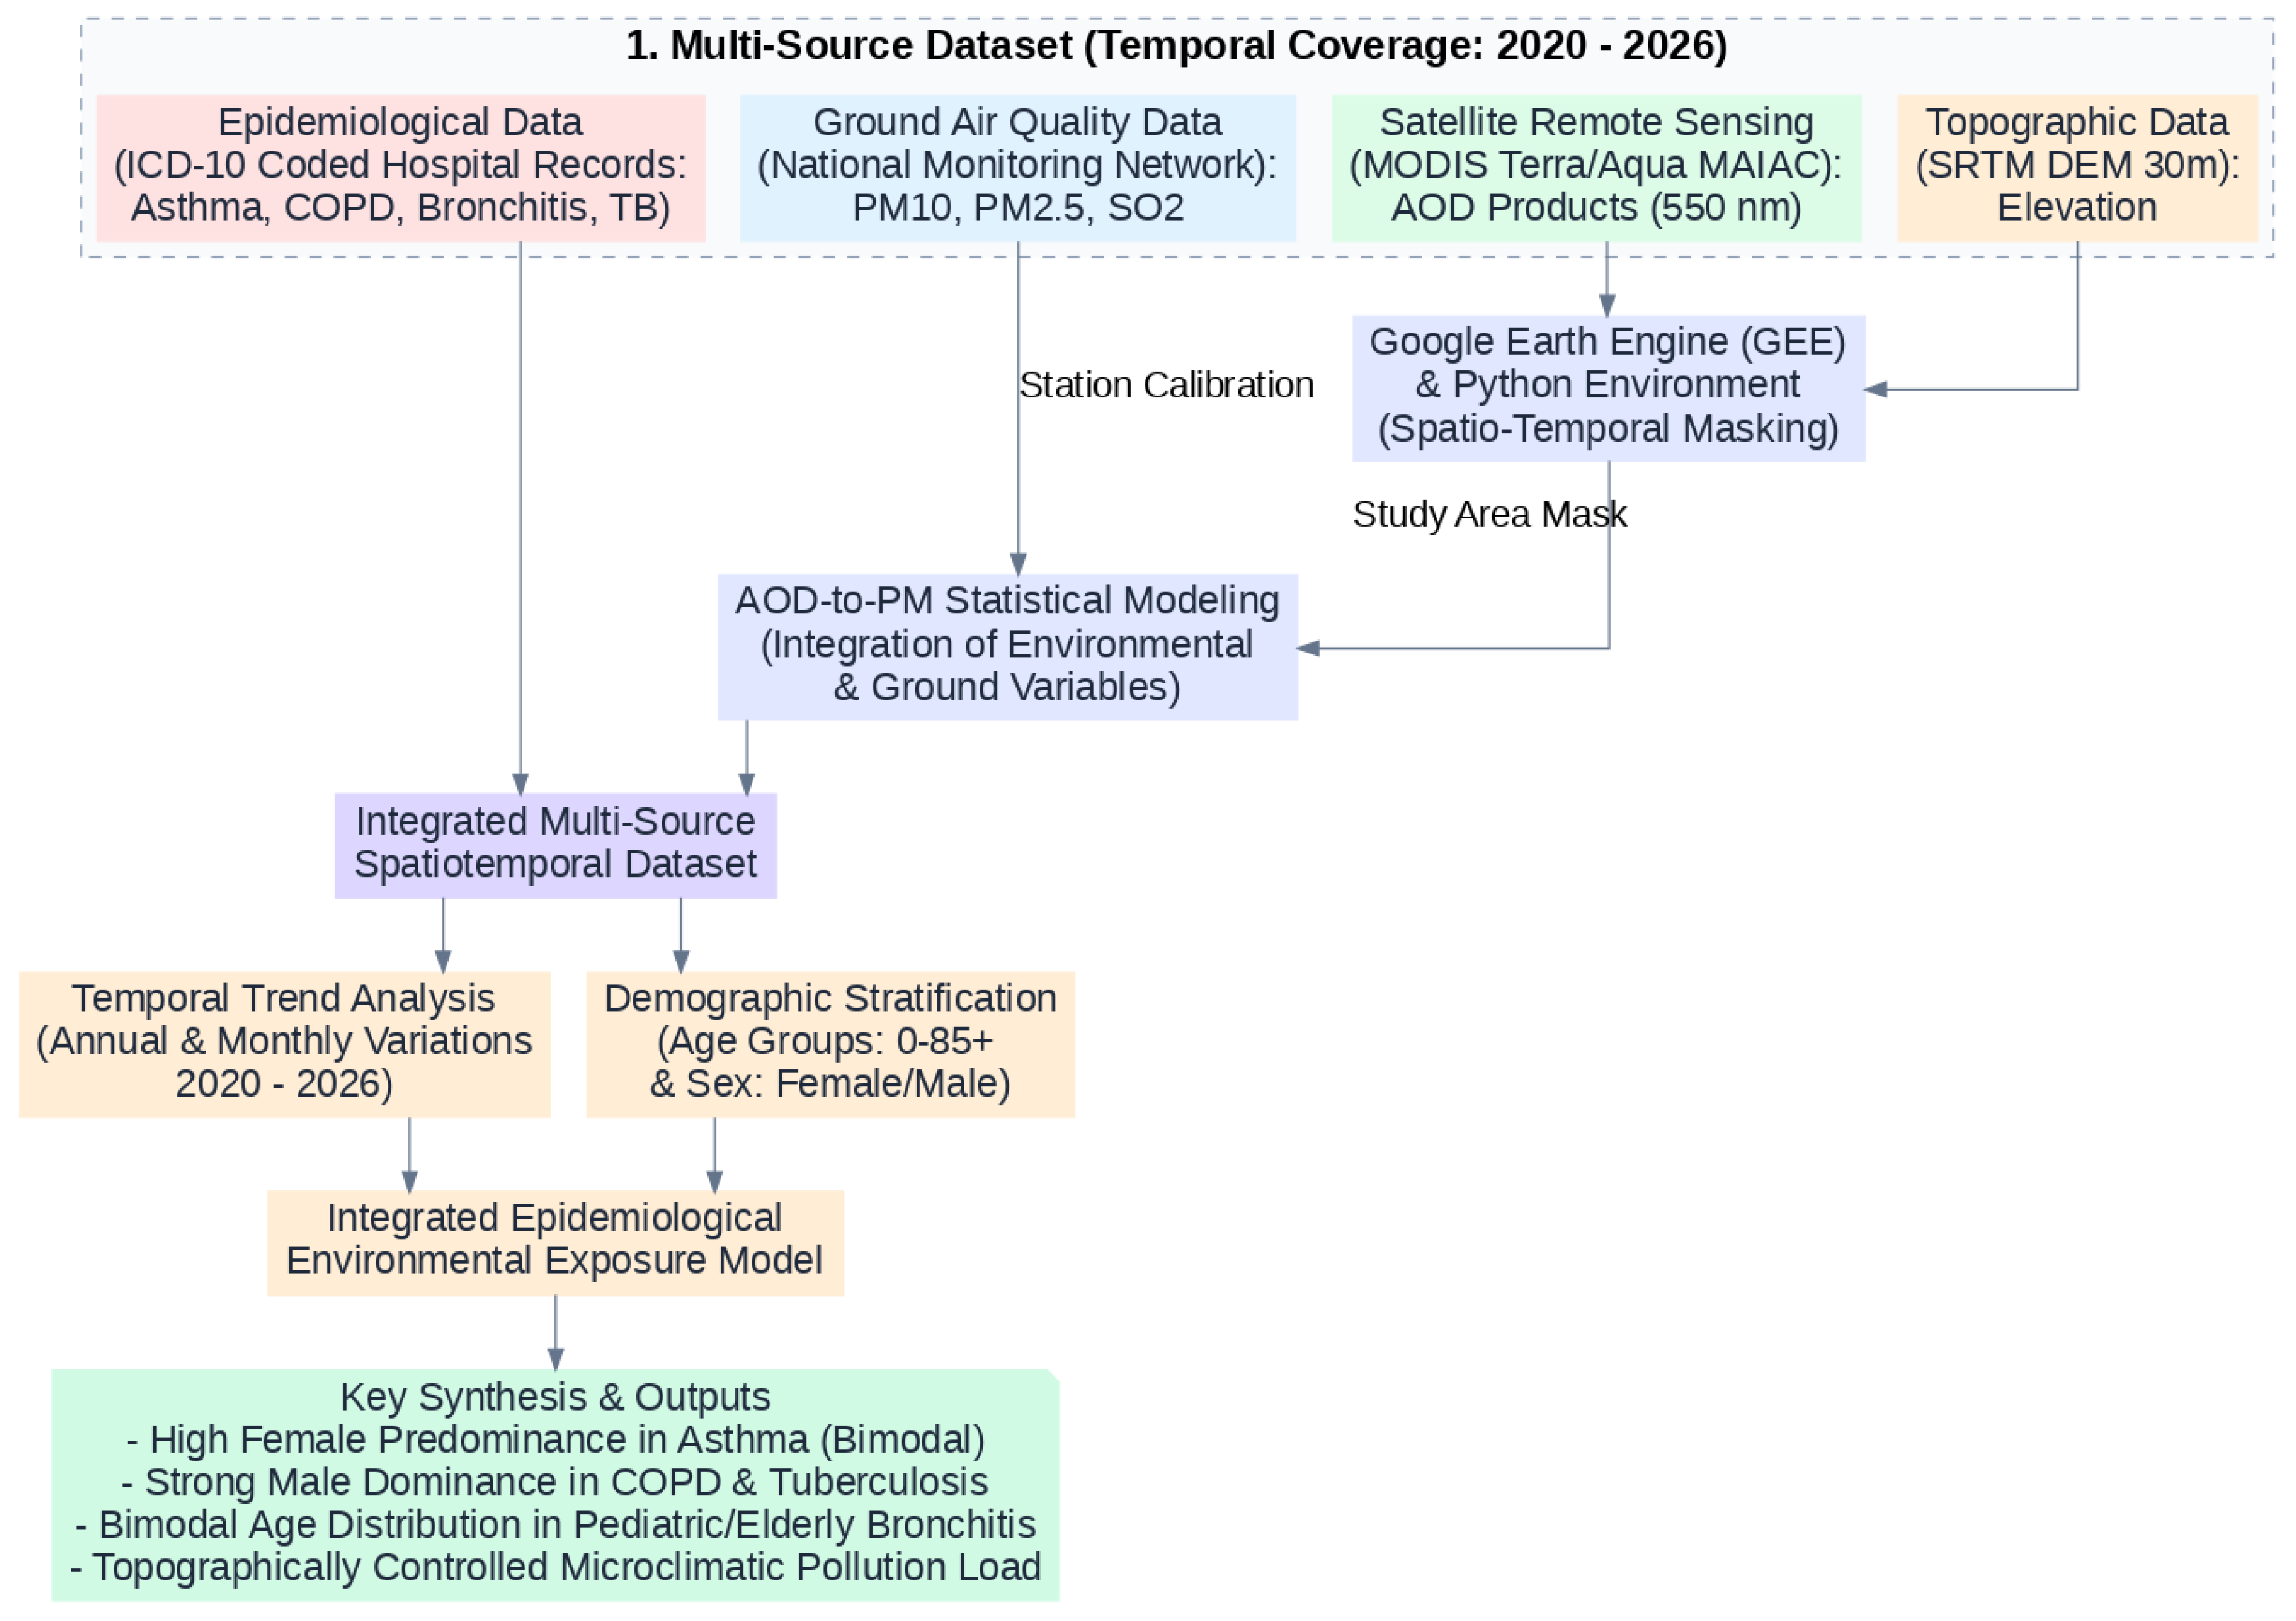
This study employs a multi-source, integrated methodological framework to investigate the relationship between air quality and major respiratory diseases in the Iğdır Basin. The analysis is based on a comprehensive dataset covering the period 2020–2026, which combines ICD-10-coded epidemiological records (asthma, chronic obstructive pulmonary disease, bronchitis, and tuberculosis), ground-based air quality observations (PM10, PM2.5, and SO2) obtained from the national monitoring network, MODIS-derived Aerosol Optical Depth (AOD) products, and 30 m resolution SRTM digital elevation model data. Topographic and satellite-based datasets were processed within the Google Earth Engine (GEE) and Python (version 3.11.9) environments using spatiotemporal masking and harmonization procedures, while ground-station measurements were used for calibration and statistical AOD–PM relationship modeling. The integrated processing pipeline resulted in a unified spatiotemporal database suitable for coupled environmental–epidemiological analysis. Within this framework, both annual and monthly temporal trend analyses were conducted for the 2020–2026 period, alongside demographic stratification by age groups (0–85+ years) and sex to construct an exposure-sensitive epidemiological model. The final analytical phase revealed distinct disease-specific patterns, including a bimodal age distribution with female predominance in asthma, strong male dominance in COPD and tuberculosis cases, and a bimodal distribution of bronchitis affecting both pediatric and elderly populations. These patterns collectively indicate a topography-controlled microclimatic pollution environment in the Iğdır Basin, exerting differentiated health impacts across demographic groups (Figure 2).

3. Results

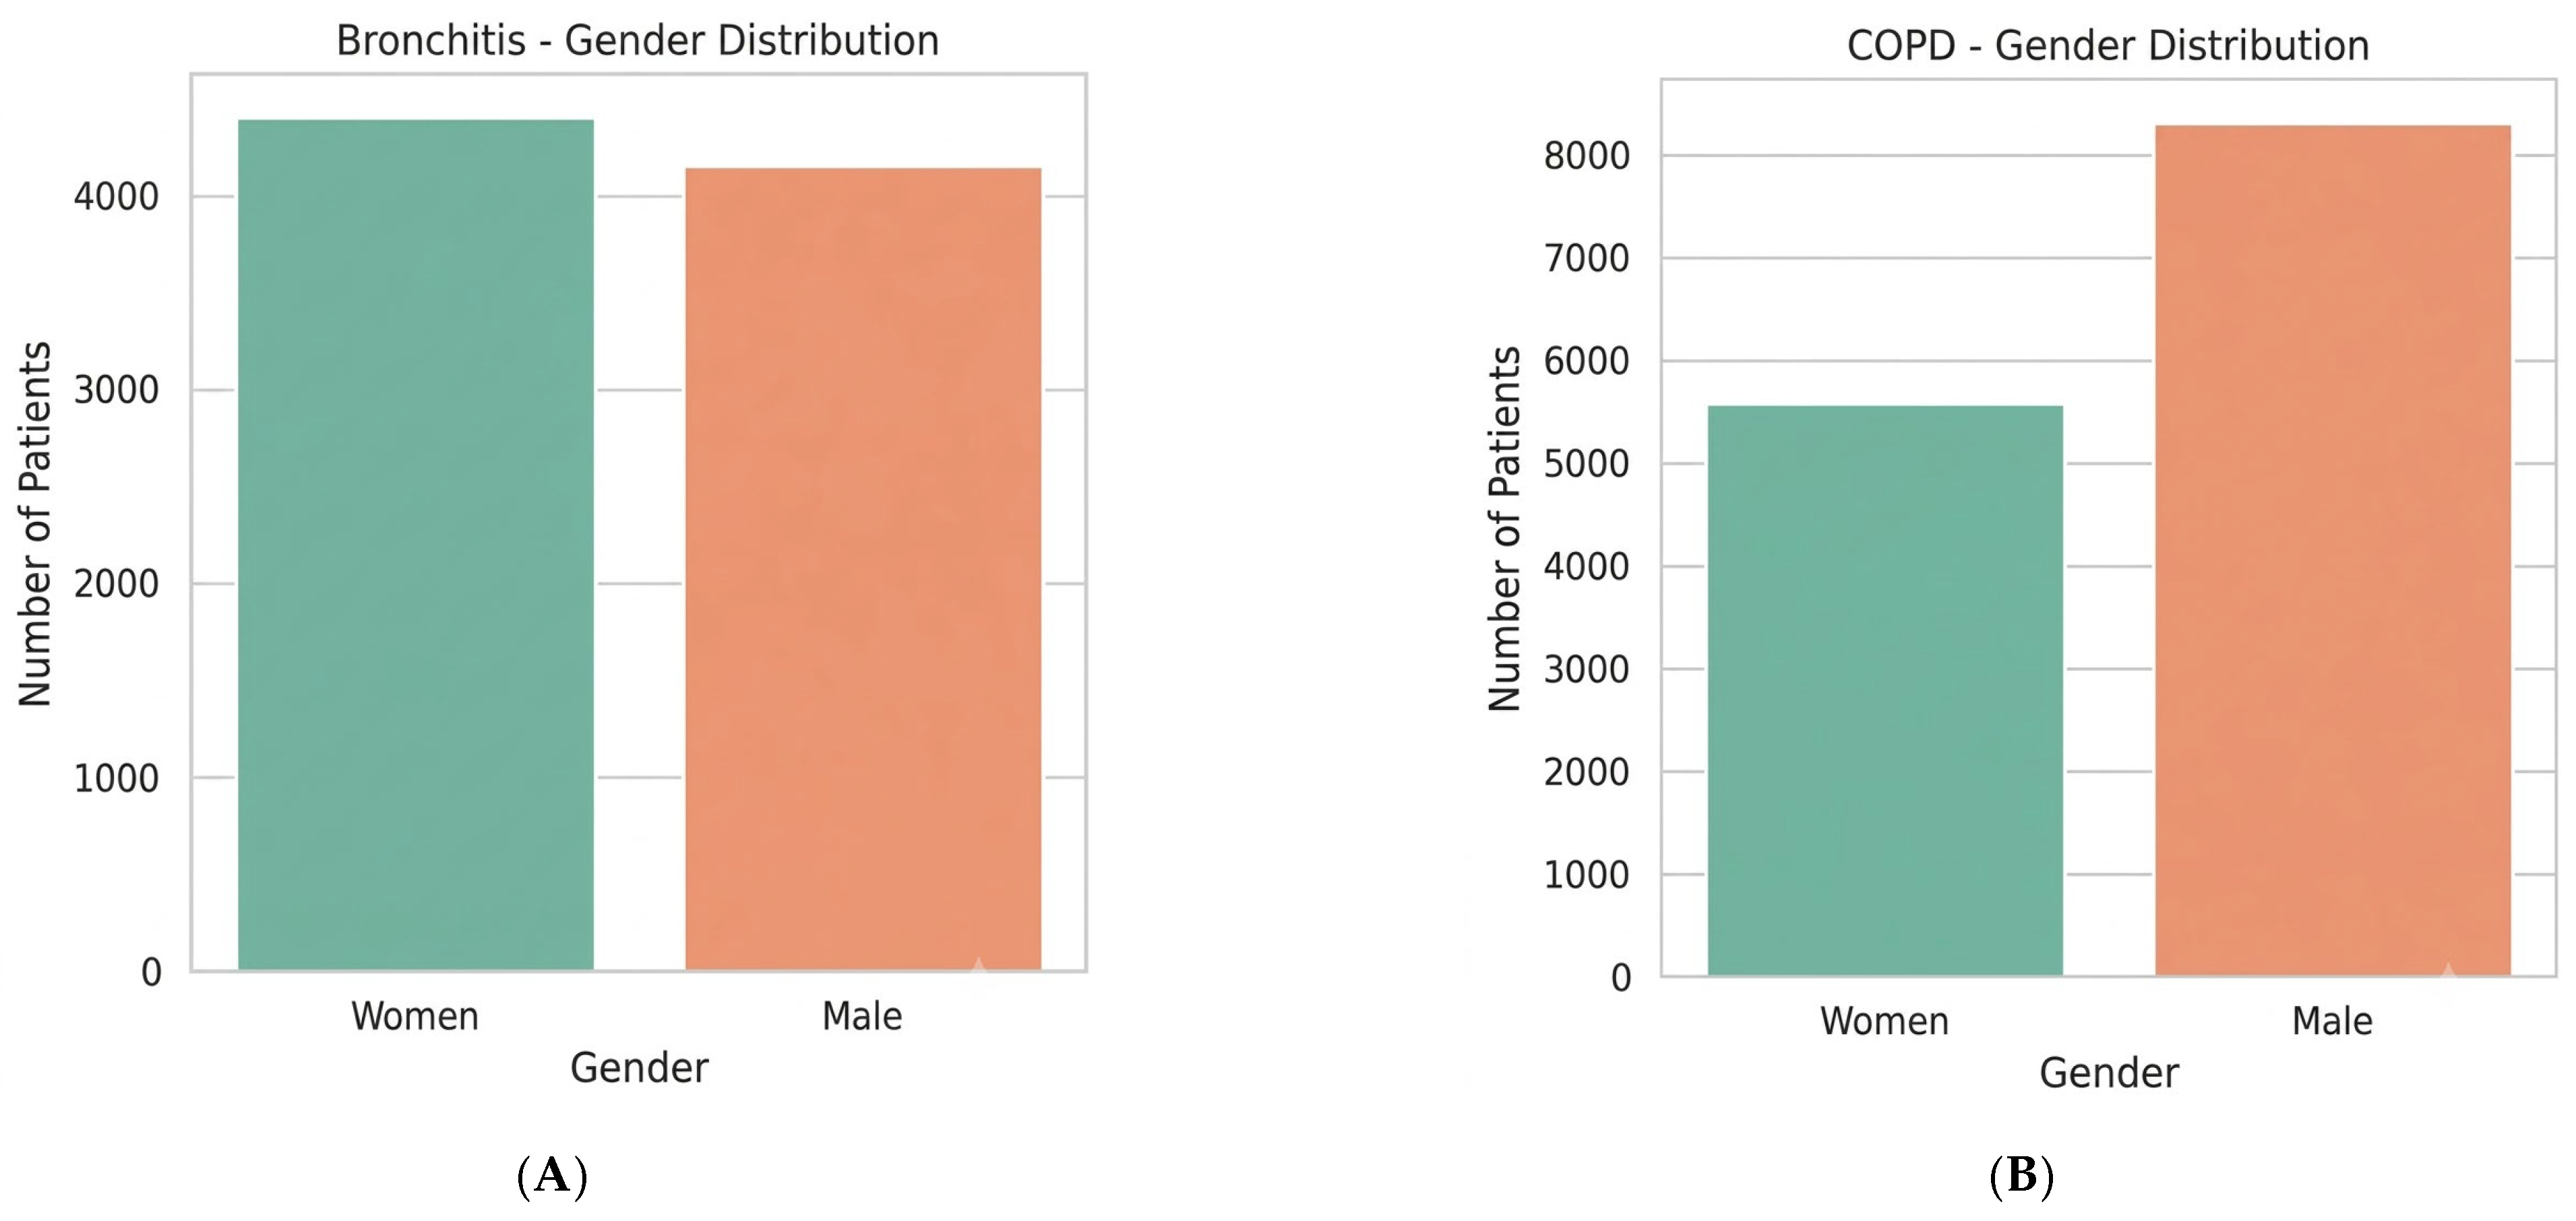
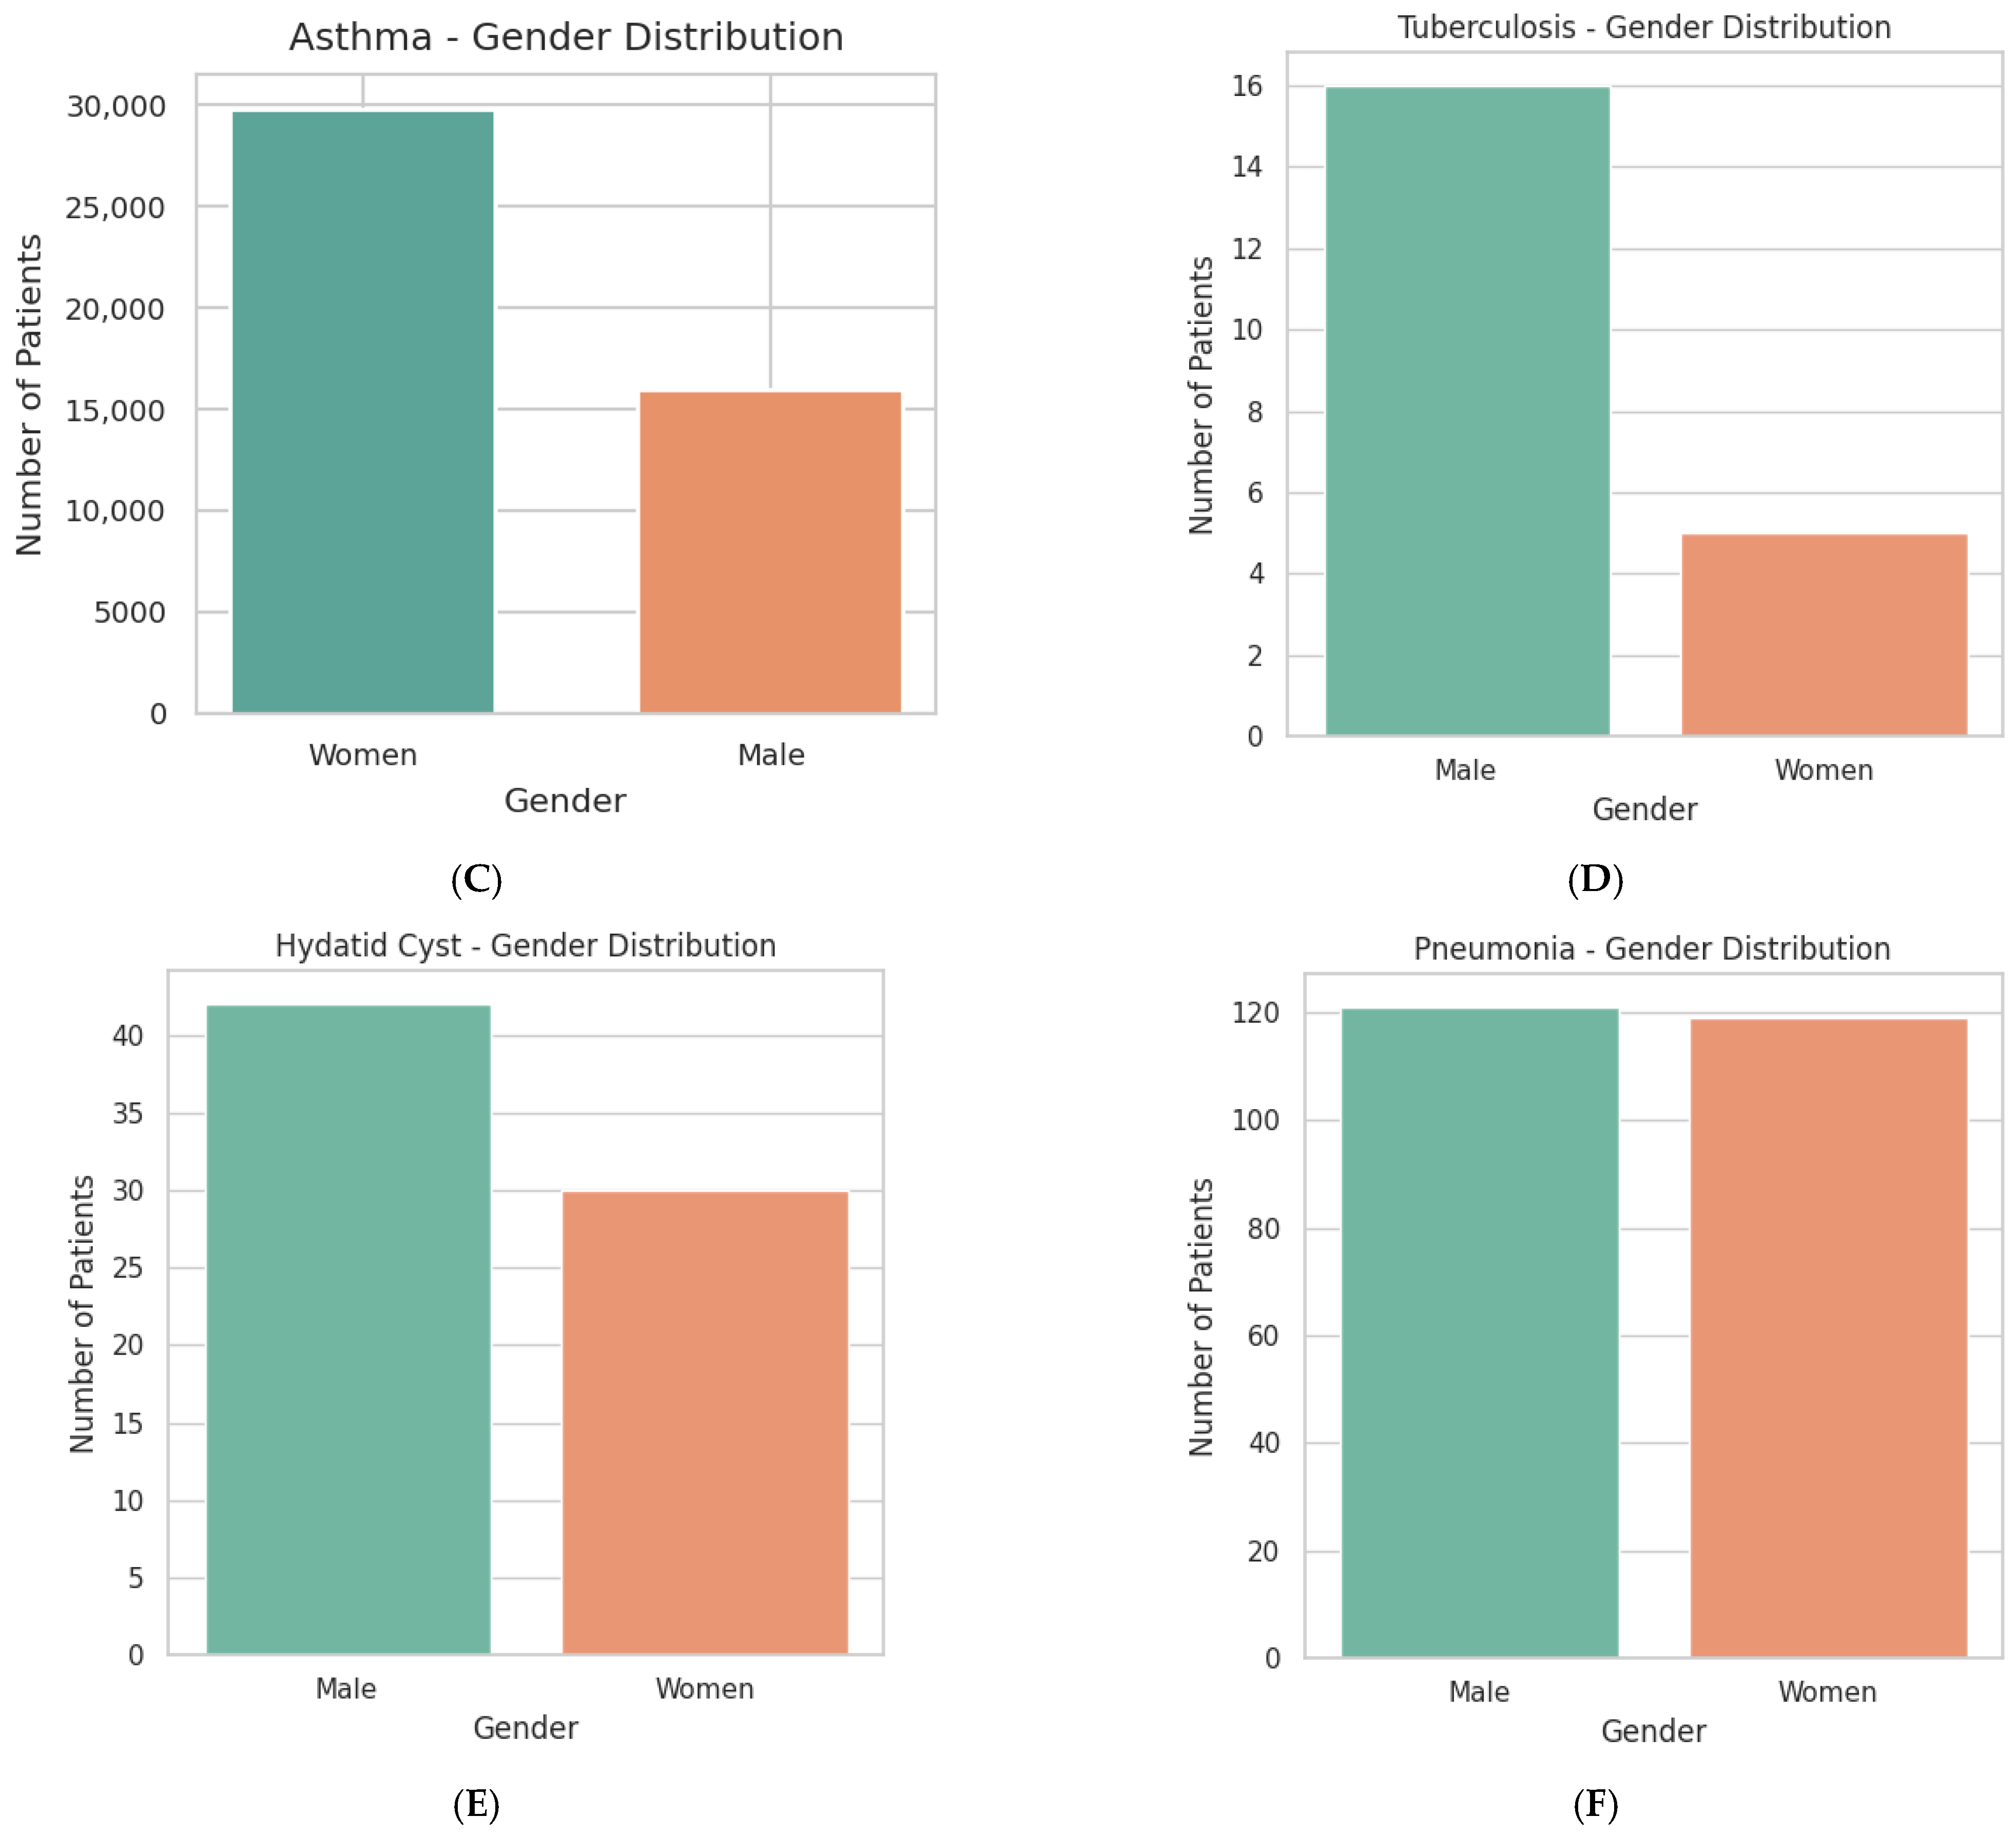
When the distribution of bronchitis by gender was examined, it was determined that the number of female patients diagnosed with bronchitis was slightly higher than the number of male patients. Although the number of cases remained at similar levels in both genders, this limited predominance observed in women reveals that bronchitis shows a largely balanced distribution between genders in the study population. When the distribution of COPD cases by gender was evaluated, a significant difference was observed. While the number of individuals diagnosed with COPD in female patients was determined to be approximately 5500, this number reached approximately 8300 in male patients. The results obtained show that the prevalence of COPD is significantly higher in men compared to women. This situation can be explained by the fact that smoking habits, occupational exposures, and environmental risk factors have historically been more common in the male population. When the gender distribution of asthma patients was examined, a significant concentration was observed in women. While the number of female patients diagnosed with asthma reached approximately 29,700, the number of male patients remained at approximately 16,000. These findings reveal that the prevalence of asthma in the study population is significantly higher in women than in men. This higher frequency observed in women can be attributed to hormonal differences, immunological mechanisms, and increased susceptibility to environmental triggers. When the gender distribution of tuberculosis cases is evaluated, male patients are clearly dominant. The number of patients diagnosed with tuberculosis in men was recorded as 16, while this number was only 5 in women. The results show that tuberculosis cases are approximately three times more common in men than in women. Although the total sample size is limited, the obtained distribution is consistent with the findings of international epidemiological studies that report a higher incidence of tuberculosis in men (Figure 3).

3.1. Disease Distribution by Age and Gender

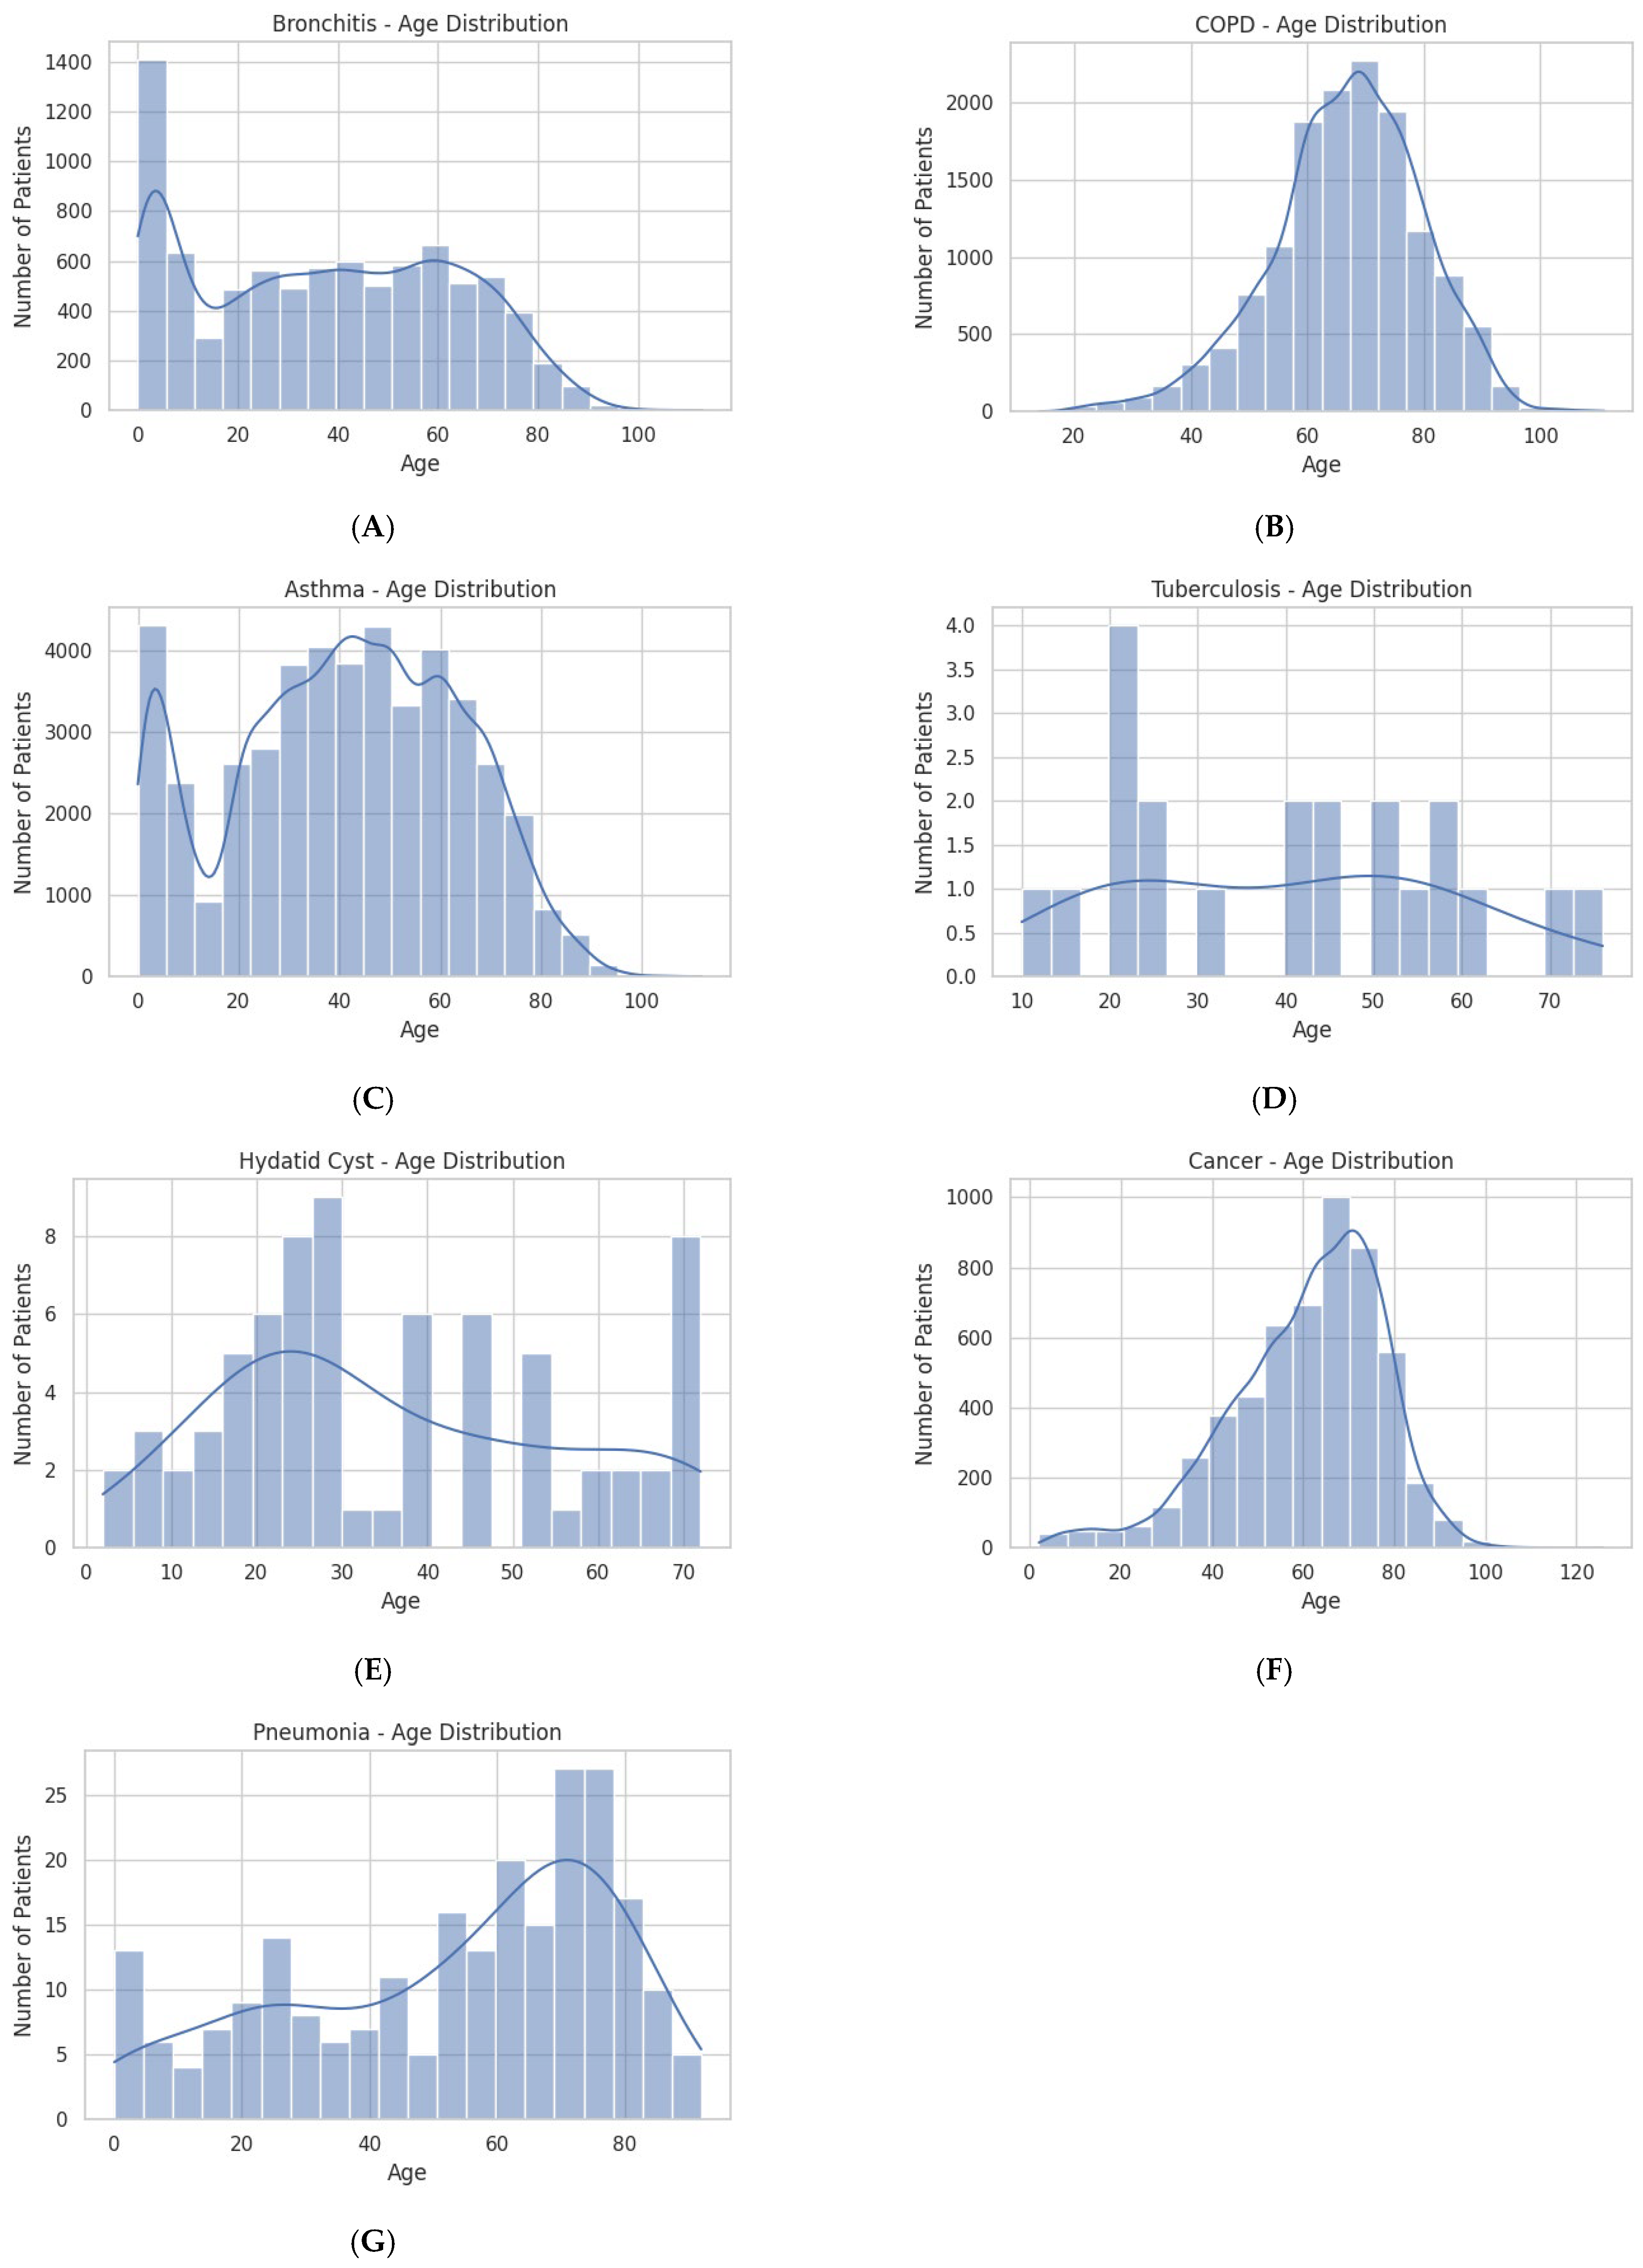
The age distribution of bronchitis cases shows two distinct peaks (bimodal distribution). The highest case density is seen in the 0–5 age group with approximately 1400 cases, while a significant decrease occurs in the 5–10 age group. Case numbers remained relatively stable in the young adult and middle-aged groups (15–50 years), while a second concentration was observed in the 55–65 age range with approximately 650 cases. After the age of seventy-five, case numbers decreased rapidly and approached zero in older ages. This distribution shows that infectious bronchitis cases are dominant in childhood, while chronic bronchitis and COPD-related cases are dominant in older ages (Figure 4). The high prevalence in childhood can be explained by the incomplete development of the immune system and high exposure to infection; the second concentration in older ages can be explained by smoking, environmental exposures, and age-related loss of lung function. COPD cases showed a significant increase with age. While case numbers remained quite low in individuals under forty, a gradual increase began after forty, accelerating from fifty onwards and reaching its peak in the 65–75 age range with approximately 2200–2250 cases. After eighty years of age, case numbers showed a tendency to decrease again. This age distribution reflects the epidemiological structure of COPD, which is associated with long-term smoking, exposure to biomass fuels, air pollution, and cumulative lung damage due to aging.
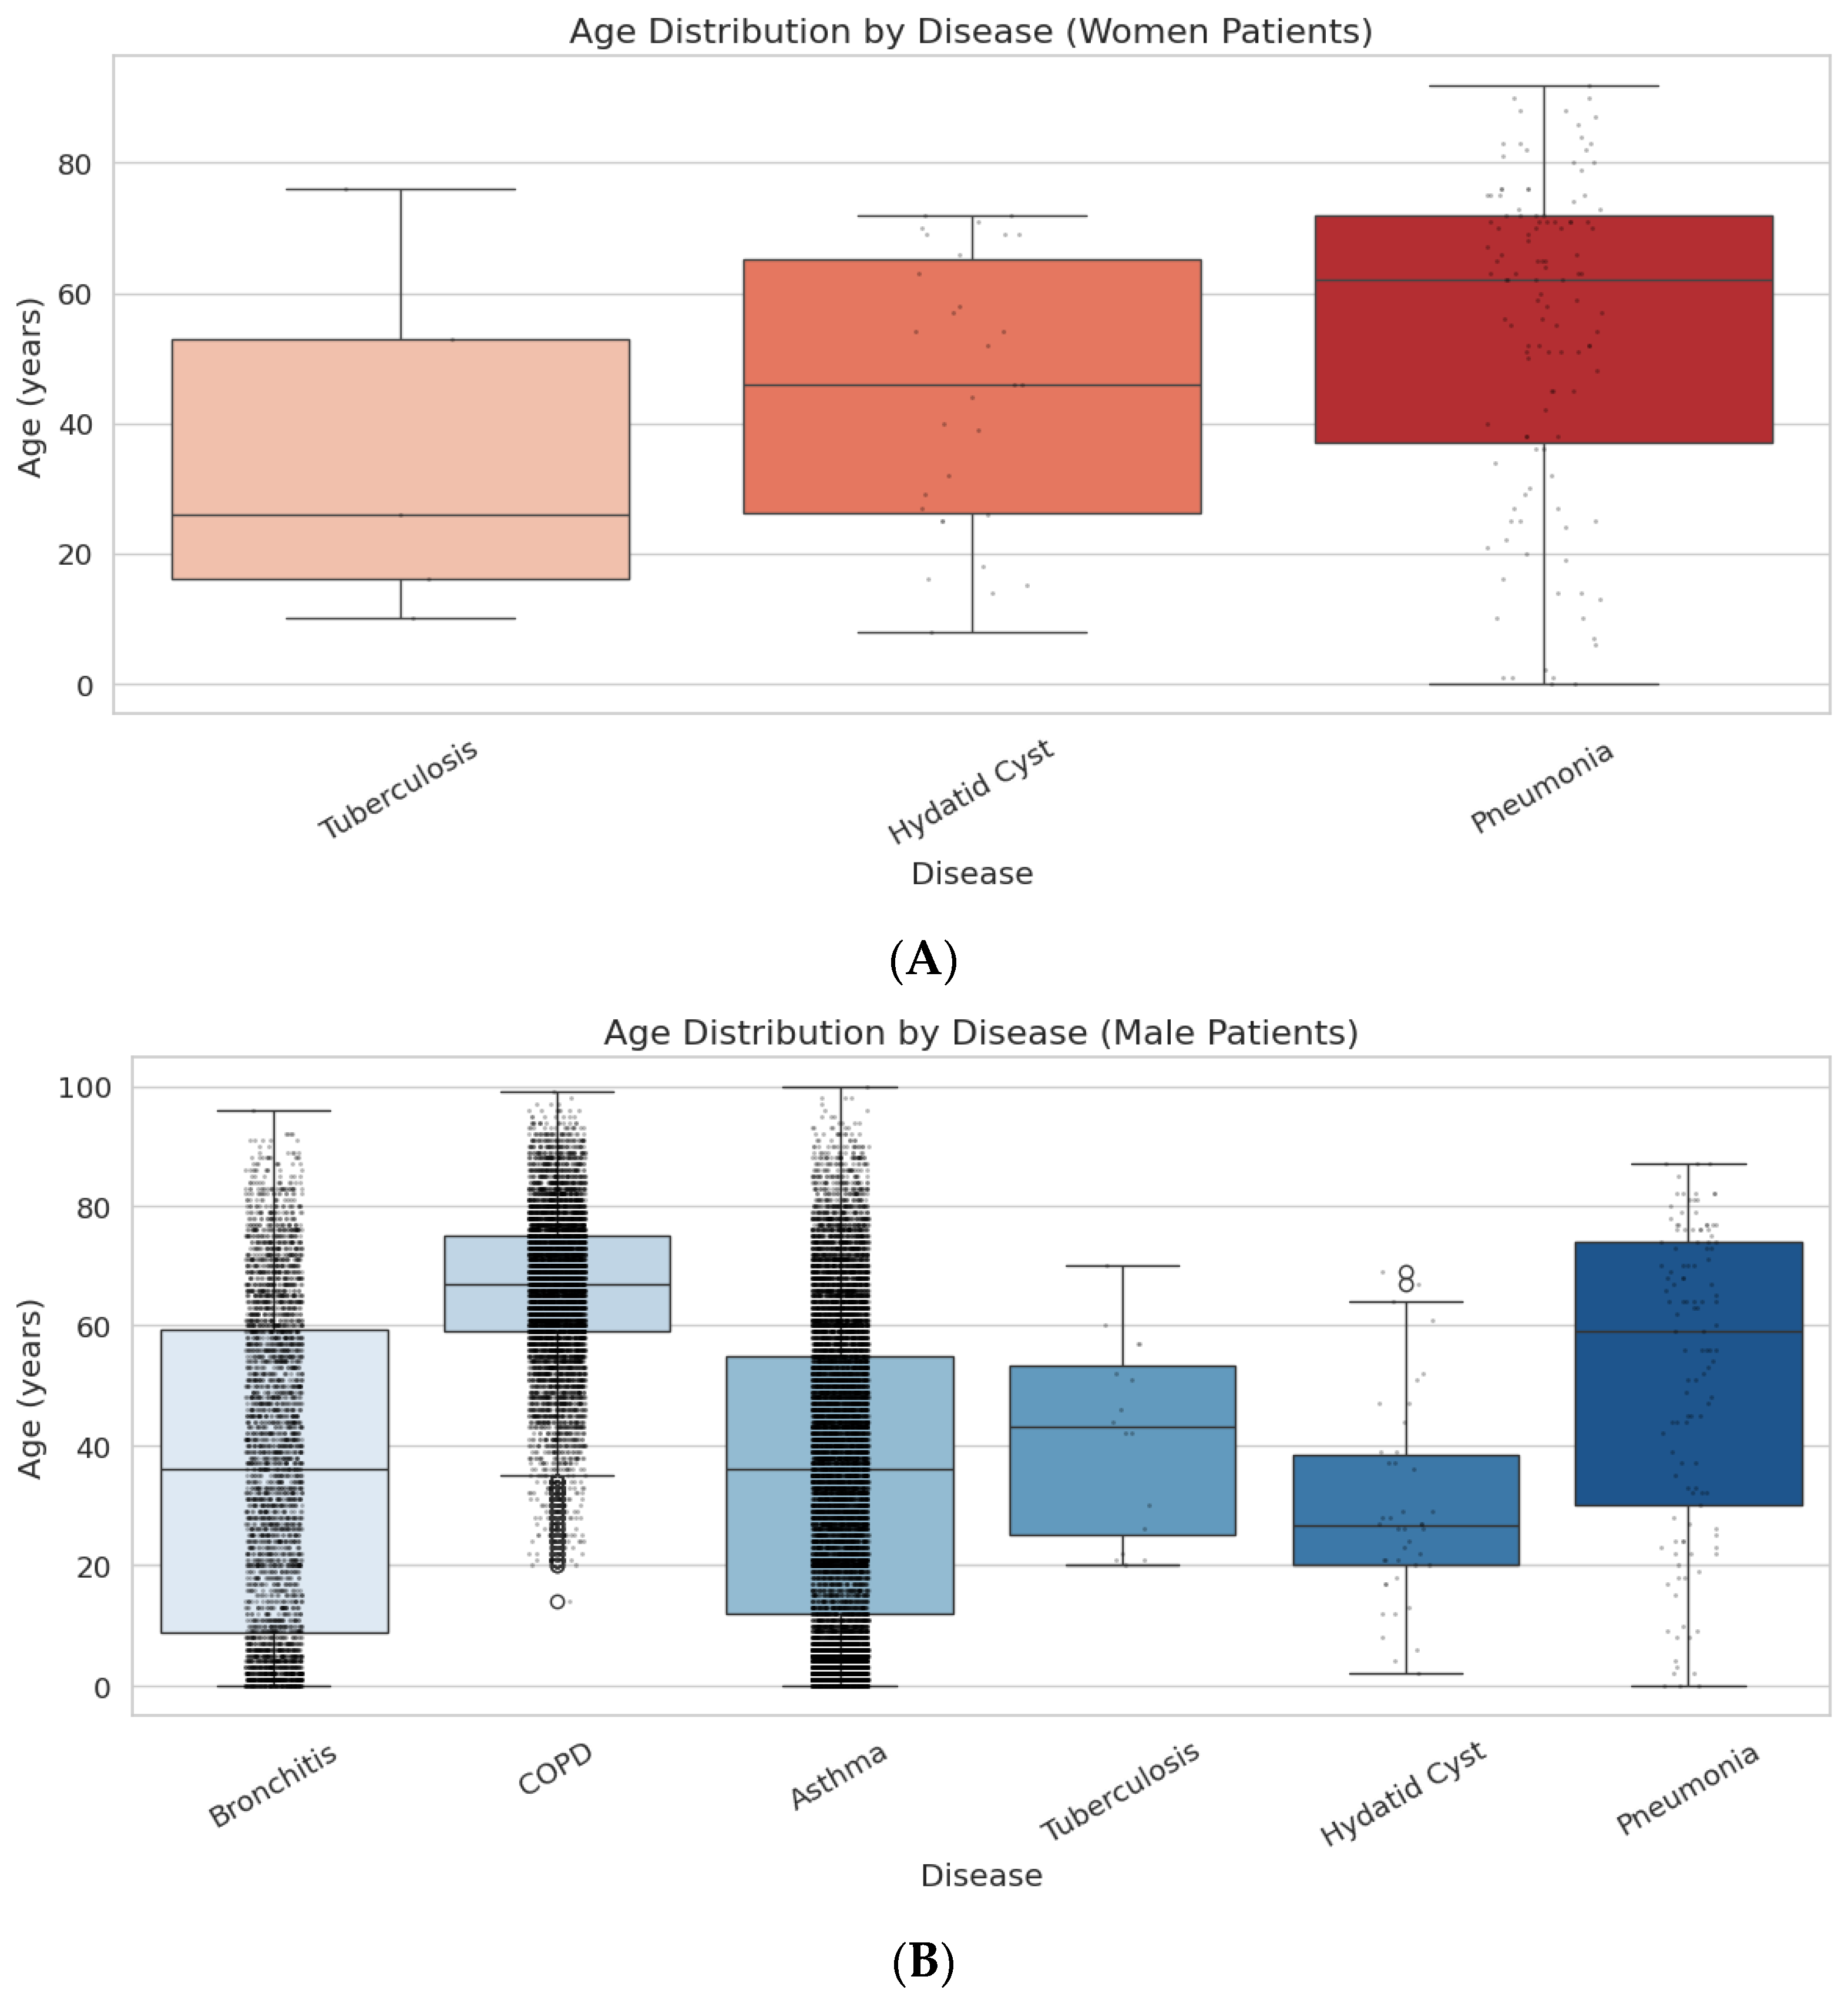
Figure 5A compares the age distributions of tuberculosis, hydatid cyst, and pneumonia cases in female patients using box plots. The findings show a significant age gradient among the diseases. The lowest median age was determined in the tuberculosis group, approximately 28–30 years. While the majority of cases are concentrated in the 20–52 age range, the distribution varies between approximately 12–75 years. This indicates that the disease predominantly affects young adults, but can also be seen in different age groups. In hydatid cyst cases, the median age is approximately 45–48 years, with the interquartile range concentrated in the 30–65 age range. This finding shows that the disease is more common, especially in the middle-aged group. Although the distribution is relatively homogeneous, a limited number of outliers reveal that the disease can also be seen in younger and older individuals. The highest median age was found in the pneumonia group. The median age is approximately 60 years, and the upper quartile extending beyond 70 years indicates that the disease is more common in older women. The wide age distribution and concentration of cases in older age groups are consistent with epidemiological findings suggesting that age-related decrease in immune function and the burden of chronic diseases increase the risk of pneumonia. Overall, it is observed that tuberculosis is more prevalent in young adults, hydatid cysts in middle-aged individuals, and pneumonia in older age groups among female patients. These age-related differences are related to the etiology of the diseases, exposure characteristics, and changes in immune responses. The high median age and wide distribution observed particularly in pneumonia demonstrate that the disease constitutes a significant public health problem in the elderly female population and highlight the importance of age-specific preventive approaches and early diagnosis strategies.
Figure 5B compares the age distributions of respiratory system and infectious diseases examined in male patients using box plots. The findings show that there are significant age differences between diseases and that age is one of the key variables determining the epidemiological characteristics of diseases. Bronchitis and asthma groups are among the diseases with the lowest median age values. In bronchitis cases, the median age is approximately 38 years, and the interquartile range shows a wide distribution between 20–60 years. Numerous outliers reveal that the disease can be seen in a wide age range from childhood to old age. In asthma cases, the median age is approximately 35–40 years, and despite a narrower interquartile range, a significant concentration is observed in lower age groups. COPD stands out as the disease with the highest median age in male patients. The median age is approximately 68–70 years, and the interquartile range is 55–75 years. The concentration of distribution in older age groups reflects the epidemiological structure of the disease, which is associated with aging, long-term smoking, and chronic environmental exposures. The median age in tuberculosis cases is approximately 45 years, with the majority of cases concentrated in the 30–55 age range. In the hydatid cyst group, the median age is approximately 30 years, with interquartile ranges between 20–40 years. This indicates that hydatid cyst affects young adults more often in men and that the age distribution is more homogeneous compared to other diseases. The pneumonia group stands out as the disease with the highest median age after COPD. The median age is approximately 62–65 years, with interquartile ranges between 40–75 years. The outliers observed in older age groups show that pneumonia occurs more frequently, especially in elderly men, and can be seen in a wide age spectrum. Overall, bronchitis and asthma are more prevalent in younger and middle-aged men, tuberculosis in middle age, hydatid cysts in young adults, and COPD and pneumonia in older age groups. This age gradient is consistent with the etiology of the diseases, environmental exposures, lifestyle, and age-related physiological changes. The high median age and wide distribution observed in older age groups, particularly for COPD and pneumonia, highlight the importance of preventive health services, early diagnosis programs, and risk-based clinical approaches for the elderly male population.
COPD stands out as the disease with the highest median age in men (approximately 68–70 years). The concentration of the distribution in older ages supports the nature of COPD as being associated with aging, long-term smoking, and chronic environmental exposures. Limited data are available for this disease in women, and a distinct distribution pattern cannot be observed. In asthma cases, the median age of male patients is approximately 35–38 years, and the distribution is spread across a wide age range. This indicates that asthma can affect both young and middle-aged groups.
In tuberculosis, a significant difference is observed between genders. While the median age in men is approximately 42–45 years, this value drops to approximately 30–32 years in women. Although a distribution shifted to younger ages is noticeable in women, it is seen that the disease is predominantly concentrated in the middle-aged group in both genders.
In hydatid cyst, an inverse gender difference emerges. While the median age in men is approximately 30–32 years, this value rises to approximately 48–50 years in women. The wider interquartile range observed in women indicates that the disease is more common in middle-aged women.
In pneumonia cases, there is no significant difference in median age between men and women. The median age is approximately 60–62 years in both genders. The slightly wider distribution in men indicates that the disease commonly affects both sexes in older age groups. While COPD and pneumonia are concentrated in older age groups, asthma and bronchitis are seen in a wide spectrum starting from younger ages. Gender differences are particularly pronounced in tuberculosis and hydatid cysts, and this is likely related to biological, environmental, and behavioral factors. The results provide important epidemiological findings for the development of age- and gender-specific preventive health strategies.
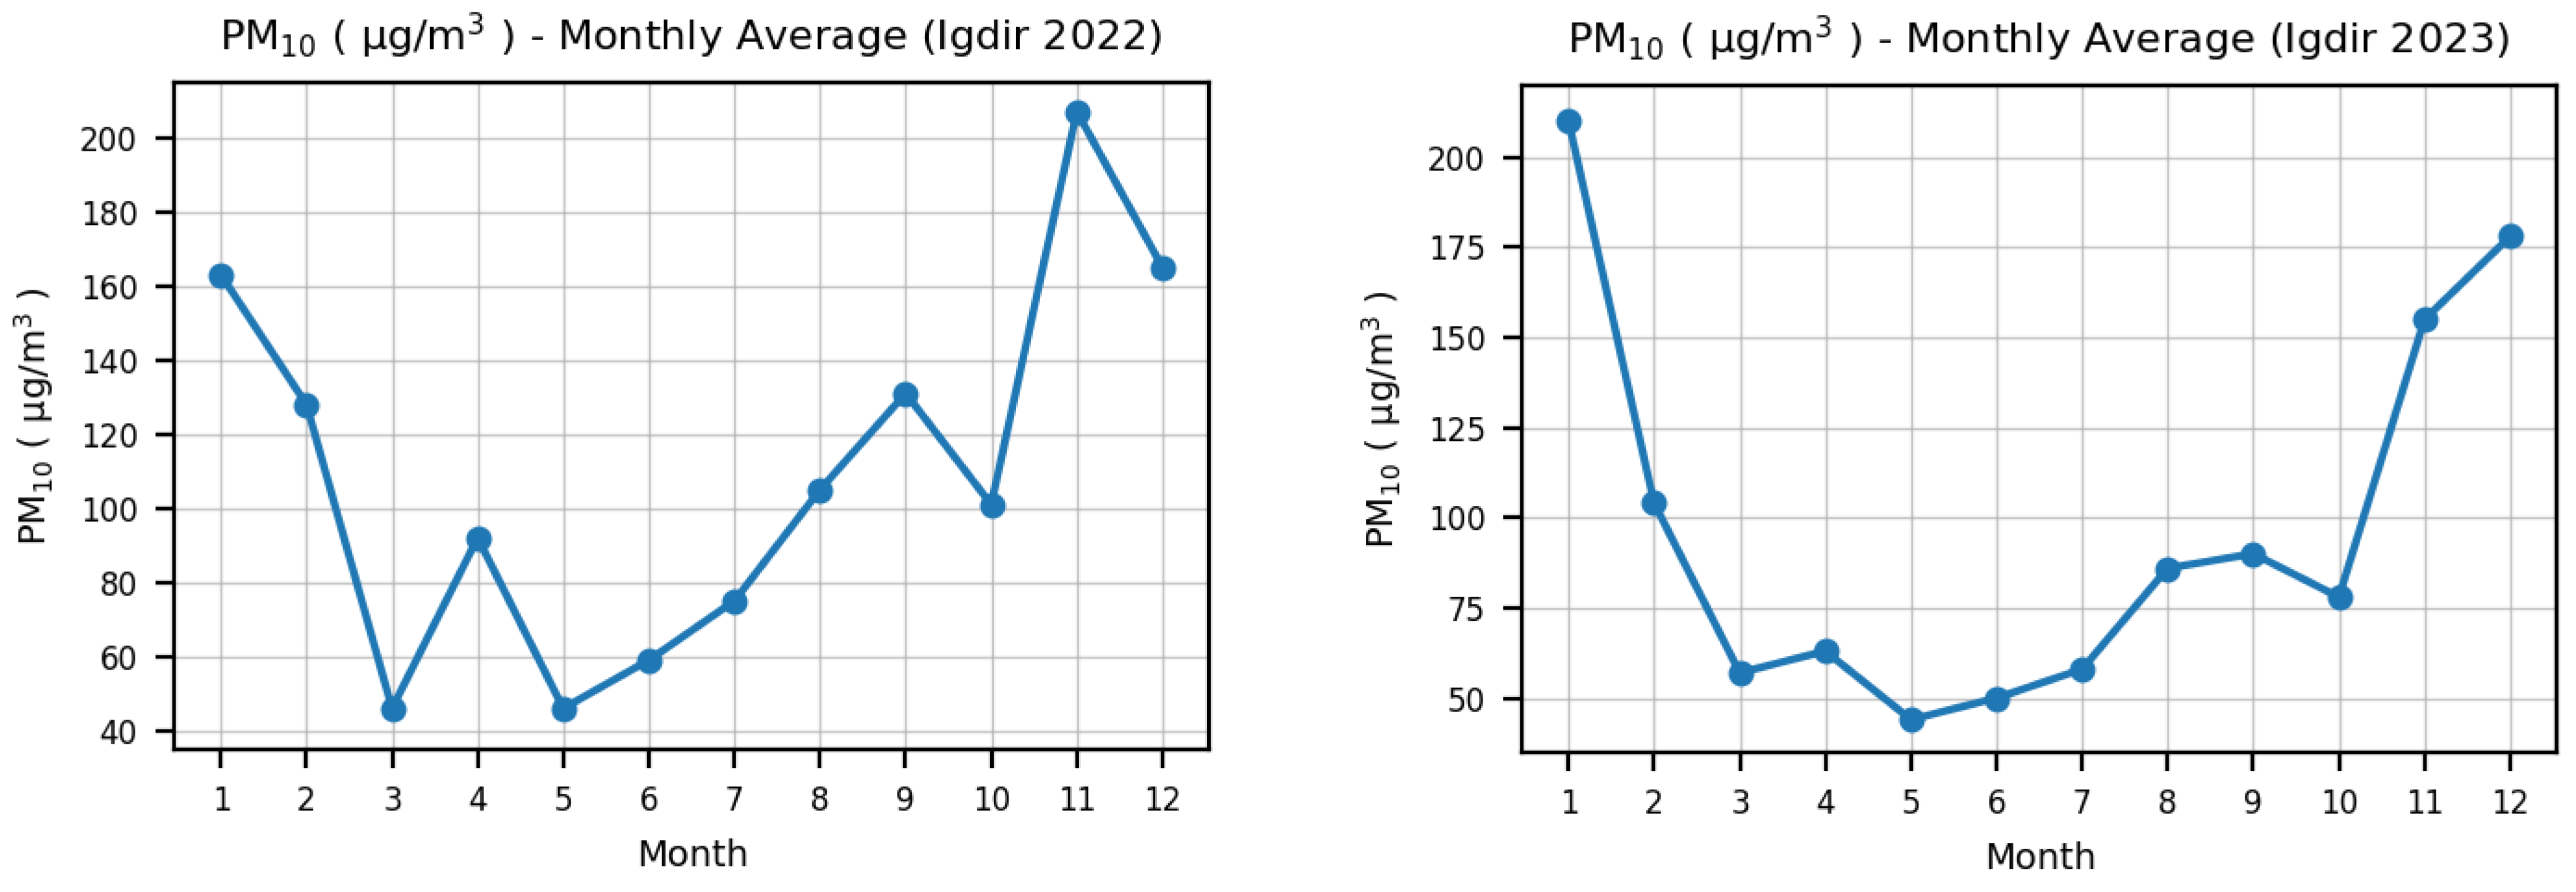
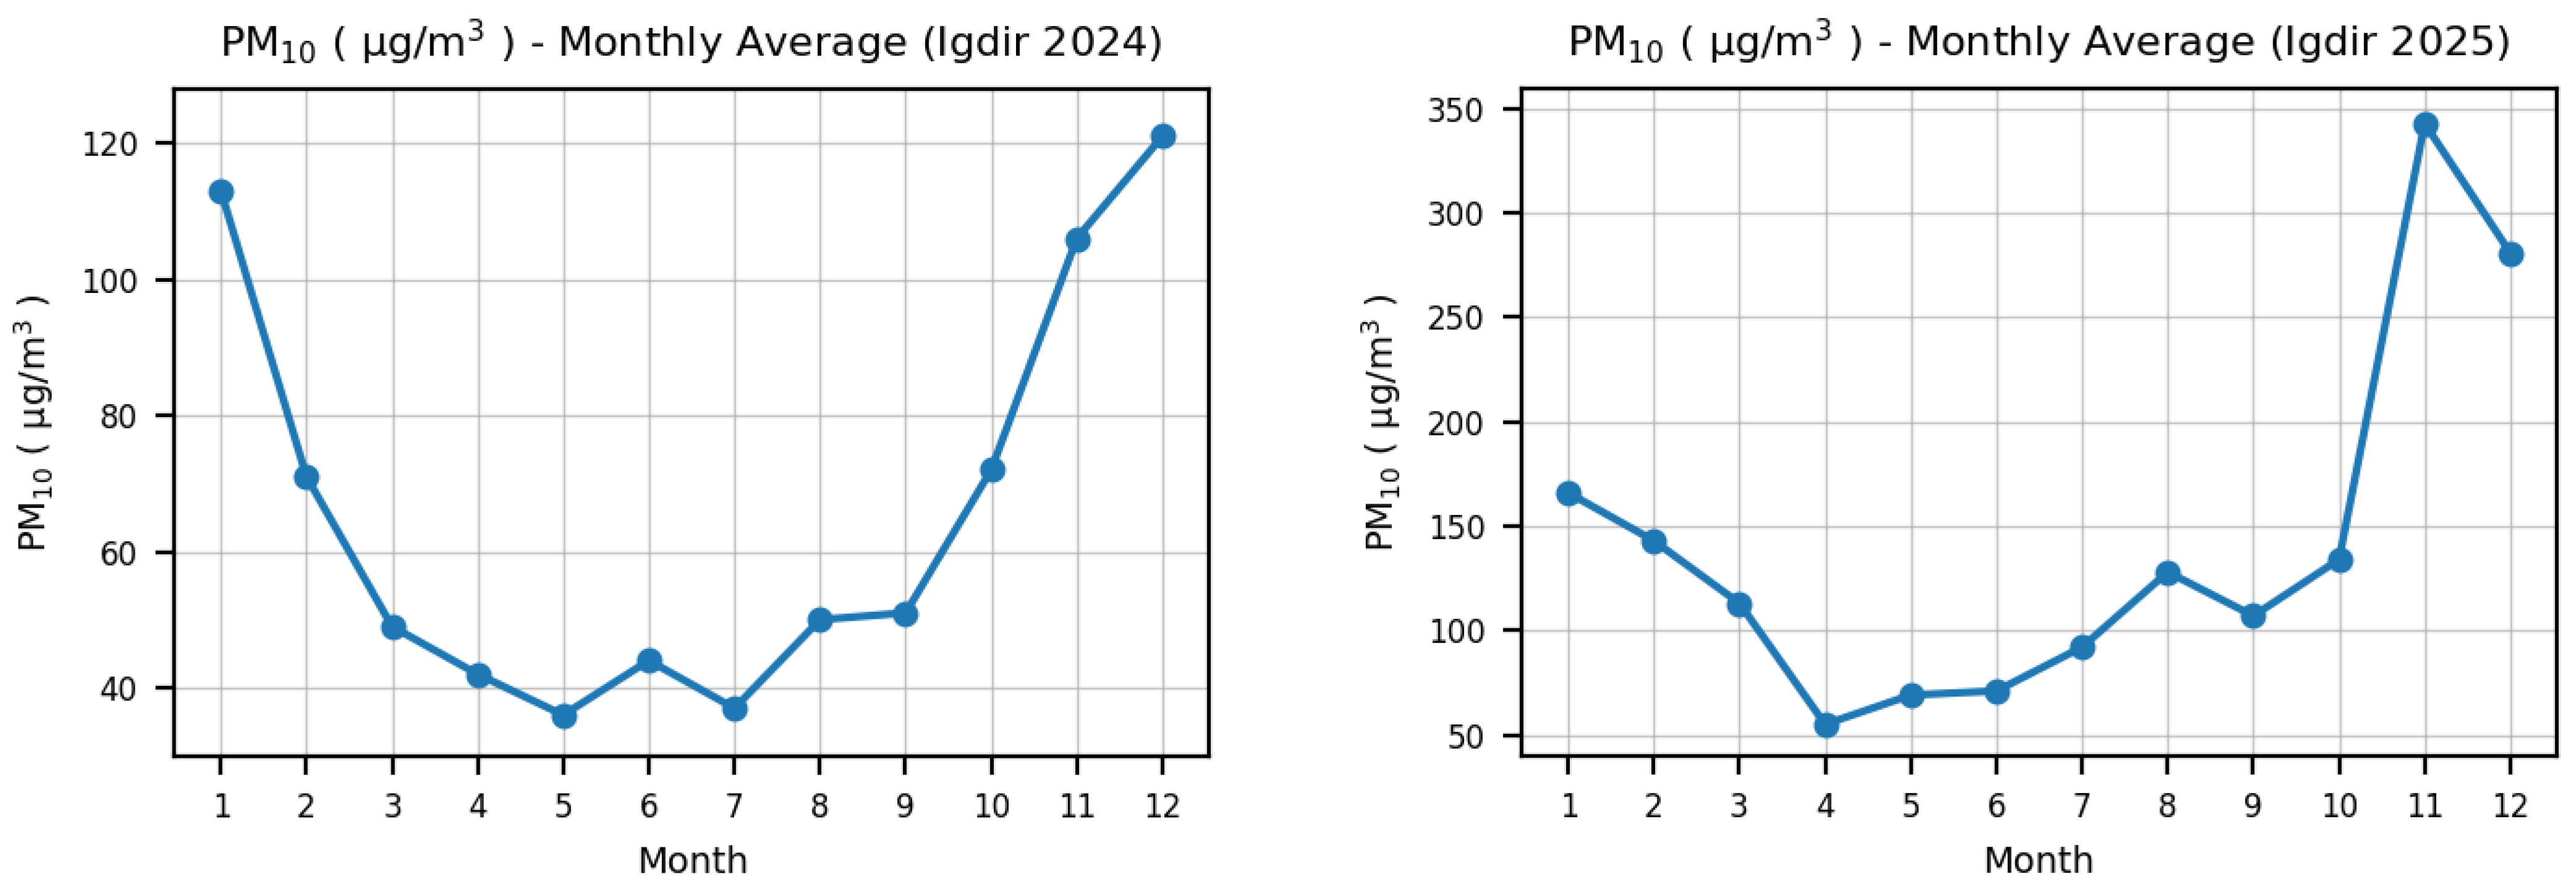
Figure 6 illustrates the seasonal and interannual variations in monthly average PM10 concentrations in Iğdır between 2022 and 2024. PM10 levels exhibited a clear seasonal pattern, with elevated concentrations during winter and late autumn, while relatively lower values were observed in spring and summer. The highest concentrations were recorded in January 2022 (~165 µg/m3), November 2022 (~205 µg/m3), January 2023 (~210 µg/m3), and December 2023 (~178 µg/m3), reflecting the combined effects of temperature inversions, low wind speeds, domestic heating emissions, and the basin’s enclosed topography, which favors pollutant accumulation. In contrast, the lowest concentrations generally occurred during spring and early summer, with values ranging from approximately 45 to 70 µg/m3, likely due to enhanced atmospheric mixing, precipitation, and reduced heating-related emissions. A similar seasonal cycle was observed in 2024, although PM10 concentrations were relatively lower compared with 2022 and 2023. Nevertheless, increases were again observed from late summer onwards, which may be associated with dry surface conditions, regional dust transport, and agricultural activities. The observed PM10 concentrations frequently exceeded the WHO annual mean guideline value of 15 µg/m3. The maximum monthly concentrations recorded in November 2022 (~205 µg/m3), January 2023 (~210 µg/m3), and December 2023 (~178 µg/m3) were approximately 12–14 times higher than the WHO guideline value. Even during periods with relatively lower concentrations, PM10 levels generally remained between 45 and 90 µg/m3, corresponding to approximately 3–6 times the recommended annual guideline value. These results indicate that particulate matter pollution represents a persistent environmental concern in the Iğdır Basin, particularly during winter periods when atmospheric stagnation and pollutant accumulation are more pronounced.
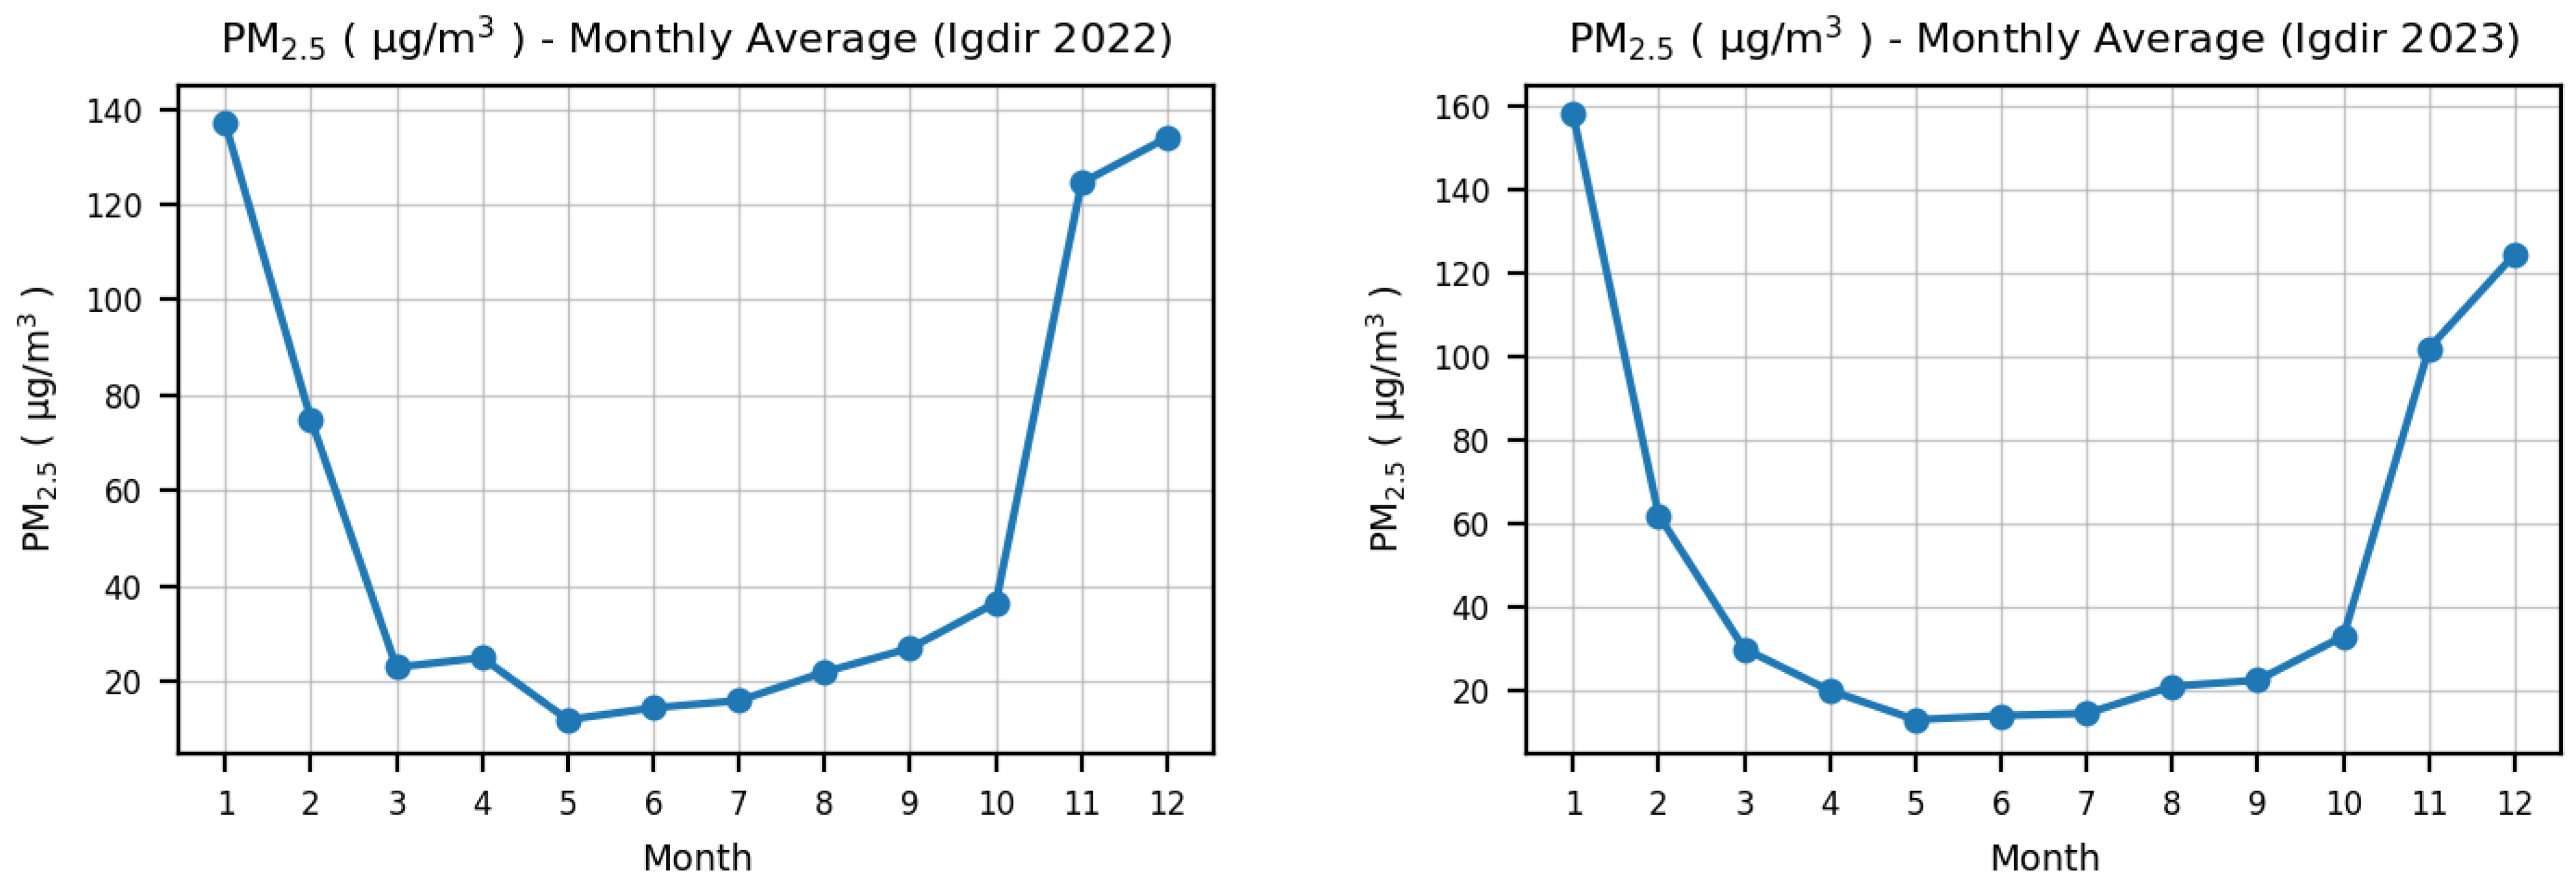
Figure 7 shows a distinct seasonal cycle in the average monthly PM2.5 concentrations in Iğdır throughout 2022. At the beginning of the year, particularly in January, values are quite high (approximately 135 µg/m3), while in February, a significant decrease and a downward trend begin. In March, the PM2.5 concentration drops to one of its lowest levels of the year, falling to approximately 20 µg/m3. During the spring and summer months, a generally low and stable trend is observed. Between April and June, values remain at low levels, with minimum levels particularly observed in May and June. This can be attributed to increased atmospheric mixing, the effect of rainy periods, and a decrease in emissions from warming. From late summer and early autumn (July–October), a gradual increase in PM2.5 values is noticeable. This increase can be explained by arid surface conditions, dust resuspension, and increased anthropogenic emissions. A significant increase is observed in the last quarter of the year, with PM2.5 concentrations reaching high levels again in November and December, approximately in the range of 125–135 µg/m3. The observed PM2.5 concentrations in Iğdır frequently exceeded the WHO air quality guideline values. The highest monthly concentrations, reaching approximately 135 µg/m3 in January and 125–135 µg/m3 in November–December 2022, were more than 25 times higher than the WHO annual mean guideline value of 5 µg/m3. Even during periods with relatively lower concentrations, PM2.5 levels remained above the recommended guideline values, indicating persistent fine particulate matter pollution, particularly during winter months when atmospheric stagnation and pollutant accumulation are enhanced.
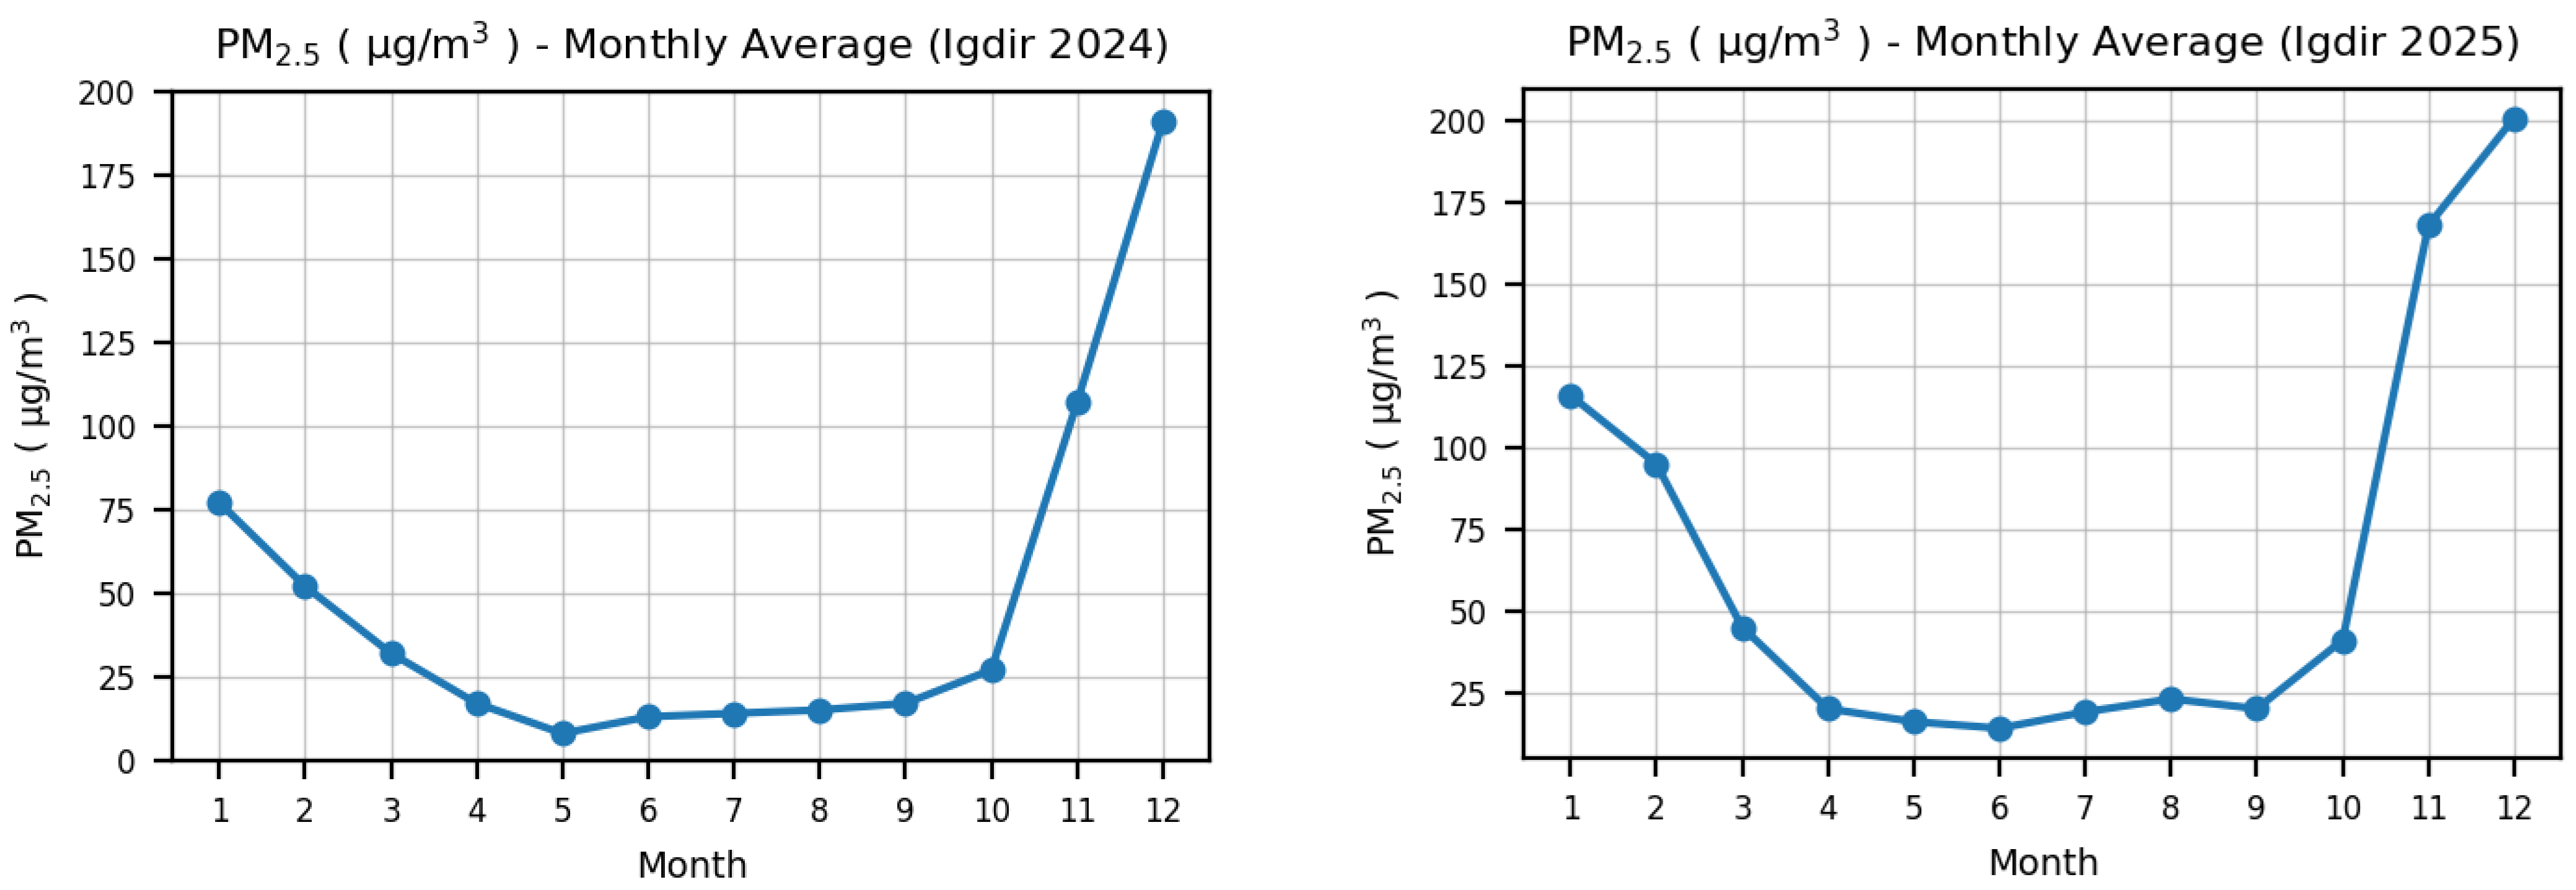
The average monthly PM2.5 values for 2025, similar to 2022, exhibit a distinct seasonal cycle but show sharper fluctuations in amplitude. Concentrations begin at approximately 110–120 µg/m3 in January, then show a rapid decrease in February and March, reaching significantly low levels (approximately 20–45 µg/m3) during the spring. Values generally remain low and stable from April to August, maintaining minimum levels during the summer months. A significant upward trend emerges from the autumn period, accelerating in October. A sharp jump is observed in November, with PM2.5 concentrations reaching approximately 170 µg/m3, and reaching the highest value of the year, approximately 200 µg/m3, in December. This indicates that pollutant accumulation is more intense at the end of winter and the end of the year compared to 2022. In general, a comparison shows that both years have low PM2.5 values in the summer months and high values in the winter months; however, a sharper increase and higher maximum values are noticeable, especially in the last two months of 2025.
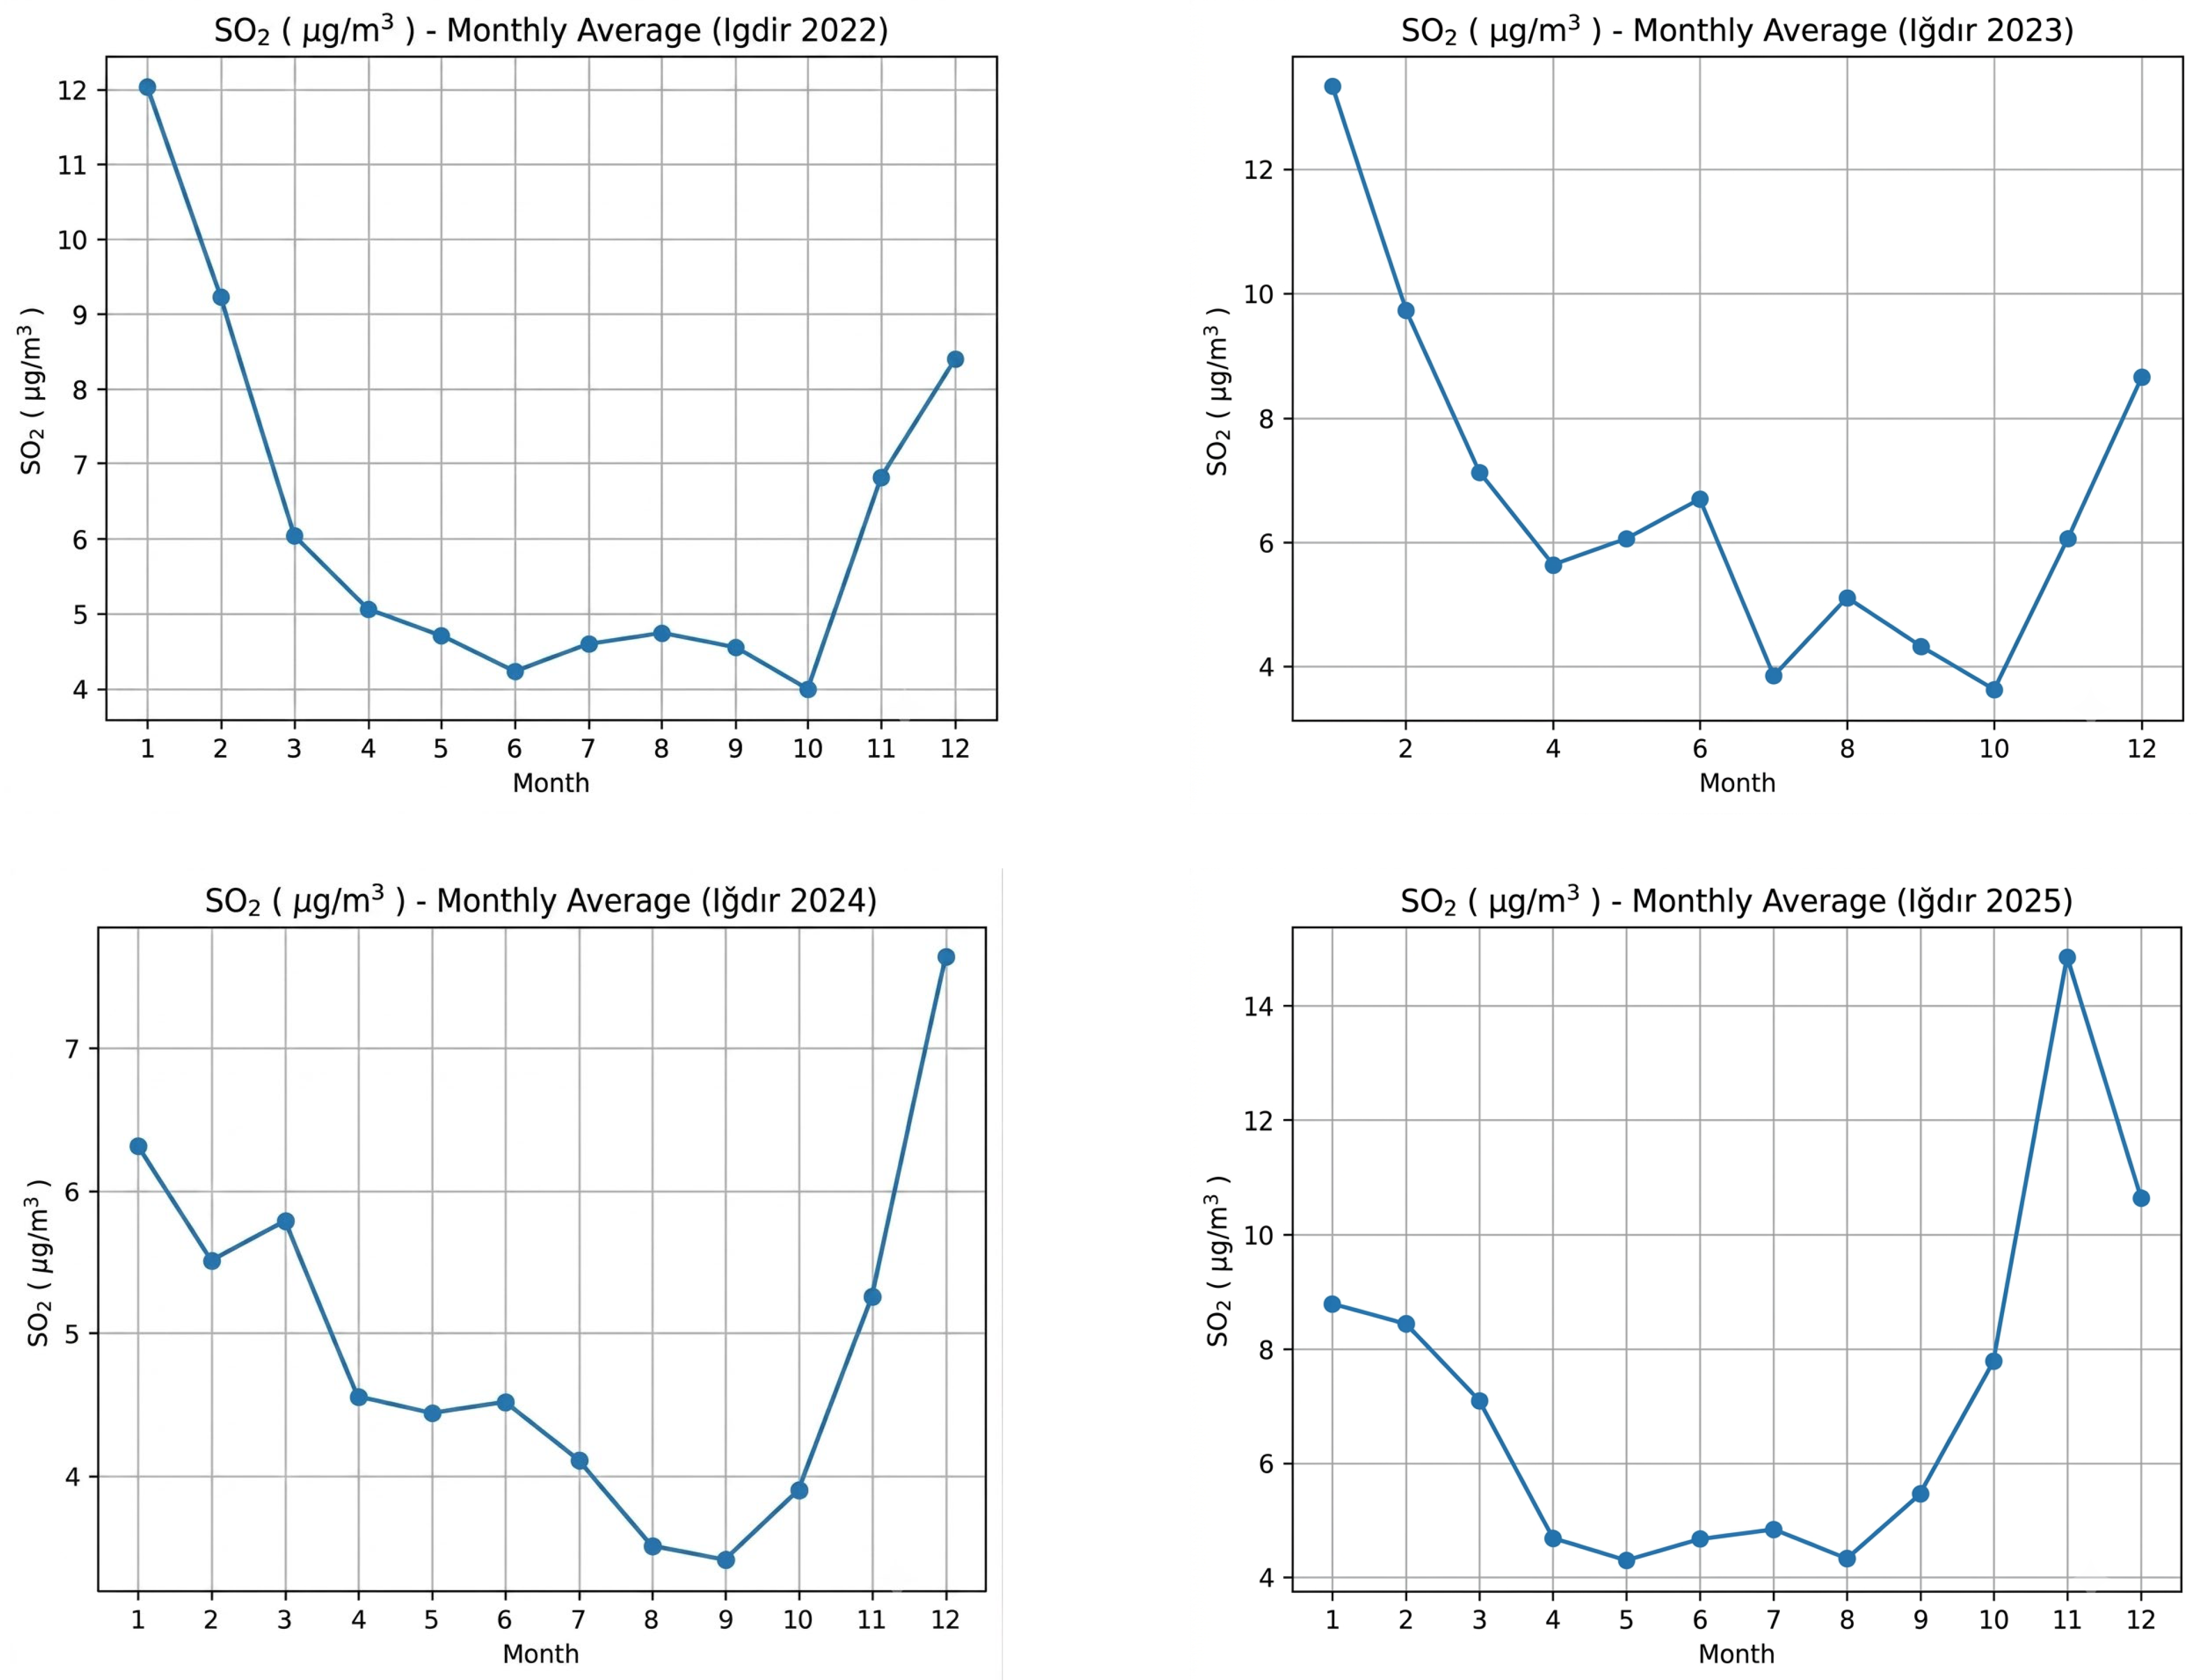
Across 2022–2025, monthly SO2 and PM10 observations in Iğdır consistently exhibit a pronounced and recurrent seasonal cycle characterized by elevated winter concentrations and reduced summer levels. This pattern indicates a systematic influence of anthropogenic emissions, primarily residential heating based on fossil fuel combustion, modulated by regional meteorological and topographical conditions. The basin-like morphology of Iğdır, surrounded by high terrain, together with frequent winter temperature inversions and weak wind regimes, restricts atmospheric dispersion and promotes pollutant accumulation near the surface. In all examined years, SO2 concentrations peak during the cold season (particularly January–March and November–December), reaching maximum values under conditions of intensified heating demand and stable atmospheric stratification. In contrast, spring and summer periods consistently show minimum levels due to reduced heating emissions, enhanced atmospheric mixing, higher boundary layer heights, and occasional wet deposition. Short-term deviations within the general pattern (e.g., minor spring or late-summer increases) are attributed to transitional temperature fluctuations and episodic emission variability. Overall, the multi-year evidence demonstrates that air quality dynamics in Iğdır are governed by a coupled system of emission intensity and microclimatic controls, with clear implications for seasonal public health risk, particularly in winter months when pollutant accumulation is most pronounced (Figure 8). The observed PM2.5 concentrations in Iğdır frequently exceeded the WHO air quality guideline value of 5 µg/m3 for annual mean exposure. In 2025, monthly average concentrations reached approximately 170 µg/m3 in November and 200 µg/m3 in December, corresponding to nearly 34 and 40 times the WHO annual guideline value, respectively.
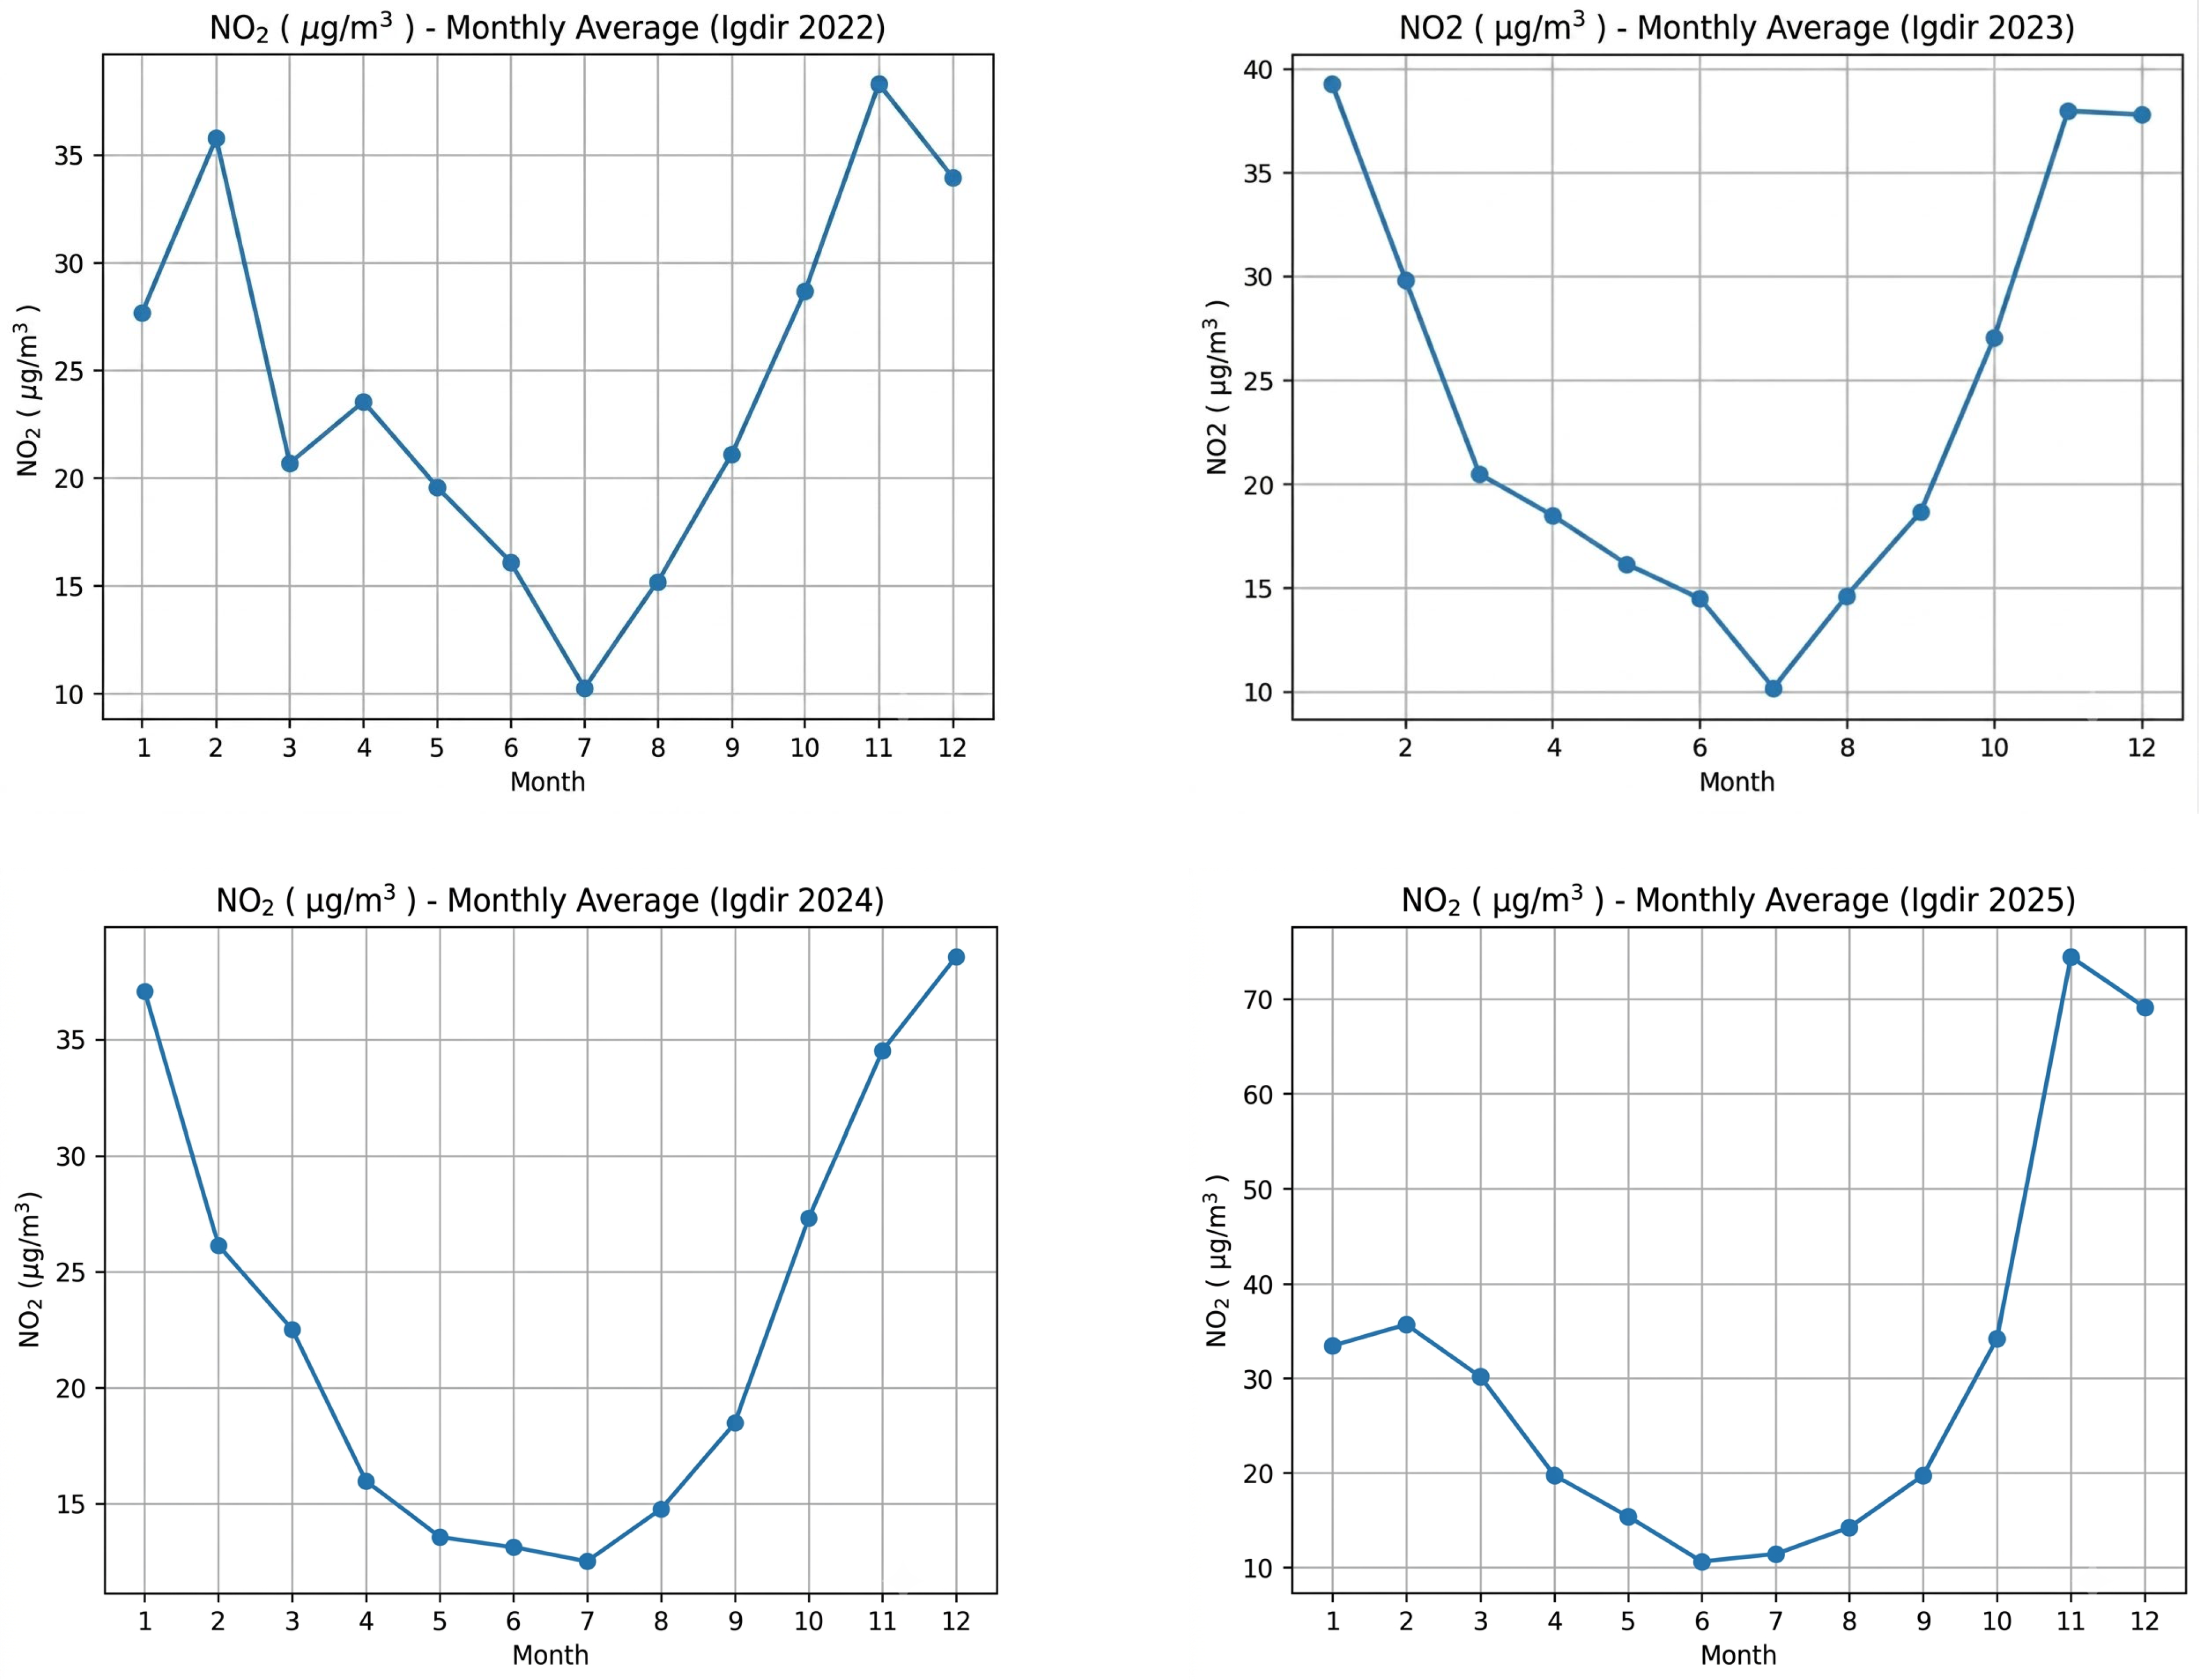
The monthly mean NO2 concentrations in Iğdır exhibit a clear and consistent seasonal variability across the observed years, strongly influenced by regional climatic and anthropogenic factors. In 2022, NO2 levels show a distinct cold season intensification, with elevated concentrations during late autumn and winter and markedly reduced values in summer. The highest concentration is observed in late autumn, reaching approximately 38 µg/m3, while the lowest levels occur during the warm season, particularly in July, with values around 10 µg/m3. A similar but more pronounced seasonal structure is evident in 2025, where NO2 concentrations follow a strong U-shaped pattern consistent with the basin’s topographic enclosure and atmospheric dynamics. Levels progressively decline through spring, reaching a summer minimum of approximately 11 µg/m3 in June, followed by a sharp and substantial increase in late autumn. An exceptional peak of approximately 74 µg/m3 is recorded in November, followed by persistently high concentrations of about 69 µg/m3 in December and a secondary winter peak of around 36 µg/m3 in February (Figure 9). The highest NO2 concentration recorded in autumn 2022 (~38 µg/m3) exceeded the WHO annual guideline value by approximately 3.8 times and the 24 h guideline value by about 1.5 times. In 2025, NO2 concentrations reached approximately 74 µg/m3 in November and 69 µg/m3 in December, corresponding to around 7.4 and 6.9 times the WHO annual guideline value, respectively, and exceeding the 24 h guideline value by approximately 3 and 2.8 times. Even during the summer minimum period, when concentrations decreased to approximately 10–11 µg/m3, values remained close to or slightly above the WHO annual guideline level. These results indicate that NO2 pollution in Iğdır exhibits a pronounced seasonal pattern, with elevated concentrations particularly during colder months under the influence of increased emissions and unfavorable atmospheric dispersion conditions.
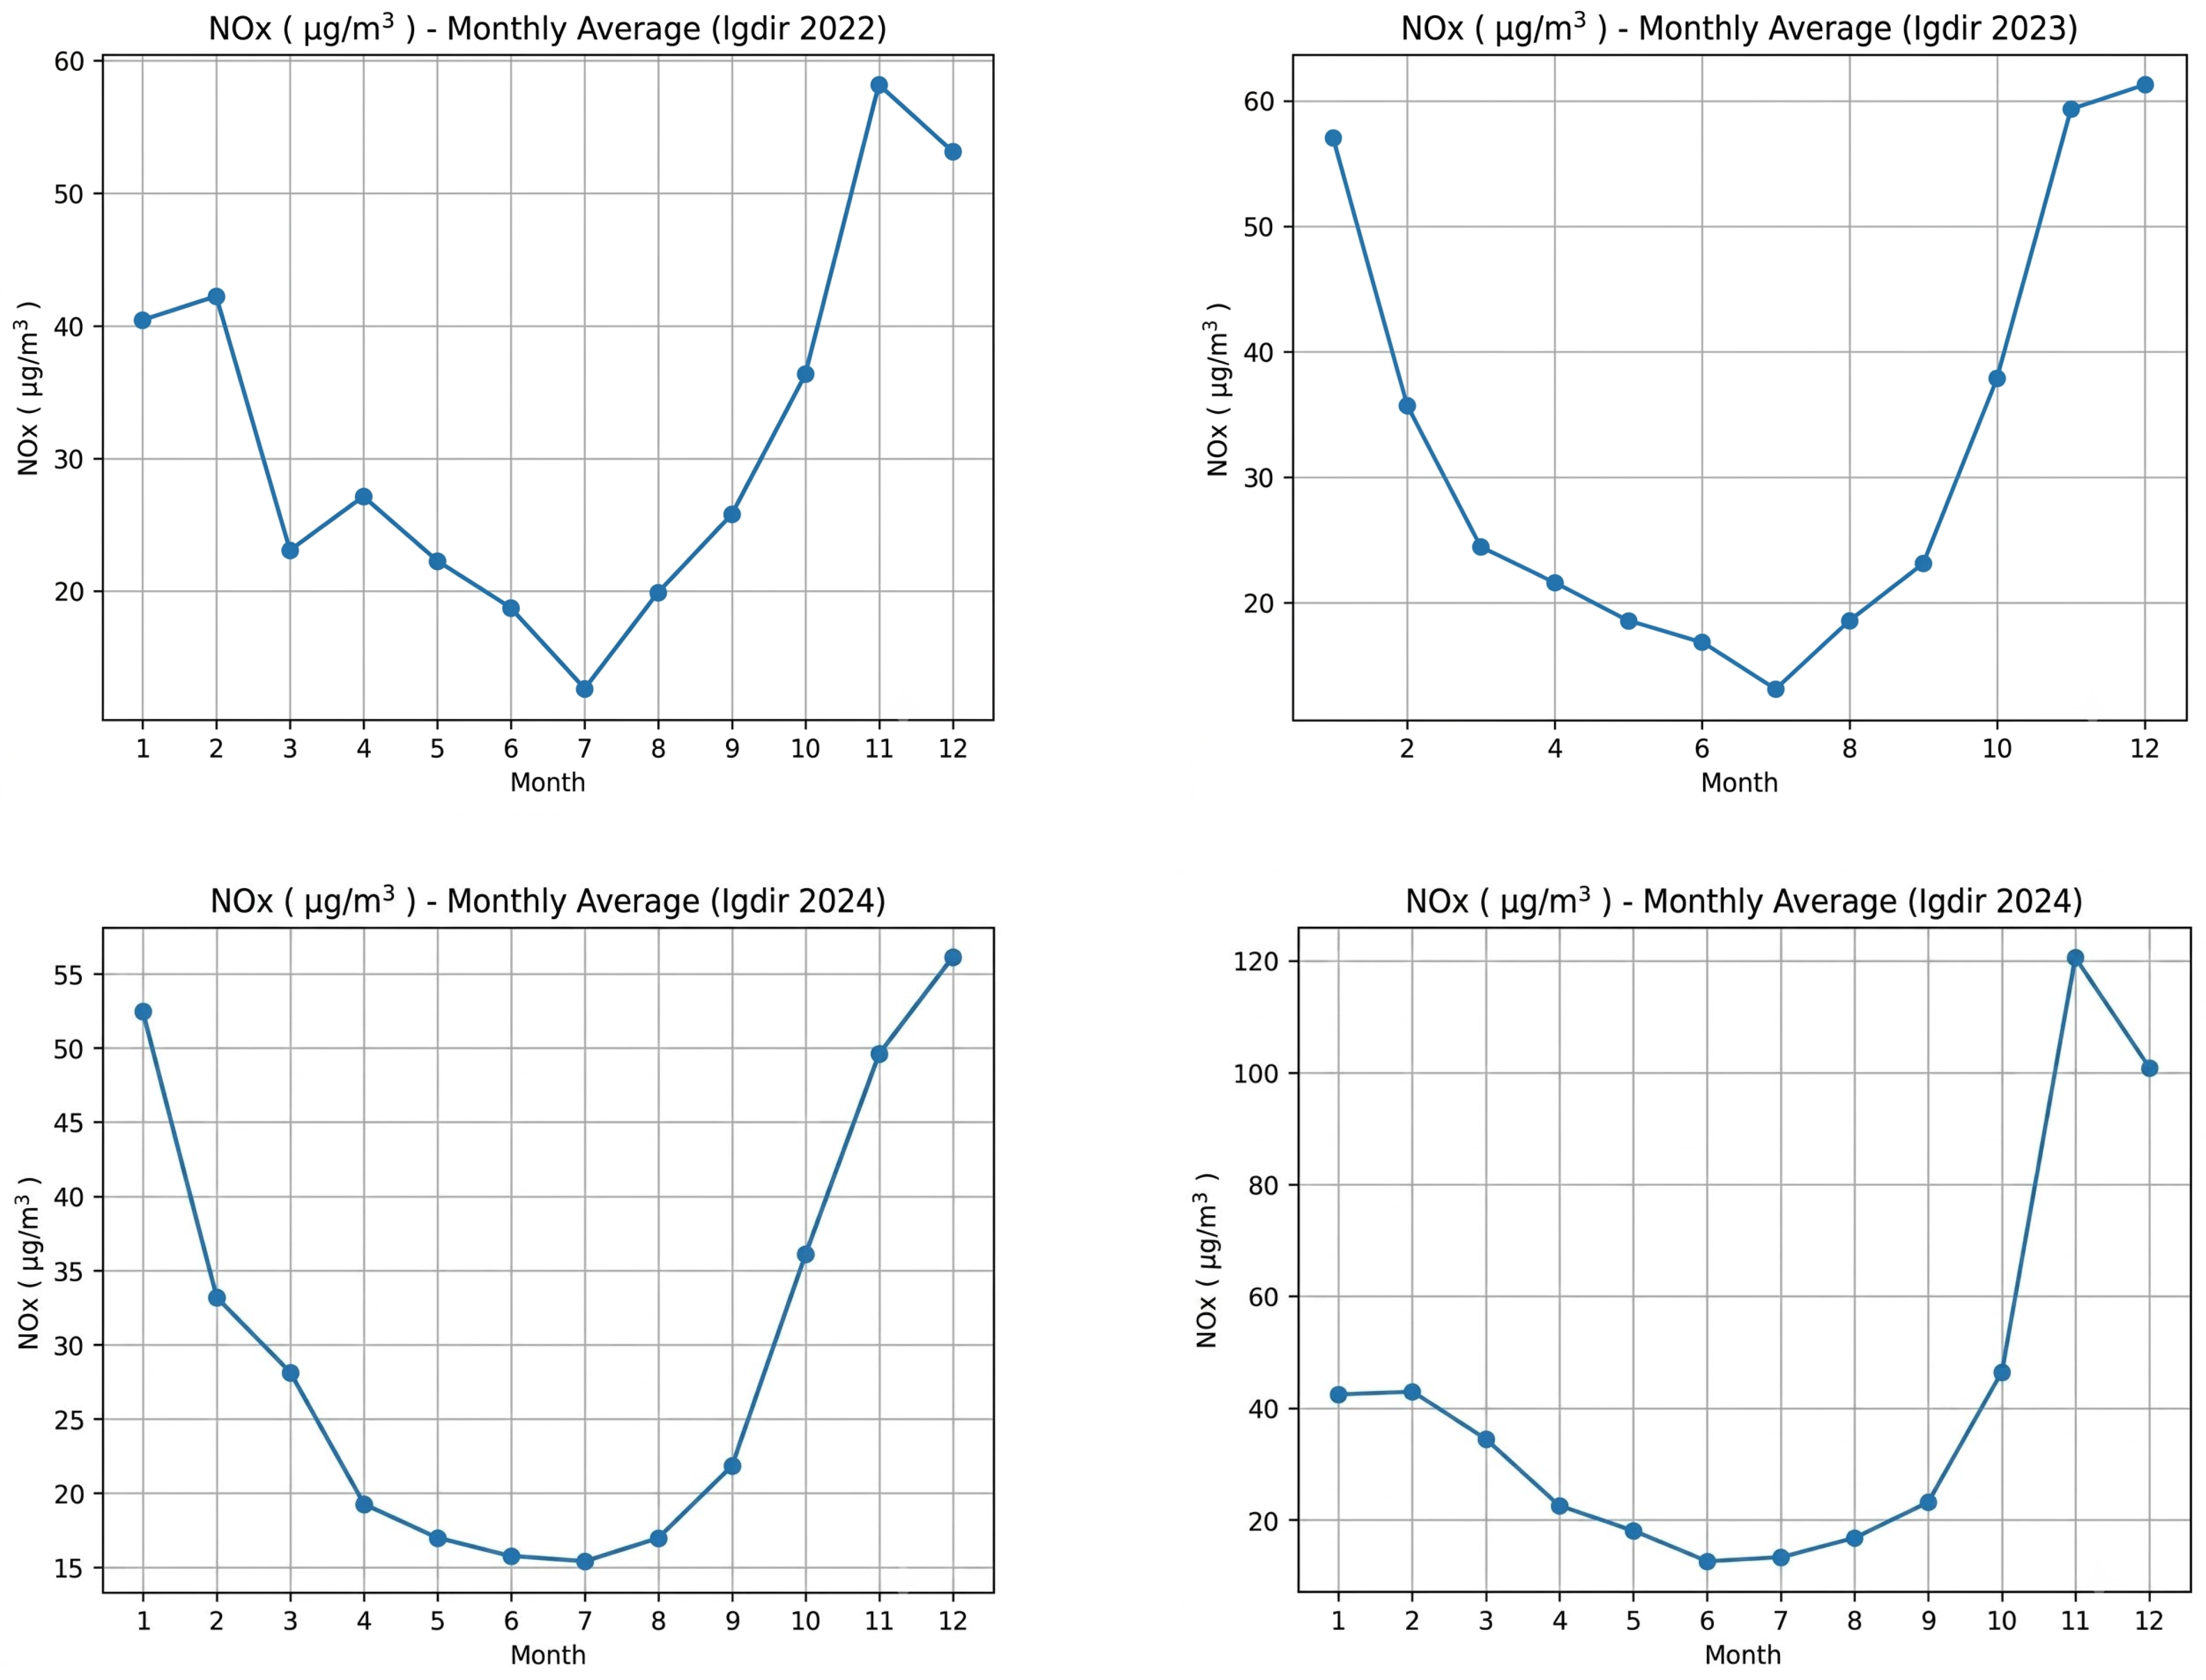
The monthly mean NOx concentrations in Iğdır for 2022 exhibit a pronounced seasonal cycle characterized by elevated levels during the cold period and markedly reduced concentrations in the warm season. A substantial decline is observed during spring and summer, reaching a minimum of approximately 12 µg/m3 in July (Figure 10). Following this low baseline, concentrations increase sharply from early autumn, culminating in a prominent peak of approximately 58 µg/m3 in November, with a secondary winter maximum of about 42 µg/m3 in February. This temporal behavior reflects the combined influence of increased fossil fuel combustion for residential heating and reduced atmospheric mixing heights during late autumn and winter, which enhance the accumulation of combustion-related gaseous pollutants within the topographically confined Iğdır Basin. In 2025, NO concentrations demonstrate a highly asymmetric U-shaped seasonal pattern, characterized by persistently low values throughout the warm season and abrupt intensification in late autumn. Between April and September, concentrations remain stable and minimal, reaching a baseline of approximately 2 µg/m3 in June and July. A rapid increase begins in October (approximately 12 µg/m3), followed by a sharp peak of about 46 µg/m3 in November, after which levels decline to roughly 32 µg/m3 in December. Although the WHO does not provide specific air quality guideline values for total NOx, the observed concentrations indicate pronounced seasonal variability associated with combustion-related emissions. NOx levels increased substantially during late autumn and winter, reaching approximately 58 µg/m3 in November 2022 and 46 µg/m3 in November 2025, while substantially lower concentrations were observed during the warm season. This seasonal pattern reflects the combined influence of increased residential heating emissions, reduced atmospheric mixing, and the enclosed topography of the Iğdır Basin, which promotes the accumulation of combustion-derived pollutants during cold periods.
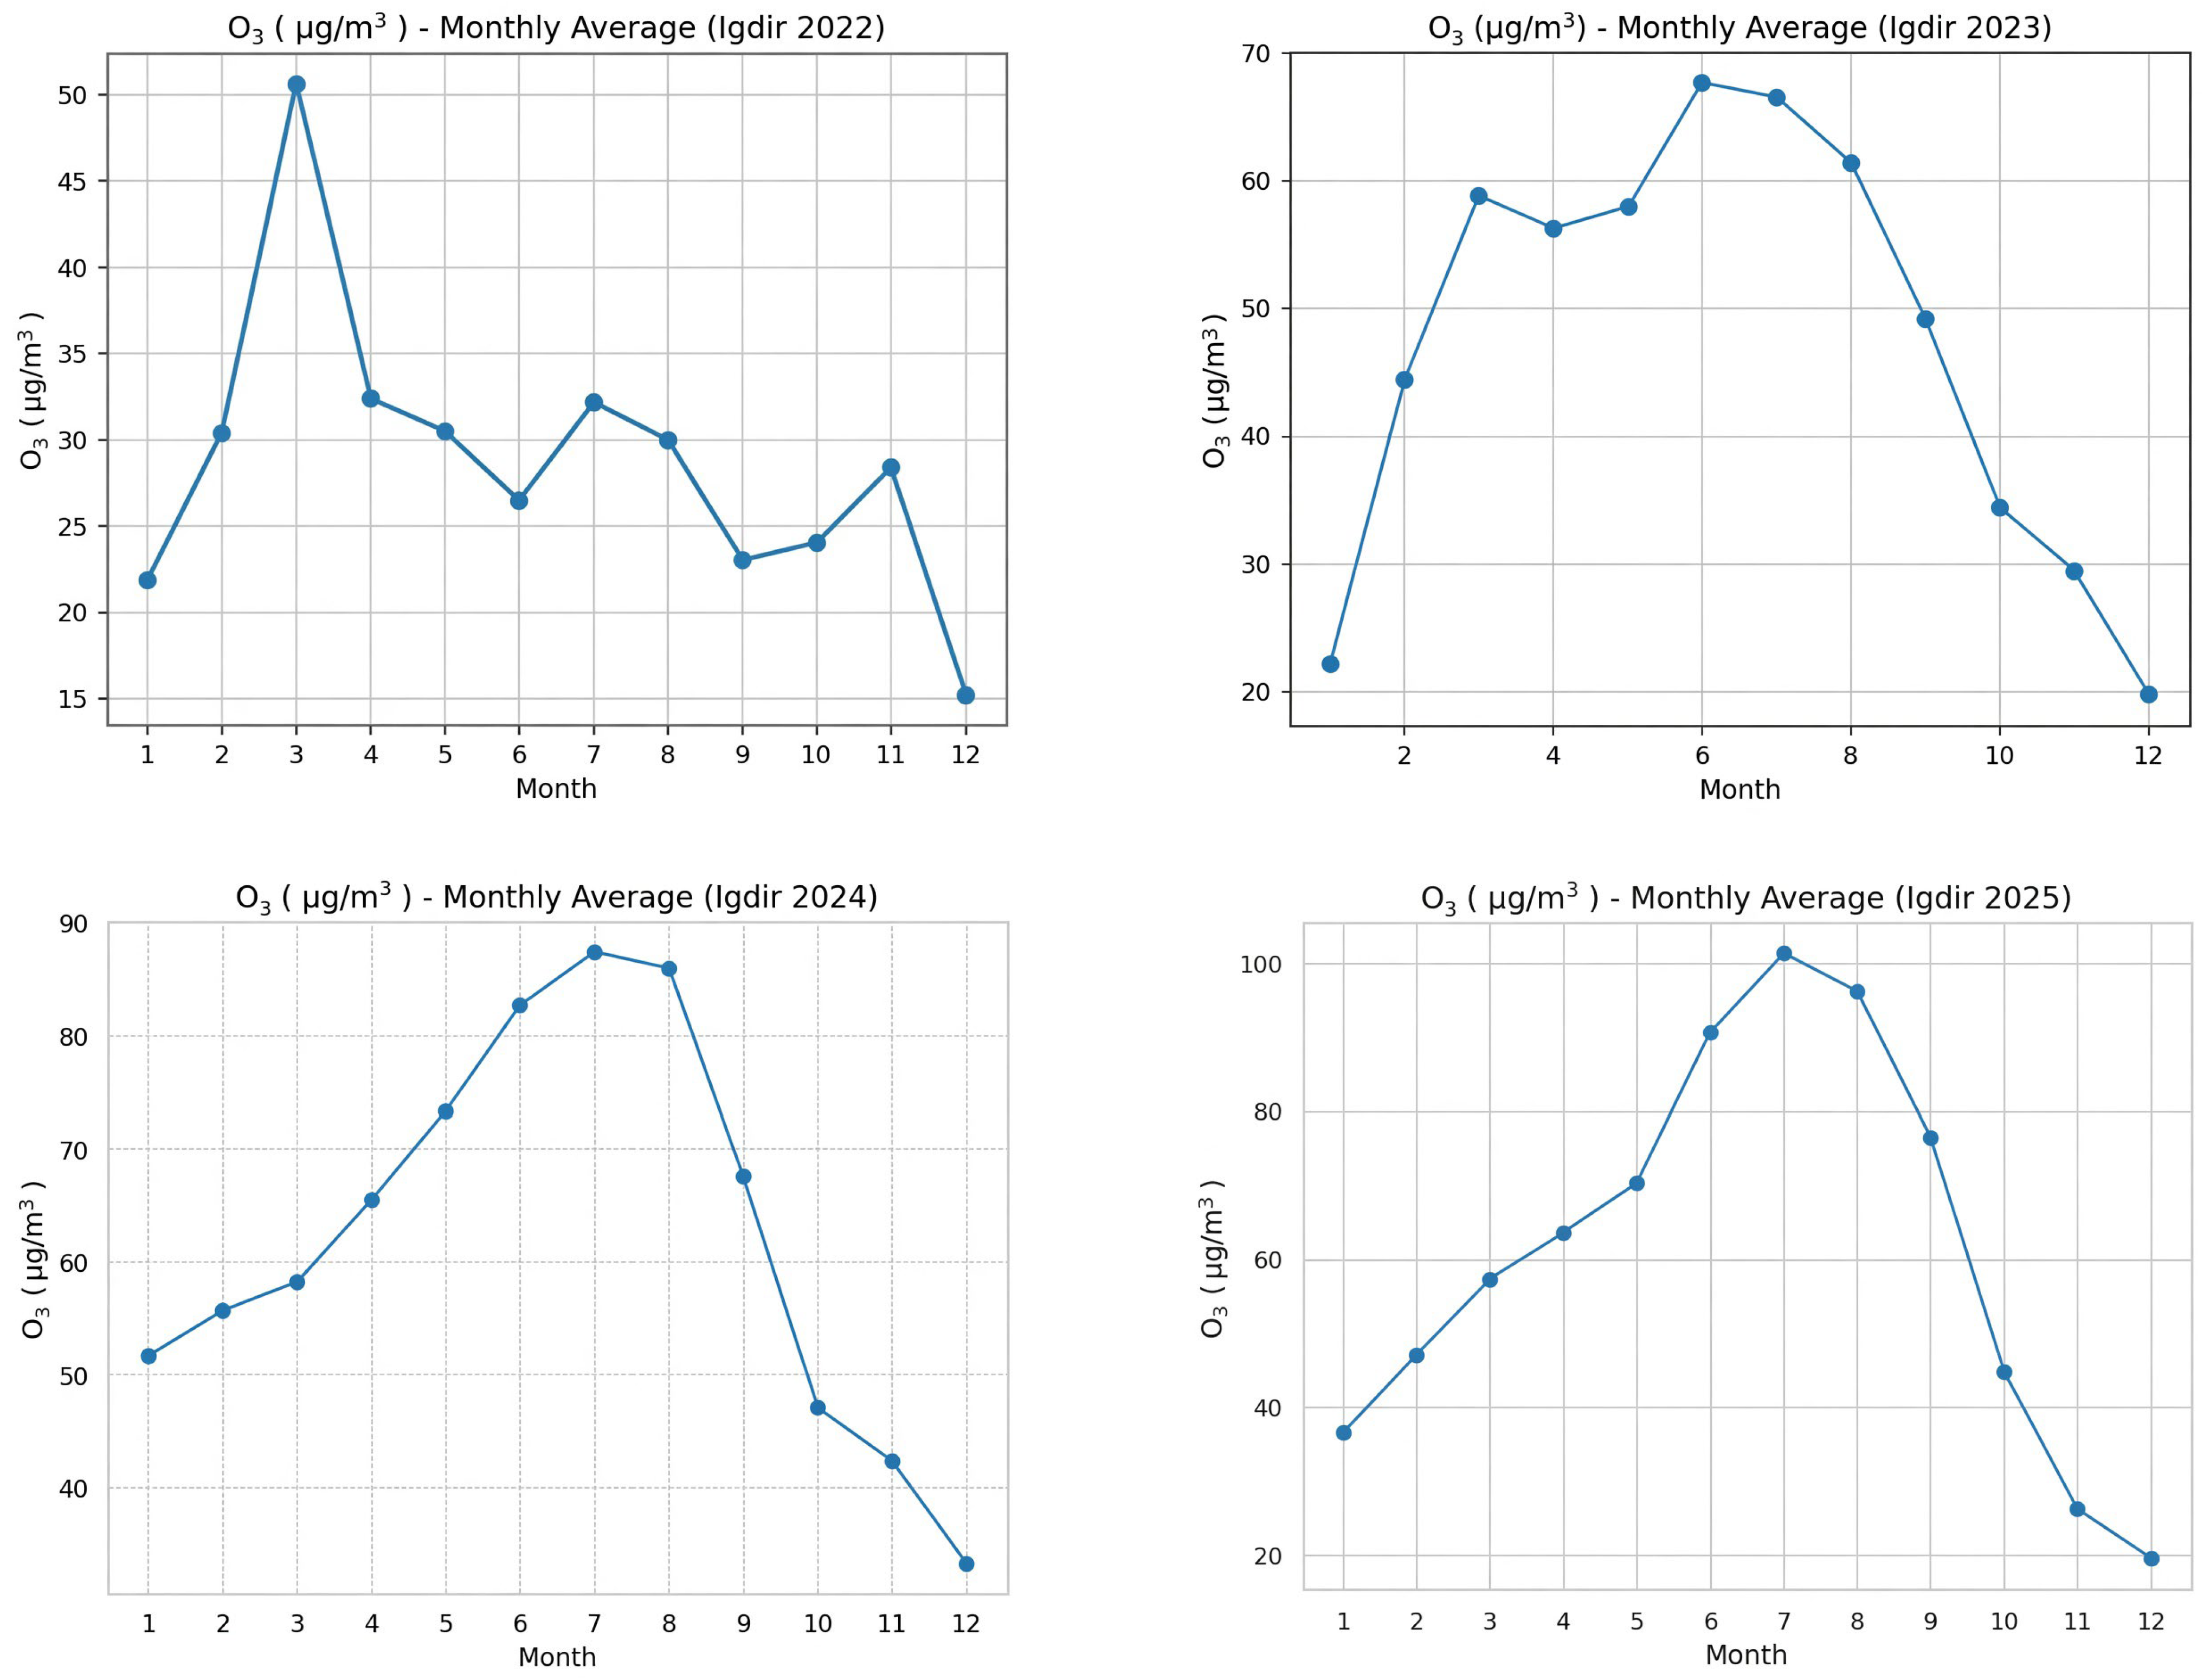
Figure 11 presents the seasonal variation in monthly mean O3 (ozone) concentrations in Iğdır province for 2022 and 2025. In 2022, ozone levels displayed moderate intra-annual variability, reaching a maximum of approximately 50 µg/m3 in March, likely driven by enhanced solar radiation and intensified photochemical activity. Concentrations subsequently decreased to about 26 µg/m3 by June, followed by a modest secondary increase in July (32 µg/m3). During autumn, values remained relatively stable within the range of 23–28 µg/m3, before declining to an annual minimum of approximately 15 µg/m3 in December. In contrast, the 2025 dataset exhibits a more pronounced seasonal amplitude. Starting at 39 µg/m3 in January, ozone concentrations increased steadily through spring, peaking at approximately 101 µg/m3 in July, and remained elevated throughout the summer period. A marked decline was observed thereafter, with values reaching a minimum of about 19 µg/m3 in December. The observed O3 concentrations were evaluated in relation to the WHO air quality guideline value of 100 µg/m3 for the maximum daily 8 h mean ozone concentration. While ozone levels generally remained below this threshold in 2022, concentrations increased substantially during the summer period of 2025, reaching approximately 101 µg/m3 in July and marginally exceeding the WHO guideline level. This seasonal increase is consistent with enhanced photochemical ozone formation under strong solar radiation and warmer atmospheric conditions.

3.2. Spatial and Temporal Distribution of PM10 Concentrations During the Autumn Season (2000–2024)

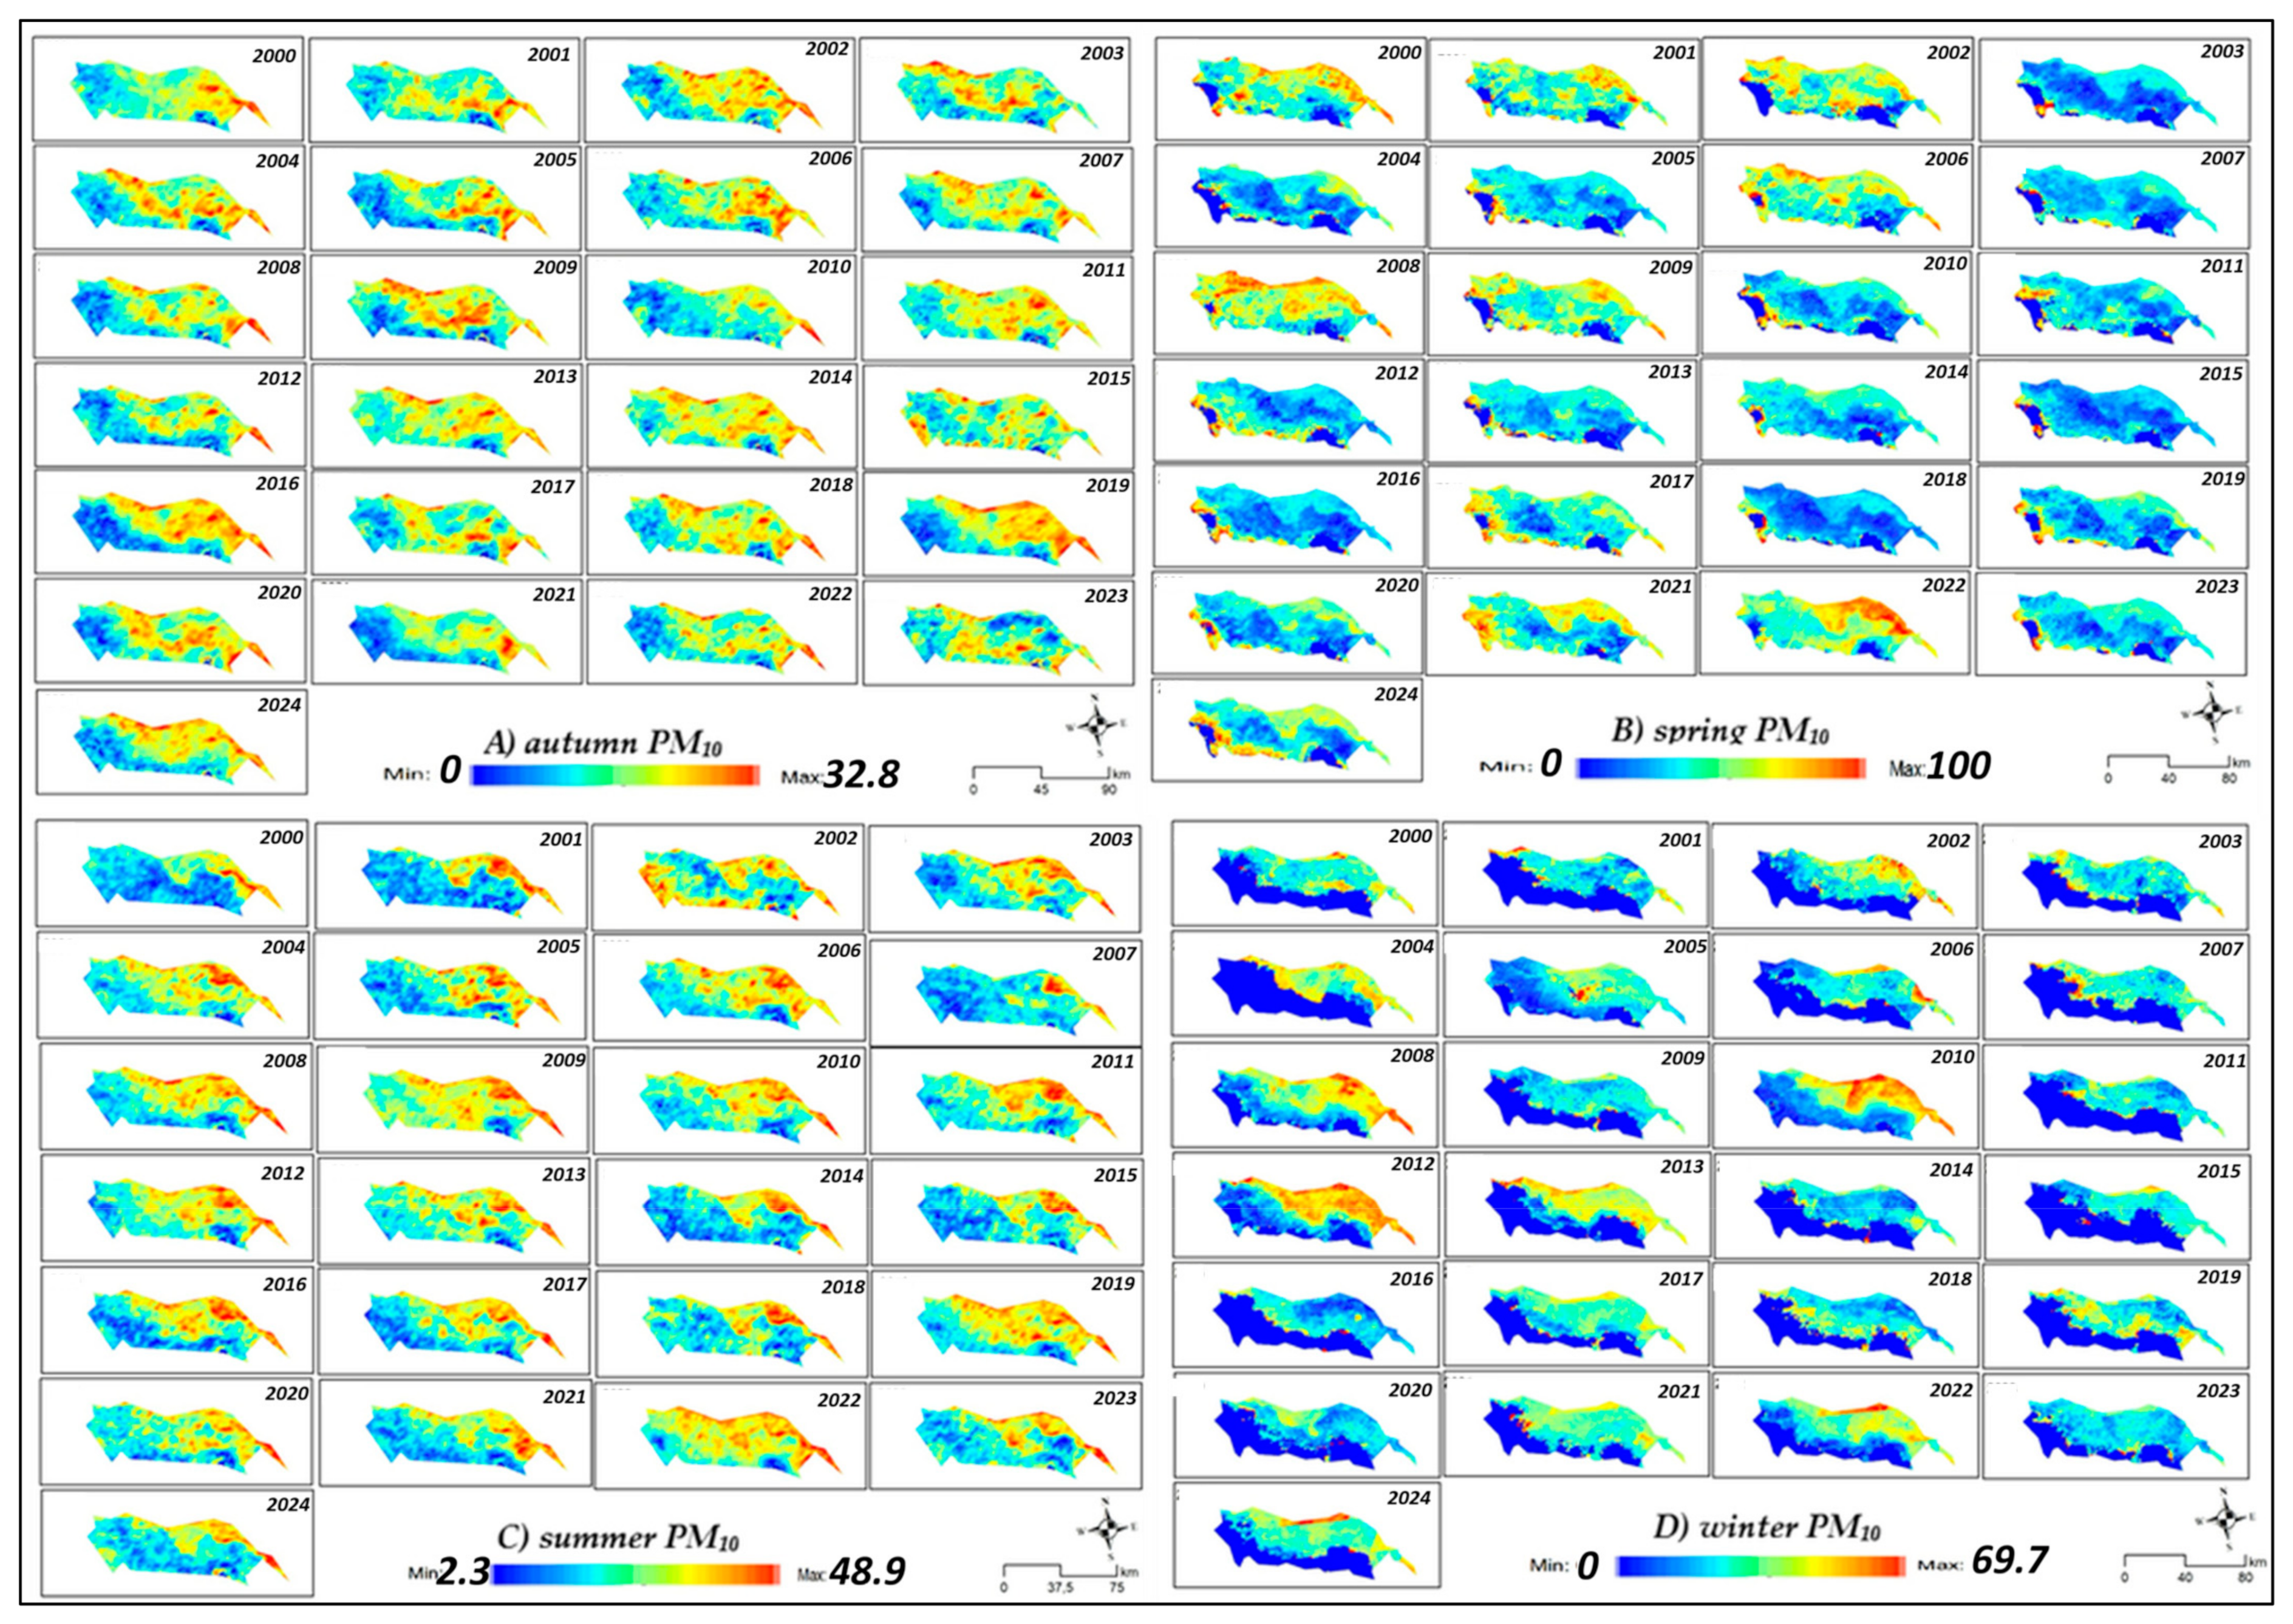
Figure 12 presents the spatiotemporal distribution of autumn PM10 concentrations derived from MODIS satellite data for Türkiye during 2000–2024. The results reveal pronounced spatial and temporal heterogeneity, with concentrations ranging from near 0 to 32.8 µg/m3. The observed color gradient from blue to yellow–orange–red indicates substantial variability in particulate matter levels across the country. The early period (2000–2005) is characterized by relatively elevated PM10 concentrations and extensive high-intensity areas. Between 2006 and 2015, concentrations exhibit considerable interannual variability without a consistent trend. After 2016, a gradual decrease in PM10 levels becomes apparent, with a growing dominance of low-concentration areas, particularly during 2020–2024, suggesting an overall improvement in autumn air quality at the national scale. However, persistently high concentrations remain evident in eastern Türkiye, where values frequently reach 20–32.8 µg/m3. Seasonal patterns indicate that spring and summer PM10 distributions are strongly influenced by regional environmental and climatic controls. Higher concentrations in eastern and southeastern Türkiye are associated with enhanced dust transport, increased agricultural activities, soil erosion, dry conditions, and meteorological factors including prevailing wind regimes and atmospheric stability. In contrast, western and central regions generally exhibit lower PM10 levels. During both seasons, elevated concentrations were more widespread in the early 2000s, followed by substantial interannual fluctuations between 2008 and 2015. A gradual reduction in high-concentration areas is observed after 2016, particularly during 2020–2024, although episodic pollution events continue to occur in dust-prone regions. Winter PM10 concentrations display the strongest regional variability, with values ranging from 0 to 69.7 µg/m3. Elevated concentrations are predominantly observed in eastern and southeastern Türkiye, while western and central areas generally maintain lower levels. This pattern is likely related to winter atmospheric conditions, including temperature inversions, reduced atmospheric mixing, and the accumulation of locally emitted particles. Although a decline in high-PM10 areas is evident after 2016, particularly in 2020–2024, occasional high-concentration episodes persist during winter months, highlighting the continued influence of seasonal meteorological conditions on particulate pollution patterns.
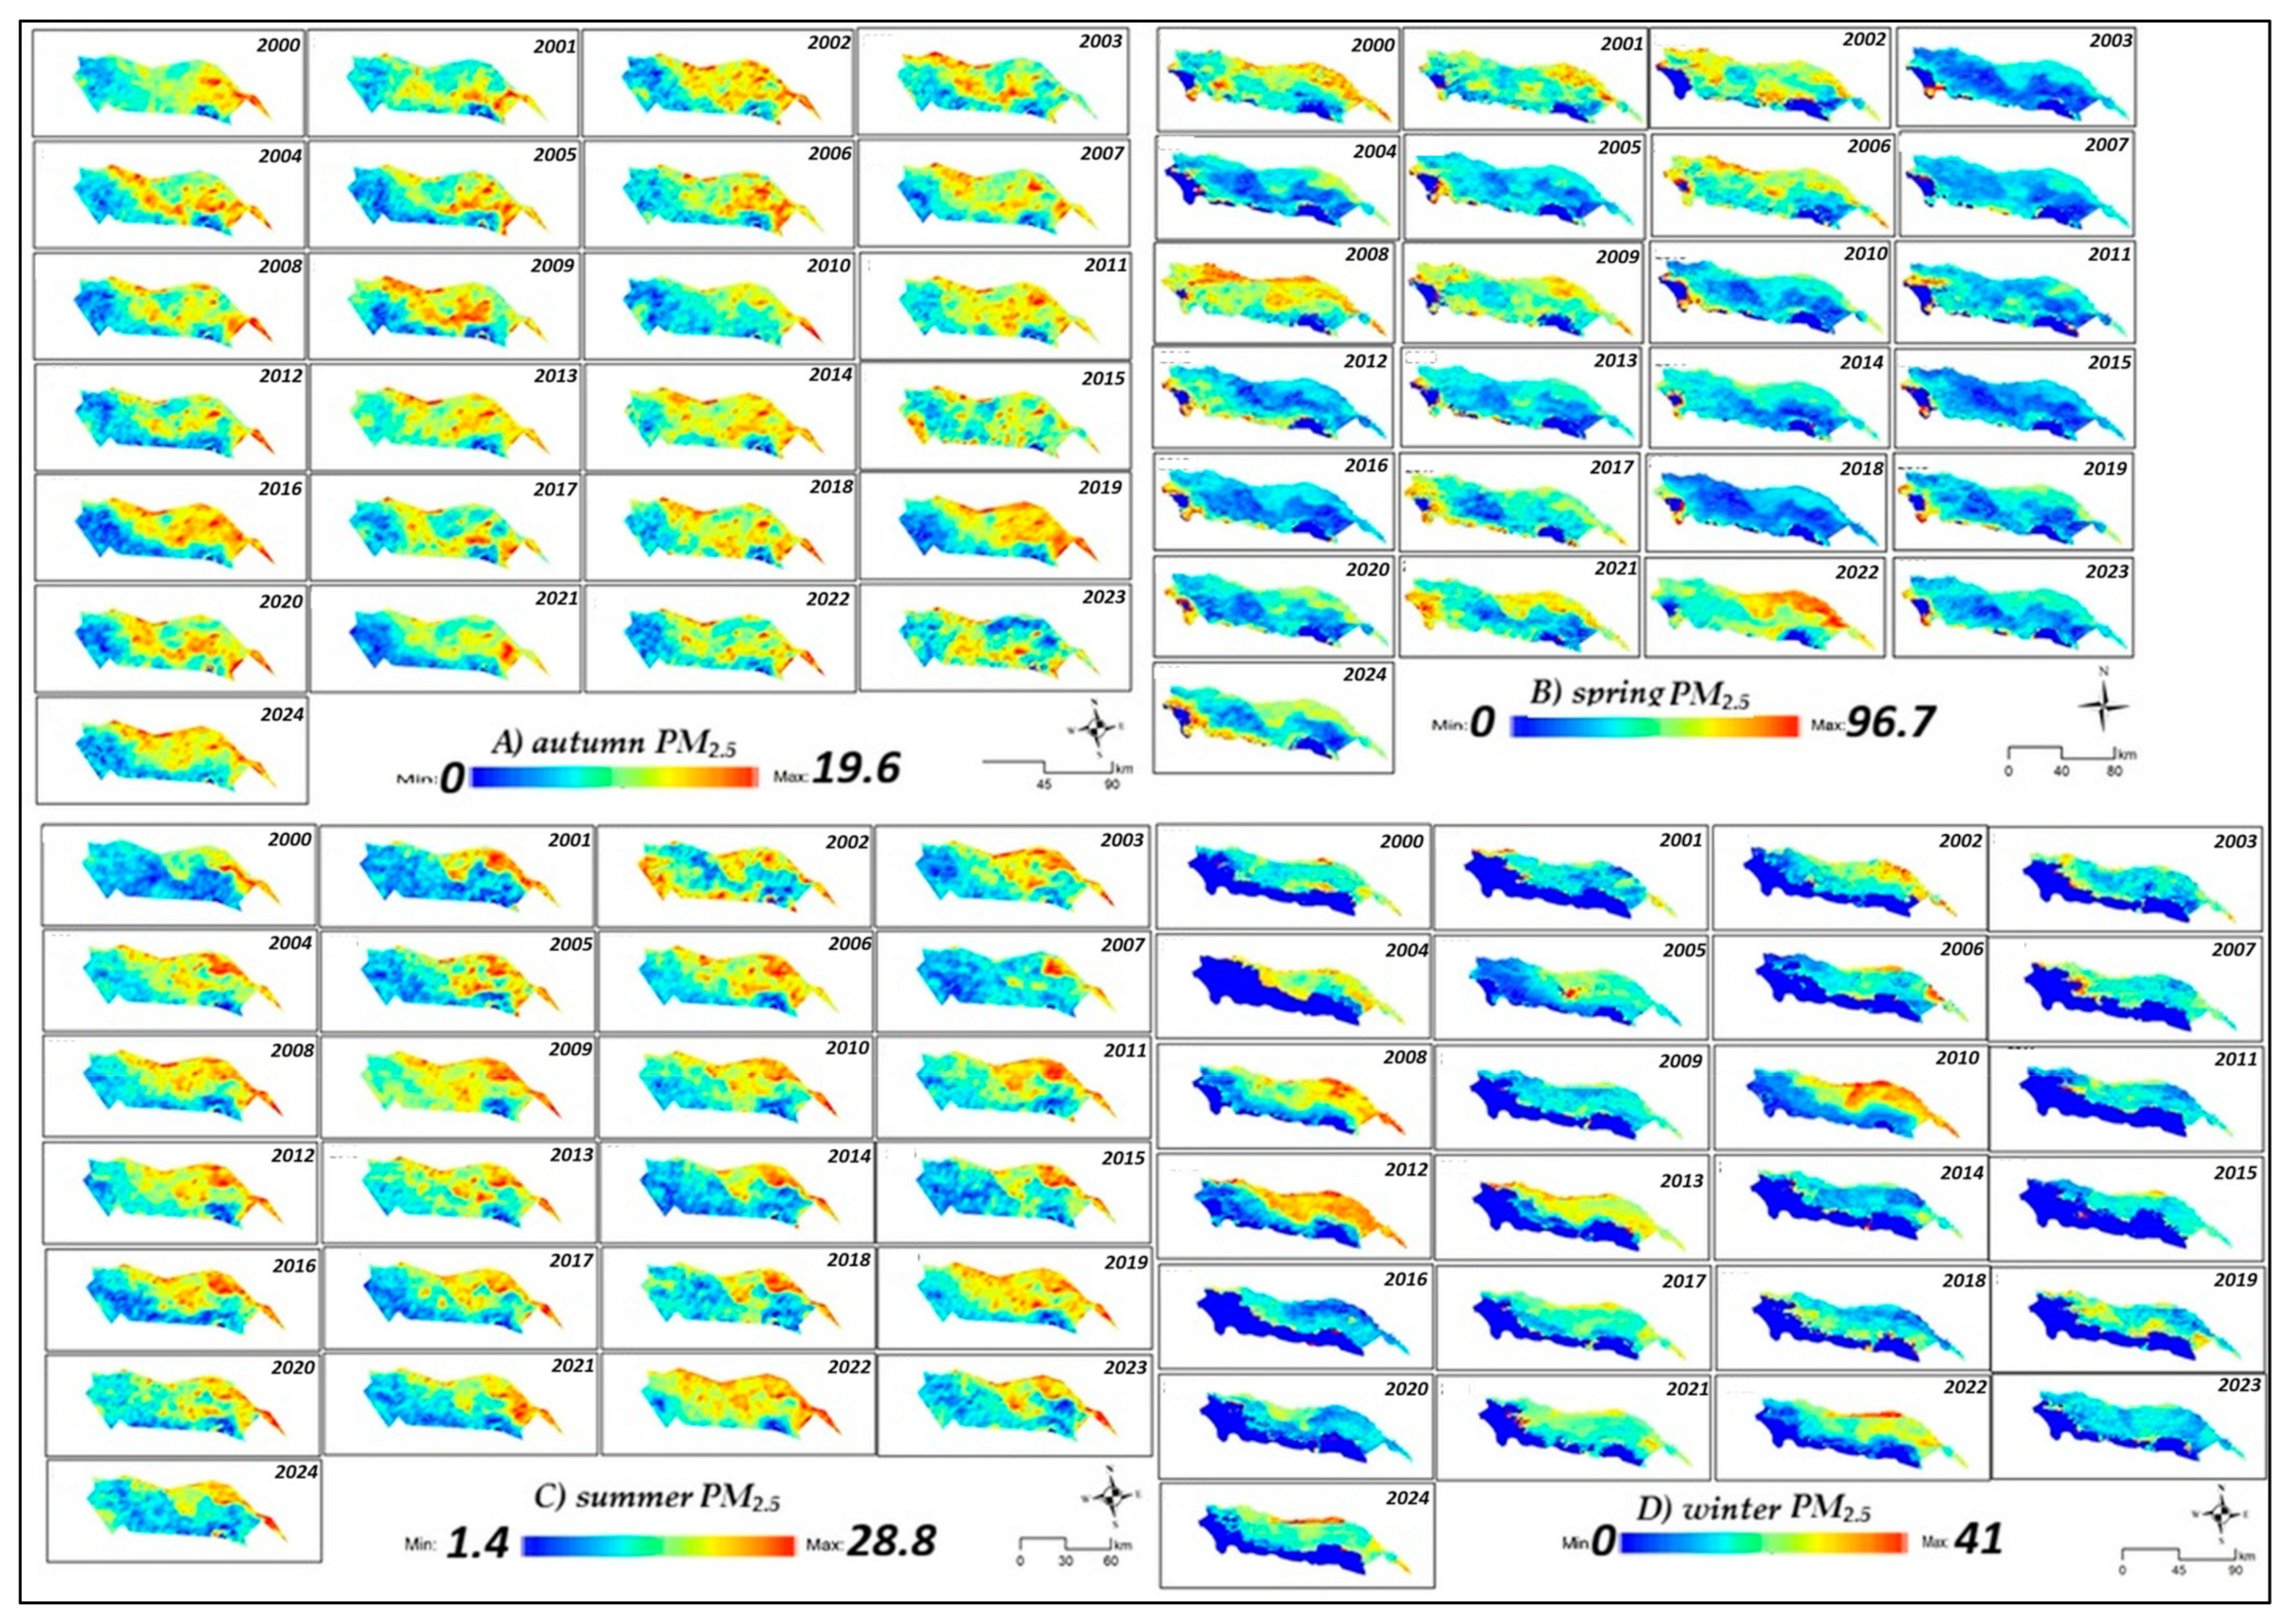
Figure 13 presents the seasonal spatiotemporal distribution of PM2.5 concentrations derived from MODIS satellite data for Iğdır during 2000–2024. The results demonstrate pronounced seasonal and interannual variability in fine particulate matter pollution, with concentration ranges differing substantially among seasons. Autumn PM2.5 concentrations vary from near 0 to 19.6 µg/m3, showing a persistent east–west gradient within the region. Higher concentrations are consistently observed in eastern and southeastern Iğdır, whereas western and central areas exhibit lower levels. This spatial pattern is likely related to post-harvest agricultural activities, soil disturbance, local emission sources, and dry autumn conditions that enhance particulate resuspension. Temporally, elevated PM2.5 levels were more widespread during 2000–2012, followed by a gradual decline after 2013, with a notable reduction in high-concentration areas during 2016–2024. Spring exhibits the highest PM2.5 variability, with concentrations ranging from near 0 to 96.7 µg/m3. Elevated values are predominantly observed in eastern and southeastern Iğdır, reflecting the combined influence of regional dust transport, agricultural activities, wind dynamics, and atmospheric stability conditions. High concentrations were particularly evident during 2000–2008, followed by substantial interannual fluctuations between 2009 and 2015 and a general decreasing trend after 2016. Although the overall reduction continued during 2020–2024, episodic high-concentration events remained detectable. Summer PM2.5 concentrations are comparatively lower, ranging from 1.4 to 28.8 µg/m3. A similar spatial gradient persists, with higher levels concentrated in eastern sectors and lower values dominating western and central areas. The temporal pattern indicates relatively frequent elevated concentrations during 2000–2010, followed by a progressive decline after 2015 and an expansion of low-concentration areas. Compared with other seasons, summer exhibits weaker particulate pollution intensity and lower variability, with recent high-concentration episodes becoming more localized. Winter demonstrates distinct PM2.5 accumulation patterns, with concentrations ranging from 0 to 41 µg/m3. The highest values are concentrated across the Iğdır Plain, where basin topography restricts atmospheric dispersion and promotes pollutant accumulation. These conditions are further intensified by winter heating emissions, frequent temperature inversions, and reduced ventilation. The period 2000–2012 is characterized by extensive high-concentration zones, whereas a gradual reduction in elevated PM2.5 levels becomes evident after 2013, with a more pronounced improvement during 2016–2024. Nevertheless, episodic winter pollution events continue to occur, highlighting the persistent influence of local topography and seasonal meteorological conditions on fine particulate matter variability.

4. Discussion

This study presents a comprehensive epidemiological analysis that holistically evaluates the relationship between air pollution (PM10, PM2.5, and SO2) and respiratory disease burden in a topographically enclosed region with limited atmospheric circulation, such as the Iğdır Basin, during the period 2020–2026.
The winter-dominant peak in PM2.5 and SO2 concentrations, associated with COPD exacerbations and chronic bronchitis in older males, coincides with the same basin-trapping mechanism (temperature inversion and limited ventilation) that produces the sharpest east–west concentration gradients in winter. Similarly, the summer–autumn dust-driven rise in PM10, linked in this study to asthma and acute bronchitis exacerbations, corresponds spatially to the same eastern and southeastern sectors that show persistently elevated PM10 values across the 2000–2024 series (Figure 12 and Figure 13). Taken together, these parallel patterns suggest that the populations most exposed to the highest pollutant loads, both temporally and spatially, are plausibly also those bearing the greatest respiratory disease burden.
The findings indicate a significant association between air pollution dynamics and respiratory disease incidence [21,22]. The findings reveal a significant increase in respiratory diseases, particularly during winter periods when PM2.5 and SO2 concentrations are high. This can be explained by fine particulate matter reaching the alveolar level, increasing oxidative stress, inflammation, and airway hyperreactivity [23,24]. The mountainous topography surrounding the Iğdır Basin limits atmospheric ventilation, causing pollutants to accumulate in near-surface layers and thus increasing exposure doses. This mechanism supports the concentration of chronic and infectious diseases, particularly COPD and pneumonia, in older age groups [25,26]. The observed increases in PM10 levels during the summer and autumn periods are related to dust transport and surface resuspension. This coarse particulate exposure leads to symptom exacerbations, especially in diseases with high airway sensitivity such as asthma and bronchitis. Time series findings show that seasonal peaks in air pollution parallel fluctuations in disease burden [27,28]. From an epidemiological perspective, the contrasting trends in asthma and bronchitis cases suggest an impact of chronic inflammation related to air pollution exposure on disease classification. Specifically, increased exposure to fine particulate matter (PM2.5) correlates with a rise in asthma diagnoses, while the decrease in bronchitis cases may be related to possible diagnostic reclassification or clinical coding changes [29]. Conversely, the observed increase in COPD and pneumonia reflects the cumulative effect of long-term pollutant exposure and weakening of the immune system. Demographic analyses show that the impact of air pollution differs significantly according to age and gender. Children are more susceptible to particulate matter due to their developing respiratory systems, while the risk increases in older age groups due to decreased pulmonary reserve and immunosenescence [30,31]. By gender, the burden of COPD and tuberculosis is higher in men, while the prevalence of asthma is higher in women; these differences are related to both biological susceptibility and different exposure profiles. In conclusion, the findings suggest that the burden of respiratory system diseases in the Iğdır Basin is associated with air pollution levels, and that the basin's enclosed topography, seasonal atmospheric stability, and demographic vulnerabilities may have influenced this observed association. These findings highlight the need for regional-level air pollution control policies to be evaluated in conjunction with health outcomes. Table 2 presents a structured comparison of major environmental exposures and their associated respiratory health outcomes, emphasizing temporal variability, population susceptibility, and underlying epidemiological mechanisms.
Anthropogenic fine particulate matter (PM2.5) and sulfur dioxide (SO2) demonstrate a pronounced seasonal pattern, with peak health impacts during the winter months, particularly November to December [32,33]. This temporal concentration is primarily driven by temperature inversion events and enhanced atmospheric stability, which restrict vertical dispersion of pollutants and facilitate their accumulation within the near-surface boundary layer. Under these conditions, prolonged exposure leads to elevated oxidative stress, epithelial injury at the alveolar level, and systemic inflammatory responses. Consequently, older adult males (≥65 years) and young children (0–5 years) represent the most vulnerable groups, with a marked increase in COPD exacerbations, pneumonia, and chronic bronchitic conditions.
In contrast, climatologically driven PM10 exposure exhibits a stronger dependence on land surface processes, particularly during the summer and autumn seasons when drought intensity and wind erosion are most pronounced [34,35]. This pathway reflects the mobilization of crustal dust particles rather than direct anthropogenic emissions. The resulting exposure disproportionately affects females aged 35–50 and young children, who exhibit higher susceptibility to airway inflammation and hypersensitivity reactions. Clinically, this manifests as increased asthma attacks and episodes of acute bronchitis, mediated through mechanical irritation of the respiratory epithelium and activation of inflammatory cascades in hyperresponsive airways [36,37]. Indoor biomass combustion represents a distinct exposure category characterized by chronic, year-round inhalation of fine particulates in confined environments [38,39]. This source is particularly relevant for female populations across all age groups, reflecting sustained domestic exposure patterns. The epidemiological burden is expressed through elevated asthma prevalence and persistent respiratory symptoms. Mechanistically, the combined effect of prolonged particulate exposure and physiological susceptibility potentially modulated by hormonal and behavioral factors contributes to cumulative airway damage and chronic respiratory dysfunction [40,41].
In summary, the integrated assessment highlights a clear differentiation between seasonal outdoor pollution episodes and persistent indoor exposure pathways. While outdoor pollutants primarily exert acute or subacute effects modulated by atmospheric conditions, indoor biomass exposure generates a chronic baseline risk. This dual structure of exposure underscores the importance of both climate-sensitive air quality management strategies and targeted household-level interventions in reducing the overall respiratory disease burden (Table 2).

Limitations and Future Research Direction

This study has several limitations that should be considered when interpreting the findings. First, due to its retrospective ecological design, the analyses were based on hospital records, which may introduce potential information biases, including incomplete records, diagnostic coding inconsistencies, and the exclusion of individuals who did not seek medical care. In addition, diagnostic overlap and possible reclassification between respiratory diseases, particularly asthma and bronchitis, may have influenced the interpretation of temporal trends. Therefore, the observed associations should be interpreted as population-level relationships rather than direct evidence of individual-level causation. Second, the relatively low number of cases in some disease categories, particularly tuberculosis, pleurisy, and hydatid cyst, reduced statistical power and limited the depth of subgroup analyses. Third, the lack of individual-level exposure information, including smoking status, occupational exposure, indoor air pollution, residential history, and comorbidities, prevented a more precise assessment of personal exposure profiles. Another important limitation is related to air quality assessment. Air pollutant concentrations were obtained from a single ground monitoring station, which may not fully represent the spatial variability of pollutant distributions across the Iğdır Basin, where complex topography, atmospheric inversions, and localized emission sources strongly influence air quality patterns. Furthermore, satellite-derived PM2.5 and PM10 estimates based on MODIS aerosol products rely on indirect retrieval algorithms rather than direct measurements and therefore involve uncertainties, particularly in enclosed basins characterized by complex boundary-layer dynamics and local microclimatic conditions. In addition, this study could not quantitatively separate the contributions of different particulate matter sources, such as traffic emissions, residential heating, industrial activities, and natural dust transport. Although meteorological variables were incorporated into the analyses, the independent effects of individual climatic factors could not be completely isolated due to the complex interactions between atmospheric conditions, pollutant dispersion, and seasonal variability.
Future studies should address these limitations by integrating multi-site air quality monitoring networks, satellite observations, and chemical transport models to improve spatial representation and source attribution. The application of advanced statistical approaches, including generalized additive models (GAMs), distributed lag models, and machine learning-based frameworks, may provide deeper insights into the temporal dynamics of air pollution–health relationships. Moreover, prospective cohort studies incorporating individual-level exposure measurements would be valuable for establishing stronger causal evidence. Multicenter investigations in comparable topographically enclosed basins would further improve the generalizability of findings. Finally, assessing future air pollution scenarios and associated respiratory disease burdens under climate change projections may provide important evidence for regional environmental health policies.

5. Conclusions

This study comprehensively evaluated the epidemiological patterns of major respiratory system diseases and their relationship with environmental air pollution in Iğdır province, Türkiye, between 2020 and 2026. The findings reveal that asthma and COPD are the two main pathologies determining the disease burden in the region. While asthma cases showed a significant female predominance and a bimodal age distribution, COPD cases showed a male predominance and a significant increase concentrated in older age groups. Bronchitis cases exhibited a more balanced gender distribution, while a bimodal age structure was noteworthy. Tuberculosis, despite a limited number of cases, was more concentrated in men and in young-middle age groups. Air quality analyses showed significant seasonal and long-term fluctuations during the study period. PM10 and PM2.5 concentrations showed sharp increases, particularly during winter months, exceeding national and international threshold values; this situation was associated with basin topography, temperature inversions, and emissions from domestic heating. SO2 levels similarly increased during the winter period, while ozone concentrations reached maximum values in the summer months due to the effect of photochemical processes. These atmospheric patterns may have contributed to the observed temporal changes in the incidence of respiratory diseases. The closed topographical structure of the Iğdır Basin creates a high-risk microenvironment by increasing the accumulation of pollutants in the atmosphere. This situation leads to a more significant health burden, especially for children, elderly groups, and individuals with pre-existing conditions. Age- and gender-related differences become more significant when evaluated together with behavioral and environmental exposure factors, as well as biological susceptibilities.
In conclusion, the findings indicate that air pollution patterns are associated with the burden of respiratory diseases in a closed-basin environment. Effective public health interventions necessitate the implementation of emission reduction strategies, particularly during winter inversion periods, the strengthening of early warning and surveillance systems, the development of age- and gender-sensitive early diagnosis programs, and increased community-based awareness campaigns. In the future, the application of advanced modeling techniques, including time series analysis and spatial epidemiology approaches, will contribute to a clearer understanding of causal relationships. In this context, integrating environmental policies and health strategies in microclimatic risk areas like Iğdır is critical for sustainable public health outcomes.

Author Contributions

M.B.A.: Formal analysis, Validation, Visualization, Writing—original draft, Writing, review & editing. F.Ş.: Formal analysis, Investigation, Validation, Visualization, Writing—original draft, Writing, review & editing. M.A.Ç.: Methodology, Software, Conceptualization, Data curation, Investigation, Resources, Writing—review & editing, Supervision. All authors have read and agreed to the published version of the manuscript.

Funding

The authors received no specific financial support from any public, commercial, or not-for-profit funding agency for the conduct of this study.

Data Availability Statement

The MODIS-derived dataset used in this study is available from the corresponding author upon reasonable request, subject to the data sharing conditions of the source reanalysis product and the processed dataset files used in the present analysis.

Acknowledgments

During the preparation of this manuscript, the authors used AI-assisted language tools solely for language editing, grammar correction, and translation support. These tools were not used to generate scientific ideas, study design, methodology, data analysis, results, interpretations, or conclusions. The authors carefully reviewed and edited the final manuscript and take full responsibility for its content.

Conflicts of Interest

The authors declare no conflict of interest.

References

  1. Goldstein, G.; Rossi-Espagnet, A.; Tabibzadeh, I. How the World Health Organization Supports Urban Health Development. In Urban Health in Developing Countries; Routledge: London, UK, 2017; pp. 110–122. [Google Scholar] [CrossRef] [Scilit]
  2. Mannucci, P.; Franchini, M. Health Effects of Ambient Air Pollution in Developing Countries. Int. J. Environ. Res. Public Health 2017, 14, 1048. [Google Scholar] [CrossRef] [Scilit] [PubMed]
  3. Chena, F.; Chen, Z. Cost of economic growth: Air pollution and health expenditure. Sci. Total Environ. 2021, 755, 142543. [Google Scholar] [CrossRef] [Scilit] [PubMed]
  4. Sivarethinamohana, R.; Sujathab, S.; Sankar, S.; Gafoore, A.; Rahman, Z. Impact of air pollution in health and socio-economic aspects: Review on future approach. Mater. Today Proc. 2021, 37, 2725–2729. [Google Scholar] [CrossRef] [Scilit]
  5. Sharma, P.; Jain, P.; Pragati; Kumar, S. Evaluating Health Impact of Air Pollution. Environ. Ecol. Res. 2019, 7, 59–72. [Google Scholar] [CrossRef] [Scilit]
  6. Bălă, G.-P.; Râjnoveanu, R.-M.; Tudorache, E.; Motișan, R.; Oancea, C. Air pollution exposure the (in)visible risk factor for respiratory diseases. Environ. Sci. Pollut. Res. 2021, 28, 19615–19628. [Google Scholar] [CrossRef] [Scilit] [PubMed]
  7. Dondi, A.; Carbone, C.; Manieri, E.; Zama, D.; Del Bono, C.; Betti, L.; Biagi, C.; Lanari, M. Outdoor Air Pollution and Childhood Respiratory Disease: The Role of Oxidative Stress. Int. J. Mol. Sci. 2023, 24, 4345. [Google Scholar] [CrossRef] [Scilit] [PubMed]
  8. Hamanaka, R.B.; Mutlu, G.M. Particulate matter air pollution: Effects on the respiratory system. J. Clin. Investig. 2025, 135, e194312. [Google Scholar] [CrossRef] [Scilit] [PubMed]
  9. Largeron, Y.; Staquet, C. Persistent inversion dynamics and wintertime PM10 air pollution in Alpine valleys. Atmos. Environ. 2016, 135, 92–108. [Google Scholar] [CrossRef] [Scilit]
  10. Feng, X.; Wei, S.; Wang, S. Temperature inversions in the atmospheric boundary layer and lower troposphere over the Sichuan Basin, China: Climatology and impacts on air pollution. Sci. Total Environ. 2020, 726, 138579. [Google Scholar] [CrossRef] [Scilit] [PubMed]
  11. Argun, Y.A.; Tırınk, S.; Bayram, T. Effect of Urban Factors on Air Pollution of Igdir. Black Sea J. Eng. Sci. 2019, 2, 123–130. [Google Scholar] [CrossRef] [Scilit]
  12. Aydın, T. Iğdır Şehrinde Önemli Bir Çevresel Sorun Oluşturan Hava Kirliliğinin Coğrafi Açıdan İncelenmesi. In Proceedings of the Kültür ve Tarih Bağlamında Uluslararası Iğdır Sempozyumu, Iğdır, Turkey, 5–7 November 2015; p. 216. [Google Scholar]
  13. Çelik, M.A.; Bilik, A.; Akiner, M.E. Relation Between Air Quality and Wind Speed in the Eastern Anatolia Region of Türkiye. Pure Appl. Geophys. 2026, 183, 3159–3184. [Google Scholar] [CrossRef] [Scilit]
  14. Kawano-Dourado, L.; Glassberg, M.K.; Assayag, D.; Borie, R.; Johannson, K.A. Sex and gender in interstitial lung diseases. Eur. Respir. Rev. 2021, 30, 210105. [Google Scholar] [CrossRef] [Scilit] [PubMed]
  15. Silveyra, P.; Babayev, M.; Ekpruke, C.D. Sex, hormones, and lung health. Physiol. Rev. 2026, 106, 53–86. [Google Scholar] [CrossRef] [Scilit] [PubMed]
  16. Brauer, M. How Much, How Long, What, and Where: Air Pollution Exposure Assessment for Epidemiologic Studies of Respiratory Disease. Proc. Am. Thorac. Soc. 2010, 7, 111–115. [Google Scholar] [CrossRef] [Scilit] [PubMed]
  17. Rushworth, A.; Lee, D.; Mitchell, R. A spatio-temporal model for estimating the long-term effects of air pollution on respiratory hospital admissions in Greater London. Spat. Spatio-Temporal Epidemiol. 2014, 10, 29–38. [Google Scholar] [CrossRef] [Scilit] [PubMed]
  18. Tavallali, P.; Gharibi, H.; Singhal, M.; Schweizer, D.; Cisneros, R. A multi-pollutant model: A method suitable for studying complex relationships in environmental epidemiology. Air Qual. Atmos. Health 2020, 13, 645–657. [Google Scholar] [CrossRef] [Scilit]
  19. van Donkelaar, A.; Martin, R.V.; Park, R.J. Estimating ground-level PM2.5 using aerosol optical depth determined from satellite remote sensing. J. Geophys. Res. Atmos. 2006, 111, D21201. [Google Scholar] [CrossRef] [Scilit]
  20. Zhang, Y.; Li, Z. Remote sensing of atmospheric fine particulate matter (PM2.5) mass concentration near the ground from satellite observation. Remote Sens. Environ. 2015, 160, 252–262. [Google Scholar] [CrossRef] [Scilit]
  21. Hu, H.; Liu, X.; Zheng, Y.; He, X.; Hart, J.; James, P.; Laden, F.; Chen, Y.; Bian, J. Methodological challenges in spatial and contextual exposome-health studies. Crit. Rev. Environ. Sci. Technol. 2022, 53, 827–846. [Google Scholar] [CrossRef] [Scilit] [PubMed]
  22. Clark, L.P.; Zilber, D.; Schmitt, C.; Fargo, D.C.; Reif, D.M.; Motsinger-Reif, A.A.; Messier, K.P. A review of geospatial exposure models and approaches for health data integration. J. Expo. Sci. Environ. Epidemiol. 2024, 35, 131–148. [Google Scholar] [CrossRef] [Scilit] [PubMed]
  23. Seaton, A.; Godden, D.; MacNee, W.; Donaldson, K. Particulate air pollution and acute health effects. Lancet 1995, 345, 176–178. [Google Scholar] [CrossRef] [Scilit] [PubMed]
  24. Valavanidis, A.; Fiotakis, K.; Vlachogianni, T. Airborne Particulate Matter and Human Health: Toxicological Assessment and Importance of Size and Composition of Particles for Oxidative Damage and Carcinogenic Mechanisms. J. Environ. Sci. Health Part C 2008, 26, 339–362. [Google Scholar] [CrossRef] [Scilit] [PubMed]
  25. Malek, E.; Davis, T.; Martin, R.S.; Silva, P.J. Meteorological and environmental aspects of one of the worst national air pollution episodes (January, 2004) in Logan, Cache Valley, UT, USA. Atmos. Res. 2006, 79, 108–122. [Google Scholar] [CrossRef] [Scilit]
  26. Wani, M.A.; Wani, D.M.; Naik, S.; Mayer, I.A. Geographical vulnerability to respiratory infections using GIS technique- micro analysis study in the Himalayan region-India. GeoJournal 2020, 87, 1193–1215. [Google Scholar] [CrossRef] [Scilit]
  27. Shin, H.H.; Owen, J.G.; Mitchell, K.M.; Smith-Doiron, M.; Dehghani, P. Regional differences in acute hospitalization risk associated with NO2 by cause, season, age, sex, and trend: An ecological time series study in Canada. BMC Public Health 2025, 25, 1217. [Google Scholar] [CrossRef] [Scilit] [PubMed]
  28. Lian, L.; Huang, J.; Chen, S.; Du, S.; Zhang, L.; Yang, J. A Comprehensive Review of Dust Events: Characteristics, Climate Feedbacks, and Public Health Risks. Curr. Pollut. Rep. 2025, 11, 18. [Google Scholar] [CrossRef] [Scilit]
  29. Anderson, R.N.; Rosenberg, H.M. Disease classification: Measuring the effect of the Tenth Revision of the International Classification of Diseases on cause-of-death data in the United States. Stat. Med. 2003, 22, 1551–1570. [Google Scholar] [CrossRef] [Scilit] [PubMed]
  30. Amnuaylojaroen, T.; Parasin, N. Pathogenesis of PM2.5-Related Disorders in Different Age Groups: Children, Adults, and the Elderly. Epigenomes 2024, 8, 13. [Google Scholar] [CrossRef] [Scilit] [PubMed]
  31. Gonzalez-Villalva, A.; Rojas-Lemus, M.; López-Valdez, N.; Cervantes-Valencia, M.E.; Guerrero-Palomo, G.; Casarrubias-Tabarez, B.; Bizarro-Nevares, P.; Morales-Ricardes, G.; García-Peláez, I.; Ustarroz-Cano, M.; et al. Metal Pollution in the Air and Its Effects on Vulnerable Populations: A Narrative Review. Int. J. Mol. Sci. 2026, 27, 720. [Google Scholar] [CrossRef] [Scilit] [PubMed]
  32. Ye, B.; Ji, X.; Yang, H.; Yao, X.; Chan, C.K.; Cadle, S.H.; Chan, T.; Mulawa, P.A. Concentration and chemical composition of PM2.5 in Shanghai for a 1-year period. Atmos. Environ. 2003, 37, 499–510. [Google Scholar] [CrossRef] [Scilit]
  33. Xie, Y.; Zhao, B.; Zhang, L.; Luo, R. Spatiotemporal variations of PM2.5 and PM10 concentrations between 31 Chinese cities and their relationships with SO2, NO2, CO and O3. Particuology 2015, 20, 141–149. [Google Scholar] [CrossRef] [Scilit]
  34. Öztürk, Y.; Yulu, A.; Turgay, O. Remote sensing supported analysis of the effect of wind erosion on local air pollution in arid regions: A case study from Iğdır province in eastern Türkiye. Environ. Syst. Res. 2023, 12, 13. [Google Scholar] [CrossRef] [Scilit]
  35. Šmejkalová, A.H.; Brzezina, J. The Effect of Drought on PM Concentrations in the Czech Republic. Aerosol Air Qual. Res. 2022, 22, 220130. [Google Scholar] [CrossRef] [Scilit]
  36. Wu, W.; Jin, Y.; Carlsten, C. Inflammatory health effects of indoor and outdoor particulate matter. J. Allergy Clin. Immunol. 2018, 141, 833–844. [Google Scholar] [CrossRef] [Scilit] [PubMed]
  37. Lee, Y.-G.; Lee, P.-H.; Choi, S.-M.; An, M.-H.; Jang, A.-S. Effects of Air Pollutants on Airway Diseases. Int. J. Environ. Res. Public Health 2021, 18, 9905. [Google Scholar] [CrossRef] [Scilit] [PubMed]
  38. Tamire, M.; Kumie, A.; Addissie, A.; Ayalew, M.; Boman, J.; Skovbjerg, S.; Andersson, R.; Lärstad, M. High Levels of Fine Particulate Matter (PM2.5) Concentrations from Burning Solid Fuels in Rural Households of Butajira, Ethiopia. Int. J. Environ. Res. Public Health 2021, 18, 6942. [Google Scholar] [CrossRef] [Scilit] [PubMed]
  39. Sinha, D.; Ray, M.R. Health Effects of Indoor Air Pollution Due to Cooking with Biomass Fuel. In Studies on Experimental Toxicology and Pharmacology; Springer International Publishing: Cham, Switzerland, 2015; pp. 267–302. [Google Scholar] [CrossRef] [Scilit]
  40. Georgakopoulou, V.; Taskou, C.; Diamanti, A.; Beka, D.; Papalexis, P.; Trakas, N.; Spandidos, D. Saharan dust and respiratory health: Understanding the link between airborne particulate matter and chronic lung diseases. Exp. Ther. Med. 2024, 28, 460. [Google Scholar] [CrossRef] [Scilit] [PubMed]
  41. Tsai, Y.-G.; Chio, C.-P.; Yang, K.D.; Lin, C.-H.; Yeh, Y.-P.; Chang, Y.-J.; Chien, J.-W.; Wang, S.-L.; Huang, S.-K.; Chan, C.-C. Long-term PM2.5 exposure is associated with asthma prevalence and exhaled nitric oxide levels in children. Pediatr. Res. 2024, 97, 370–377. [Google Scholar] [CrossRef] [Scilit] [PubMed]
Figure 1. Location map of the study area situated in the eastern part of Türkiye.
Pollutants 06 00041 g001
Figure 2. Methodological workflow chart illustrating the spatiotemporal integration of multi-source datasets, statistical air quality modeling, and demographic stratification for the assessment of environment–health interactions in the Iğdır Basin.
Pollutants 06 00041 g002
Figure 3. Gender-based distribution of respiratory diseases in the study population. (A) Bronchitis, (B) COPD, (C) Asthma, (D) Tuberculosis, (E) Hydatid cyst, and (F) Pneumonia. Each panel shows the number of male and female patients diagnosed with the respective disease.
Pollutants 06 00041 g003aPollutants 06 00041 g003b
Figure 4. Age-specific distribution of respiratory and selected infectious diseases in the study population. (A) Bronchitis, (B) COPD, (C) Asthma, (D) Tuberculosis, (E) Hydatid cyst, (F) Cancer, and (G) Pneumonia. In each panel, the squares (bars) represent the histogram of the number of patients within each age interval, and the line represents the kernel density estimate (smoothed distribution curve) of patient age.
Pollutants 06 00041 g004
Figure 5. (A) Age distribution of tuberculosis, hydatid cyst, and pneumonia cases in female patients. (B) Age distribution of respiratory and infectious diseases in male patients.
Pollutants 06 00041 g005
Figure 6. Monthly variation in PM10 concentrations in Iğdır over 2022–2025.
Pollutants 06 00041 g006aPollutants 06 00041 g006b
Figure 7. Monthly variation in PM2.5 concentrations in Iğdır over 2022–2025.
Pollutants 06 00041 g007aPollutants 06 00041 g007b
Figure 8. Monthly variation in SO2 concentrations over 2022–2025.
Pollutants 06 00041 g008
Figure 9. Monthly variation in NO2 concentrations over 2022–2025.
Pollutants 06 00041 g009
Figure 10. Monthly variation in NOx concentrations over 2022–2025.
Pollutants 06 00041 g010
Figure 11. Monthly variation in O3 concentrations over 2022–2025.
Pollutants 06 00041 g011
Figure 12. Seasonal spatial distribution of PM10 concentrations (µg/m3) derived from MODIS satellite data for the 2000–2024 period: (A) autumn (Min: 0, Max: 32.8 µg/m3), (B) spring (Min: 0, Max: 100 µg/m3), (C) summer (Min: 2.3, Max: 48.9 µg/m3), and (D) winter (Min: 0, Max: 69.7 µg/m3). The color scale transitions from blue (low concentration) to red (high concentration), with each panel representing the annual seasonal average for the corresponding year (2000–2024).
Pollutants 06 00041 g012
Figure 13. Seasonal spatial distribution of PM2.5 concentrations (µg/m3) derived from MODIS satellite data for the 2000–2024 period: (A) autumn (Min: 0, Max: 19.6 µg/m3), (B) spring (Min: 0, Max: 96.7 µg/m3), (C) summer (Min: 1.4, Max: 28.8 µg/m3), and (D) winter (Min: 0, Max: 41 µg/m3). Color scale transitions from blue (low concentration) to red (high concentration), with each panel representing the annual seasonal average for the corresponding year (2000–2024).
Pollutants 06 00041 g013
Table 1. Integrated multi-source dataset with access links.
Data CategoryVariablesTemporal CoverageSpatial ResolutionData SourceInstitution/PlatformAccess Link
Epidemiological (respiratory diseases)Asthma, COPD, bronchitis, tuberculosis, pneumonia, lung cancer, hydatid cyst, pleurisy (ICD-10-coded)2020–2026Provincial (Iğdır)Hospital recordsMinistry of Health of Türkiyehttps://www.saglik.gov.tr (accessed on 1 June 2026)
Ground air quality dataPM10, PM2.5, SO2, NO2, NOx, NO, O32020–2026Station-basedNational Air Quality Monitoring NetworkMinistry of Environment, Urbanization and Climate Changehttps://csb.gov.tr/ (accessed on 8 June 2026)
MODIS aerosol productsAOD, derived PM2.5/PM102000–20241–10 kmMODIS (MAIAC & global products)NASA Earth Observing System (EOS)https://earthdata.nasa.gov (accessed on 14 May 2026)
MODIS data access (direct)Terra/Aqua MODIS datasets2000–present250 m–10 kmNASA LAADS DAACNASAhttps://ladsweb.modaps.eosdis.nasa.gov (accessed on 14 May 2026)
Google Earth Engine (processing platform)AOD, PM2.5/PM10 derived layers2000–presentVariableGEE platformGoogle/NASA/USGShttps://earthengine.google.com (accessed on 14 May 2026)
Meteorological reanalysisTemperature, humidity, precipitation, boundary layer height2000–2024~0.25°ERA5 ReanalysisECMWF/Copernicus CDShttps://cds.climate.copernicus.eu (accessed on 14 May 2026)
Topographic dataElevation, slope, aspectStatic30 mSRTM DEMNASA/USGShttps://earthexplorer.usgs.gov (accessed on 16 May 2026)
Geographic boundariesAdministrative borders, settlementsStaticVectorNational GIS datasetsTurkish Statistical Institute (TÜİK)https://www.tuik.gov.tr (accessed on 2 June 2026)
Table 2. Seasonal and source-specific environmental exposures, vulnerable populations, and associated respiratory health outcomes with underlying epidemiological mechanisms.
Pollutant/Environmental FactorCritical Period/MechanismMost Vulnerable PopulationPrimary Health BurdenEpidemiological Explanation
Anthropogenic PM2.5 and SO2Winter period (November–December)/temperature inversion and atmospheric stabilityMales ≥ 65 years, children aged 0–5COPD exacerbations, pneumonia, chronic bronchitisNear-surface accumulation of pollutants due to boundary layer compression, leading to increased oxidative stress and alveolar epithelial damage
Climatological fine particulate matter (PM10)Summer–autumn/drought and wind erosionFemales aged 35–50, children aged 0–5Asthma attacks, acute bronchitisTriggering of inflammatory responses through mechanical irritation and airway hyperresponsiveness
Indoor biomass exposureChronic/year-round indoor emissionsFemale population (all age groups)Increased asthma prevalence, chronic respiratory symptomsSynergistic effects of biomass combustion–derived particulate exposure and physiological/hormonal susceptibility in indoor environments
Disclaimer/Publisher’s Note: The statements, opinions and data contained in all publications are solely those of the individual author(s) and contributor(s) and not of MDPI and/or the editor(s). MDPI and/or the editor(s) disclaim responsibility for any injury to people or property resulting from any ideas, methods, instructions or products referred to in the content.