1. Introduction
Medellín is the largest city in the Aburrá Valley, a region of Colombia composed of ten municipalities in the mountains, and it is the second most populous urban agglomeration and the third densest in the world [
1,
2] The valley follows the Medellín River for 60 km and is 3 to 10 km wide. It is situated at an elevation of 1300–1750 m above sea level, with a height difference of up to 1800 m between the valley floor and the surrounding hills. The air quality in the valley deteriorates seasonally due to weather patterns and the transit of the Intertropical Convergence Zone (in March–April and October–November) [
3]. During these times, the atmospheric boundary layer remains below the canyon’s rim throughout the day, trapping all of the pollutants from the city in the lower atmosphere [
1].
The air quality measurement network in the Aburrá Valley is managed by SIATA (
https://siata.gov.co/ (accessed on 27 December 2022)), which is the institution in charge of the different early warning systems for the region. This network is one of the densest in terms of air quality measurements of the world, with a combination of low-cost and certified sensors that creates a complete spatial coverage of this complex orography with a deep-seated urban valley [
4]. However, the valley receives and exports atmospheric pollutants from and to the surrounding regions, yet measuring stations to monitor these fluxes are not available.
Recent cases of low-cost sensors in valleys can be found in [
5,
6]. Some recent comparisons with different chemical transport models with low-cost sensors can be found in [
4,
7,
8,
9,
10] showing constant research driven by the increase of air quality-related problems and availability of electronic technologies. On the other side of measuring, modeling studies using Chemical Transport Model CTM, such as the LOTOS-EUROS model, have shown that the Aburra Valley releases pollutants in daily cycles, which suggests the transport of contaminants to surrounding areas [
11]. These pollutants are deposited in vulnerable natural areas, such as páramos, tropical rain forests, and tropical dry forests.
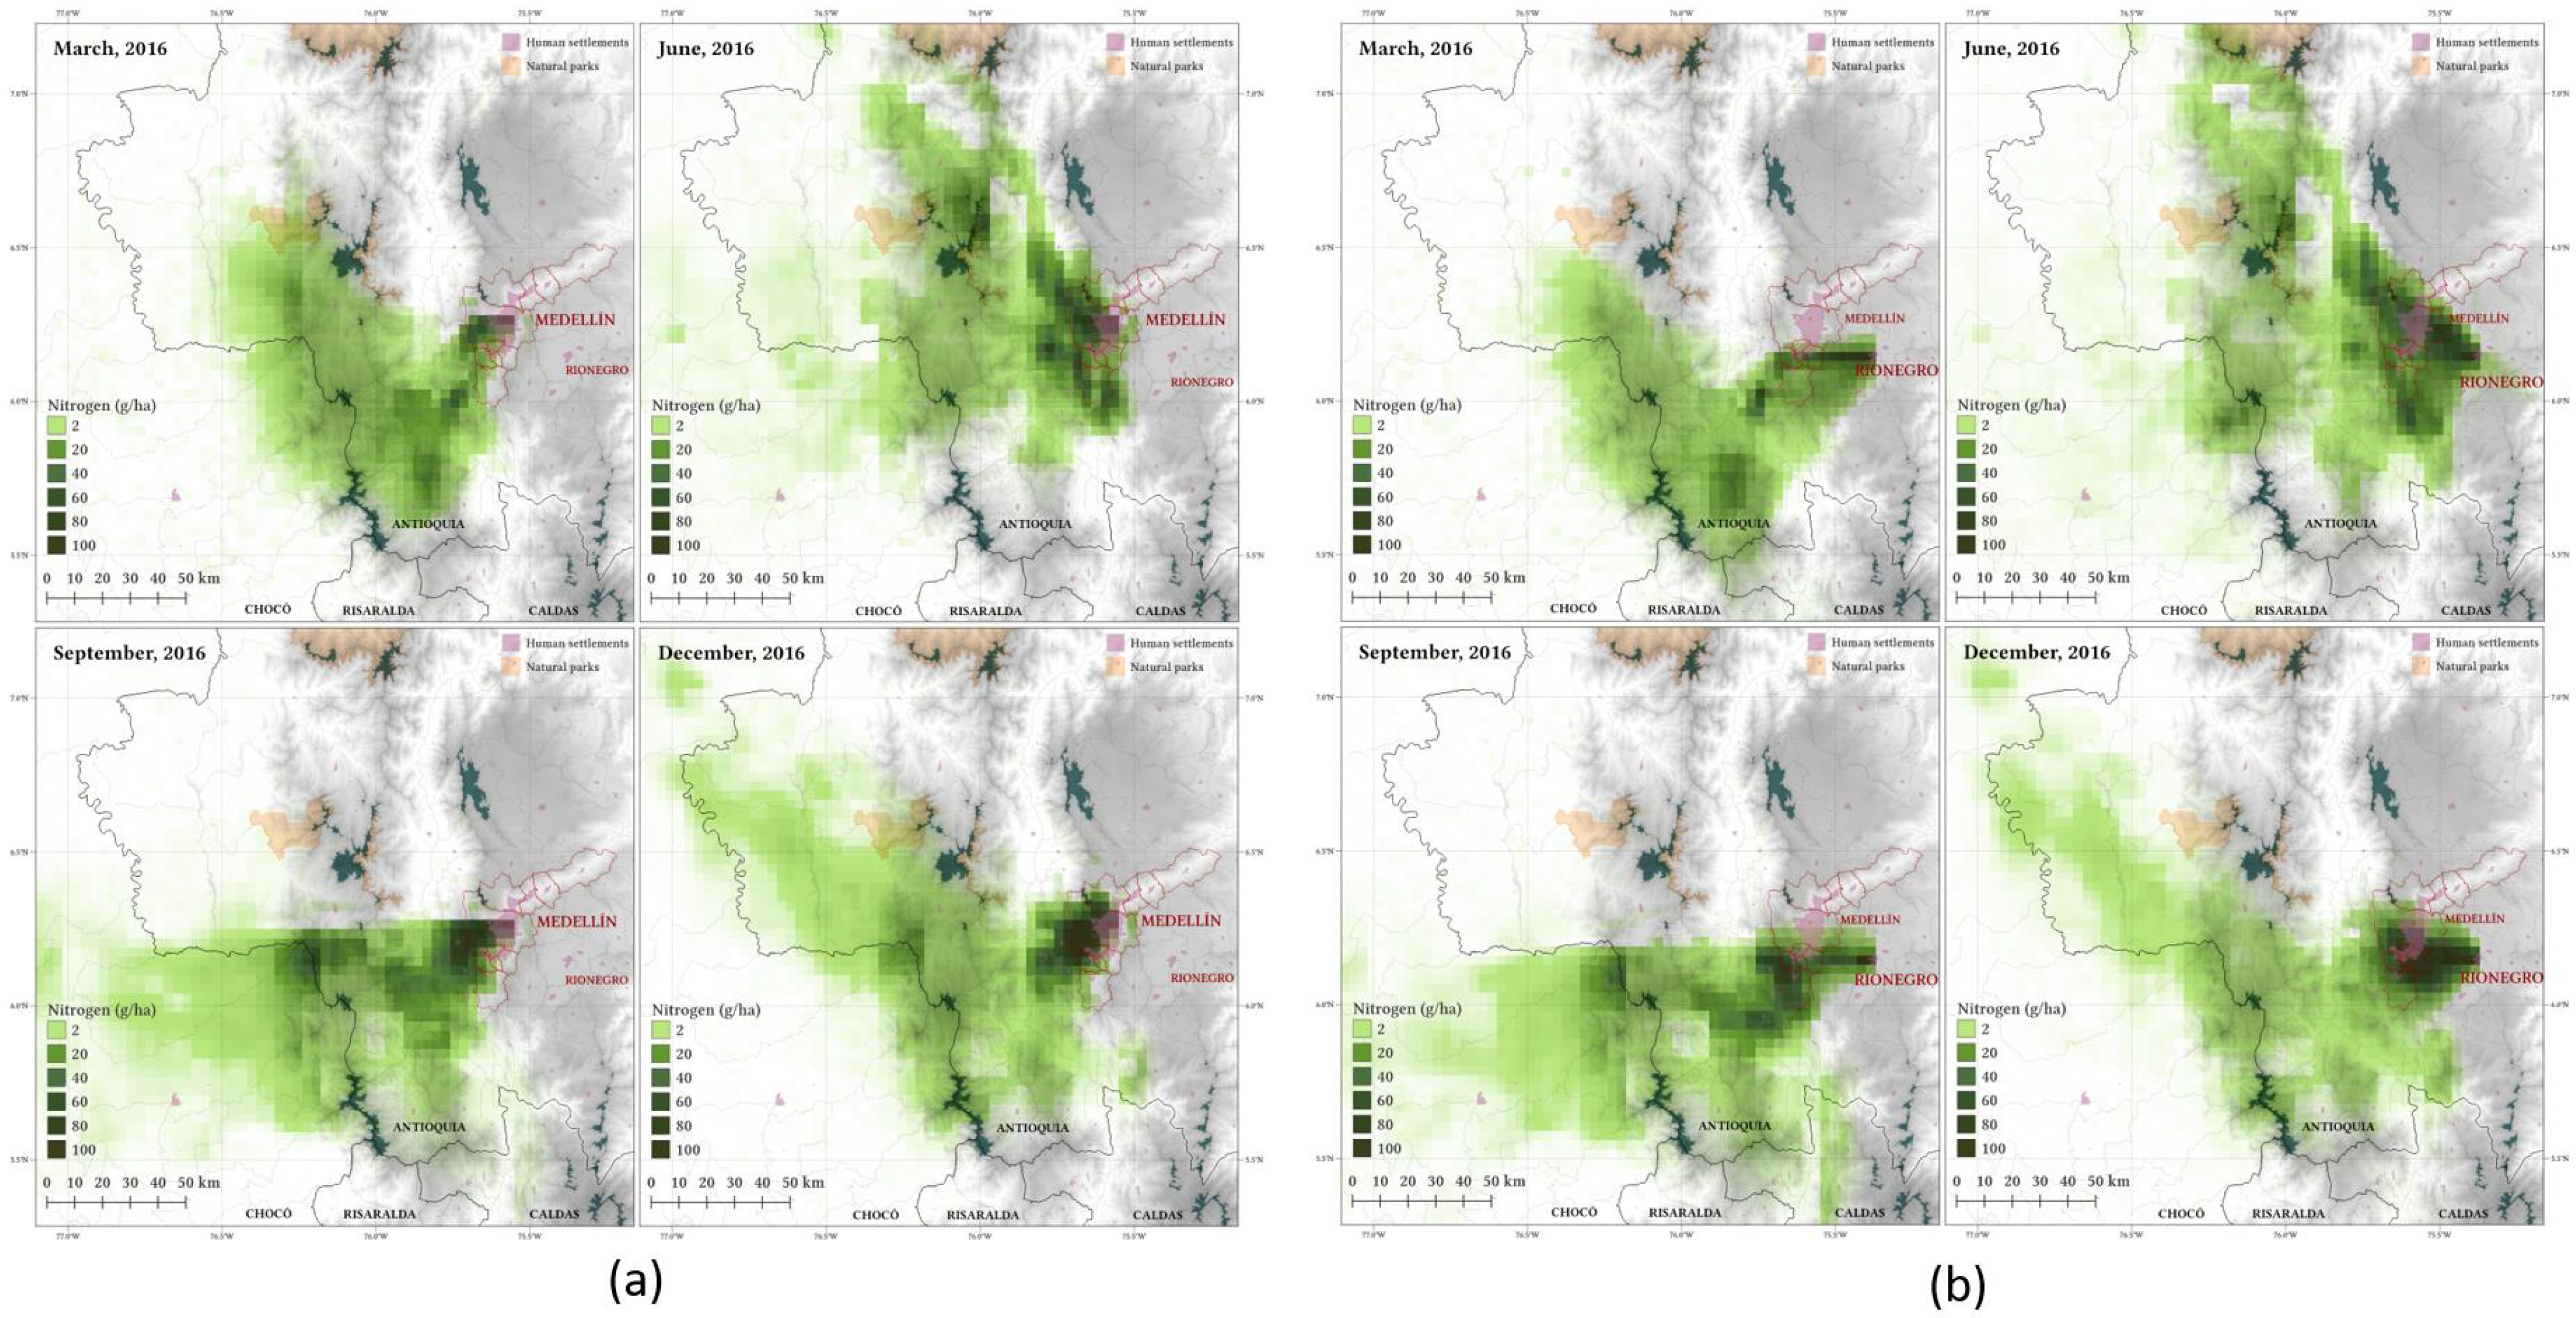
Figure 1 shows simulation results for four different periods in 2016 using the LOTOS-EUROS model. The experiments were designed to illustrate overall regional flow and deposition patterns rather than assess the amount of deposited material. The boundaries of the ten municipalities in the Aburra Valley are shown in red. Rionegro was simulated as a source of pollutants equal in magnitude to those of Medellín (panel (b)) to explore the impact on air quality in Medellín. The simulation showed that contaminants from Rionegro can enter the Aburrá Valley in all seasons, with increased intrusion during June and December. Emissions may also travel southwest towards the Cartama Province, potentially affecting agricultural productivity.
The results highlight the need for regional air quality monitoring systems that allow atmospheric connections in constructing regional development plans. While the impact on natural ecosystems from this distant atmospheric transport has not been evaluated in Colombia, the ecosystem function alterations have been documented in Northern ecosystems [
12]. These two possible impacts highlighted the need to understand atmospheric contaminants’ fate, both primary and secondary, that originate in Medellín and the Aburrá Valley. Furthermore, this urban center may be a source of regional contaminants and a recipient because pollutants emitted in cities near the valley, e.g., Rionegro, could reach this area.
From those previous simulations, the interest in developing a measuring network study to corroborate previous CTM representation of the Valley and start collecting data in these allocations for a future operational Data Assimilation (DA) system started such as recent cases like in [
13] for the estimation of emissions in urban environments and IoT based (Wifi protocol) for suburban environments [
14]. DA is a mathematical technique that reconciles the mathematical modeling representation of reality with the measurement perspective through different approaches depending on the gaussian or not gaussian error background model and observations covariance error distribution.
The proposed station locations aim to obtain data from sites linking the urban areas of the Aburrá Valley and the San Nicolás Valley to the East (e.g., Rionegro). The proposed sites attempt to cover the highest points along the slopes of the Aburrá Valley to monitor the contaminants dynamics of the Valley and thus understand the magnitude of these regional atmospheric interconnections sampling in the completest spatiotemporal possible resolution. The simulation presented in
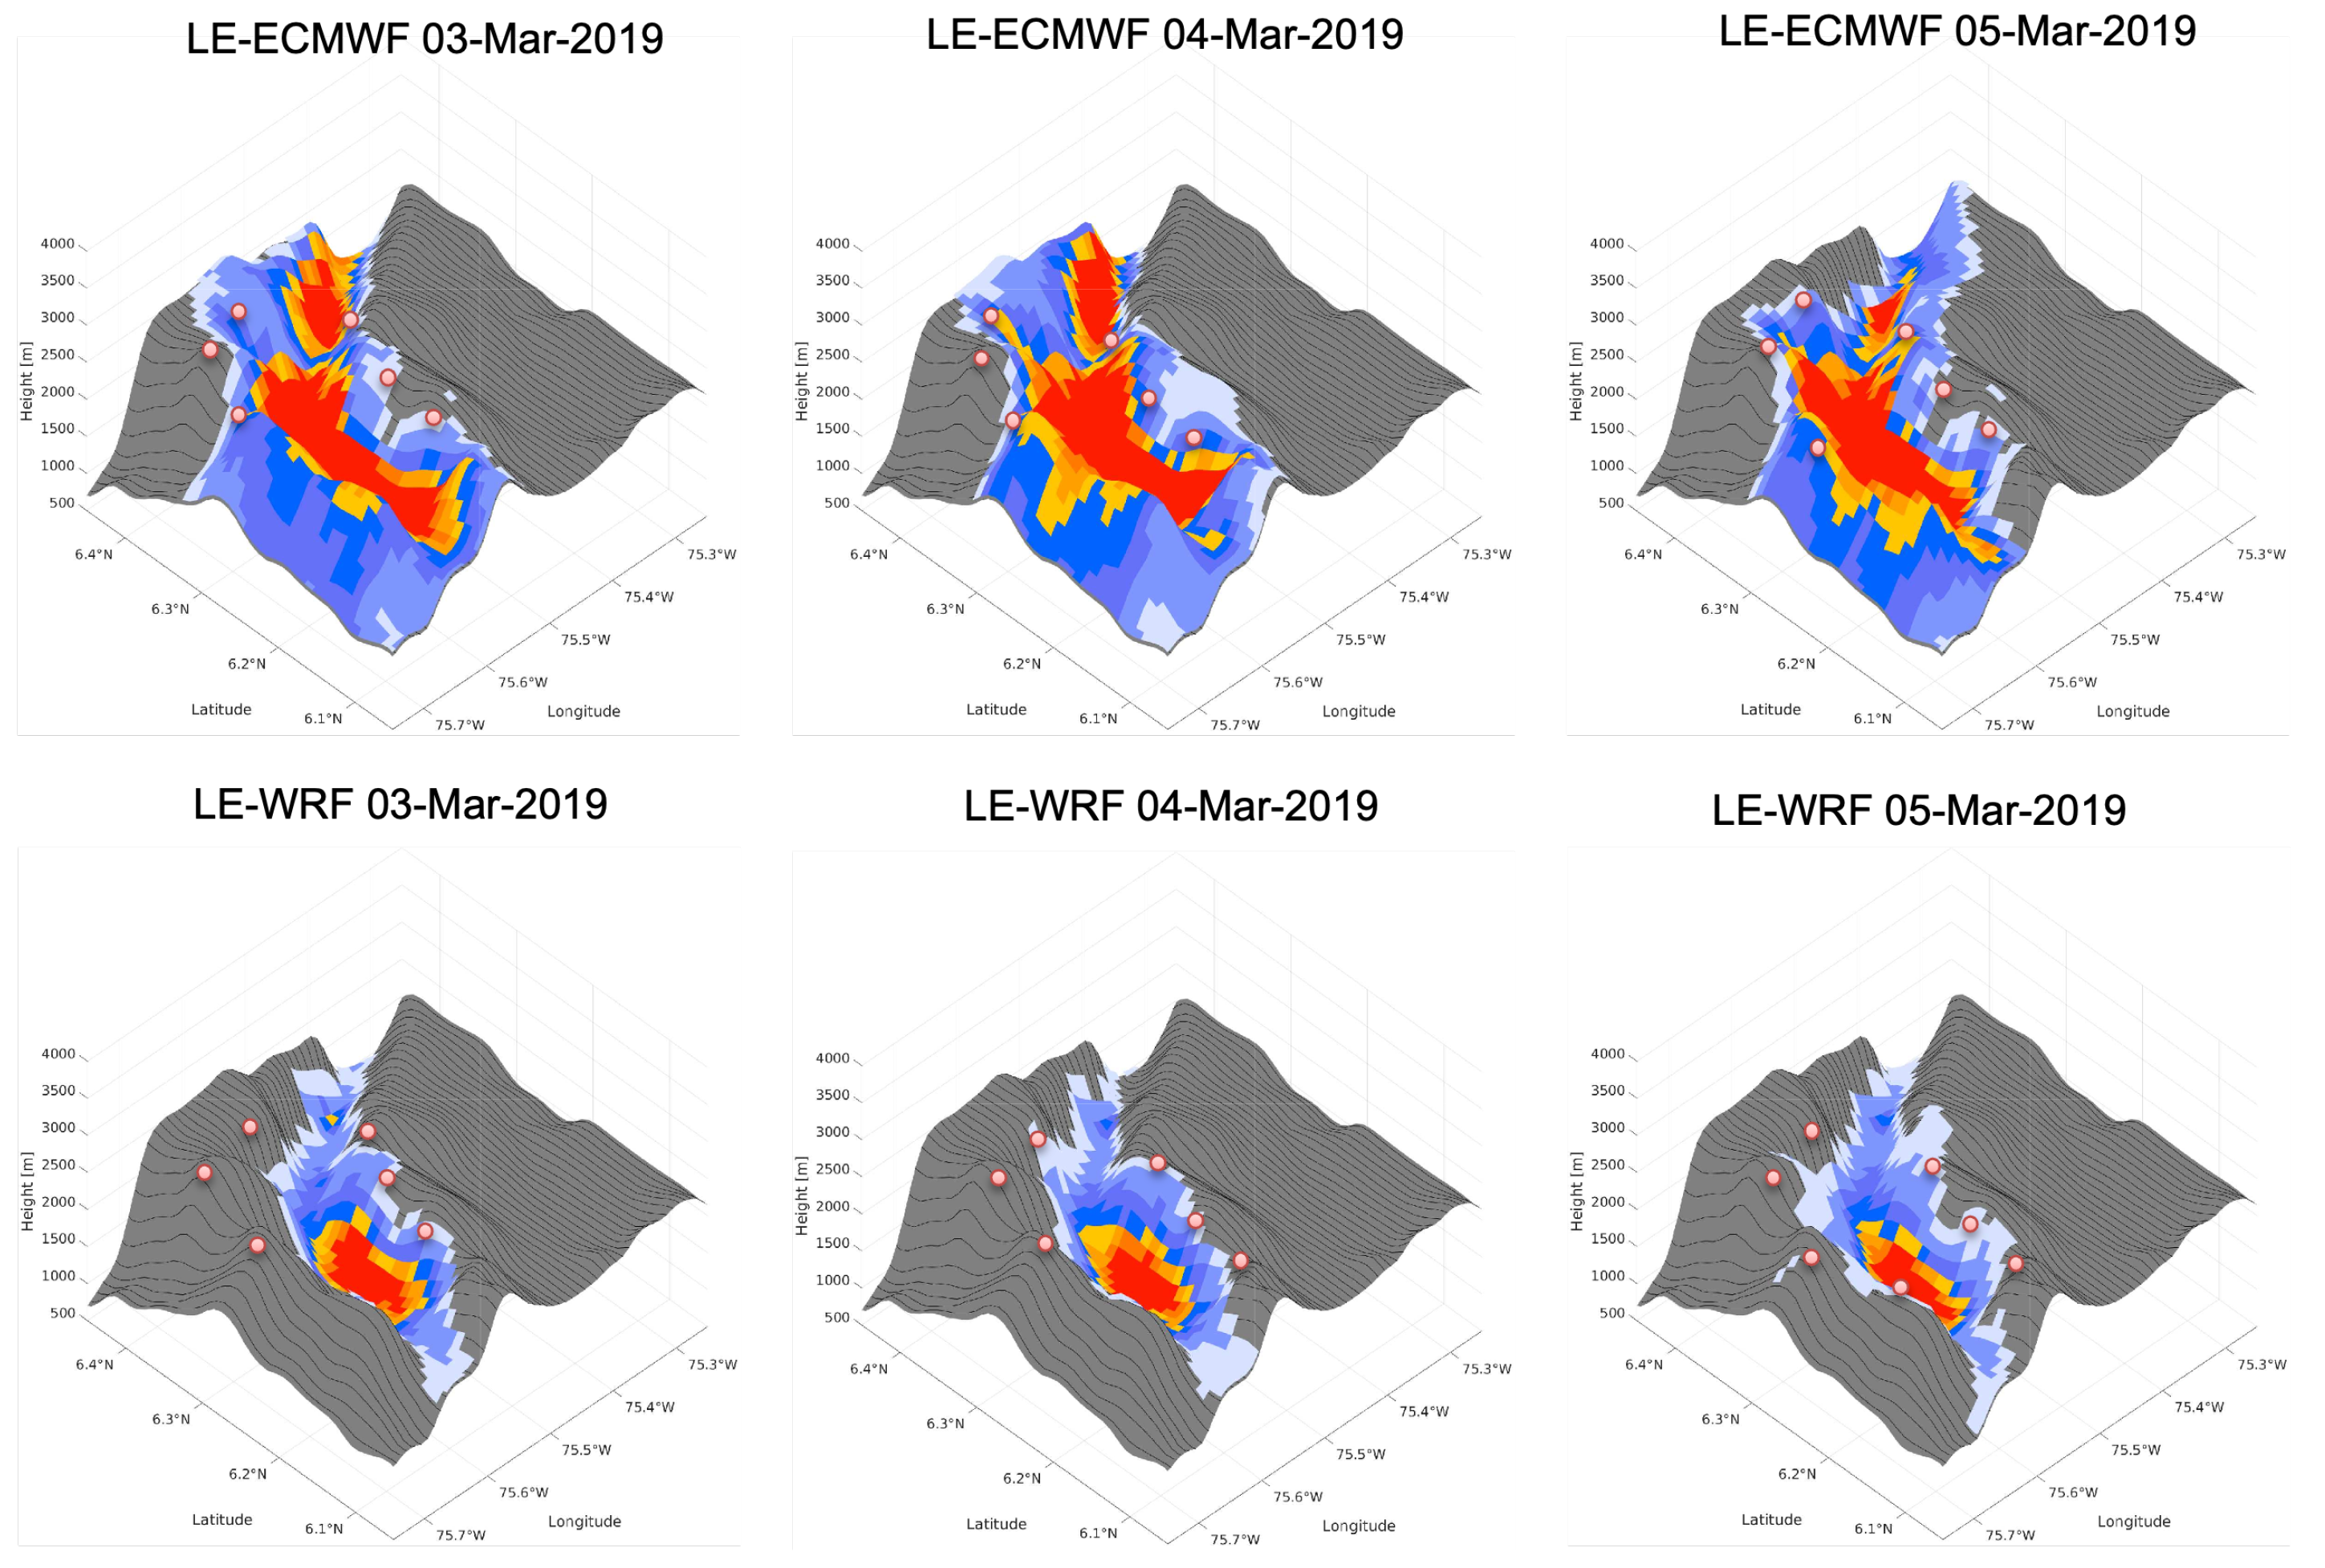
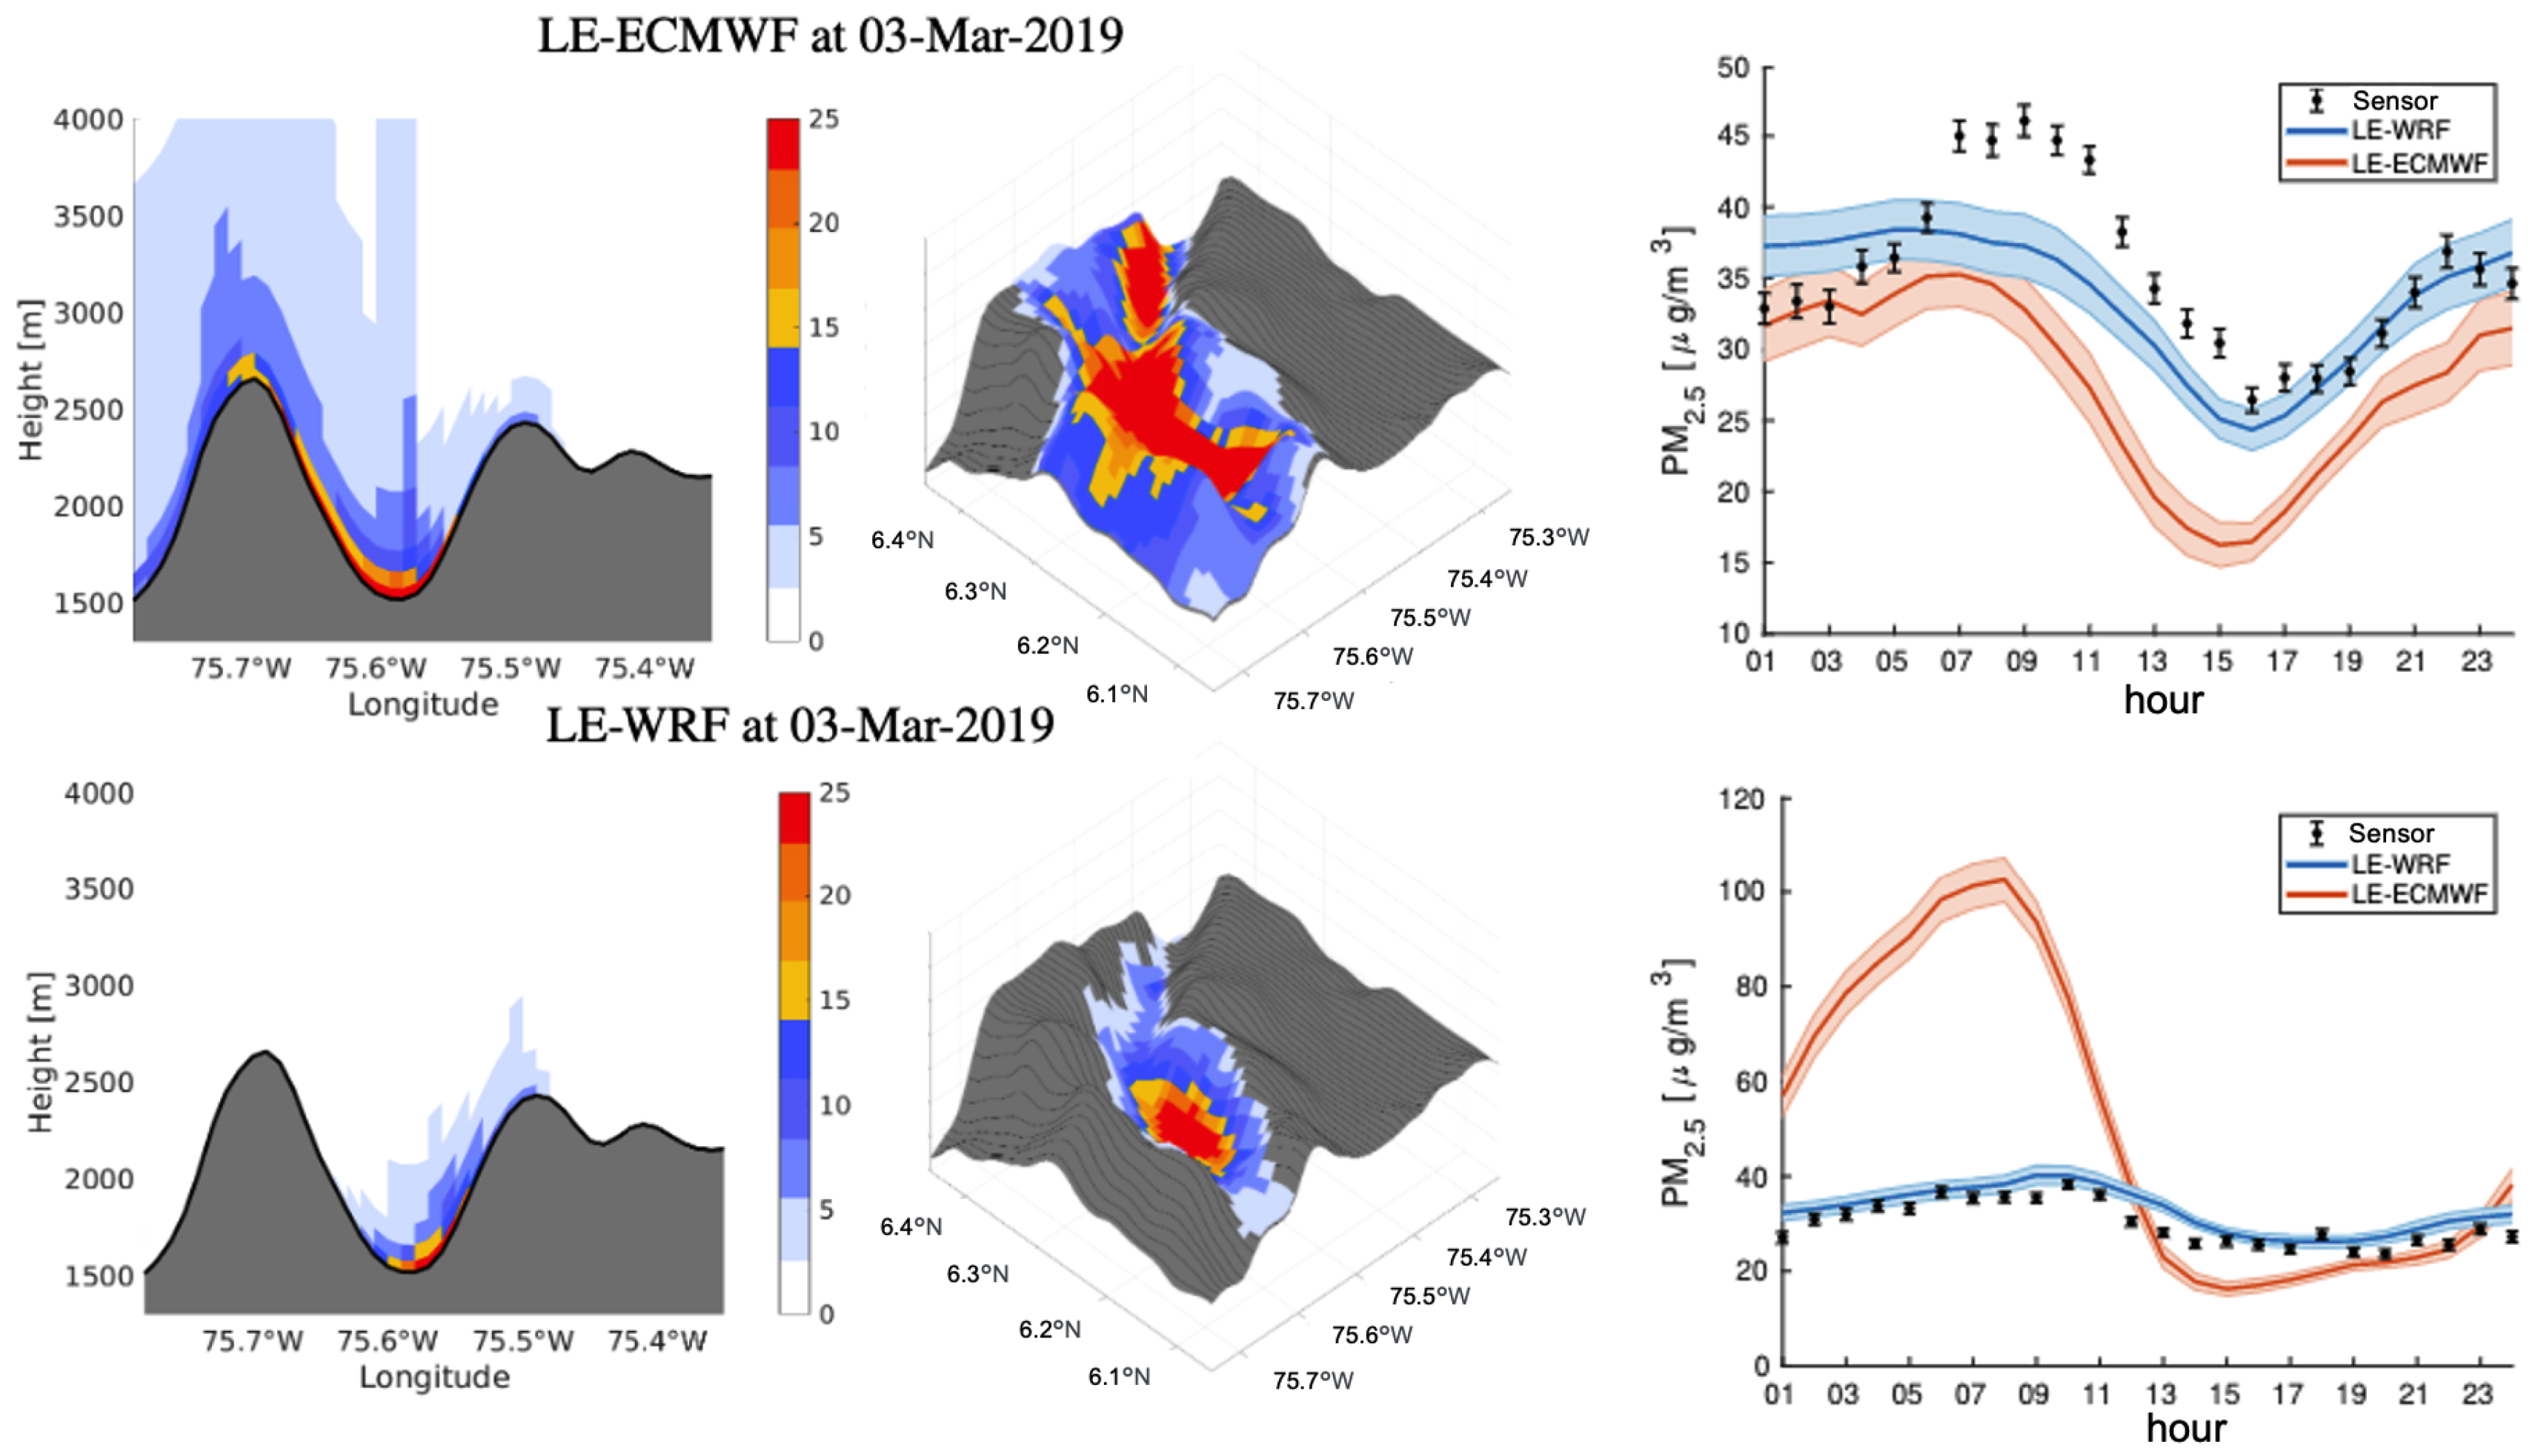
Figure A1 provides experimental justification for the proposed network configuration, offering stations to complement the SIATA stations network. SIATA stations will be used as reference and calibration stations to ensure the reliability of the data generated because it is the operational network for policy decisions in the metropolitan area. In these simulations, the LOTOS-EUROS CTM was used to simulate in a nested domain configuration to reach 1 × 1 km resolution for the particulate matter PM2.5 using two different meteorology input conditions (ECMWF and WRF), showing how the ECMWF meteorology drives the pollutants far away from the Valley and otherwise, for the WRF meteorology, the Valley traps the contaminants.
In terms of low-cost sensor and applications with CTM, the work in [
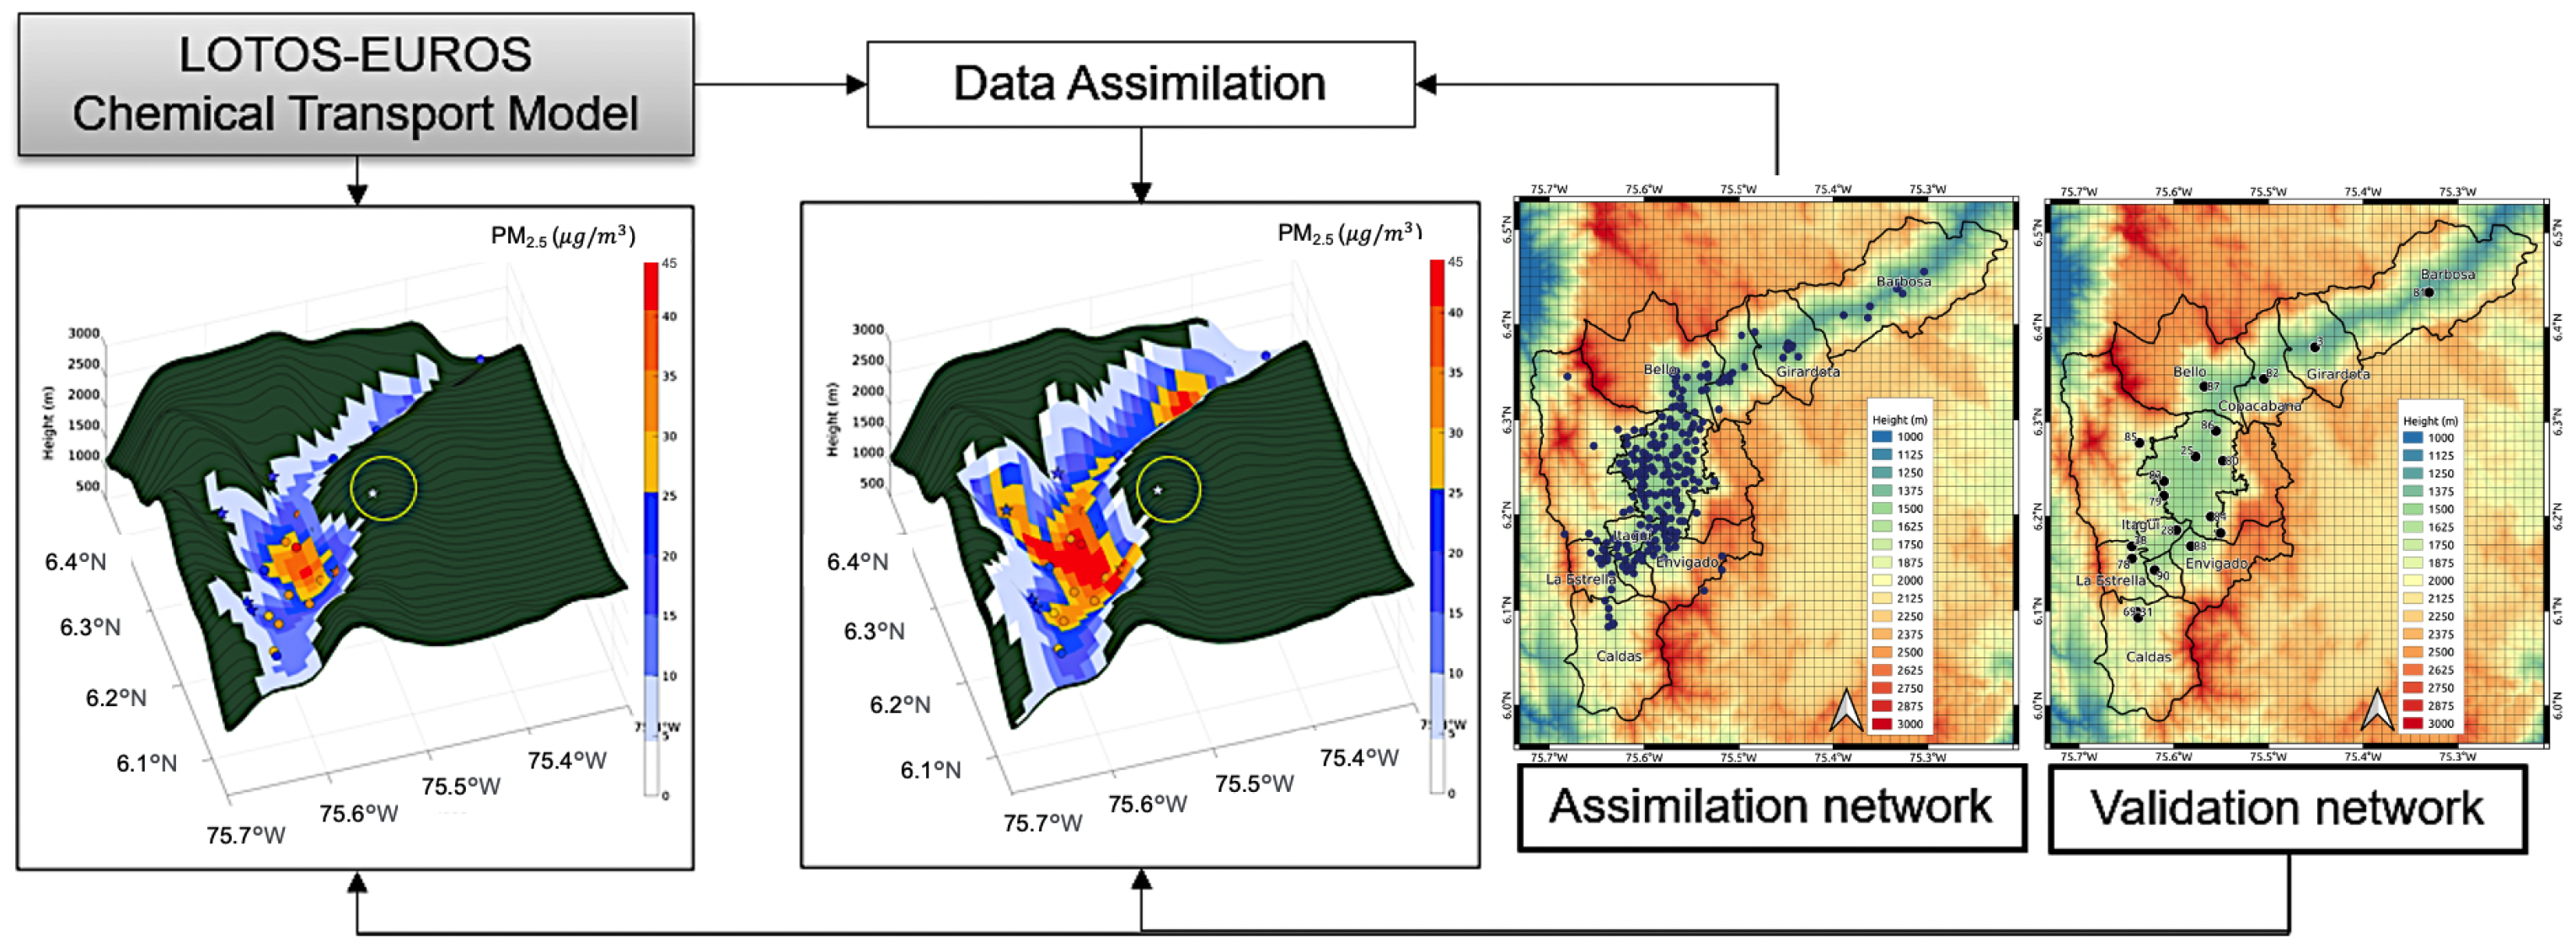
4] shows the comparison between a certified air quality network and a DA experiment with the low-cost sensor network offering the benefit of using the combination of these two sources of information through DA schemes to balance the inaccuracy of these with the possibilities to drive a model with the right trend. In
Figure 2, the comparisons of the three-dimensional snapshot of the model output over the valley and assimilated outputs of a low-cost sensor network inside the valley are depicted in transversal cuts.
The development of technology for monitoring air quality based on the low-cost sensor is an increasing trend for small cities, harbors, and rural areas with increasing pollution-related problems [
15,
16,
17]. Technology miniaturization lets new modular integration opportunities appear [
18]. In this case, robust and rugged aerospace-inspired low-cost monitoring stations were deployed in strategic remote sites to detect the exchange of atmospheric contamination among regions. The proposed network, nested in a cyber-physical system [
19], will integrate new and existing data into a framework for understanding regional dynamics, evaluating development scenarios, and supporting decision-making and citizen science [
20] at the local and regional scales. A review of low-cost sensors for outdoor quality applications is [
21] and includes useful information to understand the difference between the existent way to measure that the common sensor has.
In
Section 2, Material and methods, the measurement unit Simple is presented with the different experimental procedures such as long-range tests, simulation power consumption, the irradiance simulation experiment, and the network consideration are explained. In
Section 3, the results of the different experimental methodologies for the instrument and the implementation of the network are presented, followed by the discussion section around the usability of this kind of data from low-cost devices in conjunction with DA techniques as a way to circumvent the necessity of expensive infrastructure by using DA making the observation and modeling worlds to talk to improve the representation of the different pollutants over a region.
2. Materials and Methods
2.1. Description of the Network
At the mentioned heights around the valley, measurements for the different proposes are necessary with the chemical model comparison. Those points were selected because they are city-representative locations and can be accessed by hill walking routes. Therefore, the nodes are considered energy autonomous and remotely connected.
For the current project, the species of interest will be particulate matter (PM
2.5), nitrogen oxides (
), and ozone (O
3), in addition to the standard meteorological variables of relative humidity, temperature, wind magnitude, and speed even though other compounds, such as ammonia and isoprene may be of interest for future development. The proposed location of the measuring stations is presented in
Figure 3. These locations are primarily selected for coverage of remote sites not covered by the SIATA network but that may provide data to detect the transport of contaminants in and out of the Aburrá Valley. Because of the urban growth trends described earlier, there will be an emphasis on stations that may provide data to understand the atmospheric interconnections between the Aburrá Valley and the San Nicolás Valley (see
Figure 2).
Figure A1 shows a panel with the argument about the need to have a measurement point in the high levels of the Aburrá Valley from a perspective of a previous DA scenario
Figure 4. The first graphic shows the LOTOS-EUROS simulation output for the Aburrá Valley with circles and stars from the validation network with the same color bar magnitude of the simulation from the model. Circles and stars refer to stations located in high positions and bottom positions inside the valley, respectively. This comparison shows an underestimation of the model concerning the measurements from the validation network. The following image shows the LOTOS-EUROS model assimilated with the PM
2.5 high-density network. It is crucial to notice how almost all stations from this assimilation network are located below the 2000 m.a.s.l. With this result, a discussion supports the need to measure more information in the high altitudes of this valley. An example to support this affirmation is seen for the star station that is possible to see in the right part above the valley (yellow circle), for which the value in both situations for the model was underestimated, not presenting a proper update of the analysis for this area suggesting increase the number of observations.
2.2. Low-Cost Sensor Hardware Architecture
The module used to develop this network is called Simple-4. This device’s electronic architecture evolved from the Simple-3 architecture created in 2018 and the previous before (Simple-3, Simple-2, Simple-1, Simple-0) [
22,
23]. The Simple Missions represent projects based on the CanSat development (A CanSat is a standard pico-satellite form factor soda can satellite), with a cylindrical array structure, a mass of approximately 250 grams, and a volume of approximately 330 cubic centimeters. While originally designed for deployment aboard rockets or weather balloons, the CanSat-inspired design results in rugged, modular, robust, non-invasive measuring devices that are highly efficient in their communication approaches and energy use.
The subsequent developments to this module facilitated the use of different communications modules and protocols, increased the number of sensors in the payload, and improved the energy system, which consists of an independent board from the previous payload subsystem. The attributes of the modules make them for deployment as remote measuring stations.
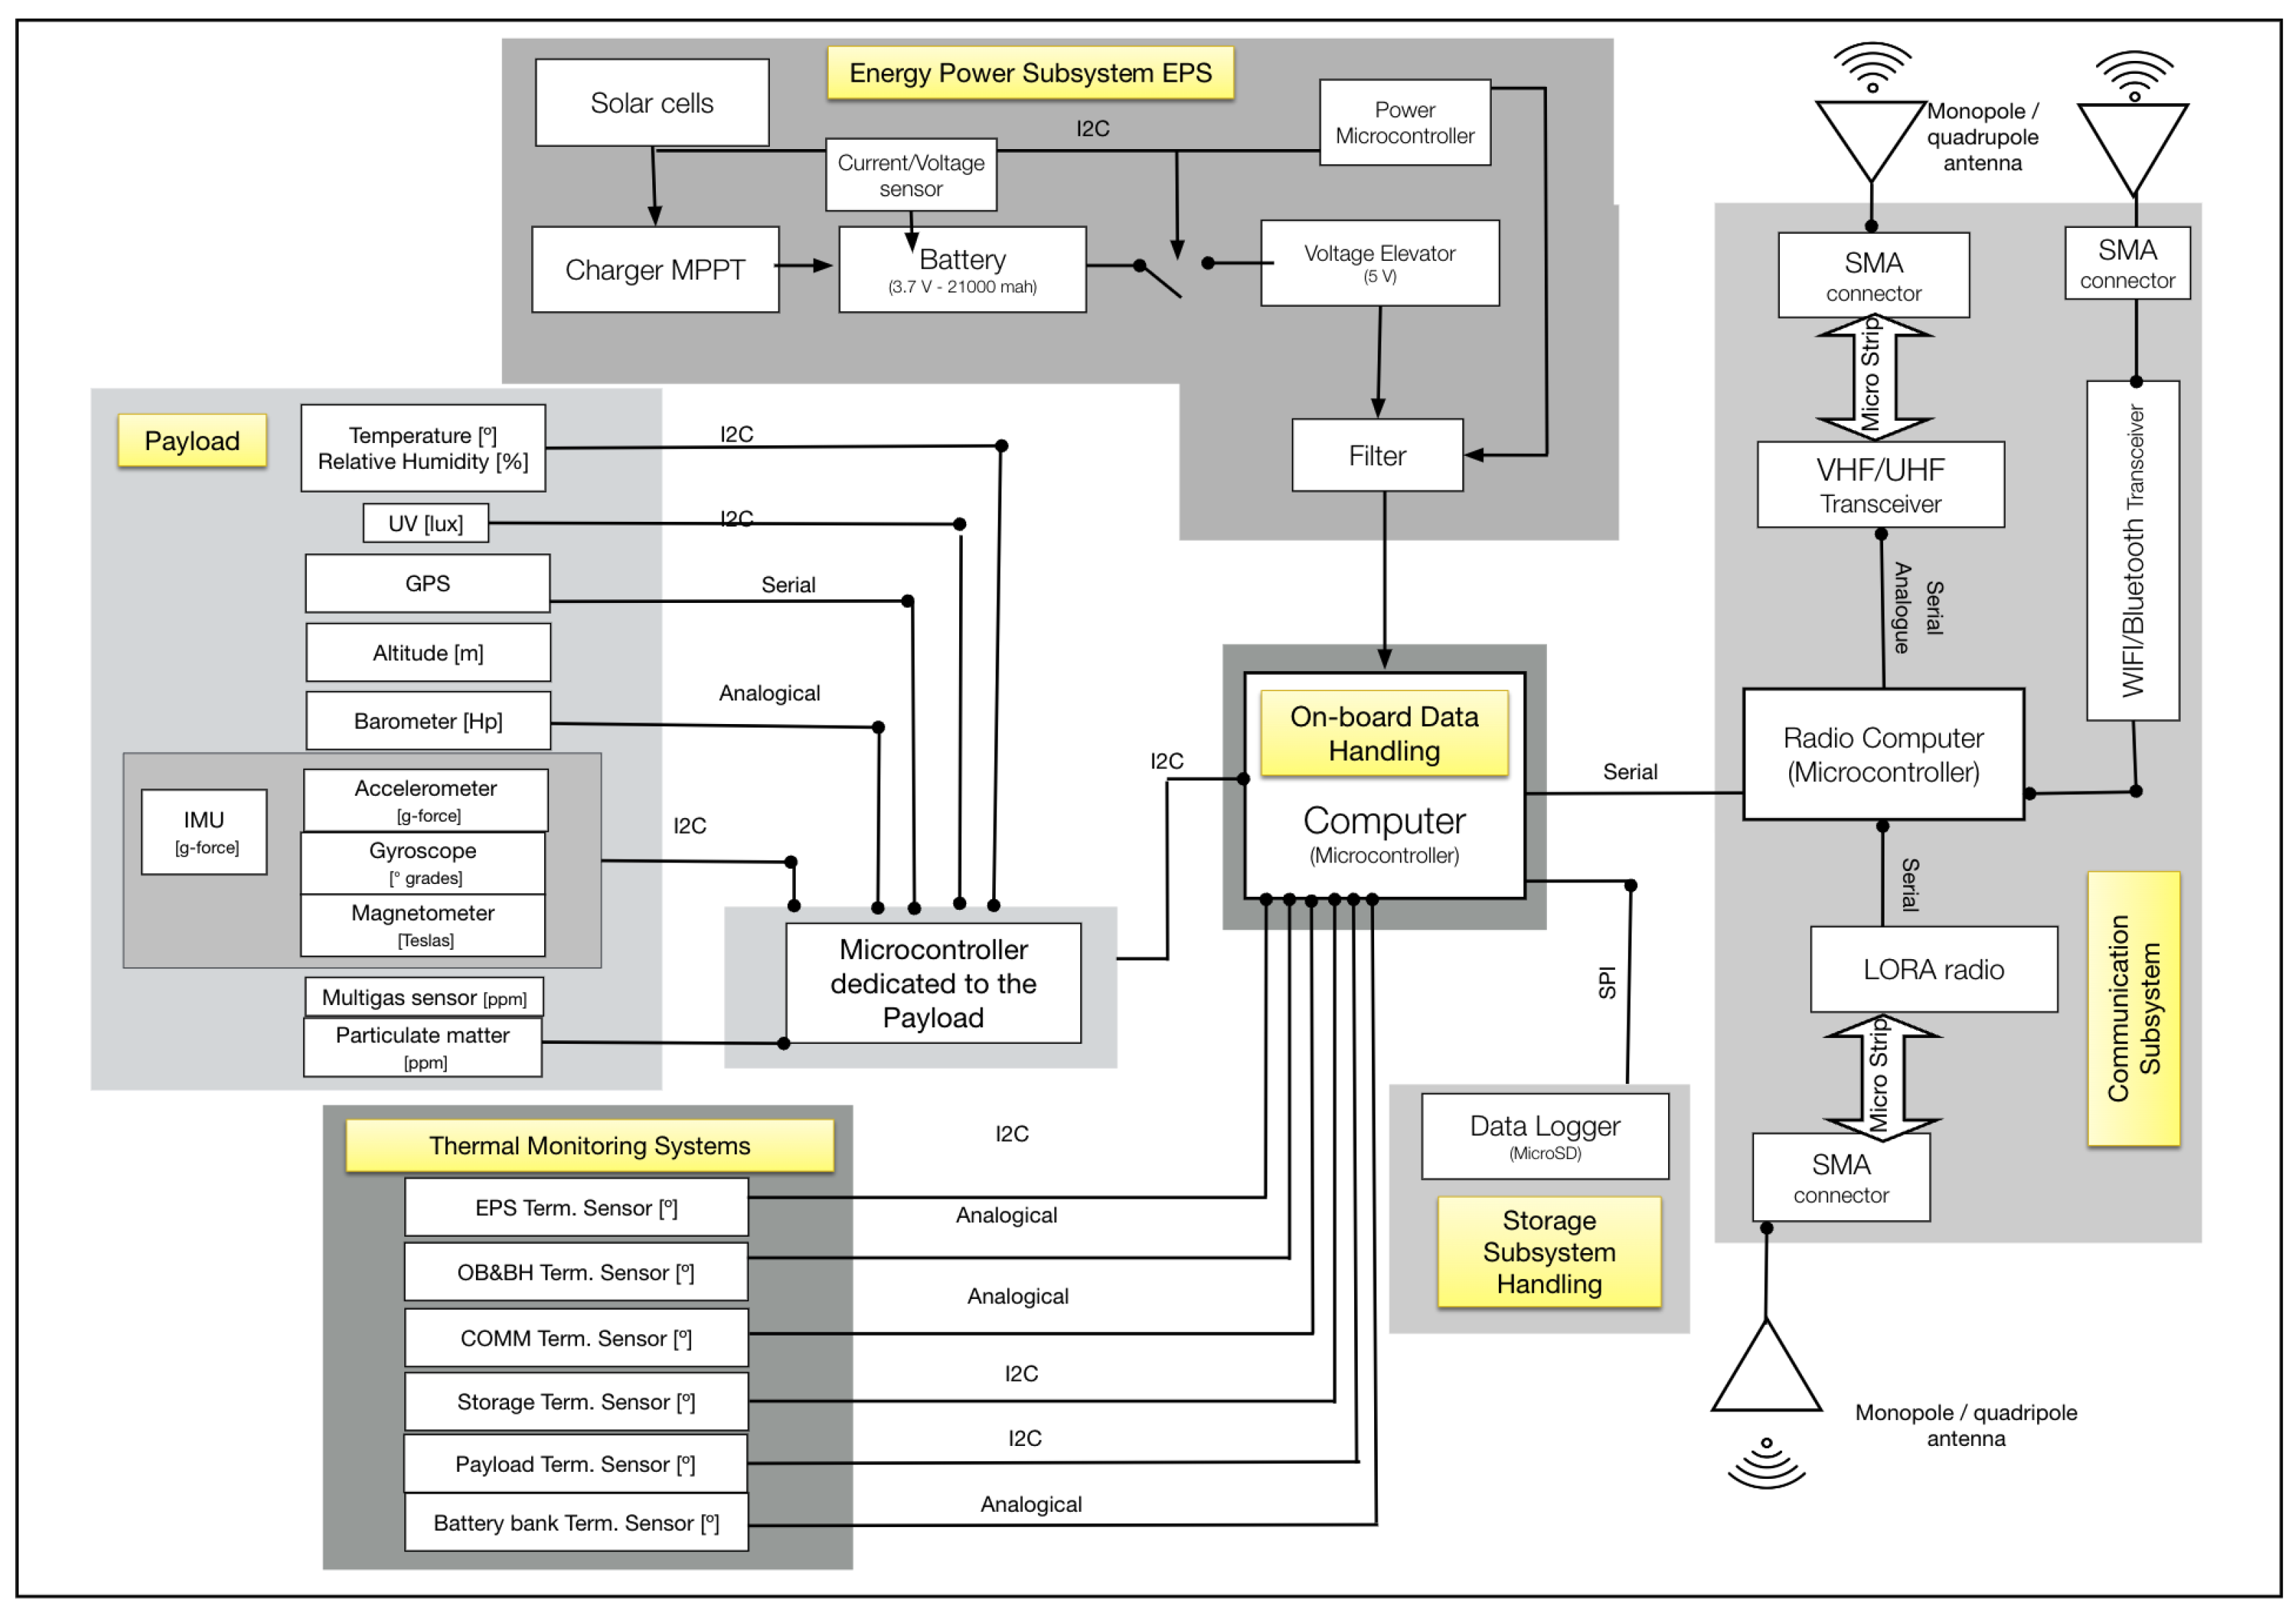
Figure 5 shows the Simple-4 diagram schematic system.
SimpleVital—On-Board Data Handling (OB&DH). The OB&DH manages, stores, and sends information from the other electronic subsystems to the ground segment through the communication subsystem. This board contains an 8-bit microcontroller that communicates employing standard protocols such as Serial, I2C (Inter-Integrated Circuit), and SPI (Serial Peripheral Interface) to peripheral units such as GPS (Global Positioning System), IMU (Inertial Measurement Unit), barometer, and temperature and communicates with the subsystems of EPS, Payload, and COMM (Communications). Furthermore, this subsystem is responsible for formatting the data for storage in SD memory. This four-layer PCB design promotes the integration of more components per area.
SimplePower—Energy Power Subsystem (EPS). EPS regulates the power of satellite subsystems. In this module, the charge is stored in a battery bank with 20,000 [mAh]. This battery supplies between 3 and 4.2 volts, raised to 5 volts, to be distributed to other subsystems and a stage for overcharge protection. Additionally, this subsystem controls the power supplied by the solar cells (solar array interfaces) through a DET (Direct Energy Transfer) architecture; this enables the extension of the operation time of the module thanks to the additional power already available in the batteries.
SimplePollution—Payload Subsystem. This subsystem is composed of a sensor (MICS-6814) that measures the concentration of gases such as CO (Carbon monoxide), NO2 (Nitrogen dioxide), C2H6OH (Ethanol), H2 (Hydrogen), NH3 (Ammonia), CH4 (Methane), C3H8 (Propane), and C4H1 (Iso-butane), in addition to this two SPEC ™sensors for measuring NO2 and O3 thermodynamic variables such as relative humidity and temperature.
SimpleCOMM—Communications Subsystems. Notably, the Simple-4 design features three different types of radios (LoRa Tx/Rx @ 915 MHz, Dorji Tx/Rx @ 434 MHz, and Radiometrix Tx/Rx @ 434 MHz). Besides, it incorporates Wi-Fi technology. In terms of communication having different radio possibilities allows greater autonomy and modularity in the network and the capabilities to support long, medium, and low-range transmissions. Two references were used, a 144 MHz Very High Frequency (VHF) and 434 Ultra High Frequency (UHF). Both frequencies used Narrow Band FM (NBFM) and Audio Frequency Shift Keying (AFSK) modulation at a 1200 baud velocity using the AX.25 (Amateur X.25) protocol, supporting the use of an Automatic Packet Reporting System (APRS) packets for real-time digital communications, thus permitting Tx/Rx coverage. Communication links generated between the Simple-4 CanSat pico-satellites and the gateway station ensured a minimum vertical line of sight communication range of 300 m without multipath propagation, rain fade, and attenuation for vegetation phenomena.
2.3. Experimental Procedures
For the calibration and validation experiment with the unit, experimental activities with the measurement device were reproduced to ensure the reproducibility of the measure. Long-range transmission experiments were developed at the end of 2020 to study different radios to decide correctly about the new component. Solar irradiance simulated values were analyzed to estimate the charge and discharge cycles for specific periods. Controlled dust and moisture IP analysis test were performed to certify the enclosure protection for the electronics.
3. Results
3.1. Hardware Development
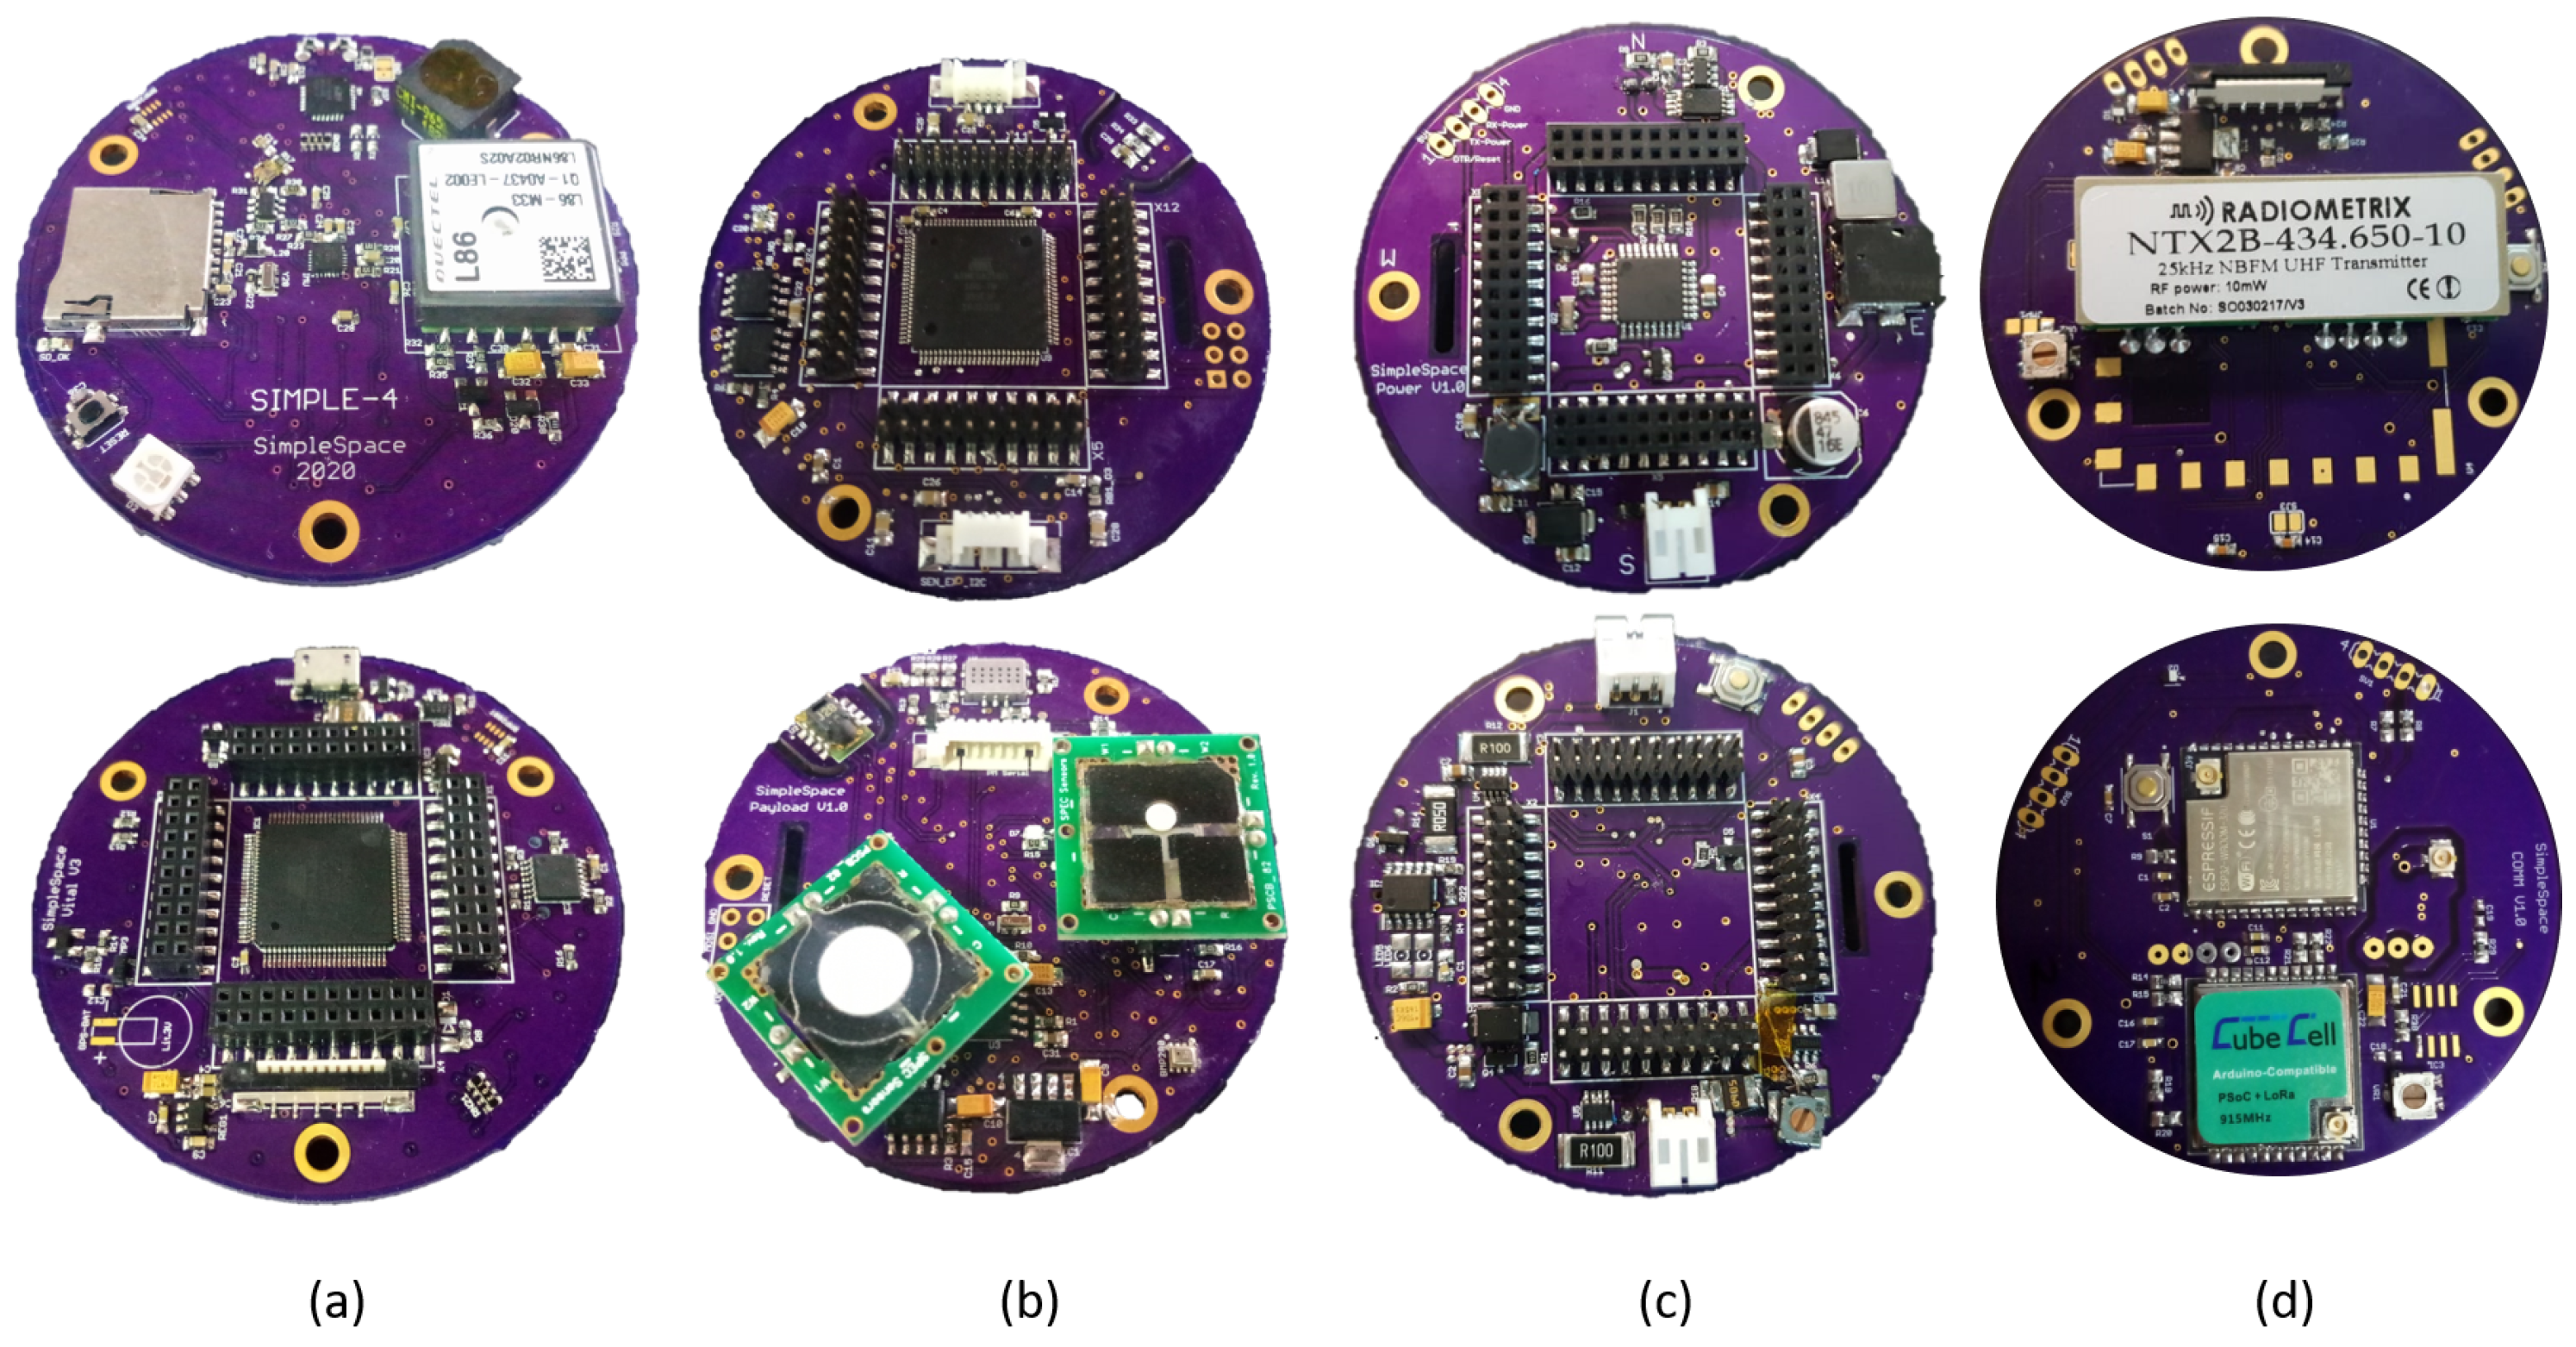
The simple-4 device is made up of 5 Printed Circuit Boards PCBs, each one of them housing a subsystem. The first is one 4-layer PCB called SimpleVital, which corresponds to the Command On Board & Data Handling (CB&DH) subsystem. The second is a three 2-layer PCBs called SimplePayload (Gases/Pollution), the third one the SimplePower (Energy Power Supply (EPS)), the fourth is the SimpleBattery (Battery bank), and the last the SimpleCOMM (Communications Subsystems (COMM)). All those are shown in
Figure 6.
The information transmitted (TX) from the Simple units is received in a gateway (RX) that uploads the information to the cloud service. Different long-range tests were developed in the Aburra Valley intending to guarantee the success of the network communication challenges as the abrupt terrain as well as possible obstacles, assuring the maximum distance of 18 km from the (TX) location in Bello (Baldias) to the gateway node (RX) in Universidad EAFIT.
3.2. Long Range Tests
The communication nodes of this network were programmed under the OTAA and ABP registration protocols necessary for secure communication with The Things Network. The nodes established contact with the web server through the configured gateway in the Universidad EAFIT for different distances in
Table 1. An incremental distance test was carried out to understand the system’s operation under a variable factor in the node antenna (
Figure 7). In this process, two antenna types were used in two configurations, centered and not centered in frequency, to determine the type of antenna with the best performance. The measurement of the intensity of the signal was compared against the theoretical electromagnetic signals propagation models.
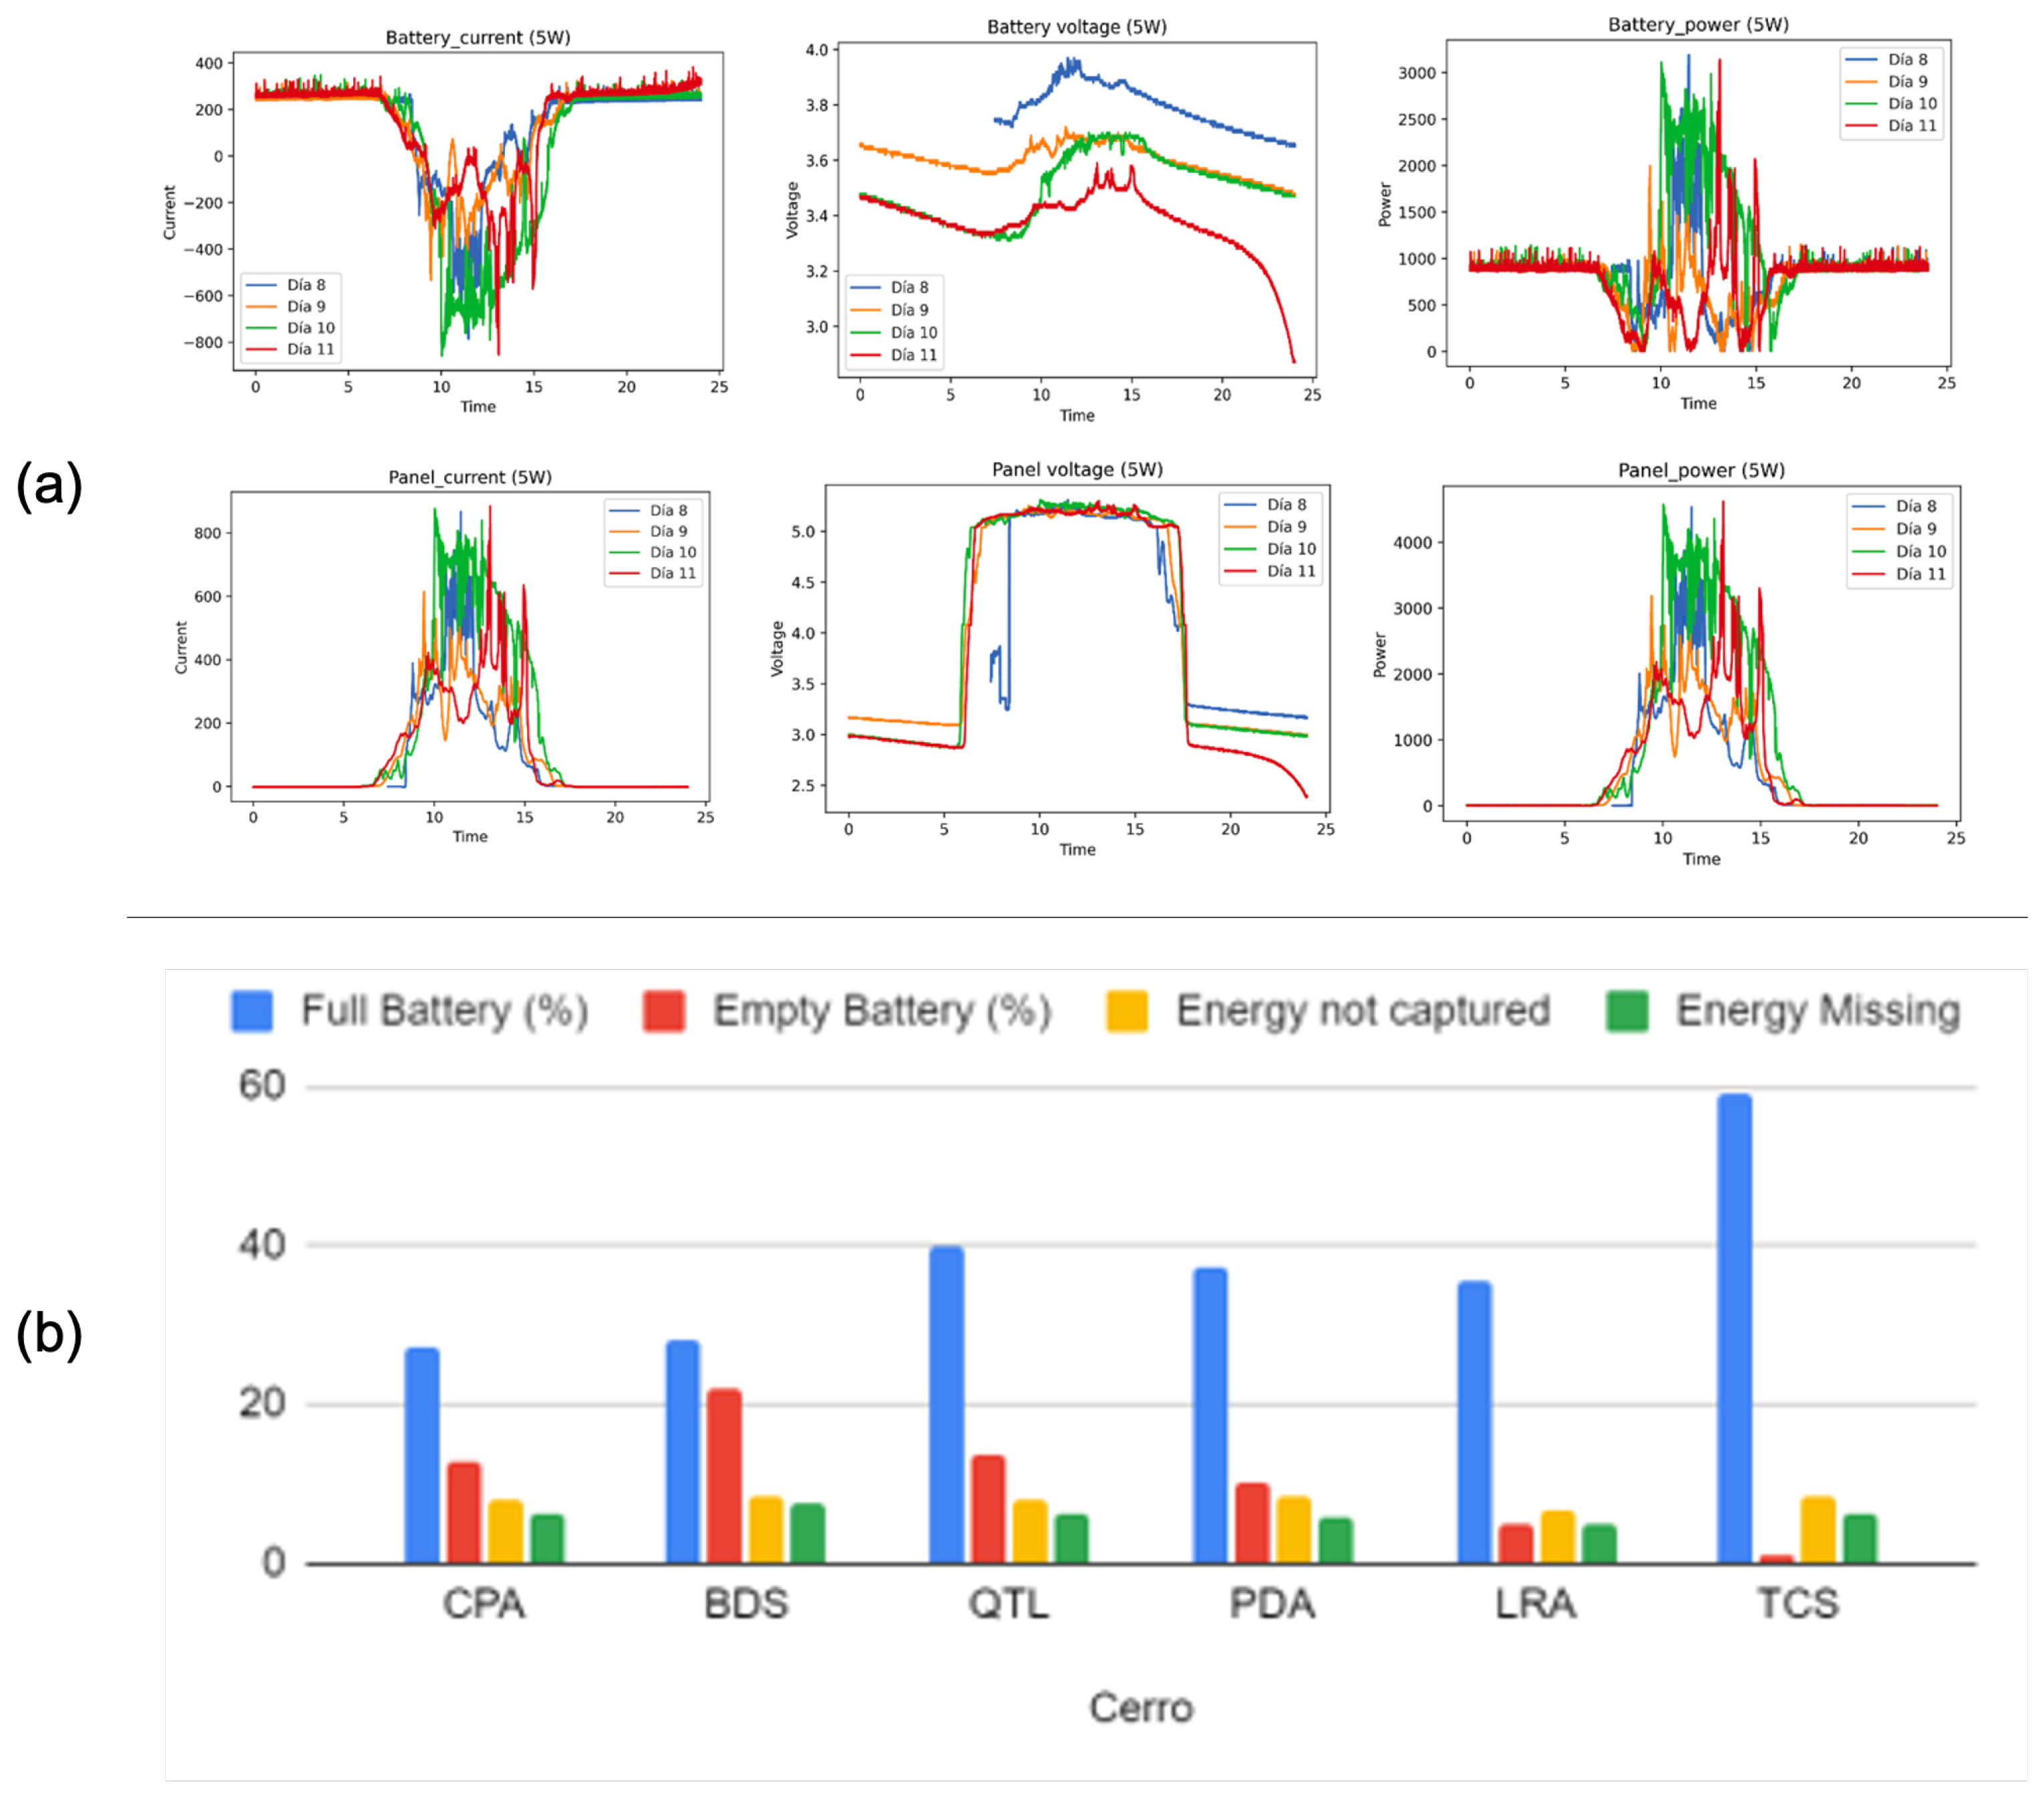
The EPS subsystem of the Simple-4 module was tested to ensure the power operation’s durability and stability. Different current and voltage sensors distributed before the load and the battery packets worked to understand the unit’s behaviour for the other climatological conditions with low irradiance values are shown in
Figure 8. The solar cells used for the station are 10 Watts polycrystalline cells with efficiency values of 12%.
3.3. Energy Power Supply Simulation Experiment
The European Commission’s Joint Research Centre (JRC) developed the PVGIS European power calculation tool (
https://ec.europa.eu/jrc/en/pvgis (accessed on 27 December 2022)). PVGIS uses data from meteorological models and satellite imagery to estimate the solar radiation that a PV system would receive at a given location, considering the local weather conditions, solar panel orientation and tilt, and other factors taken in account in
Table 2. In this study, we used PVGIS and other tools to estimate the power needed to select the solar array for a simple module based on the nominal values of battery charge and discharge information we measured. Our energy simulation experiments showed that the stations on the valley’s west side had higher solar power availability due to higher radiance values from a meteorological model.
To conduct our experiments, we used PVGIS to input the location, panel type, and battery information for our PV system and estimate the energy production and performance of the system. We also collected and analyzed data from other sources, such as meteorological models and satellite imagery, to better understand the factors contributing to higher solar power availability. Our experiments showed that the valley’s west side had higher solar power availability due to higher radiance values from a meteorological model. This finding has important implications for policy and practice, as it suggests that PV systems located on the valley’s west side may be more efficient and effective at generating energy. There are, however, some limitations to our study. For example, the results are based on data from a specific location and may not be generalizable to other regions.
The annual charge and discharge cycles for the selected points in the valley with a 10-watt panel configuration are depicted in the information presented. The graphic also includes simulations for four additional energy states: a fully charged battery, an empty battery, energy that was not captured, and missing energy simulation. This information helps understand the performance of the battery array and load in different locations and under various conditions. Analyzing the data makes it possible to identify patterns and trends that can inform future design decisions and optimization efforts.
3.4. Case Development and Disposition
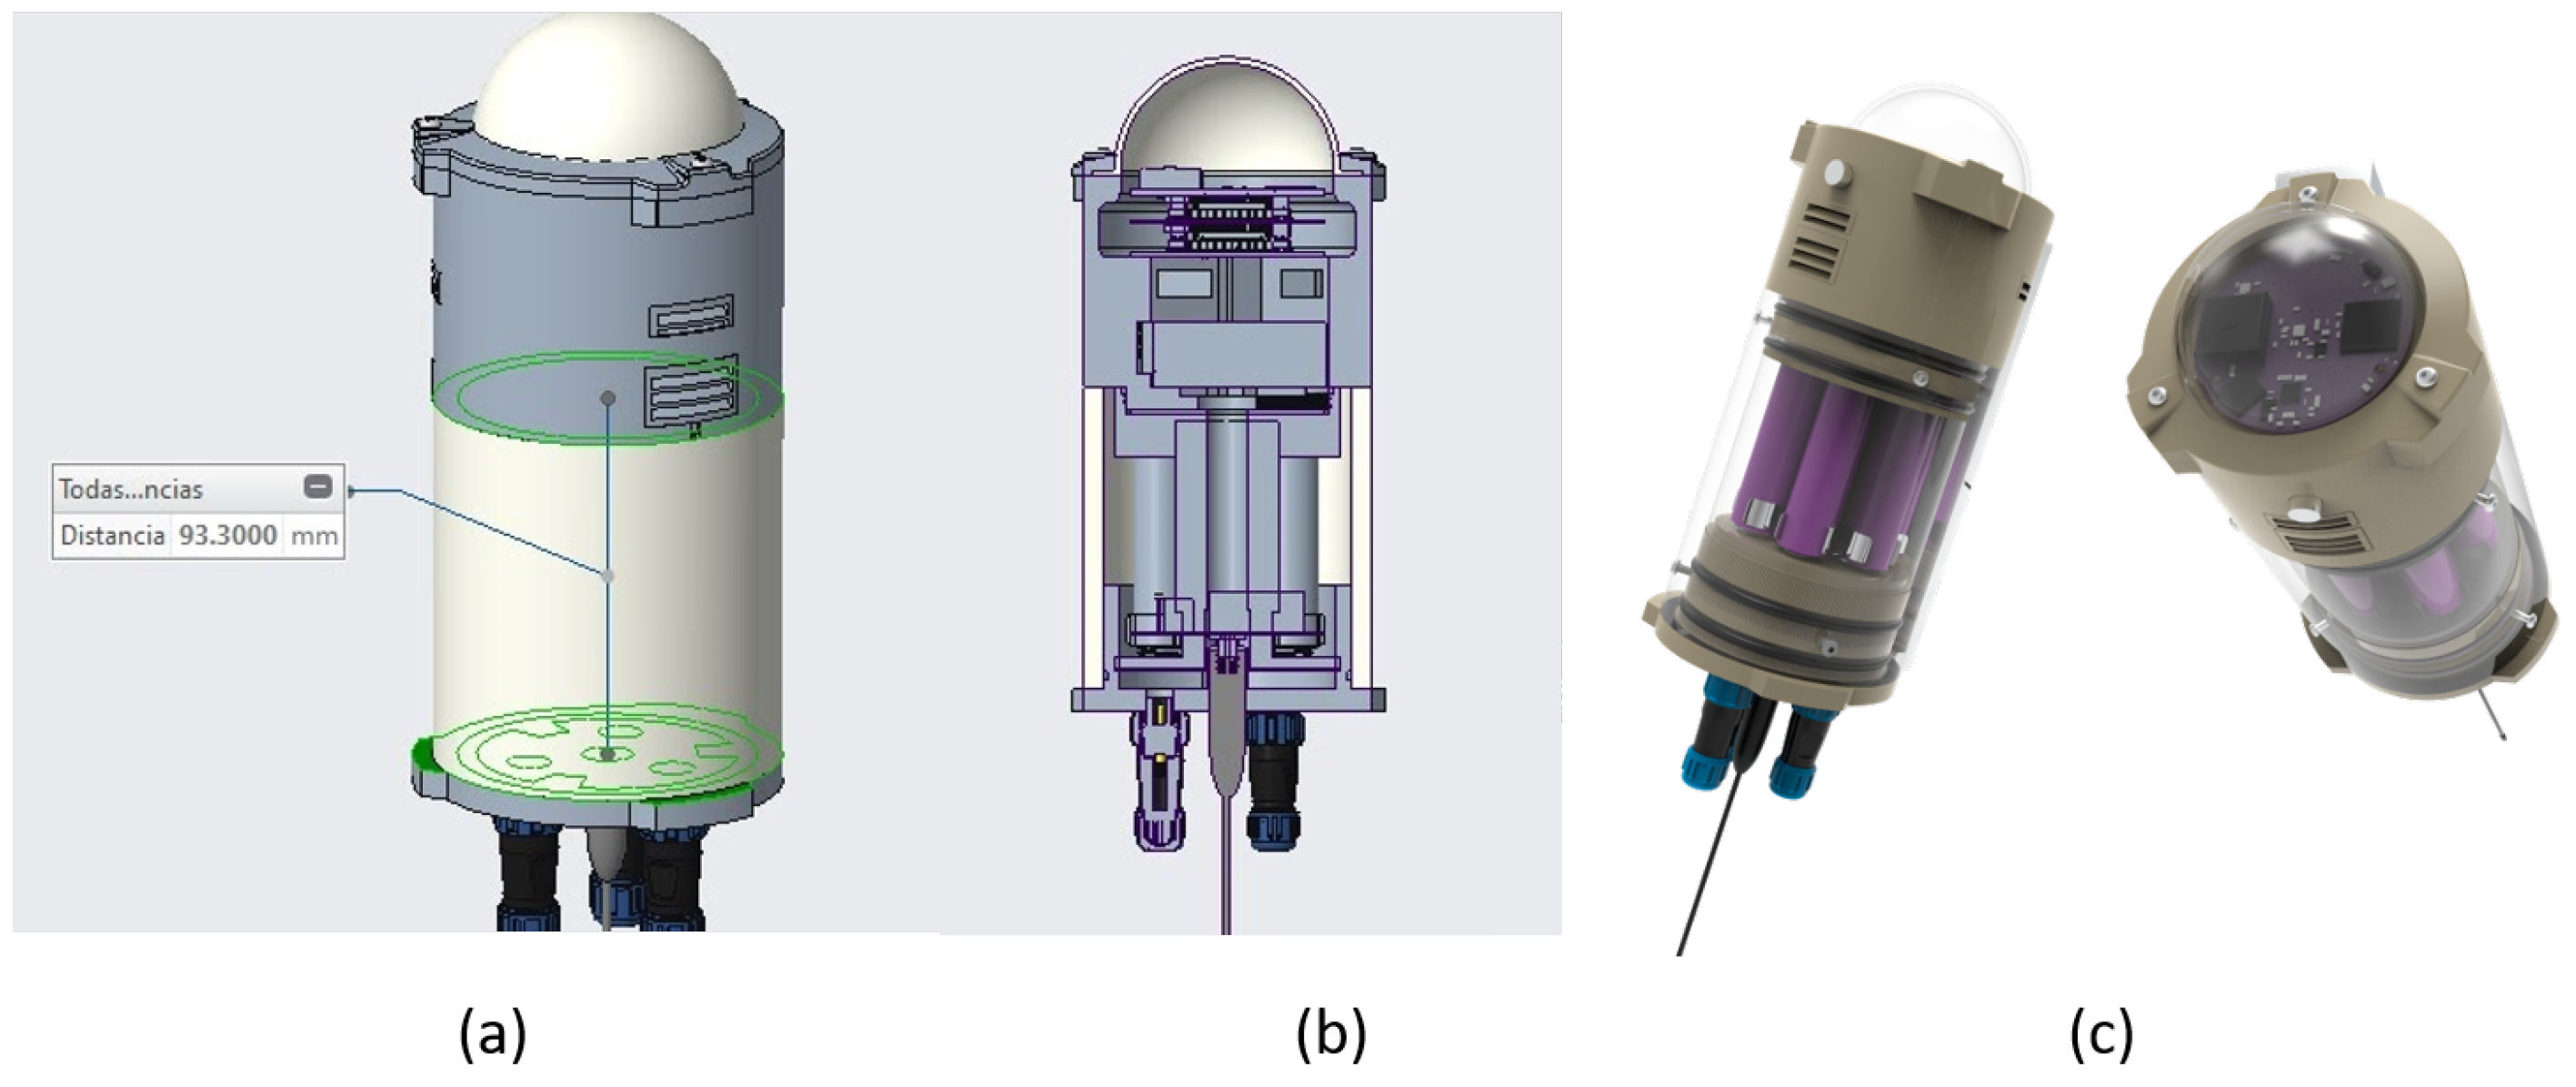
The unit’s design focused on protecting the internal electronics while maximizing the available volume without sacrificing structural integrity. To facilitate this, the case was carefully designed to meet these goals. One notable feature of the case is the transparent dome on the top, which allows light to reach the UV sensor and enables the user to monitor the device’s health through light signals emitted from the top PCB layer (
Figure 9). The GPS antenna is also positioned to have direct sky-sight, a crucial requirement for optimal connectivity. Overall, carefully considering design elements has resulted in a unit that balances functionality and durability.
The lateral airflow ducts allow the air in the chamber to reach the gas sensors. Controlled installations of the case to dust and moisture drastic changes were submitted to ensure an IP degree for the electronics case.
3.5. Experimental Calibration Results
We conducted different tests to ensure the module’s long-term performance and reliability. A thermal camera was used to monitor the electronic PCB during complete operation cycles. This enabled us to detect deviations from the nominal operating temperature, as shown in
Figure 10a. By identifying components that were not functioning properly, we were able to take proactive measures to prevent future malfunctions and energy losses.
Additionally, this testing allowed us to identify any potential issues before they become serious problems, helping to ensure the longevity and effectiveness of the module. By regularly monitoring the temperature of the PCB and its components, we were able to catch any abnormalities early on and take corrective action to maintain the overall efficiency and reliability of the system. Overall, this testing was critical in ensuring the long-term capabilities of the module and safeguarding against costly and inconvenient malfunctions. On another side,
Figure 10b,c show some images of the integrity tests performed in the chamber for the IP5X IP6X evaluation. These tests are essential to satisfy the long term requirenment for the hardware because bring the oportunity to expose to drastic conditions the equipment because the location sites surrounding the valley are not supposed to be visited frequently.
The
Figure 11 shows the time series comparison between the Vaisala AQT400 unit and the module developed for this project for the Ozone, NOx gasses and humidity, temperature from two sensors. The data from the module overestimated the Vaisala value, and once the calibration algorithm is applied, the corrected value is also depicted.
The inter-calibration procedure validated the performance of the sensor under investigation. The sensor was compared with reference sensors to determine observation error and accuracy. Results showed error margins within 10% of nominal, considered acceptable for use in the data assimilation algorithm. The inter-calibration contributed to the robustness of the study’s findings by ensuring the reliability of the sensor data.
4. Discussion
The previous modeling of atmospheric composition dynamics in the Aburrá Valley showed inconsistencies in concentration and deposition fields based on the meteorology input to the CTM. Accurate meteorology suggests a reduced simulated concentration from the previous ECMWF meteorology used for this valley. Although emissions and meteorology are relevant dynamics in these models, the detailed emissions inventories contain high uncertainty, so the developments of a DA system like this oriented to emission estimations bring a region a capability.
Air quality data at the top of the Valley’s surrounding mountains are nonexistent, and the hypothesis of the chemical transport from the valley still needs to be explored experimentally. In
Figure 11 the measurement unit’s first deployment campaign in the valley’s surrounding mountains is shown. A comparison of the particulate sensor (pm10) of the device against two sensors one inside the valley (Est 295) and the other outside (Est 152) is shown in the right image. This low-cost sensor ground base measurement could be a feasible solution to increase data availability from non-connected areas. It will be validated if evidence corroborates these contradictions in these difficult-to-reach areas.
Air quality modeling and monitoring are crucial for understanding the sources and distribution of pollution. Incorporating additional spatial and temporal information into model simulations can improve predictions. However, the lack of monitoring in certain areas and the dependence of particulate matter simulation impact on meteorological modeling accuracy pose challenges for fully understanding air pollution. These findings underscore the need for continued research in this field (
Figure 12).
The simulation perspective gives some ideas for this kind of network to verify the predicted removal dynamics corroborating from the observation point of view through DA and validation activities. DA activities have been reviewed for this region in [
24] analyzing the state-of-the-art and the subsequent state applicable to the Tropical Andes region. DA has been applied in the Aburrá valley since 2019 [
25] for a high-resolution experiment assimilating particulate matter observations with the LOTOS-EUROS CTM using an ensemble-based technique. From this first DA experiment, the urgent need to expand the data sources on atmospheric pollutants concentrations were identified to improve the performance models at local and regional scales. Low-cost sensors are gaining importance through the years for managing air pollution in the cities [
26]. Therefore more and more electronic technology of this kind is gaining respect and complementing operative air quality networks. Problems like calibration have been reviewed recently, and methodologies such as [
27] can be applied to assess the network’s data through calibration models or specific tools designed for the evaluation of low-cost gas sensors [
28]. Also, the correction of hysteresis developed in [
29] must be considered further for oxidative-based sensors. Data assimilation onto the LOTOS-EUROS CTM demonstrated how, with low-cost sensors and data assimilation techniques, a system for air quality monitoring could add value to the low-cost budget for instrumentation. Understanding the dynamic of the several gasses that escape from the valley is essential. This rural network has diverse logistic and engineering design challenges to comply with the objectives successfully.
