
Proceeding Paper

Carbon-Nanotubes- and Porous Organic Polymers-Based Porous Fluids for CO2 Capture †

by
Elena Rusanova
1,*,
Dmitrii Gribanev
1,
Hassan Alqahtani
2,
Khalid Alruwaili
2 and
Vera Solovyeva
1
1
Aramco Innovations LLC, Bld. 1, 9 Varshavskoye Highway, 117105 Moscow, Russia
2
EXPEC Advanced Research Center (EXPEC ARC), Dhahran 31311, Saudi Arabia
*
Author to whom correspondence should be addressed.
Presented at the 4th International Online Conference on Materials, 3–6 November 2025; Available online: https://sciforum.net/event/IOCM2025.
Mater. Proc. 2025, 26(1), 22; https://doi.org/10.3390/materproc2025026022
Published: 15 May 2026
(This article belongs to the Proceedings of The 4th International Online Conference on Materials)

Abstract

Emissions of carbon dioxide are considered to be the major factors leading to climate change. Current technologies for CO2 capture include chemical and physical absorption, membrane separation, and cryogenic distillation. Solid adsorbents are highly effective, and emerging porous liquids—solid adsorbents dispersed in a compatible liquid—represent a promising alternative for CO2 capture. In this study, commercial and synthetic porous carbon nanomaterials were dispersed in a 1 wt.% aqueous solution of sodium dodecyl sulfate and compared on the efficiency of CO2 uptake. The experimental results confirmed that CO2 uptake is enhanced in porous liquids employing surface-modified carbon nanotubes (69 mmol/L) and covalent triazine frameworks, with triazine-based nanomaterials exhibiting superior CO2 uptake performance (76 and 82 mmol/L) due to their increased polar group number.

1. Introduction

The rising levels of atmospheric carbon dioxide [1], the major greenhouse gas, require the development of effective and scalable CO2 capture systems. A highly efficient solution is needed for CO2 capture from CO2-containing gas streams, such as natural gas, flue gas, etc. The widely used technologies for CO2 dissolution and separation include amine absorption [2], zeolite adsorption [3], and cryogenic distillation [4]. Nevertheless, these methods suffer from substantial drawbacks. Challenges associated with amine absorption include corrosion of carbon steel, high energy demand for solvent regeneration, and solvent processing issues such as the selection of suitable amines, optimization of concentration, and control of viscosity. These limitations have been widely discussed in the literature [2,5]. Zeolite adsorption also requires high energy for zeolite regeneration, including high temperature or low pressure. Additionally, purified gases often include moisture, which adsorbs on hydrophilic zeolites, occupying active adsorption sites and significantly reducing the effective CO2 uptake under humid conditions [6]. Cryogenic distillation of CO2 is effective at high CO2 concentrations, but this method requires low temperatures, resulting in high energy consumption and operational costs [7]. The cryogenic separation of CO2-containing gas mixtures demonstrates a high efficiency at high CO2 concentrations in carbon-enriched gas mixtures, but limited applicability in gases with low CO2 concentrations. Furthermore, equipment blockage can occur due to the formation of dry ice under cryogenic operating conditions [8].
Porous liquids, consisting of porous solid CO2 sorbents dispersed in liquid media, represent an alternative method of separating CO2-containing gas streams. The concept of porous liquids was proposed by James et al. in 2007 [9]. Depending on their composition, porous liquids can be categorized into three types: “near-porous” liquid hosts that form true single-phase solutions without a distinct boundary between the porous solid and the solvent (Type I), liquids containing solid porous molecular cages dissolved in sterically hindered solvents (Type II), and porous molecules dispersed in solvents (Type III) [9].
Examples of CO2 uptake in porous liquids in the literature (Table A1) indicate a wide range of performance depending on the dispersed nanomaterial and liquid medium. Porous liquids based on porous organic cages demonstrate an enhancement of CO2 dissolution compared to neat solvents, but the overall pore concentration is limited due to low cage loading [10]. Type III porous liquids based on MOF particles demonstrate significantly higher CO2 uptake performances at ambient conditions compared to the pure liquid phase [11,12,13]. For example, Type II and III porous liquids based on ZIF-8 dispersed in ionic liquids exhibit enhanced CO2 uptake relative to the neat ionic liquid, suggesting the contribution of solid porosity within the fluid medium [13,14]. Although absolute values vary with system design, general trends show that tailored porous liquid systems can achieve CO2 uptake capacities that rival or exceed early porous cage liquids, indicating significant performance potential as both sorbents and fluid materials in gas separation applications. These approaches have expanded the range of nanoporous materials beyond classic physical absorbents and point toward porous liquids as a new class of materials for CO2 capture.
Owing to their tunable pore environment, low viscosity, and enhanced gas dissolution, porous liquids show potential for selective and reversible CO2 capture. Porous liquids show promise for CO2 capture, improving its dissolution in liquid media by combining sorbent porosity and selectivity and the fluidity of a medium [15]. Additionally, the porous filler is uniformly distributed in liquid matrices without interfacial defects [16]. Furthermore, liquids usually do not suffer from mechanical fatigue, physical aging, or plasticization, which are commonly observed in solid sorbents [15]. There is no need to reconstruct existing industrial units (e.g., amine absorption setups), because porous liquids can be embedded in existing units. Their fluid nature provides potential regeneration under milder conditions.
Despite these advantages, the design of porous liquids remains challenging. Achieving high gas uptake requires maintaining open, unoccupied pores while simultaneously ensuring compatibility and stability of the dispersed components within the host liquid. Mass transfer between liquid and gas may be slower than in conventional CO2 capturing systems, particularly at low gas pressures [17]. The viscosity and diffusivity of the liquid medium can influence uptake kinetics, and optimization of nanomaterial loading is necessary to balance performance and cost [18].
Porous liquids might exhibit superior performance in scenarios where conventional solid adsorbents are difficult to process, for example in flowing systems, microreactors, or packed columns requiring fluidity, or when selective CO2 capture under mild conditions is desirable [15].
In this study, commercial and synthetic porous carbon nanomaterials and frameworks were obtained. Nanomaterials such as carbon nanotubes (CNT) and covalent triazine frameworks (CTF) were dispersed in an aqueous solution and evaluated according to their efficiency of CO2 uptake. CO2 capture performance of carbon nanotubes and covalent triazine frameworks has been extensively studied in many research works, demonstrating exceptional values of CO2 uptake [19,20,21,22,23,24]. However, porous liquids containing these nanomaterials have not been studied yet. The aim of this research was to investigate the behavior of CNTs and CTFs as fillers in porous liquids and evaluate their potential to enhance CO2 dissolution. The present work advances the porous liquid concept in a simple and scalable direction by employing an aqueous continuous phase (1 wt.% SDS aqueous solution) and dispersing nanoporous solids (CNTs) and, for the first time, covalent triazine frameworks to generate Type III porous liquid formulations under ambient conditions. Key distinguishing aspects relative to prior porous liquid reports include: (i) the use of a low-cost, low-toxicity aqueous/surfactant medium rather than neat ionic liquids or molecular solvents; (ii) the direct comparison of pristine versus surface-modified carbon nanotubes (CNT-P vs. CNT-M) and two CTF synthesis routes (CTF-DIPEA vs. CTF-K2CO3) within the same formulation strategy; and (iii) an emphasis on CO2 uptake in low-pressure conditions (298 K, 1 bar) using a manometric method, enabling rapid screening of formulation performance. In the described workflow, the best-performing formulation (CTF-DIPEA in 1 wt.% SDS) achieves the highest CO2 uptake among the tested liquids, indicating that CO2 affinity (e.g., basic nitrogen sites and possible reversible chemisorption) can outweigh purely geometric porosity metrics, highlighting the importance of coupling surface chemistry with a stable dispersion strategy.

2. Materials and Methods

1,4-Dioxane, cyanuric chloride, potassium carbonate, nitric acid (65%), sulfuric acid (98%), and sodium dodecyl sulfate (SDS) were purchased from Sigma-Aldrich (St. Louis, MO, USA) at purities >99%. 1,4-Phenylenediamine (>98%) and N,N-diisopropylethylamine (DIPEA, >99%) were obtained from ABCR (Karlsruhe, Germany). Acetone and isopropanol (reagent grade) were provided by Rushim (Moscow, Russia). Single-walled carbon nanotubes (SWCNTs) were supplied by Universal Additives LLC (Novosibirsk, Russia). All chemicals were used as received without further purification.

2.1. Synthesis of Nanomaterials

2.1.1. Synthesis of CTF-DIPEA

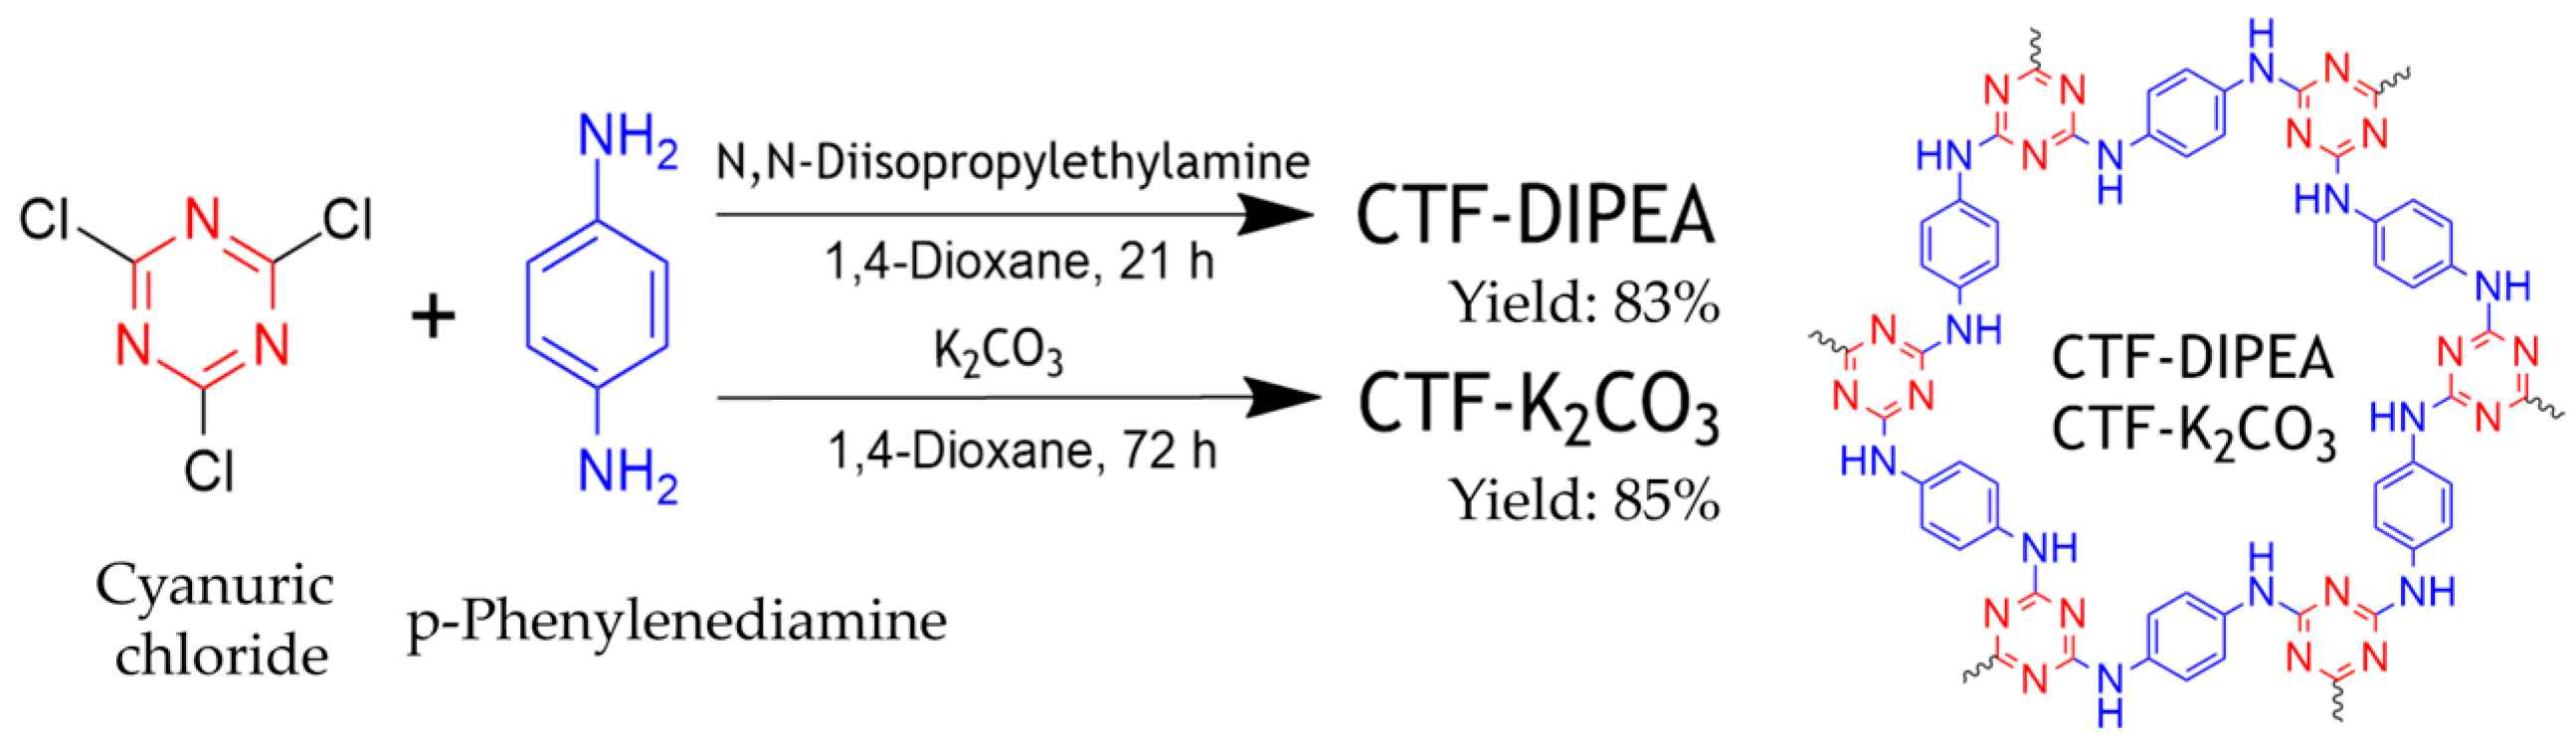
Synthesis of CTF-DIPEA was performed according to a reported procedure [25]. The synthesis route of CTF-DIPEA is shown in Figure 1. A mixture of 1,4-phenylenediamine (10.2 mmol) in 1,4-dioxane (30 mL) was added dropwise over 1 h to a mixture of cyanuric chloride (13.6 mmol) and N,N-diisopropylethylamine (9 mL) under an argon atmosphere. The mixing was performed with vigorous stirring at 15 °C, resulting in a light brown mixture. The reaction temperature was raised to 25 °C and maintained for 2 h, then further increased to 65 °C and held for 21 h under reflux. After cooling, the resulting solid was ground in a mortar. The product was repeatedly washed with isopropanol via centrifugation and subsequently left to soak in isopropanol for 16 h, followed by additional washes with fresh isopropanol. The solvent was removed using a rotary evaporator. Finally, the CTF-DIPEA powder was dried in a drying cabinet at 120 °C and 10 mbar overnight, yielding 83 wt.% of light brown solid.

2.1.2. Synthesis of CTF-K2CO3

CTF-K2CO3 was synthesized via a modified procedure [26] with a precise stoichiometry (Figure 1). A solution of 1,4-phenylenediamine (15 mmol) in anhydrous 1,4-dioxane (50 mL) was mixed with K2CO3 (30 mmol) and cooled to 15 °C under an argon atmosphere, followed by the dropwise addition of a solution of cyanuric chloride (10 mmol) in 1,4-dioxane over 2 h. The reaction mixture was heated to room temperature over 1 h and then refluxed at 90 °C for 72 h. The resulting precipitate was collected by filtration and washed sequentially with water, isopropanol, and acetone. Drying at 120 °C and 10 mbar in a drying cabinet overnight yielded 84 wt.% of light pink solid.

2.1.3. Surface Modification of Carbon Nanotubes

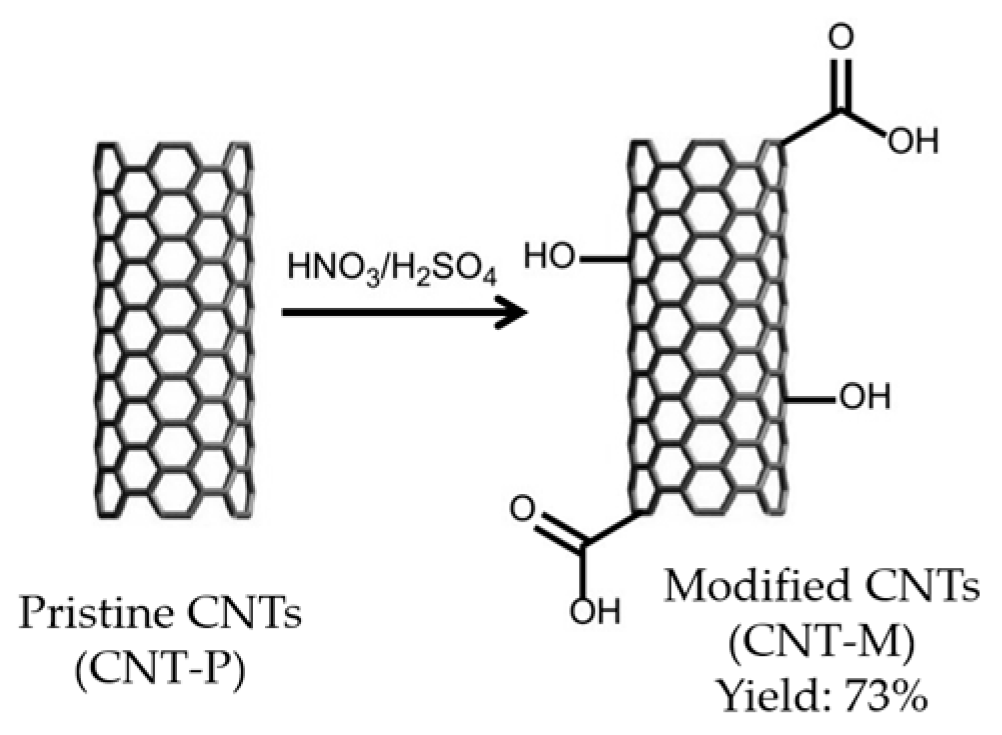
Pristine SWCNTs (CNT-P) (0.8 g) were mixed with a 100 mL mixture of HNO3/H2SO4 (v/v = 1:3) and refluxed for 4 h at 70 °C, maintaining regular stirring. After cooling to room temperature, the mixture was diluted with deionized water, followed by filtering through a 0.2 µm Millipore mixed cellulose ester membrane until the pH of the filtrate reached 7. Then filtered oxidated SWCNTs were dried in a drying cabinet at 80 °C and 10 mbar overnight, yielding 73 wt.% of modified CNTs, named as CNT-M (Figure 2).

2.2. Formulation of Porous Liquids

A 1 wt.% solution of SDS was prepared in deionized water under stirring until complete dissolution. To ensure micelle formation, the 1 wt.% (34 mM) SDS concentration was chosen well above the critical micelle concentration (CMC) of SDS, equal to ~8 mM at room temperature [18,27,28]. This solution was subsequently used in the preparation of porous liquids with nanomaterials. For blank measurements, deionized water and the 1 wt.% SDS solution were utilized.
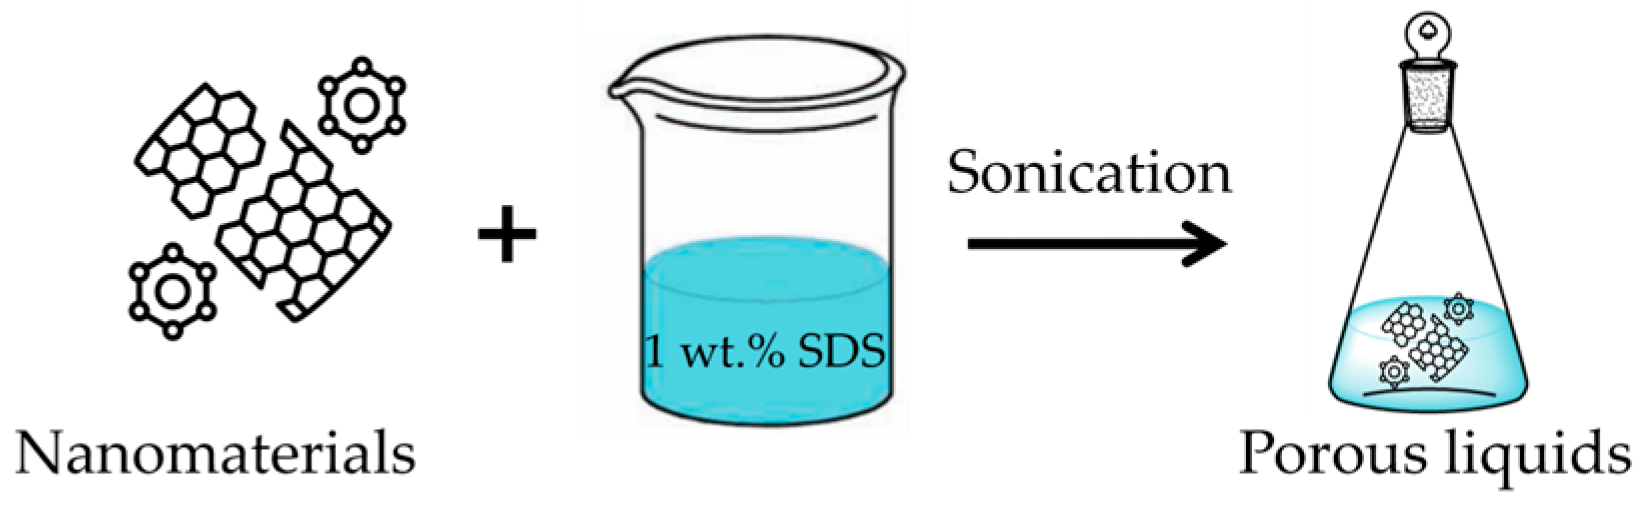
Four separate samples of porous liquids were prepared by adding 2 mg of different nanomaterials (0.004 wt.%) to 50 mL of 1 wt.% SDS, followed by 30 min of sonication (300 W, 20 kHz) (Figure 3). To prevent overheating, the flask containing the solution was maintained in an ice bath, and sonication was performed in either continuous mode or with alternating 5 min pulses and 5–10 min pauses. The loading of nanomaterials was chosen as the starting point to observe the presence of statistically important differences in CO2 uptake between 1 wt.% SDS and the liquid systems loaded with porous nanomaterials. This content of porous materials was probed to avoid the disruption of SDS micelle stability as well as the stability of the entire system.

2.3. Characterization Techniques

The FT-IR spectra were recorded from 4000 to 500 cm−1 on a Thermo Scientific Nicolet (Waltham, MA, USA) iS50 FT-IR spectrometer. CNTs were analyzed in KBr pellets, whereas CTF-DIPEA and CTF-K2CO3 were characterized by attenuated total reflection.
Thermogravimetric analysis was performed using the Discovery TGA 5500 system from TA Instruments (New Castle, DE, USA) with a heating rate of 10 °C/min from 26 to 600 °C using a nitrogen flow of 15 mL/min and an initial sample weight of ~2–4 mg.
Brunauer–Emmett–Teller (BET) surface area and pore volume analysis was conducted by measurements of nitrogen adsorption isotherms at 77 K using a BELSORP Mini-X device (MicrotracBEL, Osaka, Japan). Preliminary preparation of the samples was carried out by vacuuming to 2–4 Pa at a temperature of 120–350 °C (depending on the sample type) for 12 h. The total specific surface area and the total pore volume were measured via the BET method at a relative partial pressure of p/p0 = 0.3; mesopore size distribution, mesopore area and volume were determined using the Barrett–Joyner–Halenda method; micropore size distribution was estimated using the adsorption curve.
XRD patterns were obtained using a Thermo Scientific (Waltham, MA, USA) ARL EQUINOX 1000 X-ray Diffractometer to determine the materials’ crystallographic structures. CuKα radiation with a wavelength of λ = 1.54 Å was used over a diffraction angle of 2θ ranging from 10° to 90°.
XPS analysis was performed on a PREVAC EA15 (Prevac, Poland) spectrometer equipped with a high-resolution hemispherical analyzer. Characteristic non-monochromatic Al Kα X-ray radiation (1486.6 eV, 150 W) was used to excite the spectra. The residual gas pressure during measurements was 5 × 10⁻⁹ mbar. The binding energy scale was pre-calibrated using the photoelectron lines of the core levels of gold (Au4f7/2—84.0 eV) and silver (Ag3d5/2—368.3 eV). Powdered samples were applied to double-sided conductive adhesive tape and mounted on a standard holder. Each survey and high-resolution spectrum was fitted with constrained Gaussian components on a linear background.

2.4. Experimental Determination of CO2 Uptake in Liquids

Nanomaterials were compared for their efficiency as the porous fillers in fluids. Efficiency of porous fluids was estimated and compared with blank measurements for water and an aqueous solution of surfactant. The CO2 uptake of the liquid samples was determined volumetrically at 298 K and 101.3 kPa, following a modified procedure from the literature [29].
A predetermined mass of dry ice (0.5–1.0 g) was weighed using an analytical balance and immediately transferred into a sealed 500 mL flask containing 20–25 mL of the analyte liquid. The flask, equipped with a calibrated manometer (working range 0–1.6 bar), was maintained under vigorous stirring to facilitate the complete evaporation of CO2. The pressure of evaporated CO2 was registered by the manometer, previously calibrated via the evaporation of dry ice in deionized water (50 mL). The pressure measurement for each sample was performed three times, and the average value was calculated. The detailed calculation methodology is described below.
Volume of CO2 released from dry ice (mL):
V C O 2 = m C O 2 M C O 2 · V M ,
where
  • m C O 2 —mass of dry ice (g);
  • M C O 2 —molar mass of CO2 (44 g/mol);
  • V M —molar volume of CO2 (22,400 mL/mol).
Overpressure generated by dry ice (bar):
P t h e o r = V C O 2 V h e a d s p a c e ,
where
  • V h e a d s p a c e —volume of headspace (mL), calculated as volume of flask (500 mL)—volume of liquid (mL).
Correlation pressure was calculated from manometer uncertainty (bar):
P c o r r = P m e a s · c
where
  • P m e a s —pressure registered by manometer (bar);
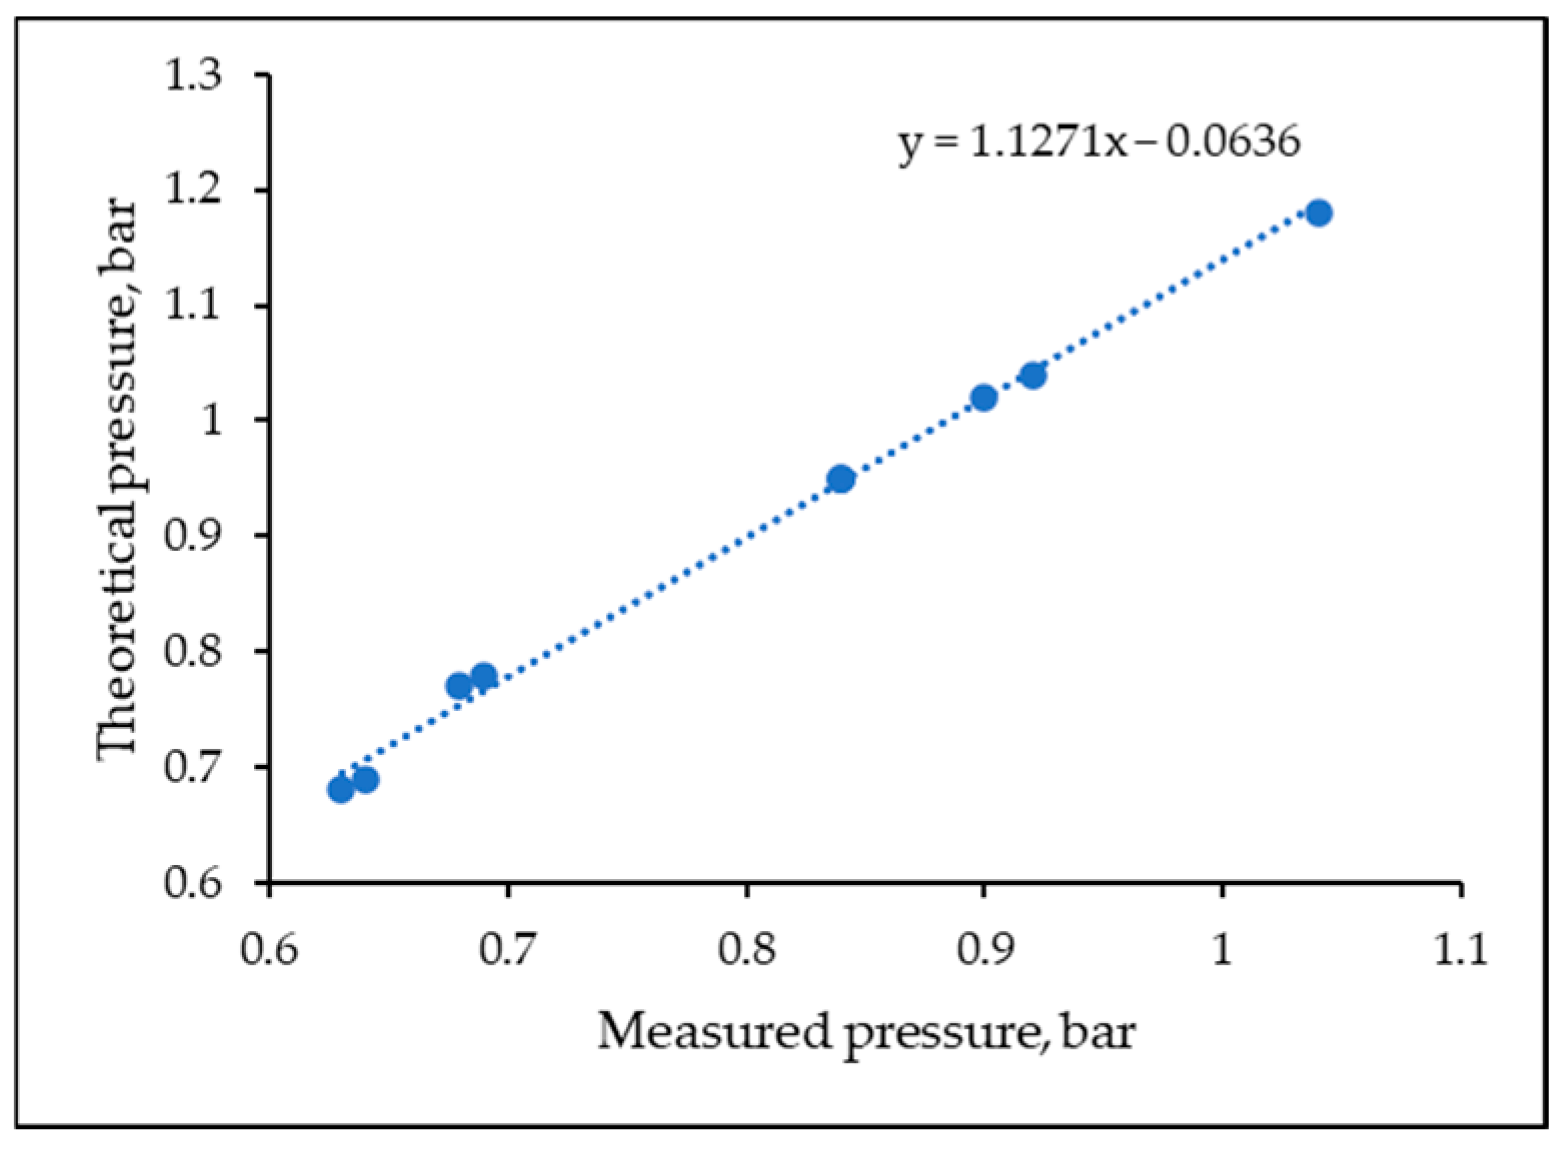
  • c —correlation coefficient (1.1271) derived from calibration against measured pressure upon dry ice evaporation in deionized water and theoretical pressure calculated by the Mendeleev–Clapeyron equation (Figure 4).
Pressure difference (bar):
d P = P t h e o r P c o r r
Volumetric CO2 uptake (mmol/L):
C O 2   u p t a k e = d P P t h e o r · m C O 2 M C O 2 V s · 10 6
The dry ice evaporation method can cause experimental uncertainties, including non-uniform sublimation of dry ice and dissolution of CO2, potential gas leakage, equilibrium assumptions, and non-isothermal fluctuations. This method is extensively described in the work of Truong et al. [29], which served as the experimental basis for the present study. The method implicitly assumes constant temperature and ideal gas behavior; deviations from these assumptions introduce uncertainties in the calculated CO2 uptake. Non-isothermal fluctuations lead to changes in gas expansion and compression, which influence the measured CO2 volume and pressure inside the flask. Specifically, a higher ambient temperature causes thermal expansion of CO2, potentially resulting in an overestimation of the available CO2 amount, while a decrease in temperature leads to gas compression and may cause underestimation. Additionally, temperature gradients can alter the sublimation kinetics of dry ice, affecting the CO2 generation rate and the time required to reach adsorption equilibrium.
However, the method is enough for reliable qualitative and quantitative CO2 adsorption measurements. According to Figure 4, the measured CO2 pressure closely coincides with the theoretical pressure calculated using the ideal gas law, yielding a high correlation coefficient (R2 = 0.9959). This agreement indicates that the behavior of CO2 generated from dry ice in the experimental apparatus can be well approximated by ideal gas behavior under the applied conditions.

3. Results and Discussion

3.1. Nanomaterials Characterization

3.1.1. FT-IR Spectroscopy

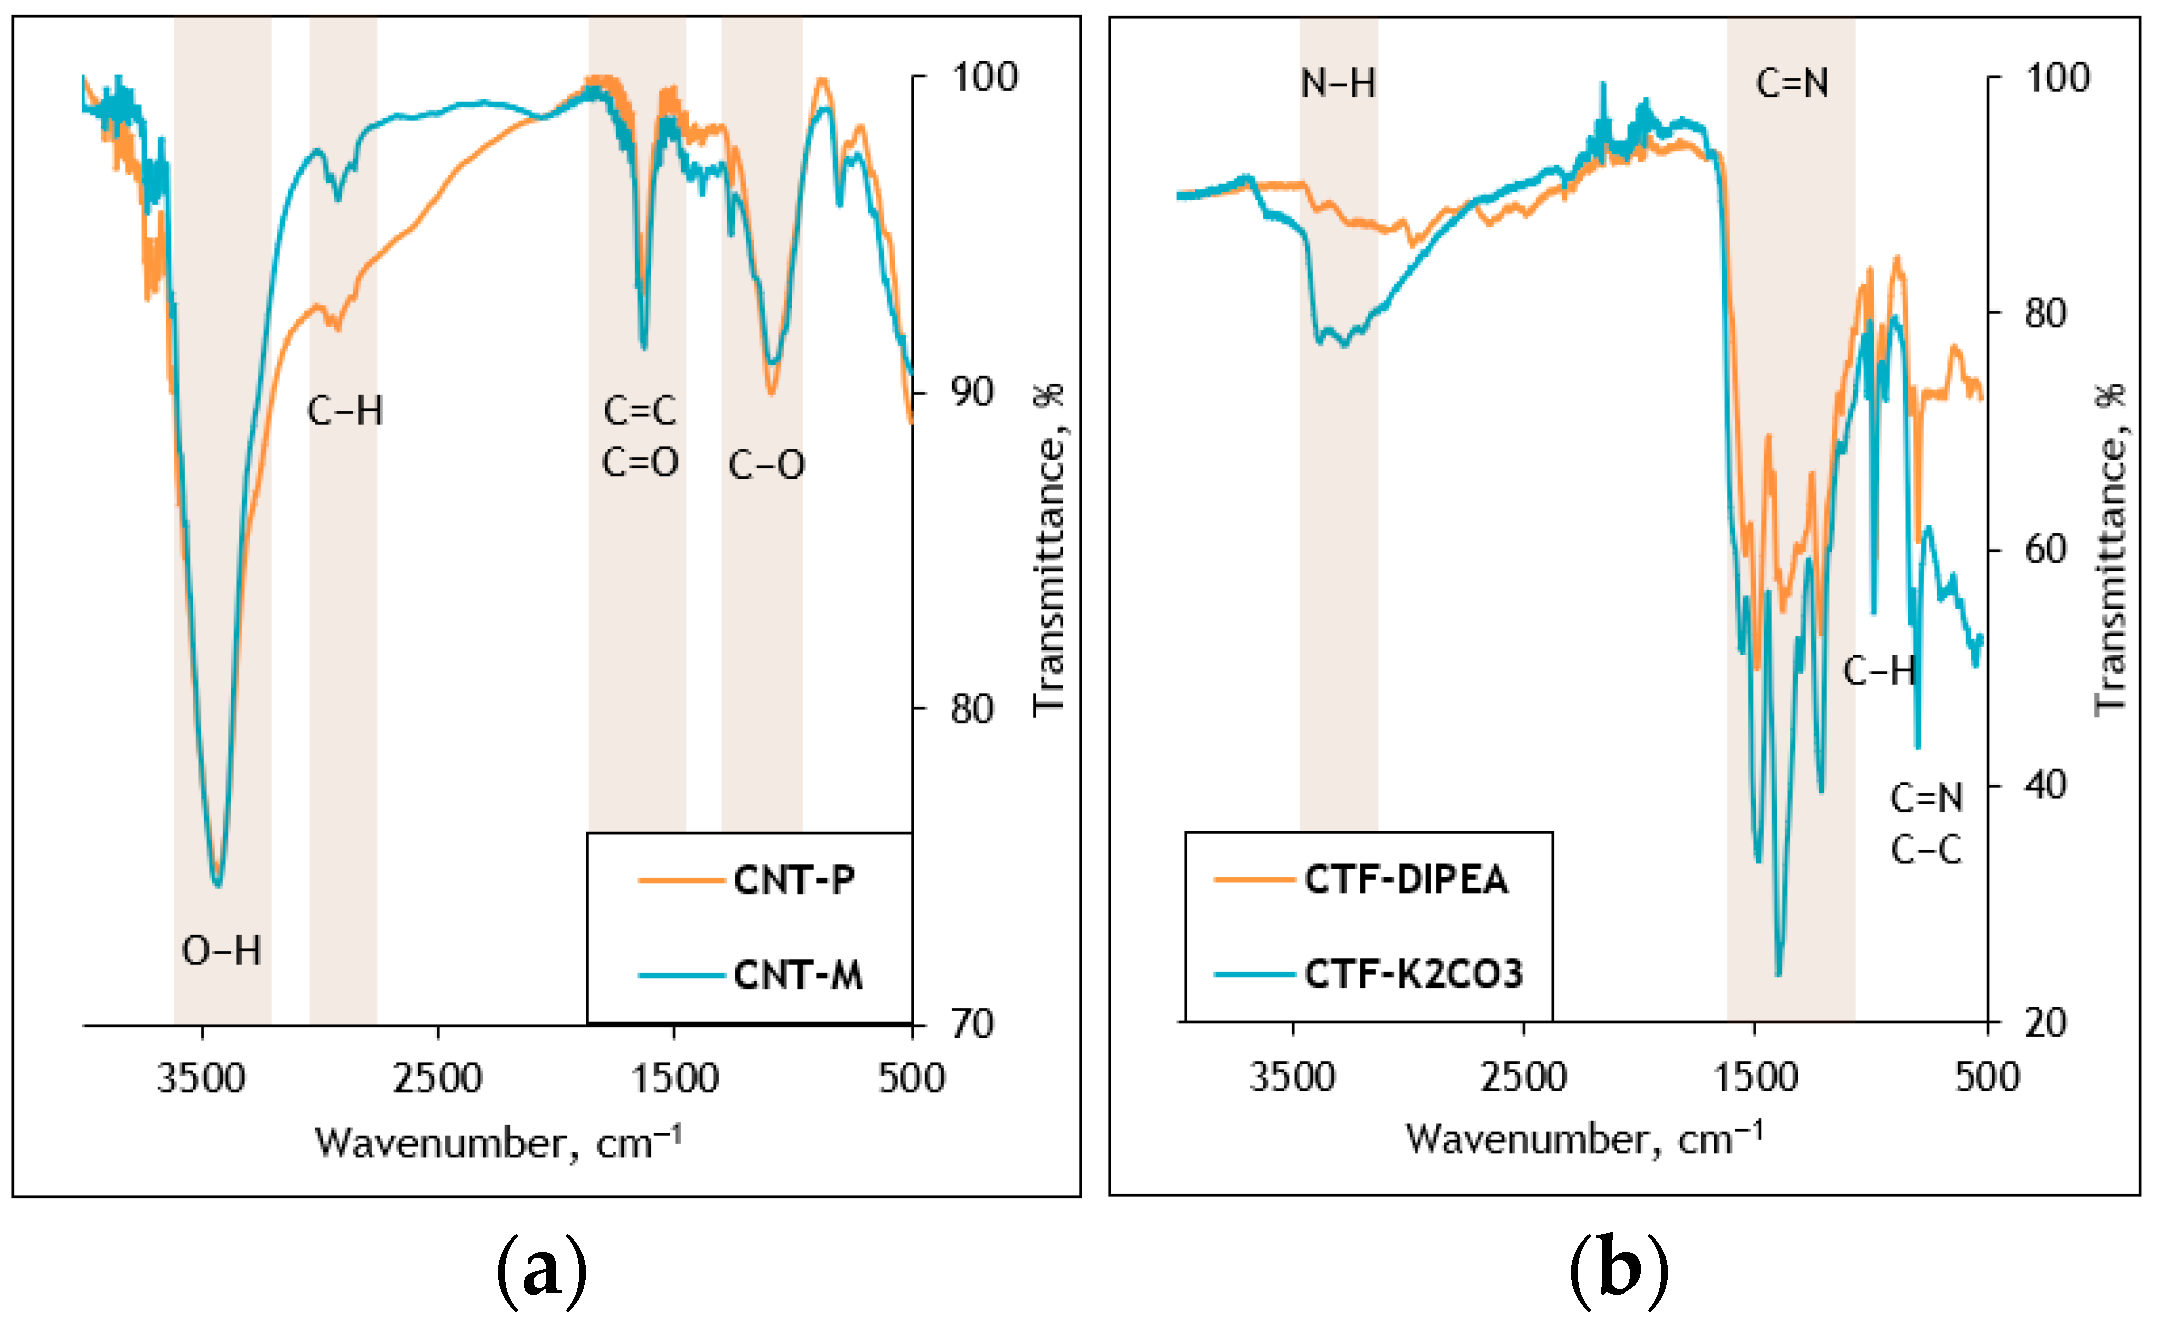
The FT-IR spectra of pristine and modified CNTs are shown in Figure 5a. The most prominent feature in both spectra is a peak at 3425 cm−1, indicating the presence of hydroxyl (–OH) groups on the CNTs [30]. A distinctive absorption band at 1660–1630 cm−1 occurred due to the stretching vibrations of carbon–carbon (–C=C) and carbon–oxygen (–C=O) bonds. The presence of C-H bond stretching vibrations is indicated by peaks at 2950 cm−1. Signals at 1100 and 1260 cm−1 are attributed to stretching vibrations of the carbon–oxygen (–C–O) bond in CNT-carboxyl functional groups resulting from the modification process.
Successful synthesis of CTFs was confirmed by FT-IR analysis (Figure 5b). Peaks at 799, 1220, 1382, 1494, and 1544 cm−1 are attributed to –C=N stretching vibrations and indicate the presence of benzene and triazine structures. The signal observed at 982 cm−1 is assigned to the =C–H bending vibration. The more intense absorption band observed at 3270–3400 cm−1 for CTF-K2CO3 is consistent with a higher degree of cross-linking, resulting from the use of stoichiometric reagent ratios.

3.1.2. Thermogravimetric Analysis

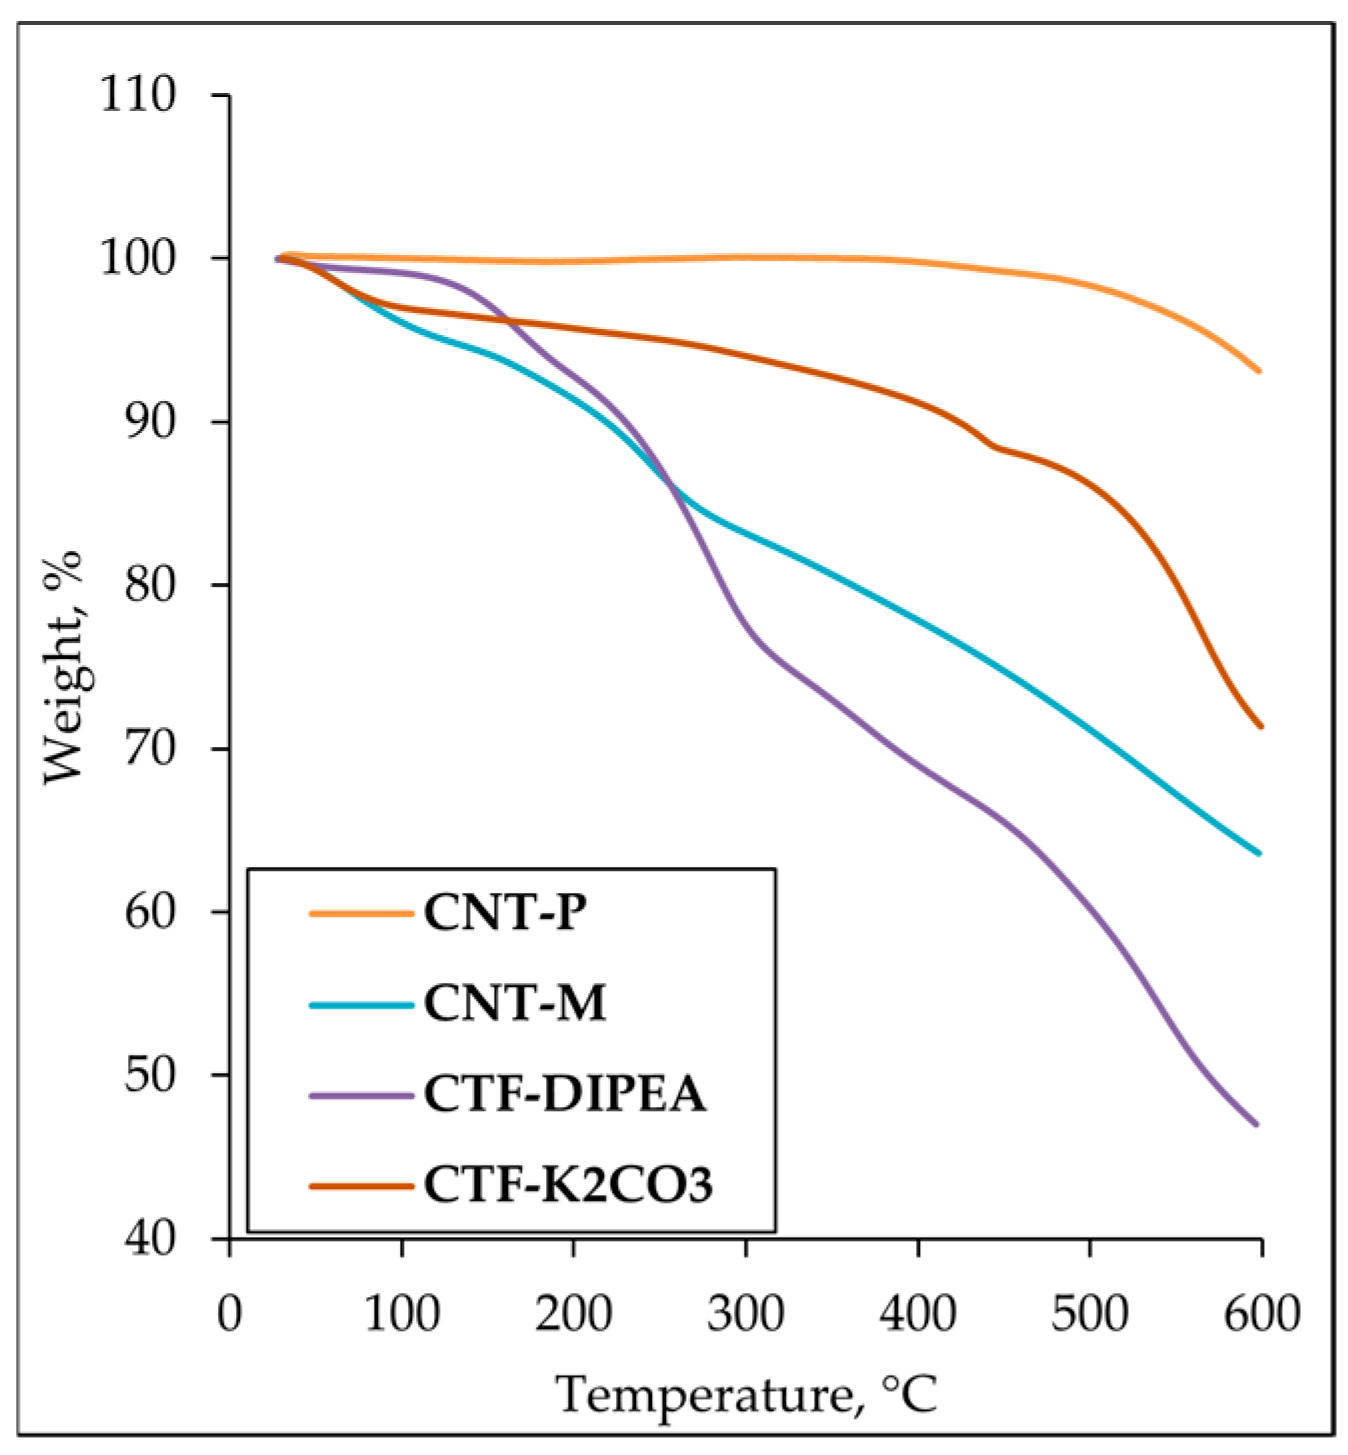
Thermogravimetric analysis revealed distinct thermal stability profiles between the materials (Figure 6). CNT-P exhibited the highest stability, retaining a residual mass of 93 wt.% at 600 °C. Chemical modification of CNTs resulted in decreased thermal stability, with a final mass of 64 wt.% at the same temperature. CTF-DIPEA underwent negligible mass loss up to 150 °C and rapid decomposition, resulting in the lowest residual mass of 47 wt.% at 600 °C among the synthesized nanomaterials. In contrast, CTF-K2CO3 demonstrated superior thermal stability compared to CTF-DIPEA, retaining 71 wt.% at 600 °C.

3.1.3. BET Surface Area and Pore Structure Analysis

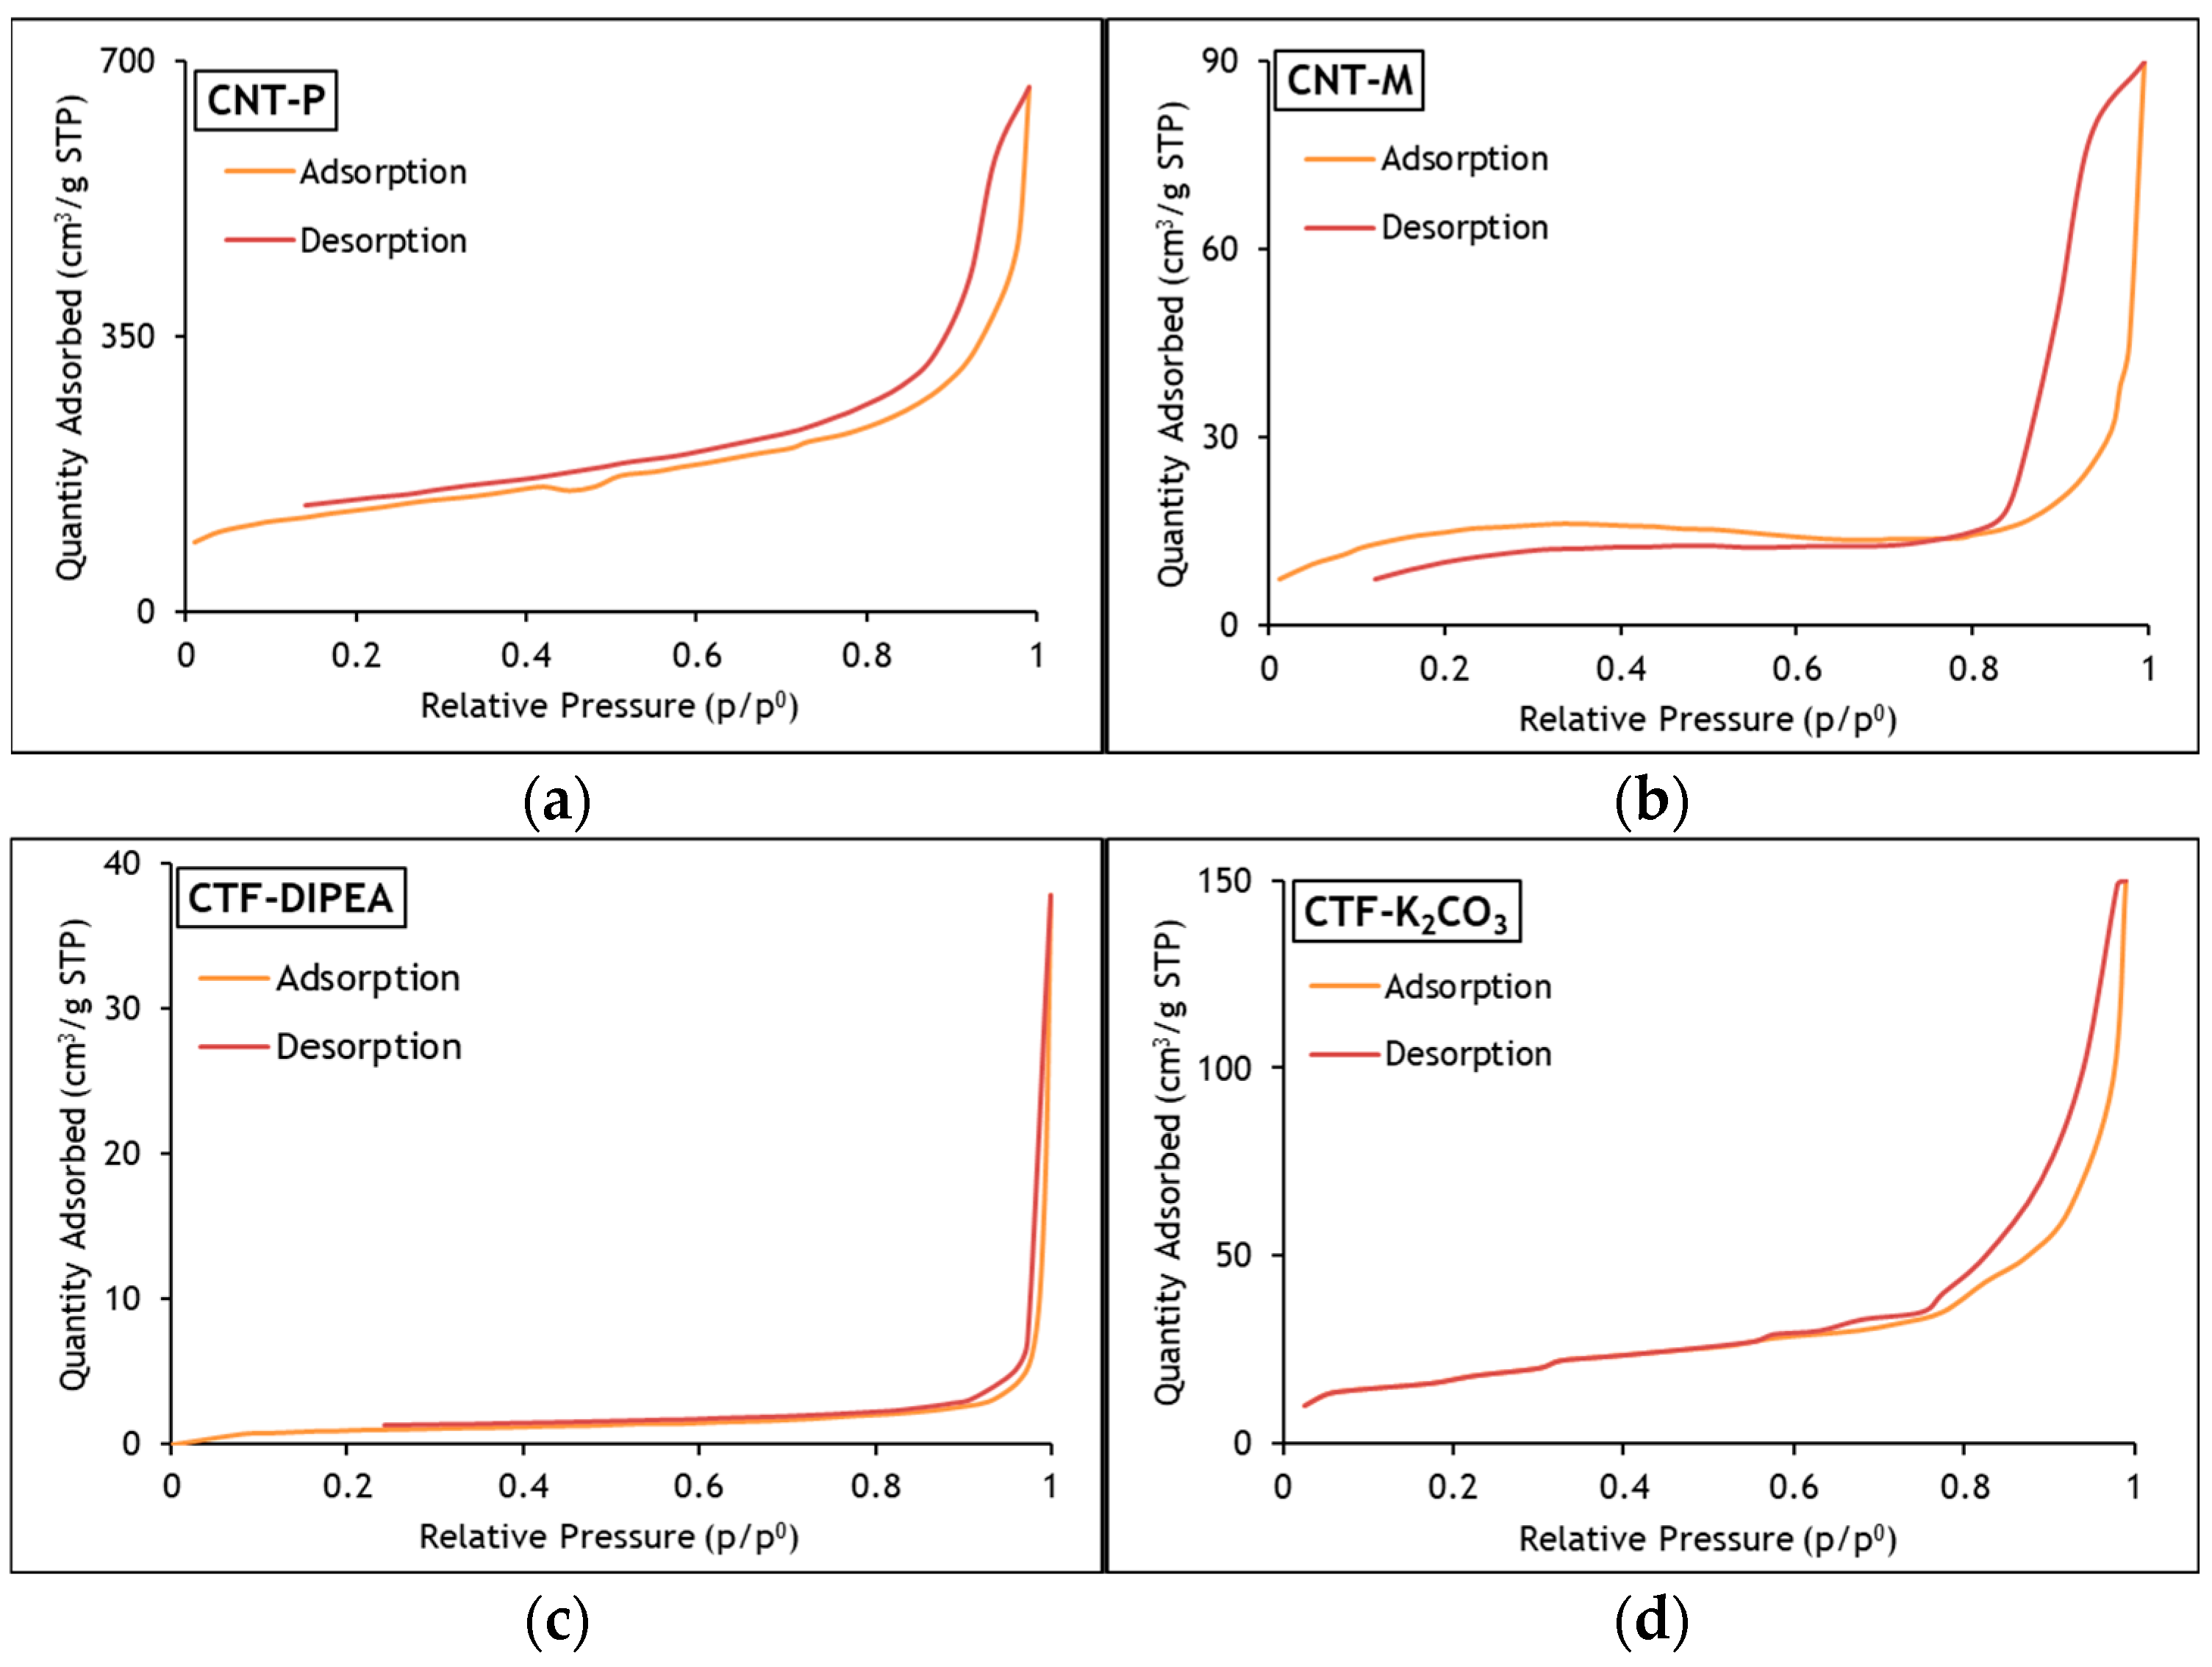
Nitrogen adsorption–desorption isotherms measured at 77 K indicate that all studied nanomaterials exhibit type IV isotherms, which is characteristic of mesoporous materials (Figure 7). CNT-P display a type IV isotherm with an H4-type hysteresis loop (Figure 7a), typically associated with slit-like pores originating from aggregates or structural defects. Among the investigated materials, CNT-P possess the highest specific surface area (460.6 m2/g) and total pore volume (1.03 cm3/g), confirming their well-developed porous network. CNT-M, which have the second-highest BET surface area (64.6 m2/g) and total pore volume (0.25 cm3/g), exhibit an H1-type hysteresis loop (Figure 7b). This loop shape is indicative of cylindrical mesopores and suggests that the acid treatment of CNTs induced oxidation of the carbon nanotube framework, leading to more open-ended CNTs. CTF-DIPEA reveals a type IV isotherm with a mixed H1/H2 hysteresis loop (Figure 7c). The BET surface area (3.4 m2/g) and total pore volume (0.02 cm3/g) are the lowest among the samples, implying a significantly reduced overall porosity. Nevertheless, the mixed hysteresis loop suggests the coexistence of both uniform mesopores and more complex pore structures, pointing to a relatively homogeneous but less developed porous system. Finally, CTF-K2CO3 presents intermediate values of BET surface area (55.3 m2/g) and total pore volume (0.21 cm3/g) and features an H1-type hysteresis loop (Figure 7d), indicating the presence of relatively uniform mesopores characteristic of partially ordered porous structures. The values of BET surface area and total pore volume of the synthesized nanomaterials are shown in Table 1.
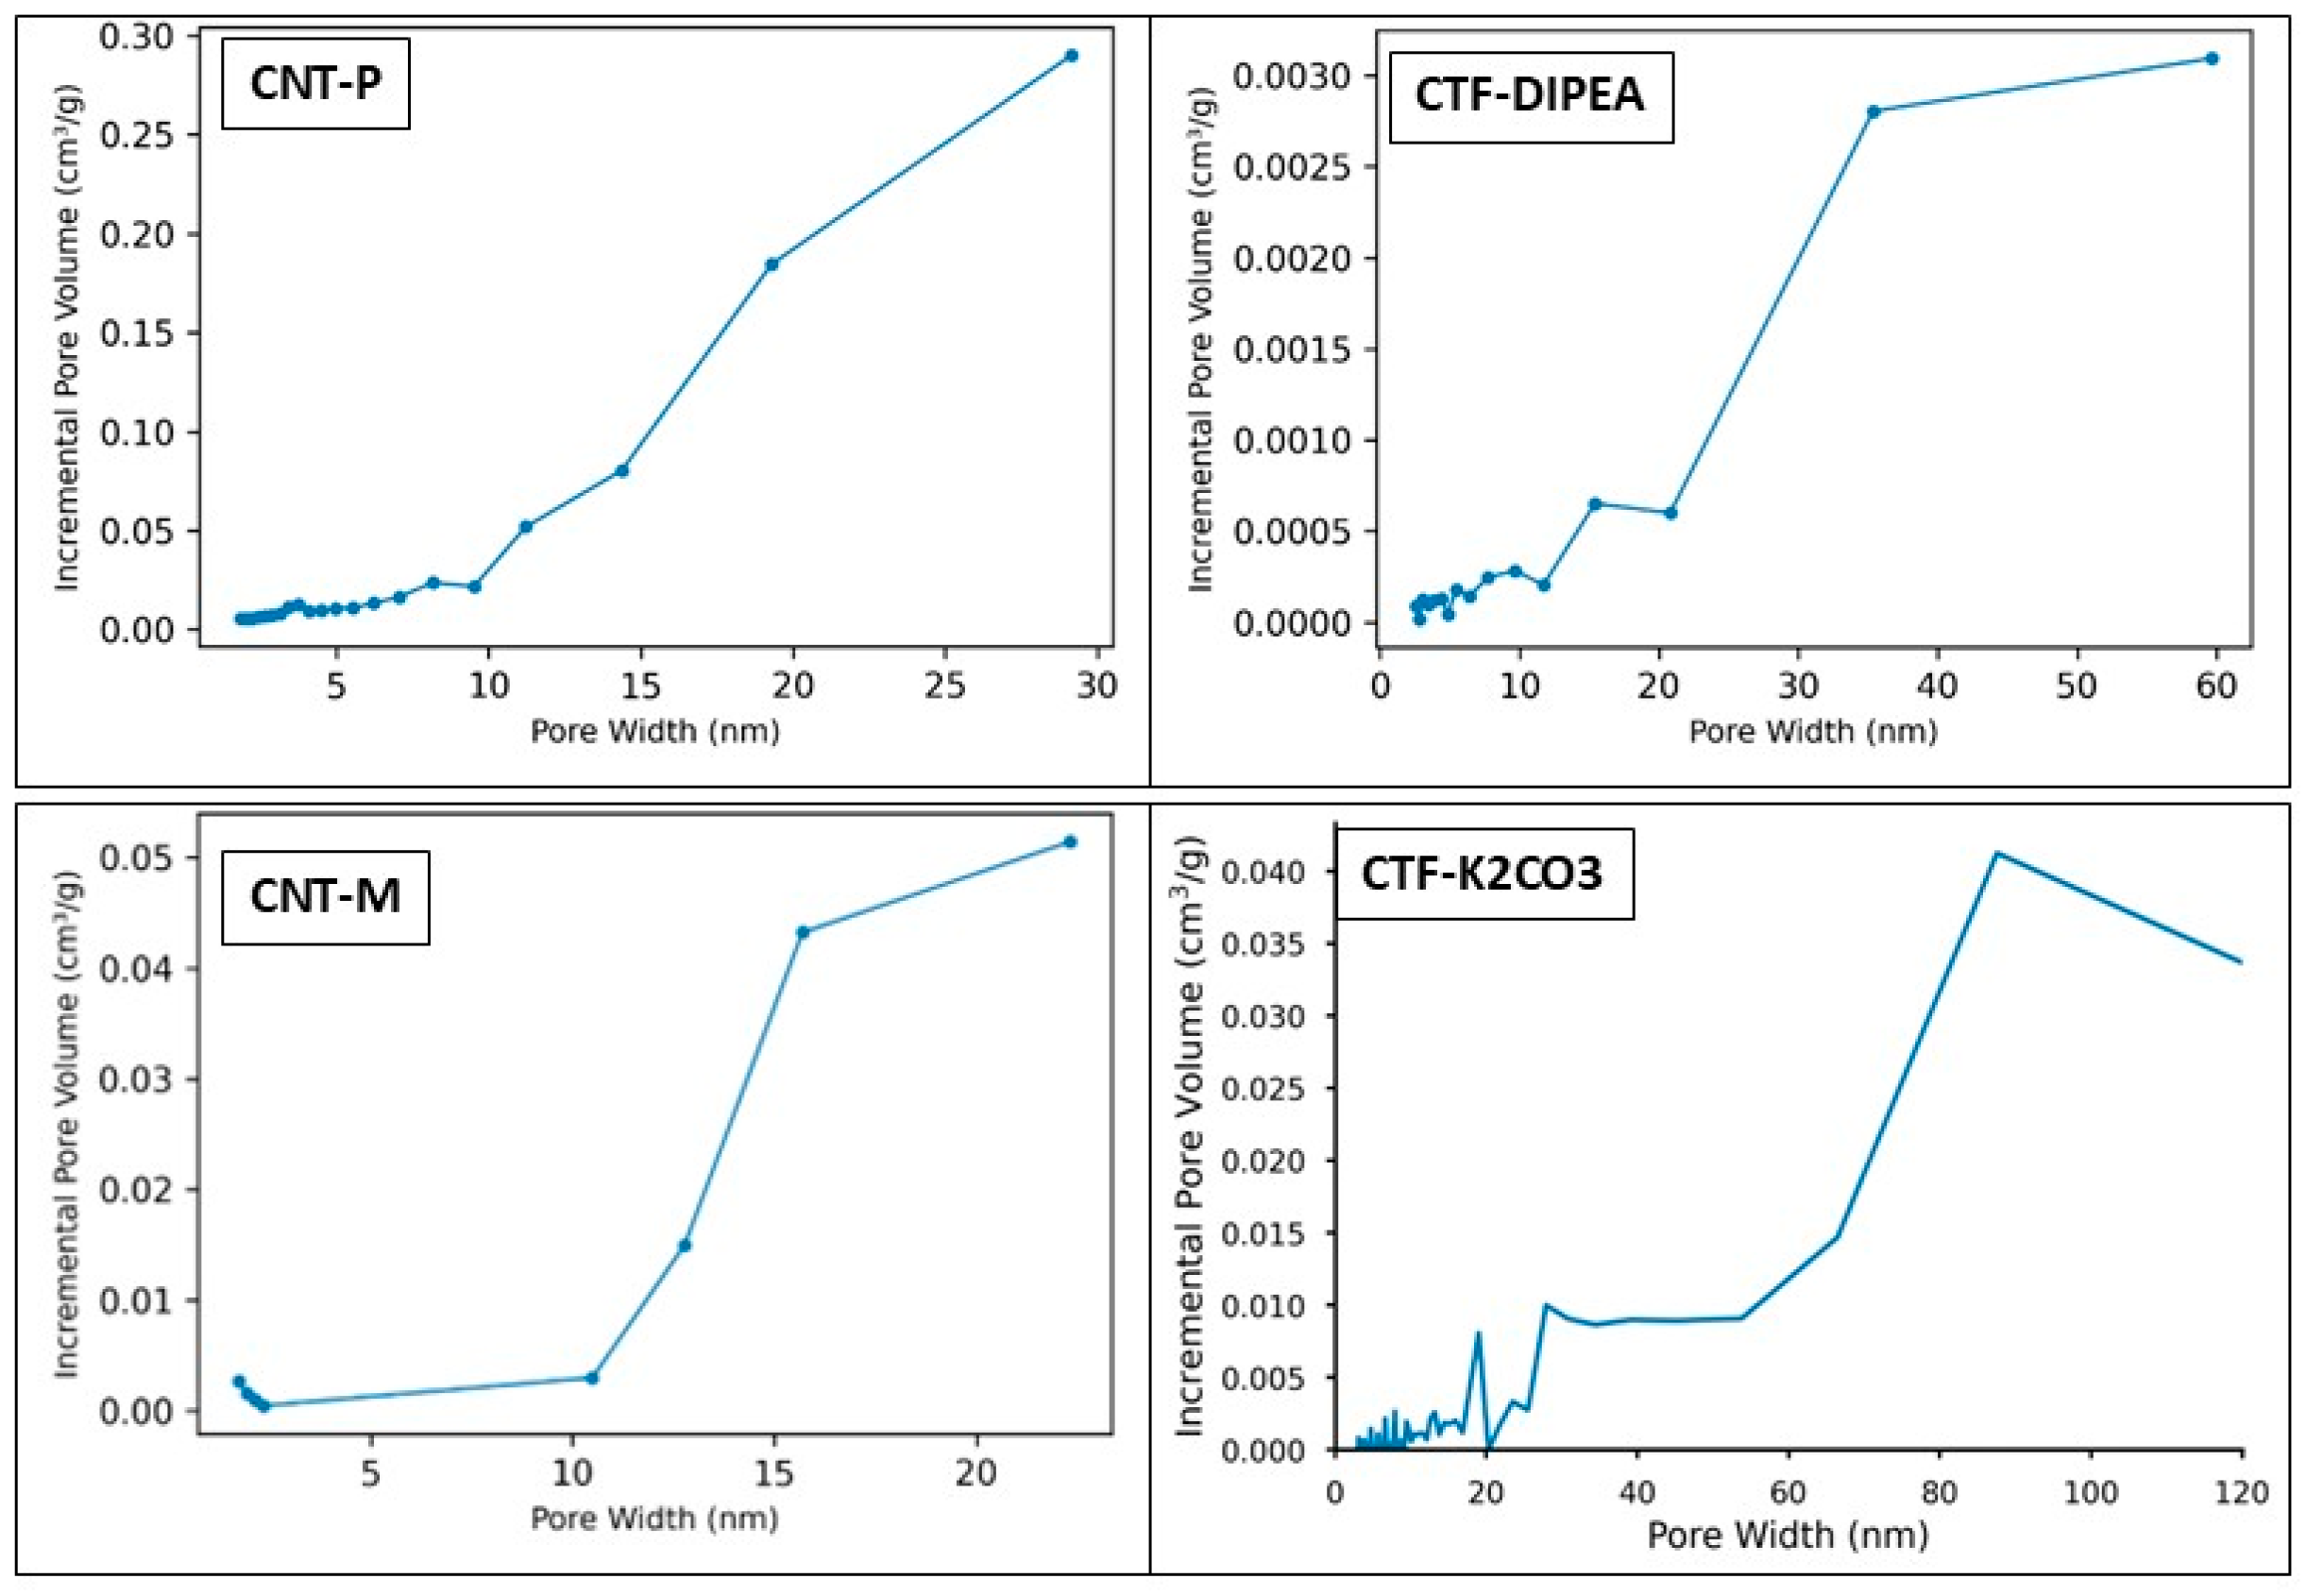
Mesopore size distributions were evaluated via the BJH method (desorption branch), while micropore presence was assessed using the low-pressure region of the N2 isotherm and t-plot outputs where available. Notably, CNT-P show measurable microporosity, with a t-plot micropore volume of 0.0575 cm3/g, whereas acid-modified CNT-M exhibit a much lower micropore volume (~0.00068 cm3/g), consistent with oxidation-induced loss or blockage of micropores. The CTF samples show negligible accessible microporosity: CTF-K2CO3 is predominantly mesoporous (modal pore width ~22 nm) and CTF-DIPEA exhibits very low overall CO2 uptake, suggesting either limited accessible porosity or pore blocking/collapse.

3.1.4. X-Ray Diffraction

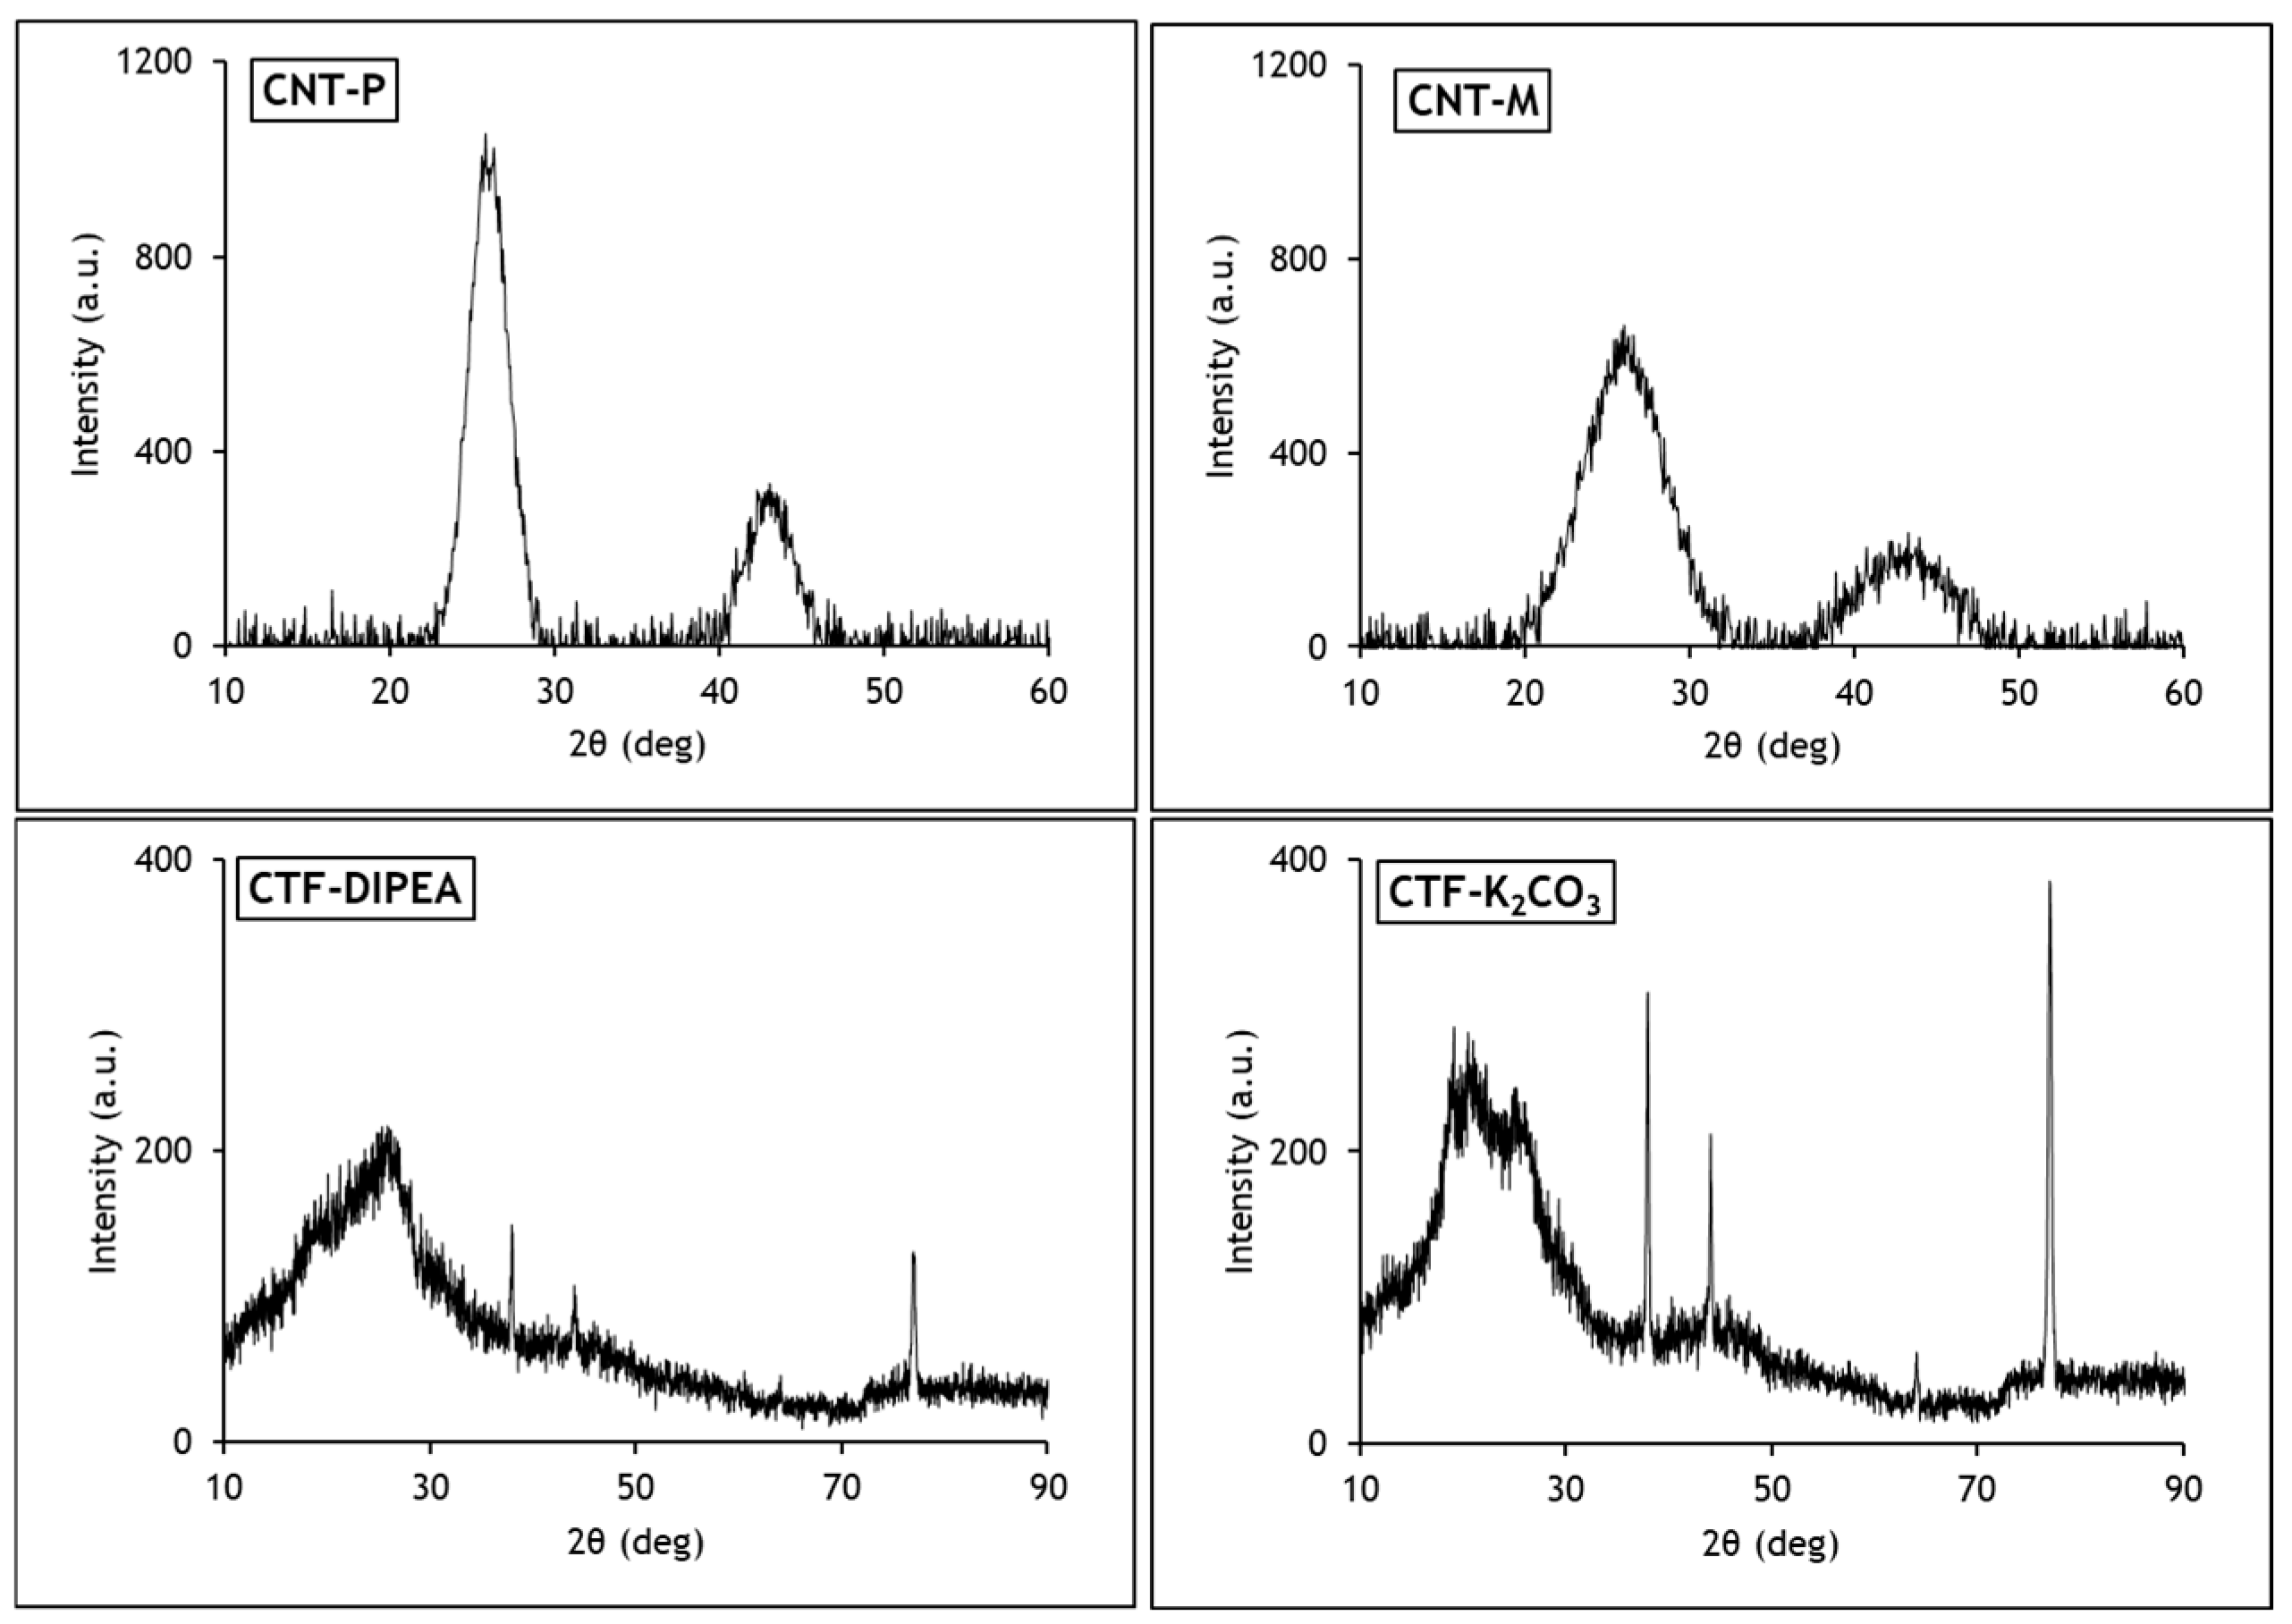
Figure 8 demonstrates XRD patterns of CNT-P and CNT-M. CNT-P exhibit a sharp and intense diffraction peak at 2θ = 25.6°, which corresponds to the (002) reflection of graphitic carbon. The less intense peak observed at 2θ = 42.7° is associated with the (100)/(101) planes of the hexagonal carbon structure. In contrast, CNT-M display a broadening and decrease in intensity of the (002) peak, indicating a partial loss of crystallinity as a result of the oxidation process, which results in more structural defects. The disturbance of the graphitic lattice is confirmed by the peak at ~43°, which becomes broader and less intensive. XRD of CTF-DIPEA and CTF-K2CO3 indicated the amorphous domain, which is associated with structural defects and discontinuities within the layers. Partial crystallinity was observed at 2θ = 38°, 44° and 77° for both CTF-DIPEA and CTF-K2CO3, but CTF-K2CO3 demonstrated a higher crystallinity.

3.1.5. XPS Analysis

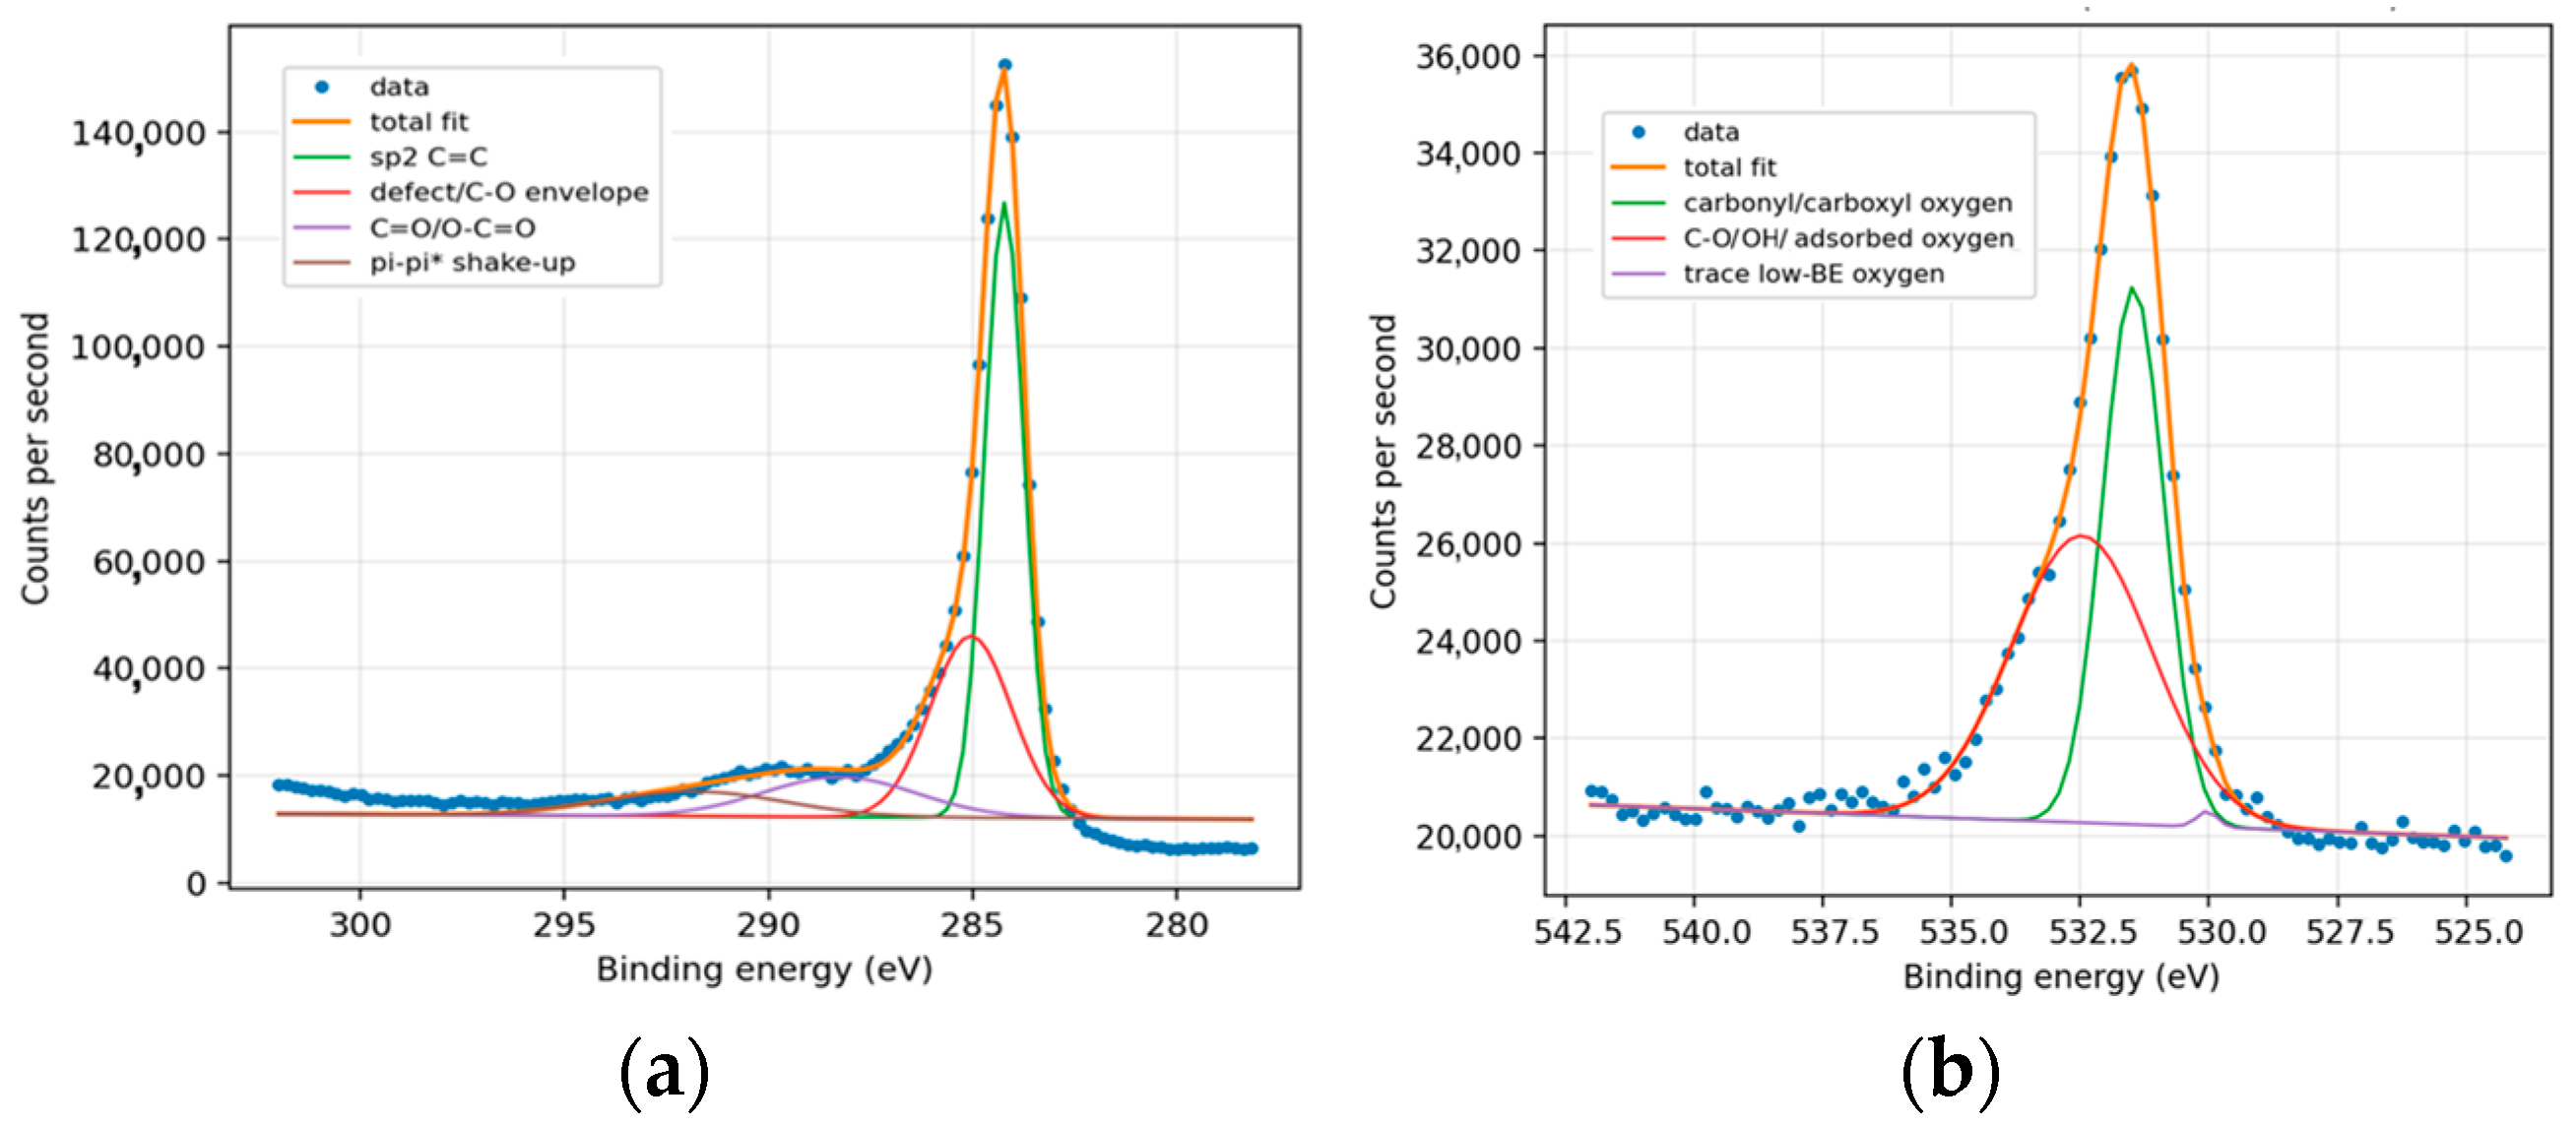
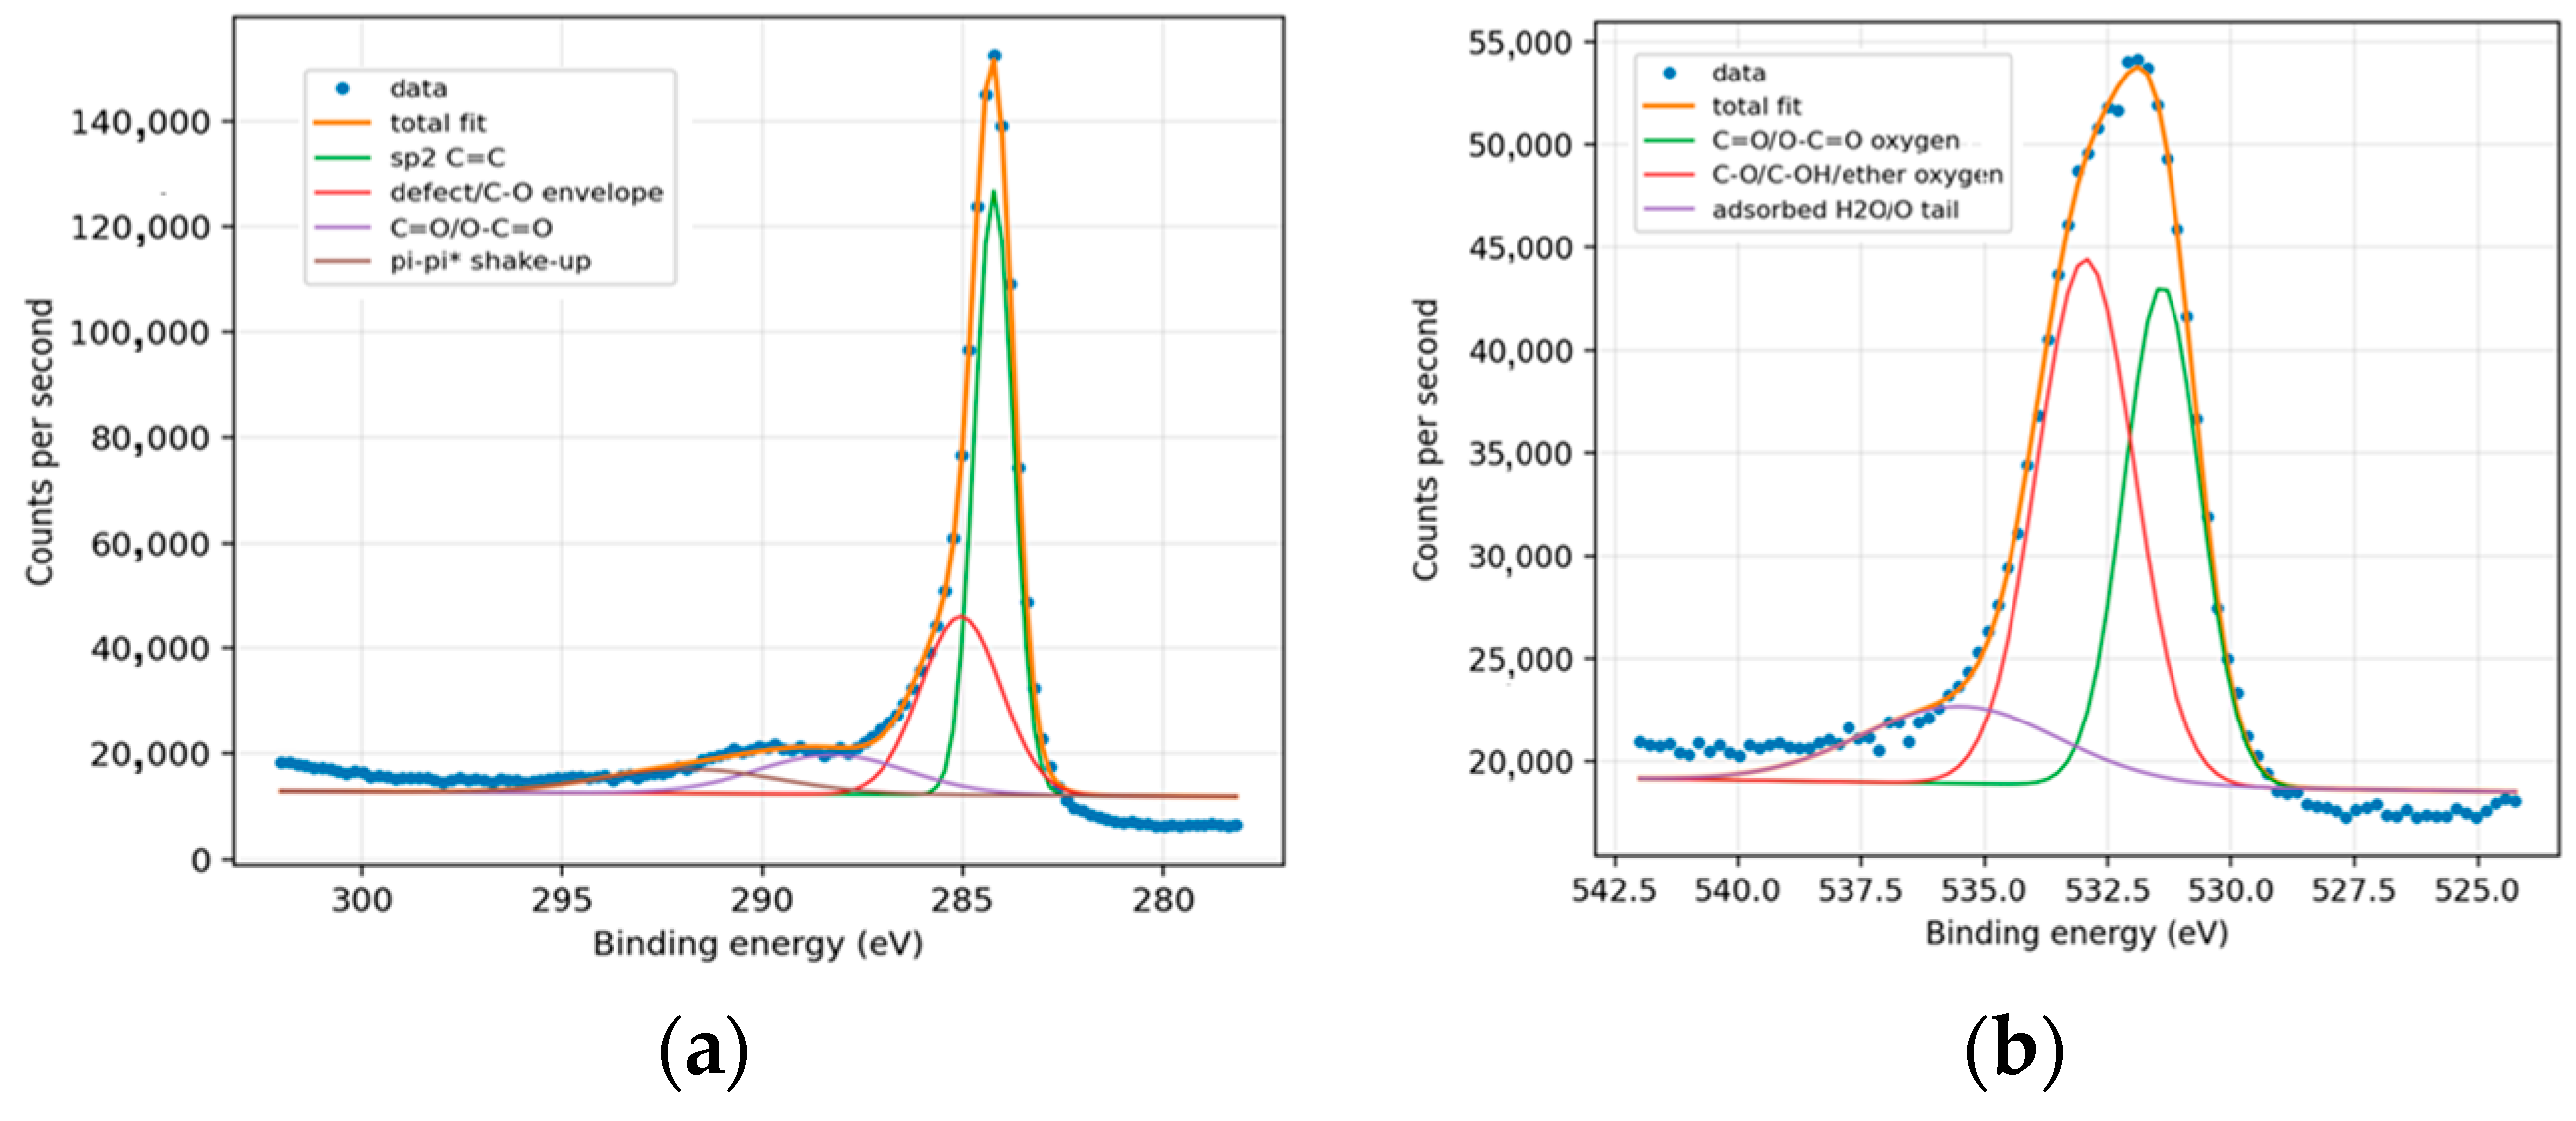
A consistent fitting strategy was applied to both CNT-P and CNT-M. The C 1s region was deconvoluted into graphitic sp2 carbon, a defect/sp3/C–O component, a carbonyl/carboxyl component, and a π–π* stacking. The O 1s region comprised carbonyl/carboxyl oxygen, C–O/C–OH species, and a minor high-binding-energy component. Binding energies (BEs) were charge-corrected by referencing graphitic C 1s to 284.8 eV. Surface atomic percentages were derived from fitted peak areas using relative sensitivity factors (RSFs)—C 1s = 1.00, O 1s = 2.93—and normalized to (C + O). The degree of oxidation was calculated as DOx = 100 × (O/C)XPS.
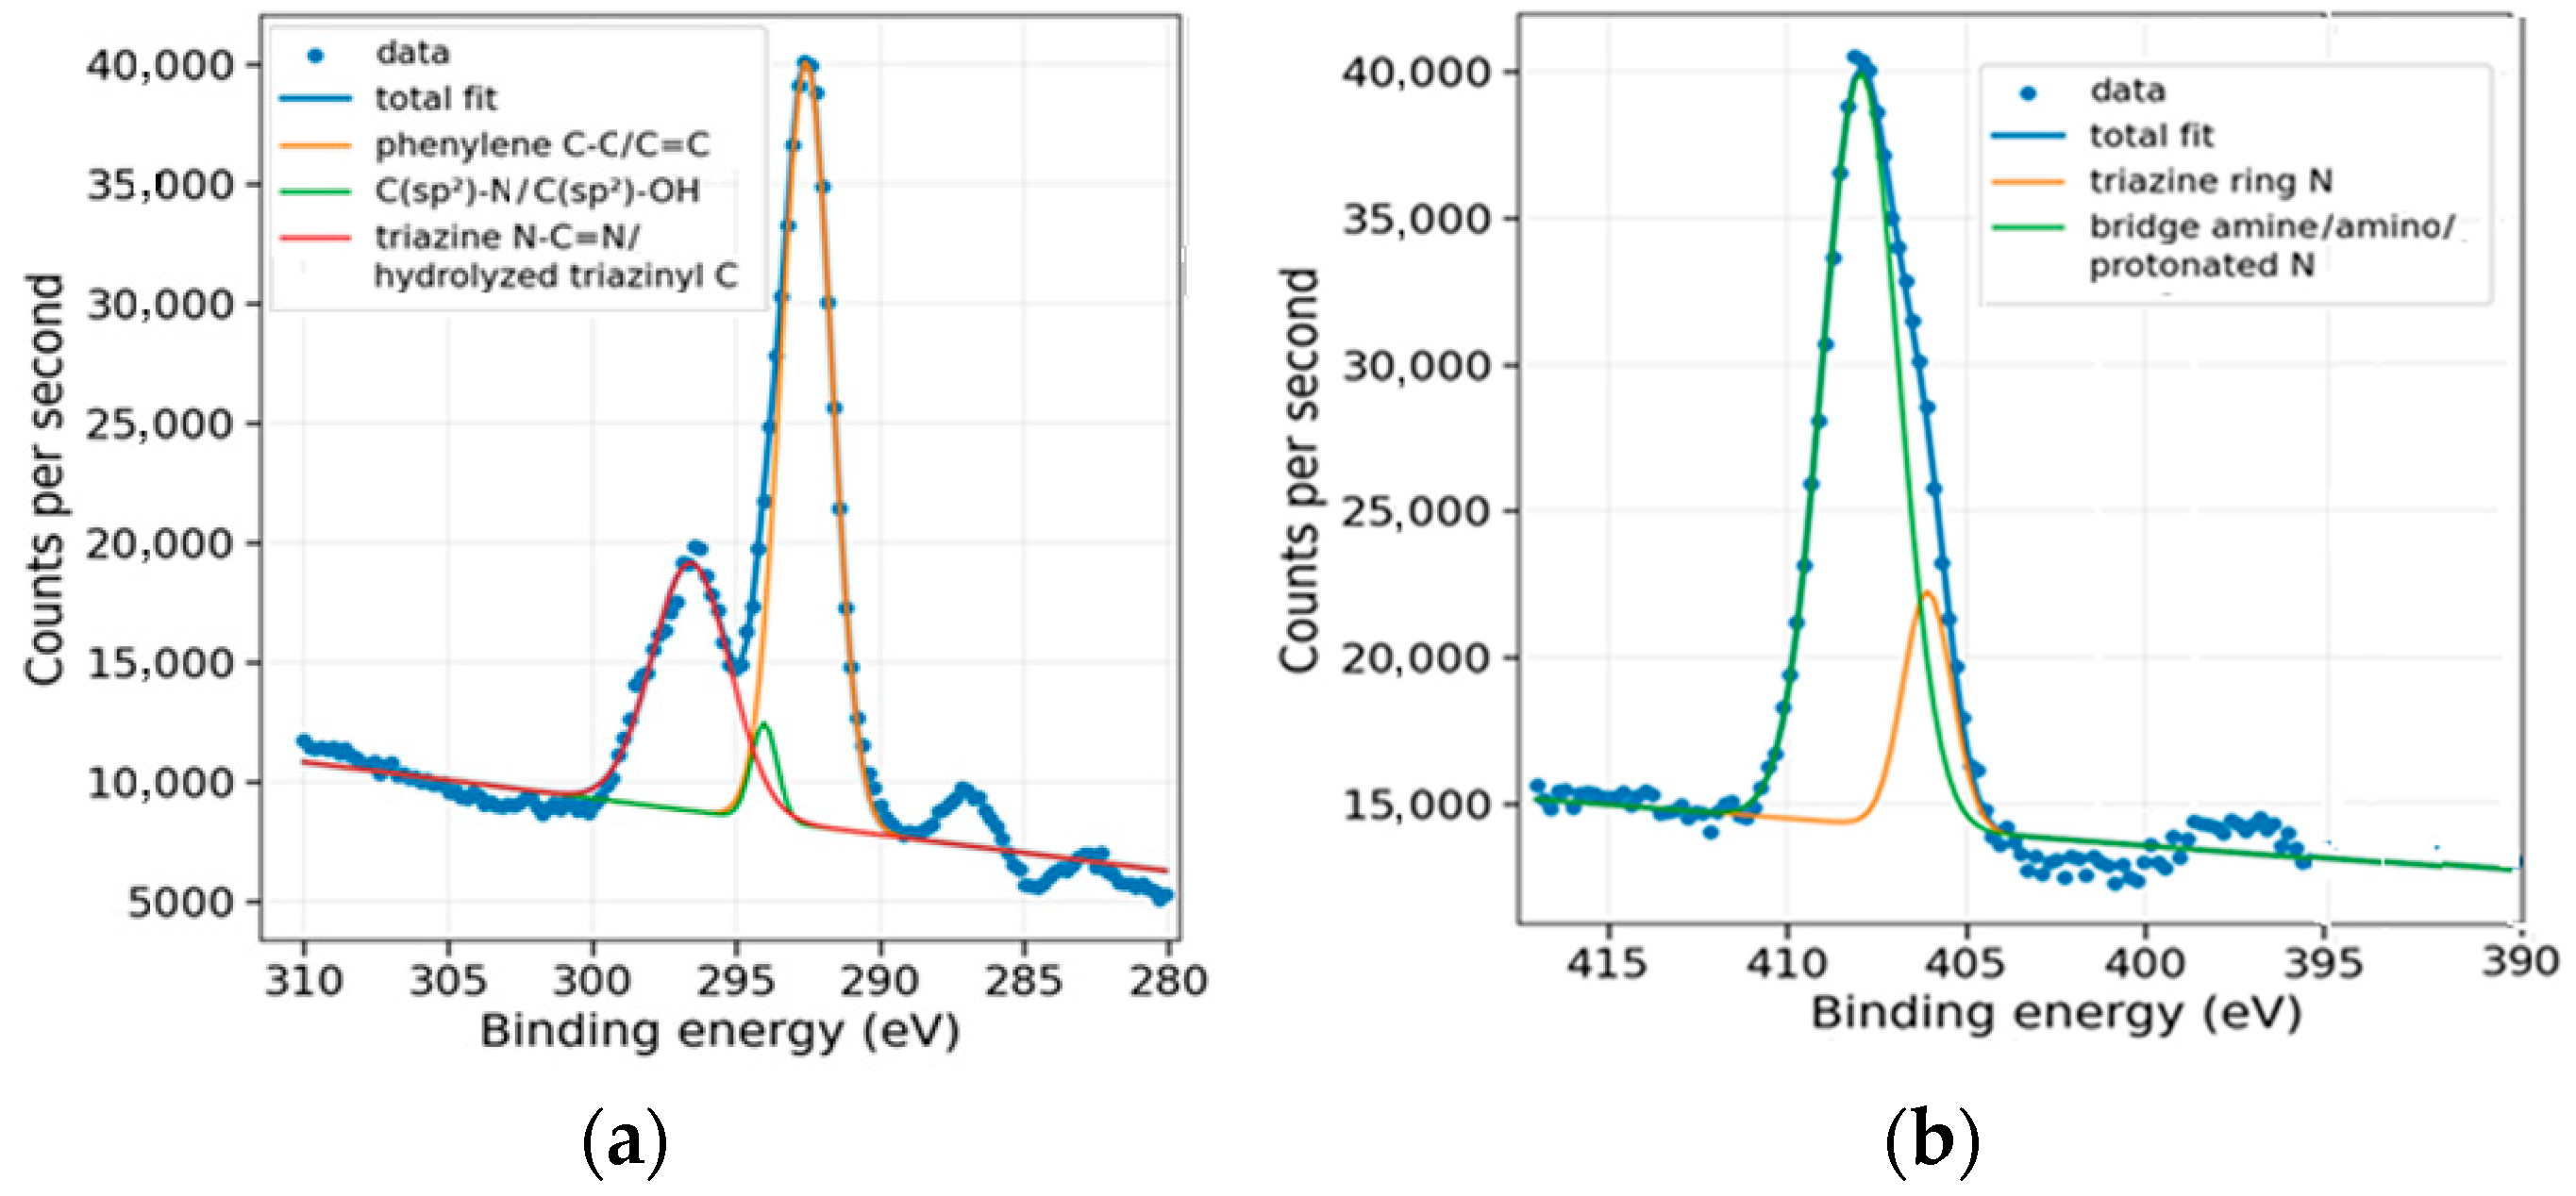
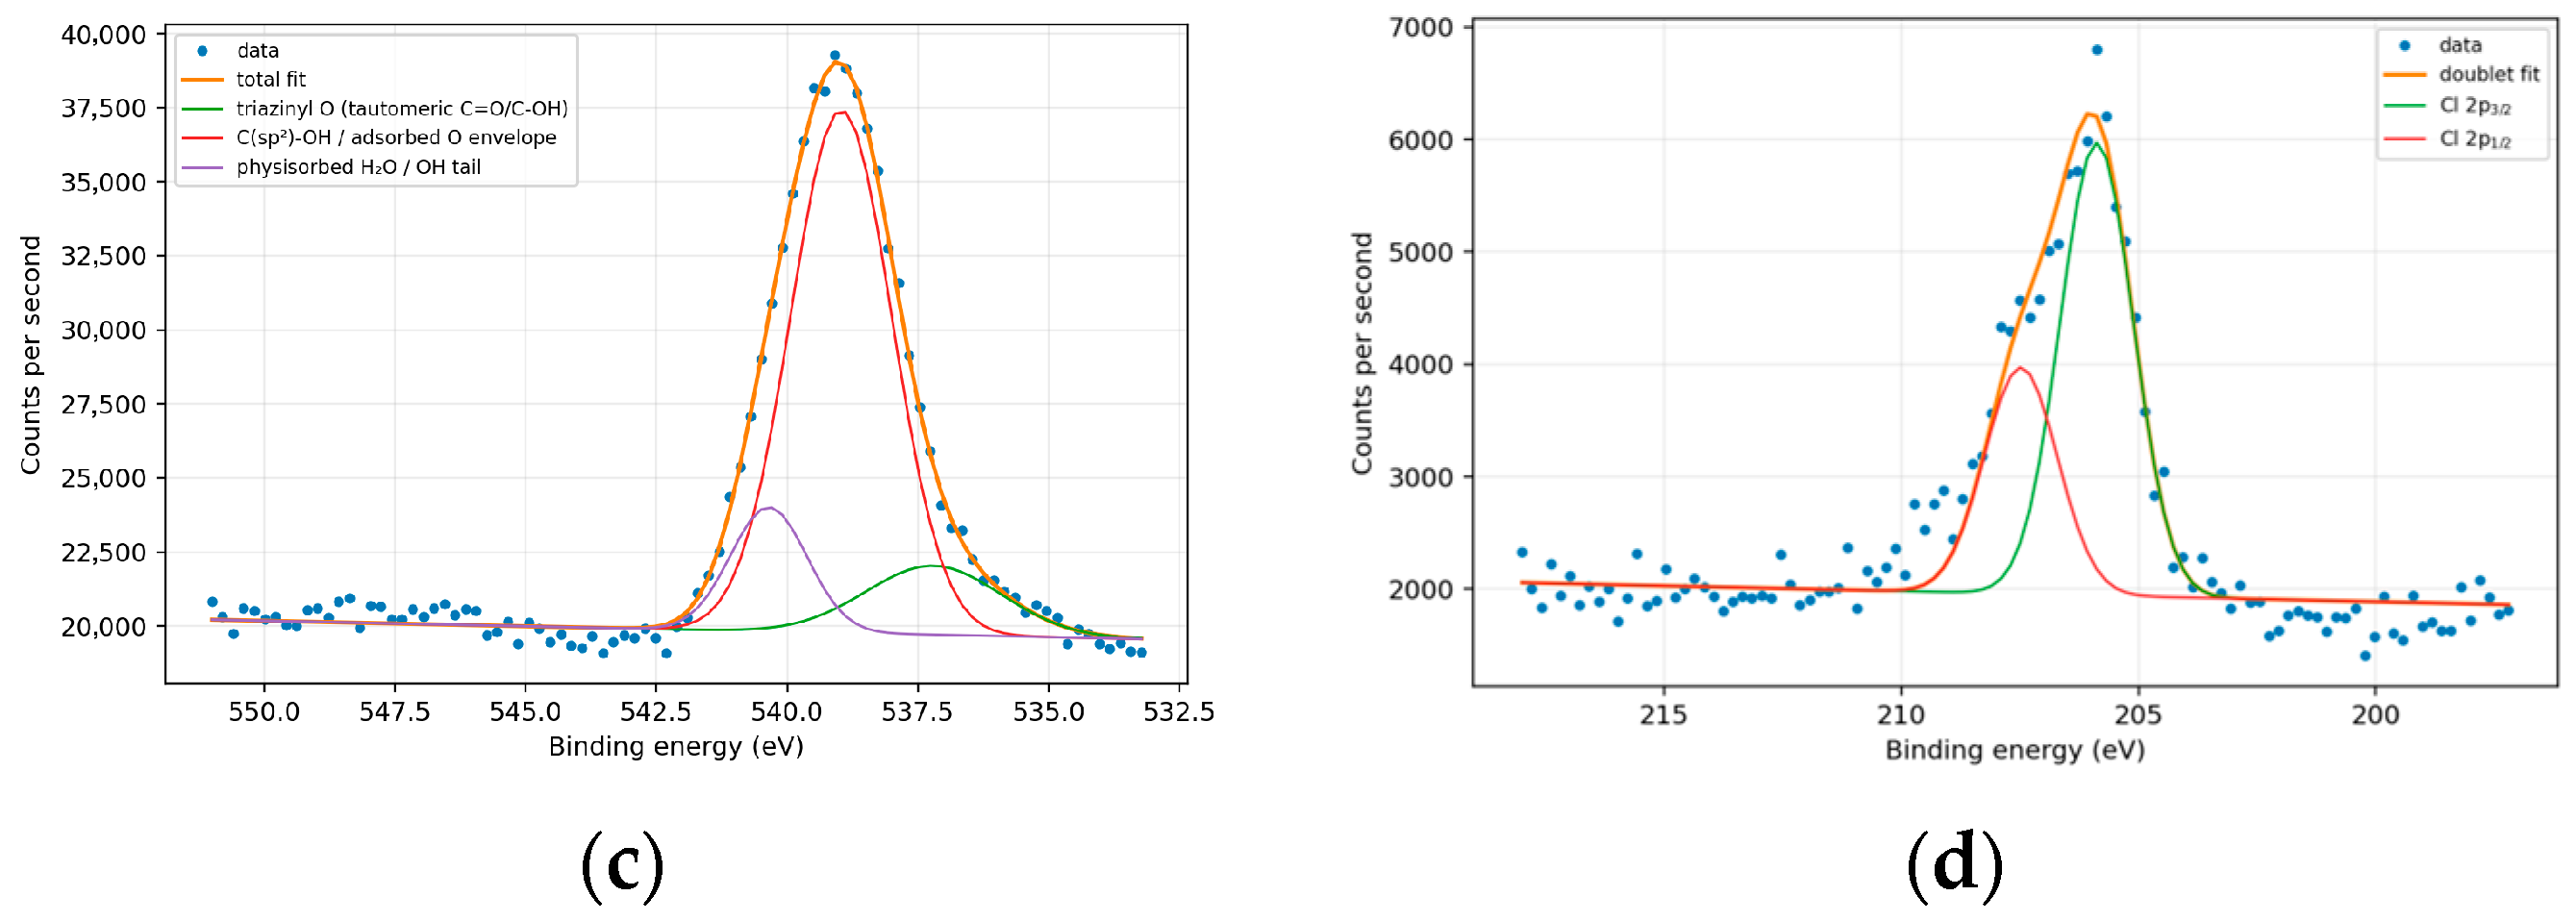
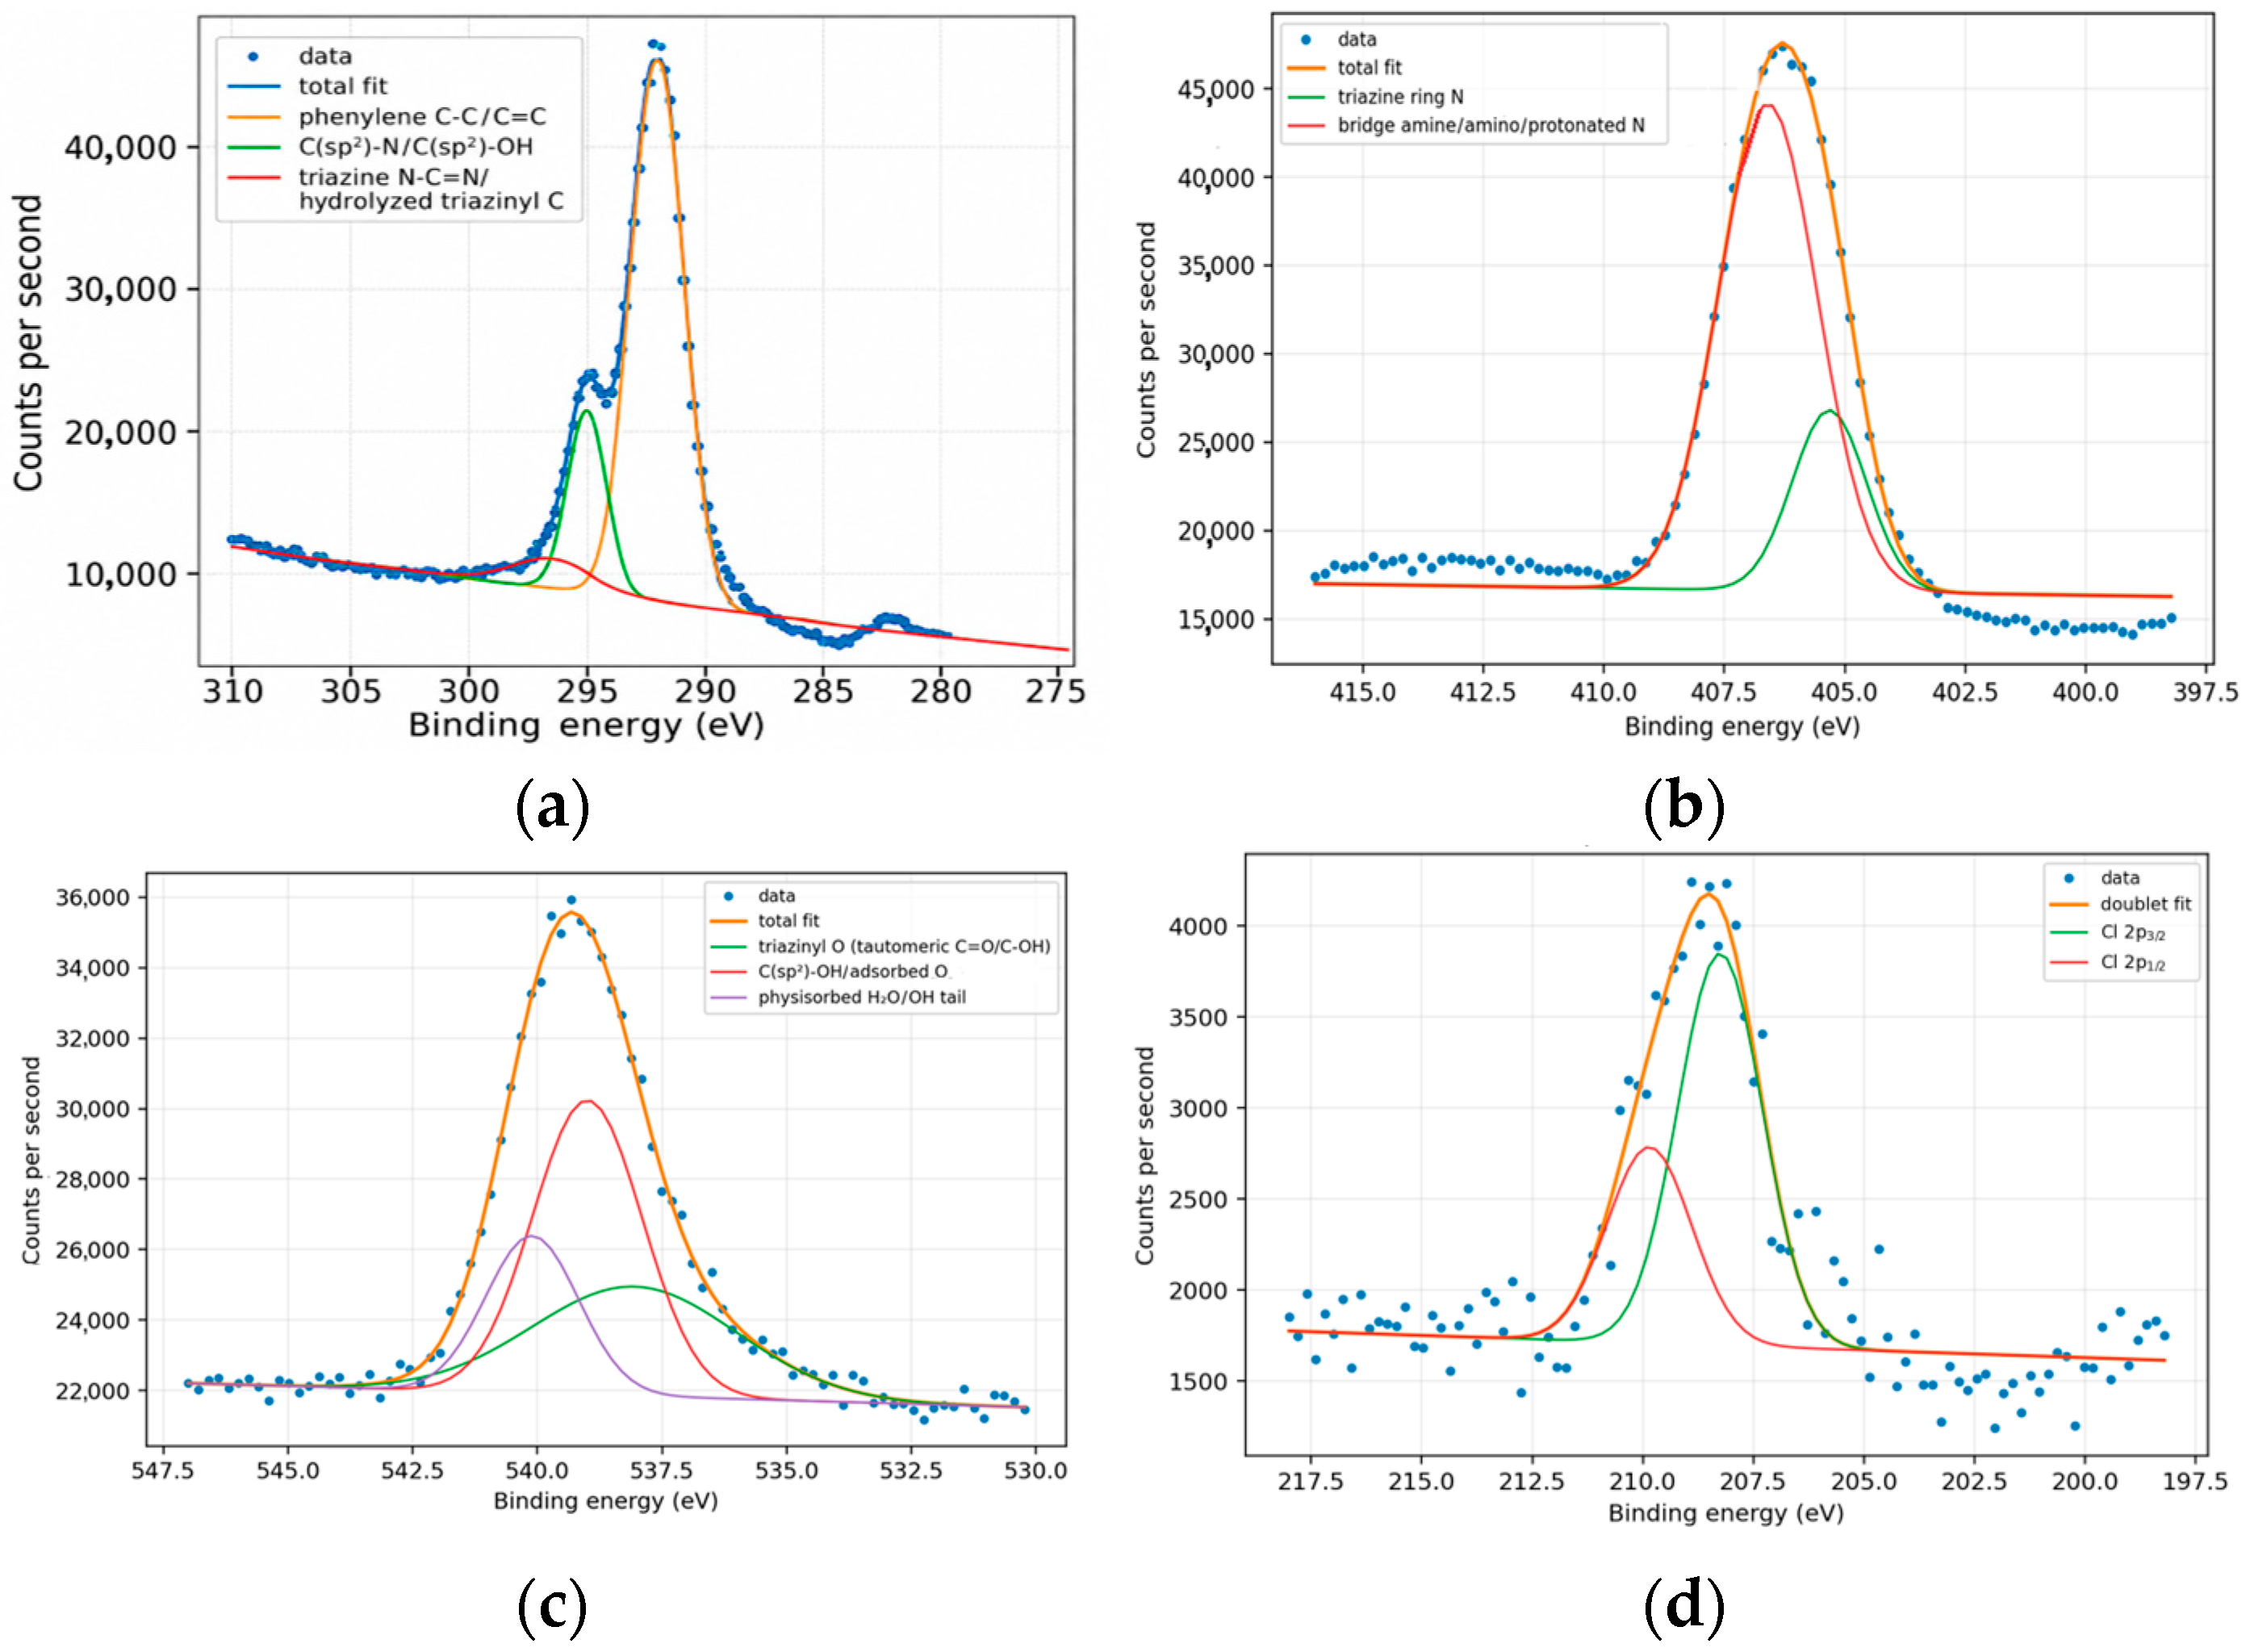
For the CTFs the aromatic C 1s peak (284.8 eV) was used for charge correction. C 1s was fitted with phenylene C–C/C=C, a mixed C(sp2)–N/C(sp2)–OH component, and higher BE triazine-related carbon. N 1s included triazine nitrogen and a broader amine/protonated-N envelope. O 1s comprised triazinyl-O, C(sp2)–OH/adsorbed oxygen, and physisorbed H2O/OH species, while Cl 2p was fitted as a spin–orbit doublet. Surface atomic percentages were calculated using RSFs (C 1s = 1.00, N 1s = 1.80, O 1s = 2.93, Cl 2p = 2.285). Because O 1s includes both framework and adsorbed species, the degree of polymerization is reported as an apparent surface value, estimated from residual Cl content and corrected by excluding both C–Cl and hydrolyzed triazinyl-O contributions.
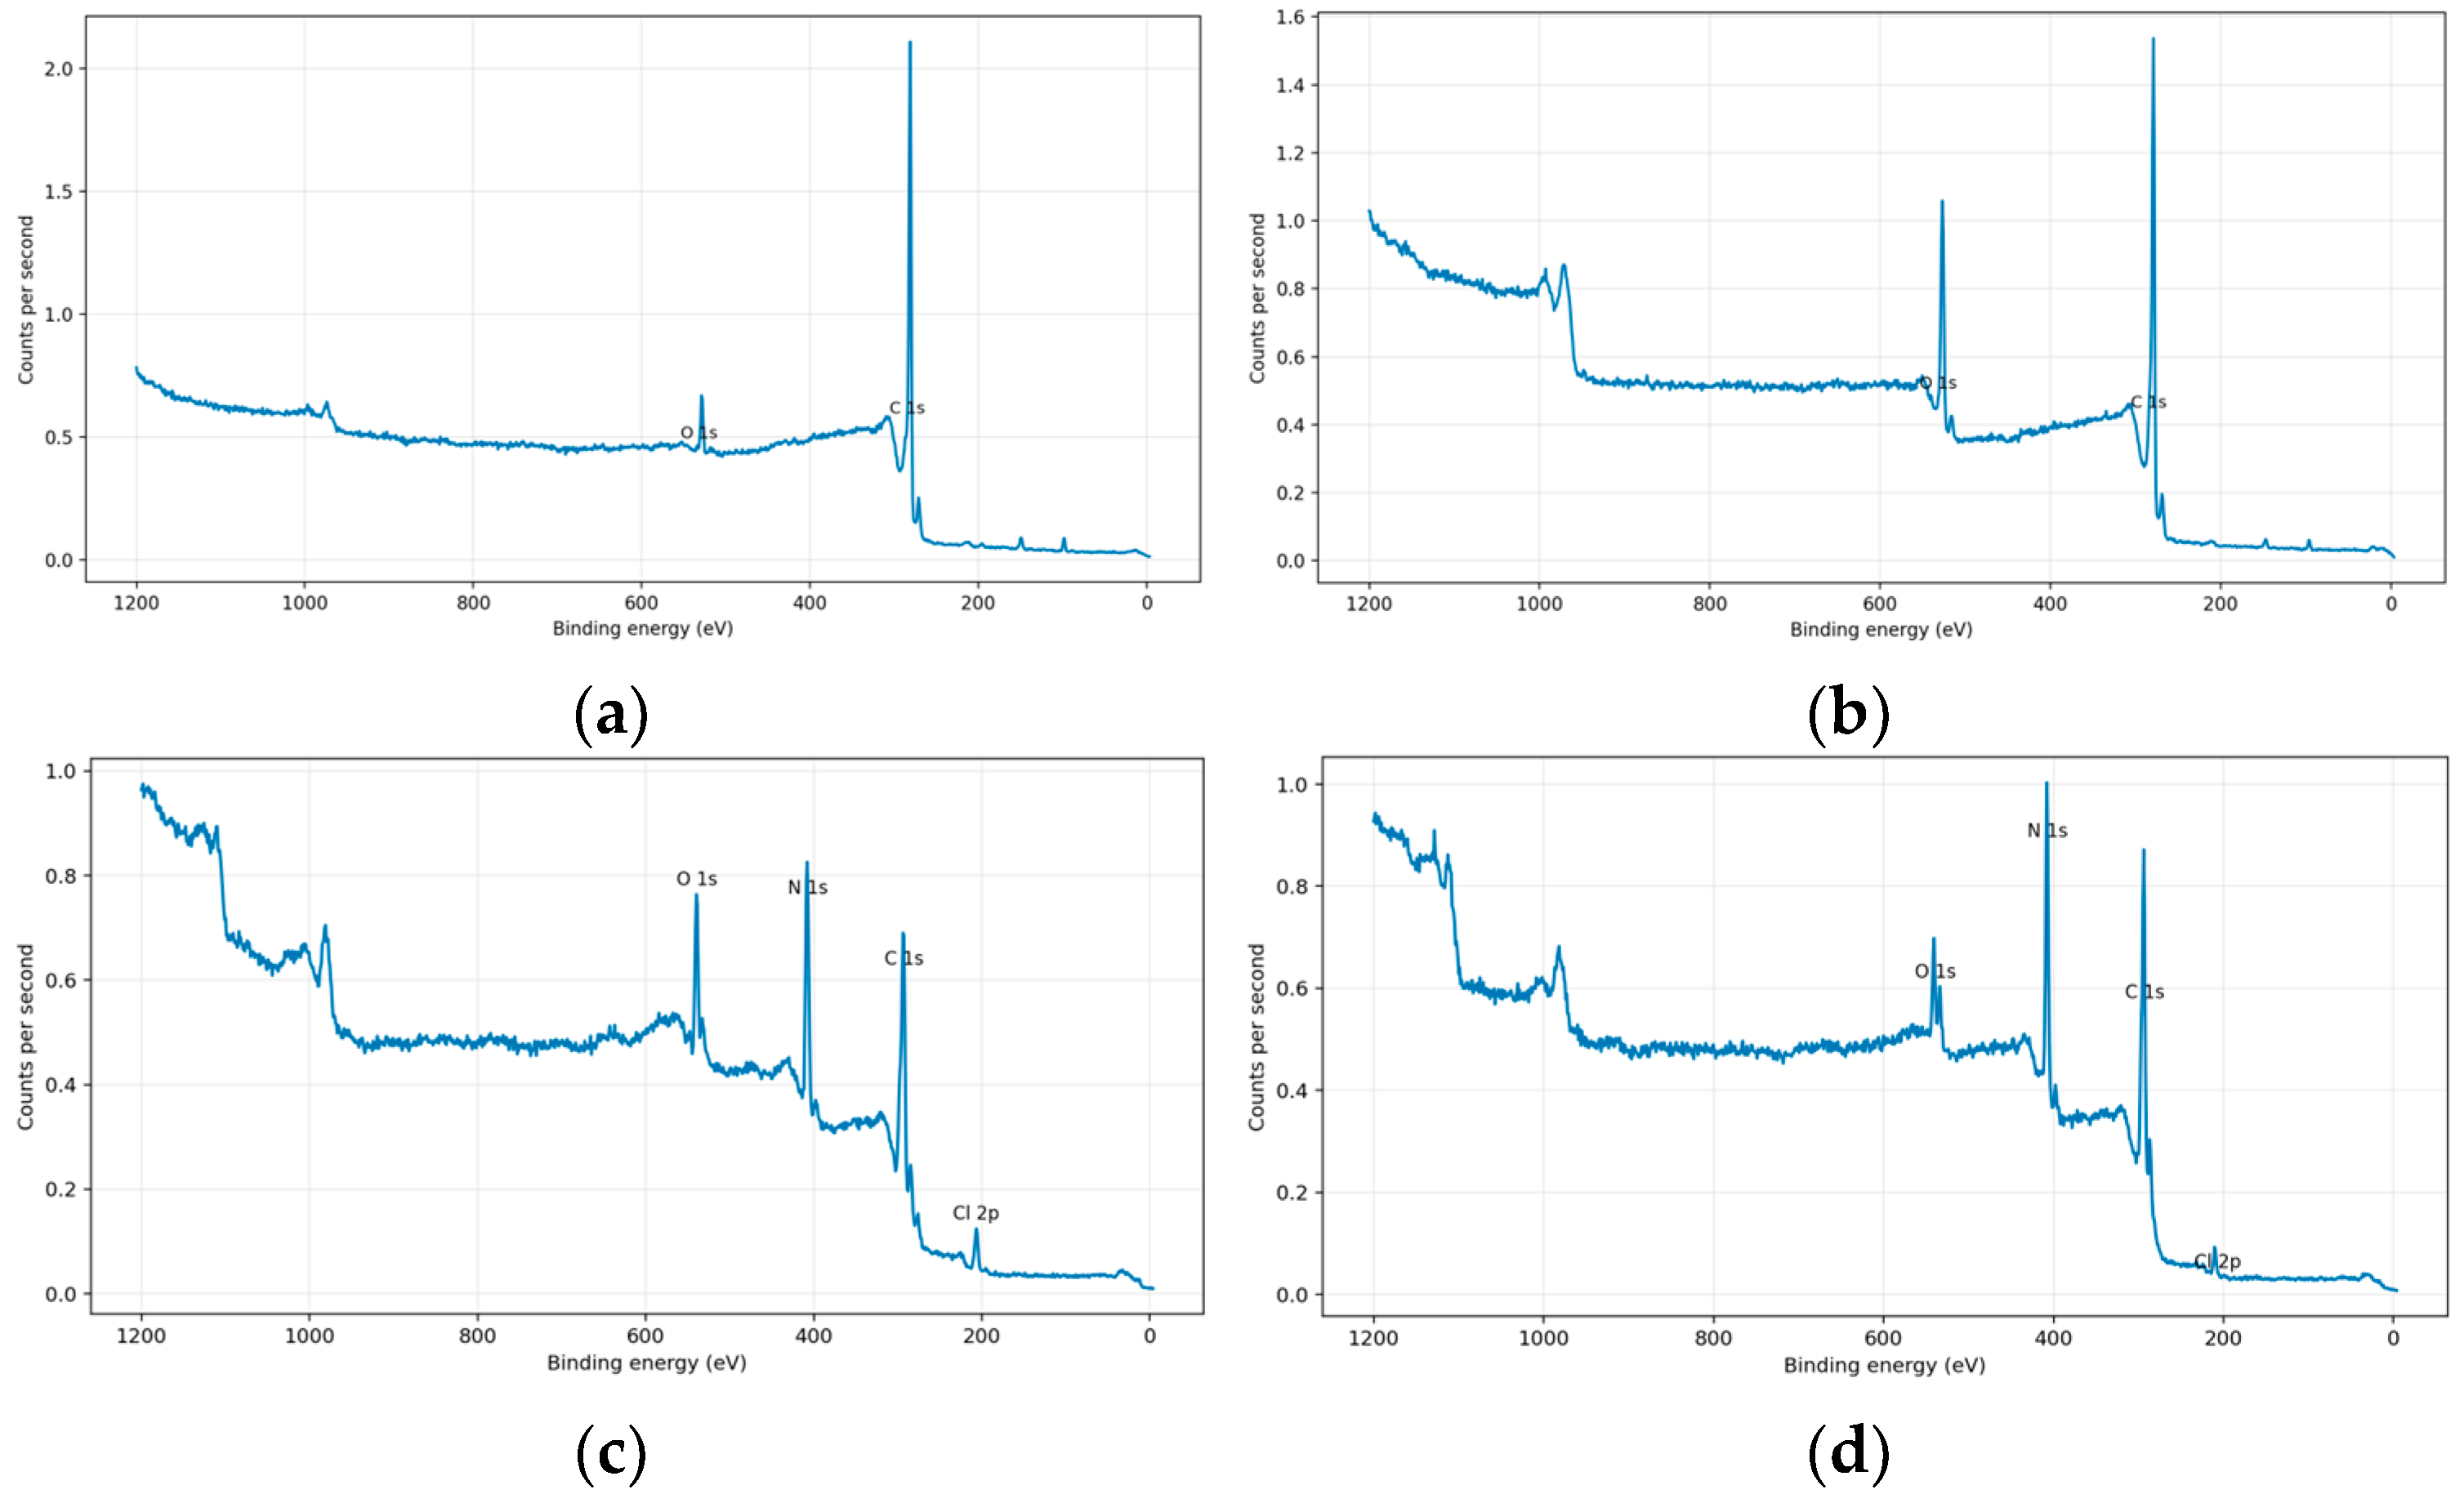
The CNT-P surface remains predominantly graphitic (Figure 9a and Figure A3). The C 1s fit is dominated by sp2 carbon, while O 1s shows only a small amount of oxygen functionality. The oxygen signal is attributed to pre-existing edge or oxygen defects rather than extensive oxidation. Modified CNTs (CNT-M) clearly increase the abundance of oxygen-bearing surface groups (Figure 9b and Figure A4). The oxidized sample shows strong growth in the number of C–O/C–OH groups and the carbonyl/carboxyl contribution in C 1s and O 1s, along with a relative decrease in the graphitic contribution. The oxidation metrics derived from the fitted total C 1s and O 1s signals are as follows: CNT-P exhibit C = 95.74 at.% and O = 4.26 at.% (DOx = 4.45%), whereas CNT-M show C = 82.09 at.% and O = 17.91 at.% (DOx = 21.82%).
CTF-DIPEA shows a nitrogen-rich triazine/arylamine framework together with a measurable residual chlorine signal and a stronger signal of two types of oxygen (Figure 9c and Figure A5). Because this sample was prepared with an excess of cyanuric chloride, the broad high-energy N 1s fit consists of terminal amino groups. The dominant fit with higher energy is assigned to bridge-amine/amino/protonated nitrogen atoms. The O 1s/C 1s pair also supports the presence of hydrolyzed triazine-derived C(sp2)-OH or tautomeric triazinone-like motifs. CTF-K2CO3 remains clearly triazine-based but shows lower surface content of Cl and O than CTF-DIPEA. CTF-K2CO3 shows the higher polymerization degree, consistent with higher substitution and lower residual chlorinated/hydrolyzed species at the surface (Figure 9d and Figure A6). The hydrolysis-corrected polymerization values reported here represent surface-sensitive lower-bound estimates rather than absolute bulk degrees of polymerization. CTF-DIPEA exhibits a substitution conversion of 87.99% and a hydrolysis-corrected apparent surface polymerization of 47.85%, while CTF-K2CO3 shows a substitution conversion of 91.22% and a corresponding value of 56.85%.

3.2. Analysis of CO2 Uptake Performance in Liquids

The measured CO2 uptake values for all liquid systems are summarized in Table 2. Initial experiments were conducted using DI water and 1 wt.% SDS aqueous solution. The CO2 uptake of DI water was determined to be 19 mmol/L. The presence of SDS led to an increase in CO2 solubility, which can be attributed to the availability of additional active sites within SDS micelles capable of interacting with CO2 molecules. As expected, the incorporation of surfactants significantly enhanced CO2 dissolution, resulting in a twofold increase in uptake (38 mmol/L) compared with pure water. Further improvement in CO2 capture was achieved by dispersing CNT-P in the water–surfactant mixture, indicating a synergistic effect between CNT-P and the micellar system. Subsequent modification of CNTs produced an additional increase in CO2 solubility. Among the tested additives, covalent triazine frameworks demonstrated the most pronounced enhancement, yielding a CO2 uptake approximately twice that of the water–surfactant solution. A comparison of the CO2 uptake performance of the obtained porous liquids with literature-reported systems is provided in Table A1.
Despite exhibiting the lowest BET surface area (3.4 m2/g) and total pore volume (0.02 cm3/g) among the tested materials, CTF-DIPEA showed the greatest CO2 uptake (82 mmol/L) when dispersed in SDS. This result suggests that chemisorption is the dominant mechanism governing the interaction between CO2 and CTF-DIPEA in the liquid phase. The enhanced CO2 uptake is the result of the presence of unreacted –NH– and –NH2 functional groups in CTF-DIPEA, arising from the non-stoichiometric conditions used during its synthesis. This assumption is supported by the FT-IR spectrum, which shows weak –C=N vibrational bands indicative of incomplete linkage formation. The resulting more open structure, compared with CTF-K2CO3, allows –NH and –NH2 groups to interact more effectively with dissolved CO2, forming carbamate groups.
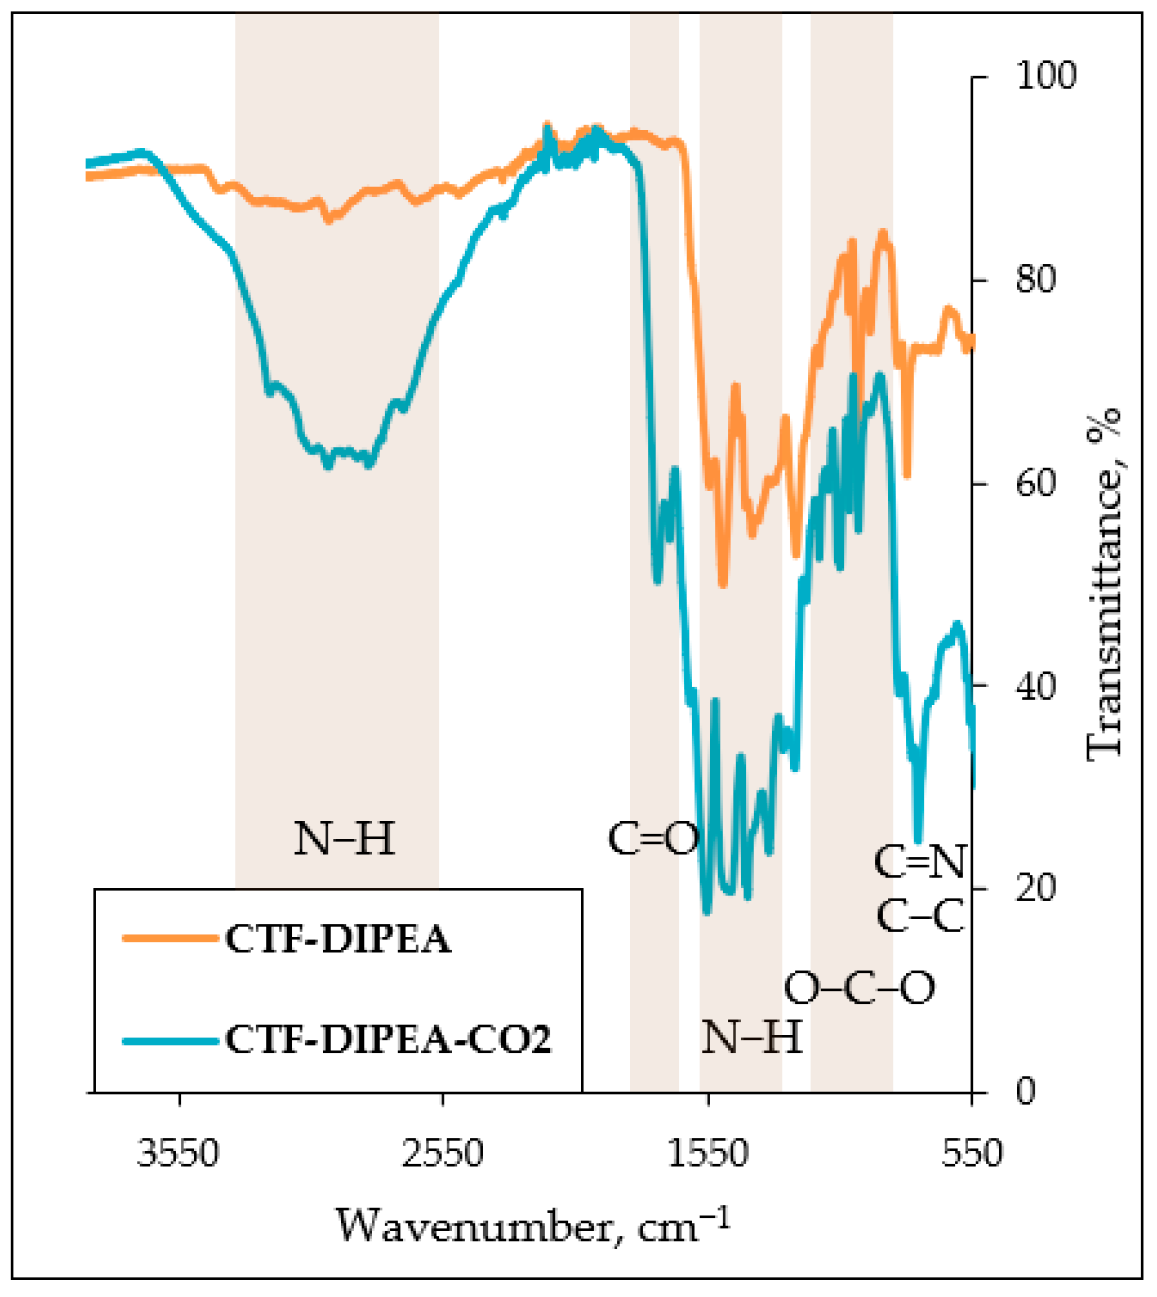
To confirm the formation of carbamate functionalities, the dry powder of CTF-DIPEA was saturated with CO2, and its FT-IR spectrum was compared with the spectrum of the original CTF-DIPEA material. The procedure of CO2 saturation was conducted using a previously reported method [31]. A CTF-DIPEA sample powder was dried overnight in a lyophilization unit. The sample was then placed in a sealed flask under a CO2 atmosphere, evacuated, and maintained under CO2 for 3 days to ensure complete saturation. FT-IR measurements were performed immediately after removal of sample from the flask to minimize any potential loss of adsorbed CO2. Figure 10 shows the FT-IR spectra of the original sample (CTF-DIPEA) and CO2-saturated sample (CTF-DIPEA-CO2).
It was observed that CTF-DIPEA-CO2 demonstrated a very broad O–H stretching band in the region of 2550–3300 cm−1. This peak overlaps with N–H stretching vibrations, typically appearing at 3300–3500 cm−1, which are weak or hidden by the O–H stretching vibrations in the spectrum of CTF-DIPEA-CO2 and weakly visible in that of CTF-DIPEA. The N–H vibrational band becomes more pronounced due to the molecular interaction between the COOH and N-functional groups. Carbamic acids are known to form strong intramolecular hydrogen bonds, similar to carboxylic acids, and additional interaction with the triazine moiety, a strong hydrogen-bond acceptor, contributes to the observed broadening of the O–H/N–H stretching region [32].
FT-IR analysis of CO2 chemisorption on triazine materials defined by spectral changes demonstrates shifts or new bands for the triazine ring—1350–1550 cm−1 [17]—and asymmetric stretching at 2350–2500 cm−1 [15], indicating interaction of CO2 with nitrogen sites, thus forming species like carbamates or carbonates. However, XPS analysis is required to draw a complete conclusion regarding the nitrogen content and chemical states. A more detailed investigation of these aspects will be the subject of future work.
Another notable difference between the spectra of CTF-DIPEA and CTF-DIPEA-CO2 is the presence of a carbonyl stretching band at 1680–1740 cm−1, which is not characteristic of CTF-DIPEA. More intense N–H bending at 1550 cm−1 supports the presence of N–H groups and indicates charge transfer interactions. Additionally, an asymmetric O–C–O stretching vibration is observed in the region 1210–1260 cm−1.
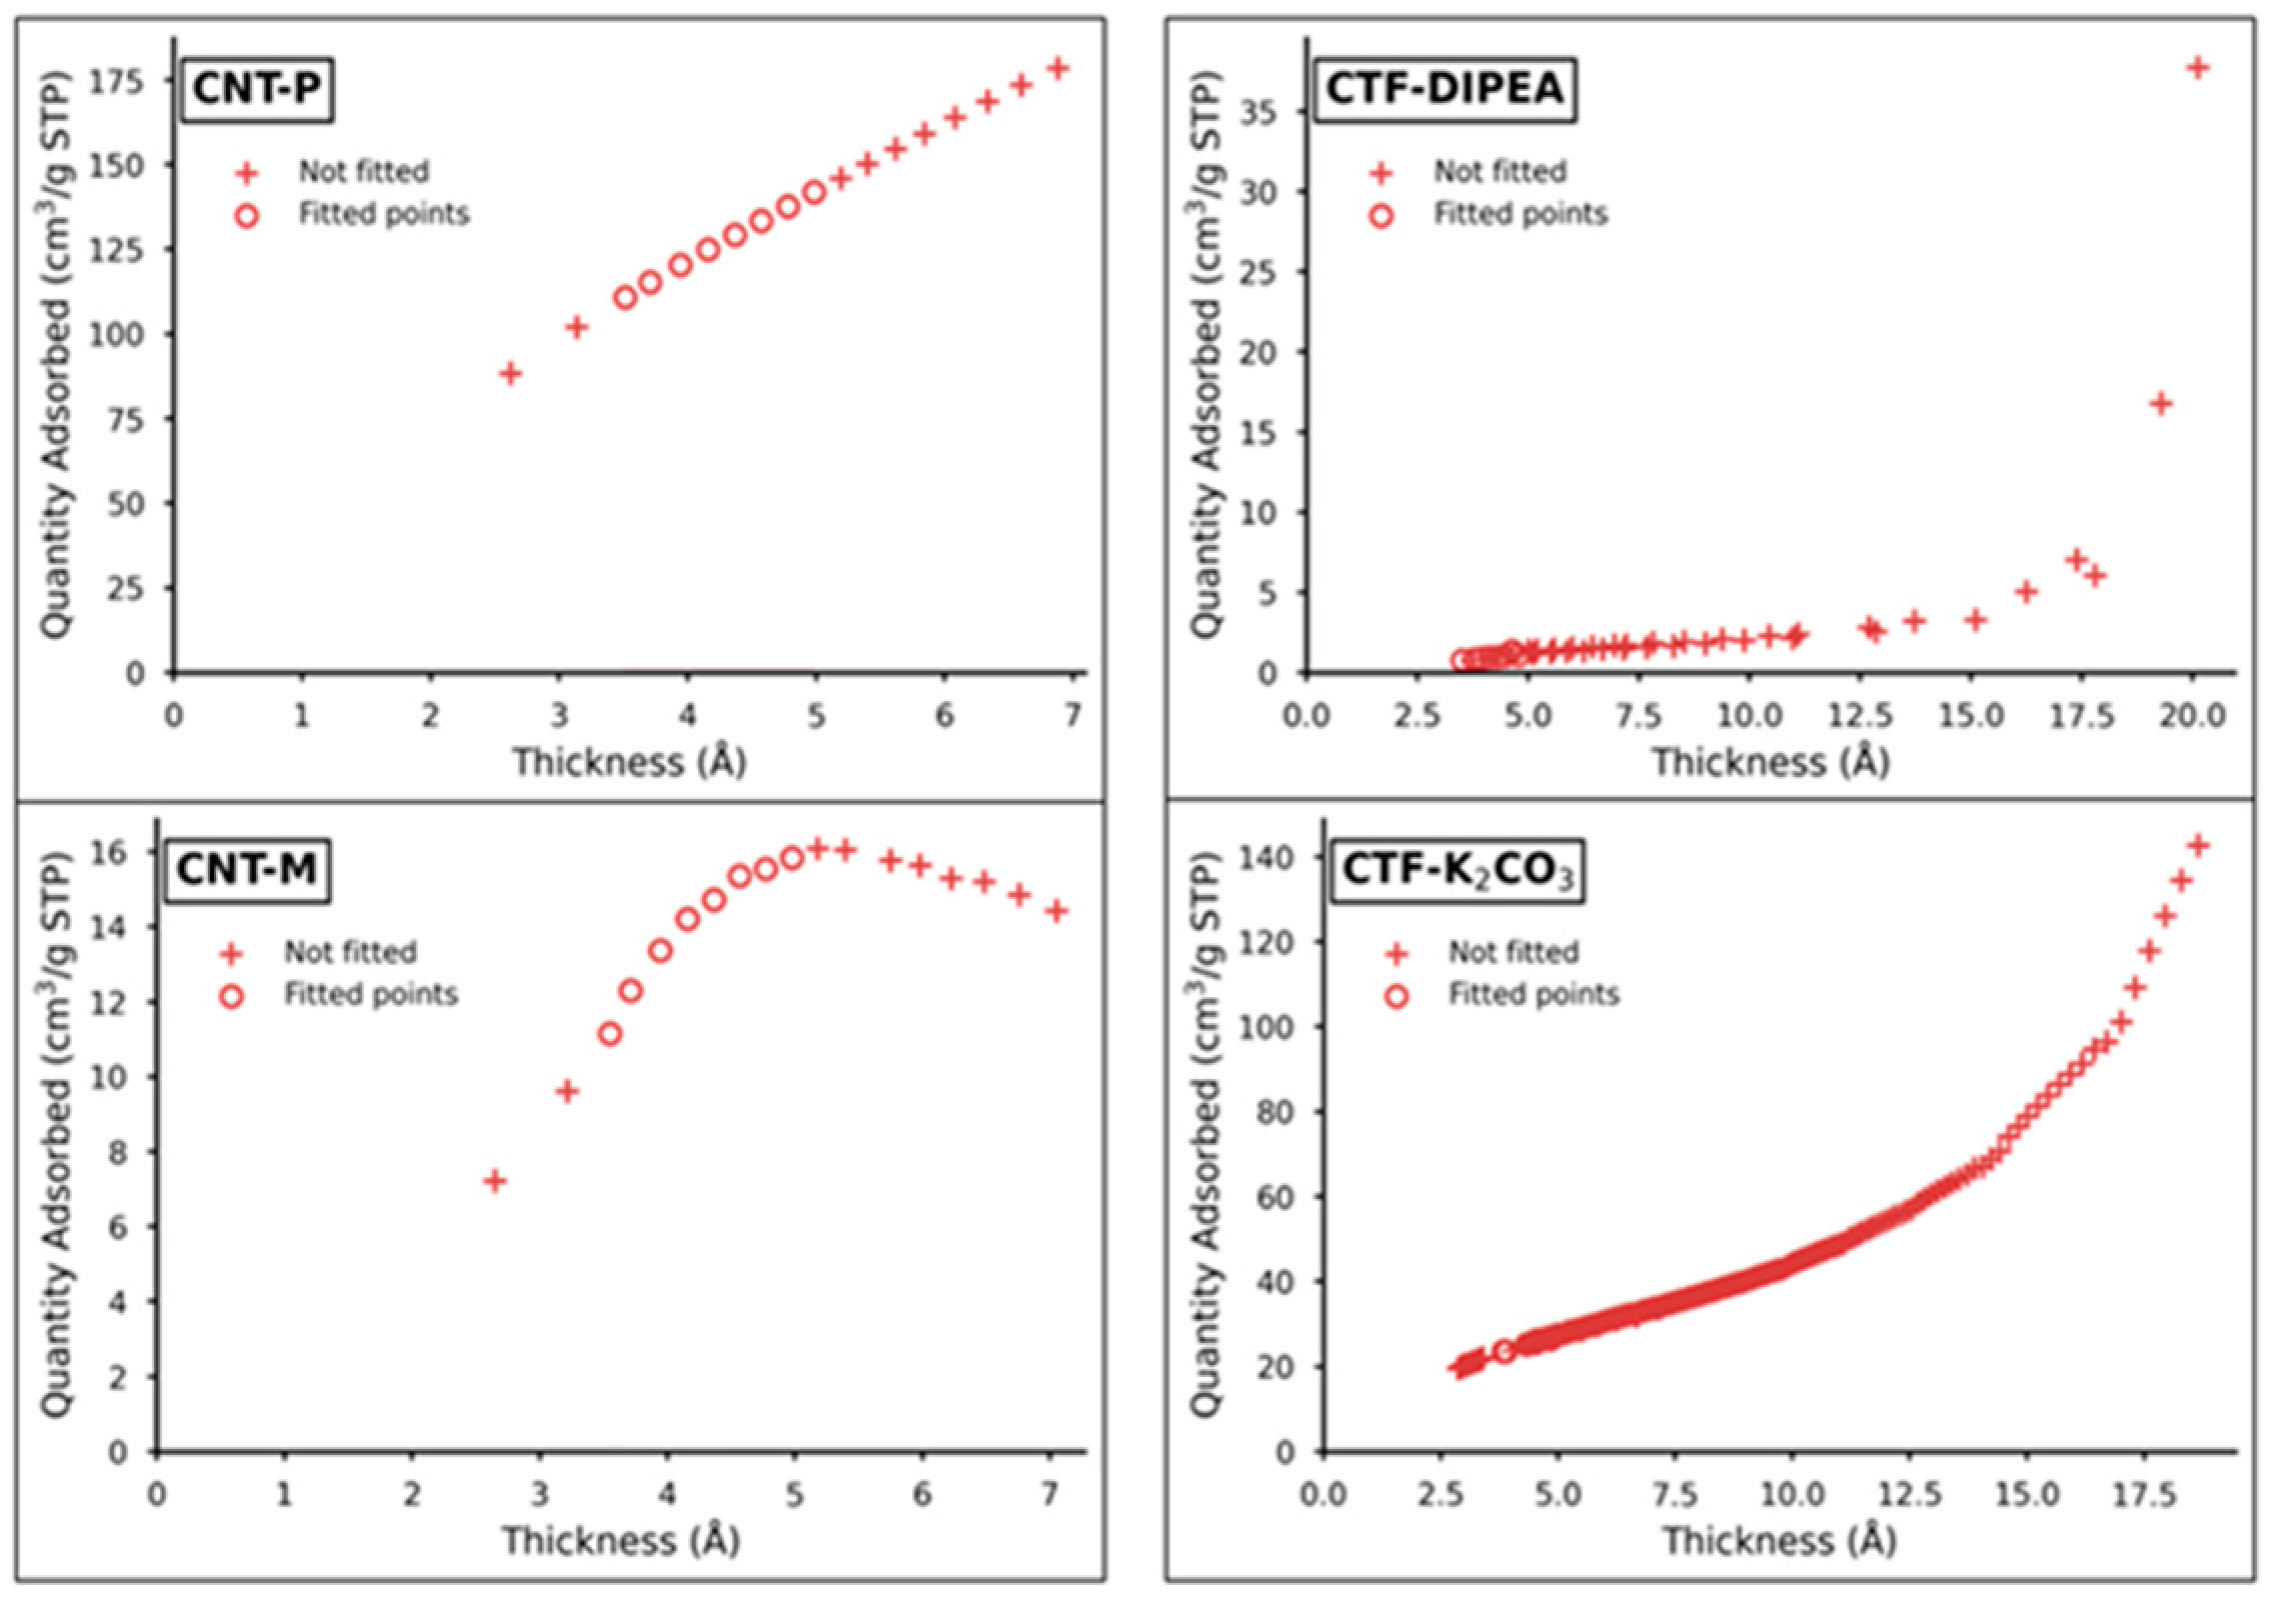
To strengthen the mechanistic links between pore structure and CO2 capture performance, especially for materials where micropores may be present but not well quantified by BJH analysis, the standard practice is to complement BET and BJH analysis (Figure A1) with t-plots (Figure A2) that identify the linear “non-microporous” region and use them to separate external surface adsorption from micropore filling.
Finally, it is important to note that for porous liquids CO2 uptake is not governed only by the solid micropore fraction. In Type III formulations, the accessible porosity in the dispersed phase must be preserved in the liquid environment, and the continuous phase can contribute significantly via dissolution and specific CO2 interactions. Consistent with this, the best-performing formulation (CTF-DIPEA) achieved the highest CO2 uptake in the liquid phase despite the CTF-DIPEA solid exhibiting a very low BET surface area, suggesting the dominant roles of chemical affinity (basic nitrogen sites, and potentially reversible chemisorption/hydrogen-bonding interactions) and dispersion microstructure rather than geometric surface area alone.

4. Conclusions

In this work, we developed and evaluated new formulations of porous liquids based on pristine and surface-modified carbon nanotubes and covalent triazine frameworks dispersed in 1 wt.% SDS. Formulated liquids demonstrated enhanced CO2 uptake compared to the pure SDS, enhancing CO2 solubility in liquid and confirming the higher efficiency of triazine-based nanomaterials compared to nanomaterials without nitrogen functionalities.
Modification of carbon nanomaterials led to enhancement of CO2 adsorption capacity. Porous liquids containing adsorbents with a greater number of polar groups demonstrated higher CO2 uptake. Particularly, covalent triazine frameworks were more efficient, while surface-modified carbon nanotubes demonstrated less CO2 uptake. Despite its low BET surface area, CTF-DIPEA, which was synthesized from cyanuric chloride and p-phenylenediamine with N,N-diisopropylethylamine and further dispersed in 1 wt.% SDS, showed the highest CO2 uptake. The FT-IR spectrum of the CO2-saturated powder of this sample supported the formation of carbamate species and revealed structural changes associated with CO2 binding.
Overall, the present study underscores the potential of porous liquid formulation in the enhancement of CO2 uptake due to chemical functionalization. Our findings contribute to the design of porous liquids with improved performance for CO2 capture from CO2-containing gas streams.

5. Patents

The materials presented in this work and their proposed applications are covered by IP WO2025221764A1 [33] and WO2025105974A1 [34].

Author Contributions

Conceptualization, V.S., H.A.; methodology, E.R., D.G., V.S.; validation, V.S., E.R., D.G.; formal analysis, H.A., K.A.; investigation, E.R., D.G.; resources, V.S., H.A., K.A.; data curation, E.R., D.G., V.S.; writing—original draft preparation, E.R., V.S.; writing—review and editing, E.R., V.S.; visualization, E.R.; supervision, V.S., H.A., K.A.; project administration, V.S., H.A., K.A.; funding acquisition, V.S. All authors have read and agreed to the published version of the manuscript.

Funding

This research received no external funding.

Institutional Review Board Statement

Not applicable.

Informed Consent Statement

Not applicable.

Data Availability Statement

The original contributions presented in this study are included in the article.

Conflicts of Interest

All authors are employed by Saudi Arabian Oil Company. The authors declare no conflict of interest.

Abbreviations

The following abbreviations are used in this manuscript:
BETBrunauer–Emmett–Teller
DIDeionized water
DIPEAN,N-diisopropylethylamine
CNTsCarbon nanotubes
SWCNTsSingle-walled carbon nanotubes
CTFsCovalent triazine frameworks
FT-IRFourier-transform infrared spectroscopy
SDSSodium dodecyl sulfate
XRDX-ray diffraction

Appendix A

To enable a direct competitiveness assessment, Table A1 compares porous liquids from this work with representative state-of-the-art porous liquids reported in the recent literature. To compare the CO2 uptake of formulated porous liquids with the literature-reported systems, values for porous liquids formulated in this work were transformed to mmol/g assuming a specific gravity of ~1.0. Uptake values depend on solid loading, solvent identity, and measurement protocol.
Table A1. Porous liquids and their CO2 uptake performance.
Porous Filler
(Loading, wt.%)
Liquid MediaPorous Liquid TypeCO2 Uptake, mmol/gTesting ConditionsRef.
UiO-66(185)@xPDMS (37 wt.%)PDMSIII1.40 298 K, 1 bar[35]
UiO-66-NH2@xPDMS (33.3 wt.%)PDMSIII1.30298 K, 1 bar
UiO-66-Br2@xPDMS (36 wt.%)PDMSIII0.60298 K, 1 bar
Zeolite Rho (12.5 wt.%)Genosorb 1753III0.30298 K, 1 bar[36]
Zeolite Rho (25 wt.%)Genosorb 1753III0.70298 K, 1 bar
Zeolite Rho (12.5 wt.%)Genosorb 1753III1.10298 K, 5 bar
Zeolite Rho (25 wt.%)Genosorb 1753III1.60298 K, 5 bar
15-C-5-PL Anionic covalent cageI0.40298 K, 10 bar[10]
18-C-6-PLAnionic covalent cageI0.40298 K, 10 bar
CP-SIT (5 wt.%)M2070III1.50298 K, 25 bar[37]
F108-SIT (5 wt.%)M2070III2.00298 K, 25 bar
F127-SIT (5 wt.%)M2070III2.20298 K, 25 bar
UiO-66 (1 wt.%)M2070III0.89298 K, 30 bar[11]
UiO-66 (1 wt.%)M2070III0.20298 K, 10 bar
UiO-66PEGS 0.60298 K, 10 bar[12]
ZIF-8 (5 wt%)[P6,6,6,14][NTf2]III0.34303 K, 5 bar[13]
ZIF-8 (5 wt%)[P6,6,6,14][NTf2]III0.50303 K, 5 bar
ZIF-8[Bpy][NTf2]III0.10298 K, 1 bar[14]
CNT-P (0.004 wt.%)1 wt.% SDSIII0.06298 K, 1 barThis work
CNT-M (0.004 wt.%)1 wt.% SDSIII0.07298 K, 1 bar
CTF-DIPEA (0.004 wt.%)1 wt.% SDSIII0.08298 K, 1 bar
CTF-K2CO3 (0.004 wt.%)1 wt.% SDSIII0.08298 K, 1 bar
Figure A1. Cumulative pore volume of synthesized nanomaterials: CNT-P, CNT-M, CTF-DIPEA, CTF-K2CO3.
Materproc 26 00022 g0a1
Figure A2. T-plots of synthesized nanomaterials: CNT-P, CNT-M, CTF-DIPEA, CTF-K2CO3.
Materproc 26 00022 g0a2
Figure A3. XPS spectrum deconvolution for CNT-P: (a) C 1s fit, (b) O 1s fit.
Materproc 26 00022 g0a3
Figure A4. XPS spectrum deconvolution for CNT-M: (a) C 1s fit, (b) O 1s fit.
Materproc 26 00022 g0a4
Figure A5. XPS spectrum deconvolution for CTF-DIPEA: (a) C 1s fit, (b) N 1s fit, (c) O 1s fit, (d) Cl 2p fit.
Materproc 26 00022 g0a5aMaterproc 26 00022 g0a5b
Figure A6. XPS spectrum deconvolution for CTF-K2CO3: (a) C 1s fit, (b) N 1s fit, (c) O 1s fit, (d) Cl 2p fit.
Materproc 26 00022 g0a6

References

  1. Anwar, M.N.; Iftikhar, M.; Khush Bakhat, B.; Sohail, N.F.; Baqar, M.; Yasir, A.; Nizami, A.S. Sources of Carbon Dioxide and Environmental Issues. In Sustainable Agriculture Reviews 37; Springer: Berlin/Heidelberg, Germany, 2019; pp. 13–36. [Google Scholar]
  2. Meng, F.; Meng, Y.; Ju, T.; Han, S.; Lin, L.; Jiang, J. Research Progress of Aqueous Amine Solution for CO2 Capture: A Review. Renew. Sustain. Energy Rev. 2022, 168, 112902. [Google Scholar] [CrossRef] [Scilit]
  3. Siriwardane, R.V.; Shen, M.-S.; Fisher, E.P.; Losch, J. Adsorption of CO2 on Zeolites at Moderate Temperatures. Energy Fuels 2005, 19, 1153–1159. [Google Scholar] [CrossRef] [Scilit]
  4. Xu, G.; Liang, F.; Yang, Y.; Hu, Y.; Zhang, K.; Liu, W. An Improved CO2 Separation and Purification System Based on Cryogenic Separation and Distillation Theory. Energies 2014, 7, 3484–3502. [Google Scholar] [CrossRef] [Scilit]
  5. Rochelle, G.T. Amine Scrubbing for CO2 Capture. Science 2009, 325, 1652–1654. [Google Scholar] [CrossRef] [Scilit]
  6. Pérez-Botella, E.; Valencia, S.; Rey, F. Zeolites in Adsorption Processes: State of the Art and Future Prospects. Chem. Rev. 2022, 122, 17647–17695. [Google Scholar] [CrossRef] [Scilit]
  7. Zhang, N.; Lior, N. A Novel Near-Zero CO2 Emission Thermal Cycle with LNG Cryogenic Exergy Utilization. Energy 2006, 31, 1666–1679. [Google Scholar] [CrossRef] [Scilit]
  8. Zanganeh, K.E.; Shafeen, A.; Salvador, C. CO2 Capture and Development of an Advanced Pilot-Scale Cryogenic Separation and Compression Unit. Energy Procedia 2009, 1, 247–252. [Google Scholar] [CrossRef] [Scilit]
  9. O’Reilly, N.; Giri, N.; James, S.L. Porous Liquids. Chem. A Eur. J. 2007, 13, 3020–3025. [Google Scholar] [CrossRef] [Scilit]
  10. Jie, K.; Onishi, N.; Schott, J.A.; Jiang, D.-E.; Mahurin, S.; Dai, S. Transforming Porous Organic Cages into Porous Ionic Liquids via a Supramolecular Complexation Strategy. Angew. Chem. Int. Ed. Engl. 2019, 59, 2268–2272. [Google Scholar] [CrossRef] [Scilit] [PubMed]
  11. Wang, D.; Xin, Y.; Li, X.; Ning, H.; Wang, Y.; Yao, D.; Zheng, Y.; Meng, Z.; Yang, Z.; Pan, Y.; et al. Transforming Metal–Organic Frameworks into Porous Liquids via a Covalent Linkage Strategy for CO2 Capture. ACS Appl. Mater. Interfaces 2021, 13, 2600–2609. [Google Scholar] [CrossRef] [Scilit]
  12. Zhao, X.; An, S.; Dai, J.; Peng, C.; Hu, J.; Liu, H. Transforming Surface-Modified Metal Organic Framework Powder into Room Temperature Porous Liquids via an Electrical Balance Strategy. New J. Chem. 2020, 44, 12715–12722. [Google Scholar] [CrossRef] [Scilit]
  13. Costa Gomes, M.; Pison, L.; Červinka, C.; Padua, A. Porous Ionic Liquids or Liquid Metal–Organic Frameworks? Angew. Chem. 2018, 57, 11909–11912. [Google Scholar] [CrossRef] [Scilit] [PubMed]
  14. Liu, S.; Liu, J.; Hou, X.; Xu, T.; Tong, J.; Zhang, J.; Ye, B.; Liu, B. Porous Liquid: A Stable ZIF-8 Colloid in Ionic Liquid with Permanent Porosity. Langmuir 2018, 34, 3654–3660. [Google Scholar] [CrossRef] [Scilit]
  15. Schott, J.A.; Do-Thanh, C.-L.; Shan, W.; Puskar, N.G.; Dai, S.; Mahurin, S.M. FTIR Investigation of the Interfacial Properties and Mechanisms of CO2 Sorption in Porous Ionic Liquids. Green Chem. Eng. 2021, 2, 392–401. [Google Scholar] [CrossRef] [Scilit]
  16. Cahir, J.; Tsang, M.Y.; Lai, B.; Hughes, D.; Alam, M.A.; Jacquemin, J.; Rooney, D.; James, S.L. Type 3 Porous Liquids Based on Non-Ionic Liquid Phases—A Broad and Tailorable Platform of Selective, Fluid Gas Sorbents—Chemical Science (RSC Publishing). Chem. Sci. 2020, 11, 2077–2084. [Google Scholar] [CrossRef] [Scilit] [PubMed]
  17. Zeng, D.; Wang, X.; Kuai, C.; Jiang, Z.; Guo, Y. CO2 Chemisorption and Activation on Carbon Nitride with Less Amino Groups Boost CO2 Photoreduction. Catal. Sci. Technol. 2024, 14, 1052–1061. [Google Scholar] [CrossRef] [Scilit]
  18. Sohrabi, B.; Poorgholami-Bejarpasi, N.; Nayeri, N. Dispersion of Carbon Nanotubes Using Mixed Surfactants: Experimental and Molecular Dynamics Simulation Studies. J. Phys. Chem. B 2014, 118, 3094–3103. [Google Scholar] [CrossRef] [Scilit]
  19. Lourenço, M.A.O.; Fontana, M.; Jagdale, P.; Pirri, C.F.; Bocchini, S. Improved CO2 Adsorption Properties through Amine Functionalization of Multi-Walled Carbon Nanotubes. Chem. Eng. J. 2021, 414, 128763. [Google Scholar] [CrossRef] [Scilit]
  20. Chiang, Y.-C.; Hsu, W.-L.; Lin, S.-Y.; Juang, R.-S. Enhanced CO2 Adsorption on Activated Carbon Fibers Grafted with Nitrogen-Doped Carbon Nanotubes. Materials 2017, 10, 511. [Google Scholar] [CrossRef] [Scilit]
  21. Cinke, M.; Li, J.; Bauschlicher, C.W.; Ricca, A.; Meyyappan, M. CO2 Adsorption in Single-Walled Carbon Nanotubes. Chem. Phys. Lett. 2003, 376, 761–766. [Google Scholar] [CrossRef] [Scilit]
  22. Gu, C.; Liu, D.; Huang, W.; Liu, J.; Yang, R. Synthesis of Covalent Triazine-Based Frameworks with High CO2 Adsorption and Selectivity. Polym. Chem. 2015, 6, 7410–7417. [Google Scholar] [CrossRef] [Scilit]
  23. Fu, Y.; Wang, Z.; Li, S.; He, X.; Pan, C.; Yan, J.; Yu, G. Functionalized Covalent Triazine Frameworks for Effective CO2 and SO2 Removal. ACS Appl. Mater. Interfaces 2018, 10, 36002–36009. [Google Scholar] [CrossRef] [Scilit] [PubMed]
  24. Liu, G.; Liu, S.; Lai, C.; Qin, L.; Zhang, M.; Li, Y.; Xu, M.; Ma, D.; Xu, F.; Liu, S.; et al. Strategies for Enhancing the Photocatalytic and Electrocatalytic Efficiency of Covalent Triazine Frameworks for CO2 Reduction. Small 2024, 20, 2307853. [Google Scholar] [CrossRef] [Scilit]
  25. Mukhtar, A.; Ullah, S.; Inayat, A.; Saqib, S.; Mellon, N.B.; Assiri, M.A.; Al-Sehemi, A.G.; Khan Niazi, M.B.; Jahan, Z.; Bustam, M.A.; et al. Synthesis-Structure-Property Relationship of Nitrogen-Doped Porous Covalent Triazine Frameworks for Pre-Combustion CO2 Capture. Energy 2021, 216, 119230. [Google Scholar] [CrossRef] [Scilit]
  26. Kundu, S.K.; Bhaumik, A. A Triazine-Based Porous Organic Polymer: A Novel Heterogeneous Basic Organocatalyst for Facile One-Pot Synthesis of 2-Amino-4H-Chromenes—RSC Advances (RSC Publishing). RSC Adv. 2015, 5, 32730–32739. [Google Scholar] [CrossRef] [Scilit]
  27. Beyaz, A.; Oh, W.S.; Reddy, V.P. Ionic Liquids as Modulators of the Critical Micelle Concentration of Sodium Dodecyl Sulfate. Colloids Surf. B Biointerfaces 2004, 35, 119–124. [Google Scholar] [CrossRef] [Scilit]
  28. Chenyakin, Y.; Chen, D.D.Y. Determination of Critical Micelle Concentration of Ionic and Non-Ionic Surfactants by Streaming Potential Measurements. Electrophoresis 2025, 46, 990–997. [Google Scholar] [CrossRef] [Scilit]
  29. Truong, T.; Palmer, M.; Bansal, N.; Bhandari, B. Investigation of Solubility of Carbon Dioxide in Anhydrous Milk Fat by Lab-Scale Manometric Method. Food Chem. 2017, 237, 667–676. [Google Scholar] [CrossRef] [Scilit]
  30. Kolanowska, A.; Kuziel, A.; Li, Y.; Jurczyk, S.; Boncel, S. Rieche Formylation of Carbon Nanotubes—One-Step and Versatile Functionalization Route. RSC Adv. 2017, 7, 51374–51381. [Google Scholar] [CrossRef] [Scilit]
  31. Gribanev, D.; Pankratova, E.; Alqahtani, H.; Alruwaili, K.; Solovyeva, V. Facilitation of Amine-Bridged Covalent Triazine Framework Synthesis by Microwave Irradiation. In Proceedings of the 4th International Electronic Conference on Processes, Online, 20–22 October 2025. [Google Scholar]
  32. Altun, Z.; Bleda, E.; Trindle, C. Production of Carbamic Acid Dimer from Ammonia-Carbon Dioxide Ices: Matching Observed and Computed IR Spectra. Life 2019, 9, 34. [Google Scholar] [CrossRef] [Scilit] [PubMed]
  33. Solovyeva, V.; Pankratova, E.; Alqahtani, H.S.; Alruwaili, K. Mixed Matrix Membranes Containing Covalent Triazine Frameworks. U.S. Patent US12179158B1, 15 April 2025. [Google Scholar]
  34. Solovyeva, V.; Pankratova, E.; Alqahtani, H.S.; Alruwaili, K. Mixed-Matrix Membranes Containing a Norbornene-Based Polymer and Methods Associated Therewith. WIPO Patent WO2025105974A1, 22 May 2025. [Google Scholar]
  35. He, S.; Chen, L.; Cui, J.; Yuan, B.; Wang, H.; Wang, F.; Yu, Y.; Lee, Y.; Li, T. General Way To Construct Micro- and Mesoporous Metal–Organic Framework-Based Porous Liquids. J. Am. Chem. Soc. 2019, 141, 19708–19714. [Google Scholar] [CrossRef] [Scilit] [PubMed]
  36. James, S.; Tsang, M.Y.; Cahir, J. Type 3 Porous Liquids. WIPO Patent WO2019215419A1, 14 November 2019. [Google Scholar]
  37. Shi, T.; Zheng, Y.; Wang, T.; Li, P.; Wang, Y.; Yao, D. Effect of Pore Size on the Carbon Dioxide Adsorption Behavior of Porous Liquids Based on Hollow Silica. ChemPhysChem 2018, 19, 130–137. [Google Scholar] [CrossRef] [Scilit]
Figure 1. Synthesis routes of CTF-DIPEA and CTF-K2CO3.
Materproc 26 00022 g001
Figure 2. Synthesis route of surface modification of carbon nanotubes.
Materproc 26 00022 g002
Figure 3. Scheme of preparation of porous liquids.
Materproc 26 00022 g003
Figure 4. Calibration graph between theoretical and measured pressure for dry ice dissolved in deionized water.
Materproc 26 00022 g004
Figure 5. FT-IR spectra of synthesized nanomaterials: (a) CNT-P and CNT-M; (b) CTF-DIPEA and CTF-K2CO3.
Materproc 26 00022 g005
Figure 6. Thermogravimetric stability of synthesized nanomaterials: CNT-P, CNT-M, CTF-DIPEA, CTF-K2CO3.
Materproc 26 00022 g006
Figure 7. Nitrogen adsorption/desorption isotherms of nanomaterials: (a) CNT-P; (b) CNT-M; (c) CTF-DIPEA; (d) CTF-K2CO3.
Materproc 26 00022 g007
Figure 8. XRD plots for synthesized nanomaterials.
Materproc 26 00022 g008
Figure 9. Survey XPS spectra of nanomaterials: (a) CNT-P; (b) CNT-M; (c) CTF-DIPEA; (d) CTF-K2CO3.
Materproc 26 00022 g009
Figure 10. FT-IR spectra of CTF-DIPEA and CTF-DIPEA-CO2.
Materproc 26 00022 g010
Table 1. BET surface area and total pore volume of the nanomaterials.
NanomaterialBET Surface Area, m2/g Total Pore Volume, cm3/g
CNT-P460.61.03
CNT-M64.60.25
CTF-DIPEA3.40.02
CTF-K2CO355.30.21
Table 2. CO2 uptake values of liquids.
Liquid MediaNanomaterialCO2 Uptake of Liquid System, mmol/L 1
Deionized water19
1 wt.% SDS38
1 wt.% SDSCNT-P64
1 wt.% SDSCNT-M69
1 wt.% SDSCTF-DIPEA82
1 wt.% SDSCTF-K2CO376
1 Measured at 298 K, 101.3 kPa.
Disclaimer/Publisher’s Note: The statements, opinions and data contained in all publications are solely those of the individual author(s) and contributor(s) and not of MDPI and/or the editor(s). MDPI and/or the editor(s) disclaim responsibility for any injury to people or property resulting from any ideas, methods, instructions or products referred to in the content.