1. Introduction and Literature Review
The development of a nation is inherently linked to its energy consumption, which serves as a direct indicator of industrial progress and population growth. In India, the rising power demand is driven by rapid industrialization and an increasing population. However, dependence on conventional energy resources like coal and oil has led to higher costs and significant environmental concerns, urging the transition toward renewable energy sources.
Recent studies emphasize the importance of incorporating electric vehicles into microgrids to optimize energy allocation and utilize their energy storage potential effectively. This integration addresses the challenges posed by load fluctuations and the economic implications of EV charging. A study by the authors of [
1] introduced an improved pelican optimization algorithm (IPOA) to improve capacity allocation in microgrids with EV integration, effectively reducing operational costs while addressing uncertainties and enhancing convergence speed. Another work by the researchers in [
2] combined Gaussian process regression with the krill herd algorithm to optimize EV charging and energy management, achieving superior accuracy and cost effectiveness.
In another approach, ref. [
3] applied the gradient pelican optimization algorithm (GPOA) to grid-connected hybrid microgrids, which resulted in enhanced system performance and cost reductions through improved convergence and optimization accuracy. Similarly, ref. [
4] developed a multi-objective programming model for grid-connected nano-grids, integrating photovoltaic arrays, battery storage, and EV charging, thereby minimizing operational costs, reducing emissions, and improving reliability.
Further research includes [
5], which proposed a grid-connected photovoltaic-based microgrid designed for EV charging infrastructure. This system efficiently met the demands of EV load while maintaining reliability and sustainability. Another study [
6] examined the techno-economic and environmental benefits of integrating renewable energy sources for on-grid charging of plug-in EVs (PEVs), presenting a cost-effective energy management strategy that balances economic and environmental gains.
The objective of this study is to minimize the overall cost of energy by the optimal design and operation of a grid-connected hybrid microgrid that includes a utility grid (UG), solar PV, wind turbines (WT), and a diesel generator (DG) along with EV charging infrastructure for a university campus. The objective has been achieved using the pelican optimization algorithm (POA) by selecting the optimal capacity of PV and WT for the optimal operation of the system, which reduces energy costs and carbon emissions, offering a sustainable and efficient energy solution for the future.
2. Materials and Methods
2.1. Proposed Model
The proposed model integrates two renewable energy generators (REGs) with the existing system to reduce reliance on the utility grid (UG), which connects through a bi-directional energy meter at the point of common coupling (PCC). A DG serves as a backup, while energy from REGs and the EV charging station feeds into the main bus via power electronics converters, as shown in
Figure 1.
In the HMGS, black lines denote power lines, and red lines represent communication signals. The main busbar operates at 440 V, 50 Hz in a three-phase AC system, ensuring consistency across interconnected sources. Circuit breakers (CBs) link all components, with ‘CB’ encompassing devices like relays and intelligent electronic devices (IEDs) for protection.
The microgrid central controller (MGCC), housing a central protection center (CPC), manages CB activation through communication signals, ensuring efficient energy distribution and system performance.
2.2. Components of the HMGS
2.2.1. Solar PV
For the purposes of this case study, a 0.6 kW PV module was chosen. The hourly power output of the PV panels is determined using Equations (1) and (2), as described in recent studies [
7].
where
represents the power output generated by the PV cell,
represents the rated power of the PV cell under standard test conditions, G is the solar radiation intensity (W/m
2) incident on the PV cell, and
is the solar radiation intensity under reference conditions (1000 W/m
2).
,
, and
refer to the reference temperature (25 °C), temperature of the PV cell (°C), and ambient temperature (°C), respectively.
is the temperature coefficient (−3.7 × 10
−3 °C
−1).
2.2.2. Wind Turbine
For the purposes of this research, a 10-kW wind turbine was chosen. It is noteworthy that wind speed is height-dependent, a relationship that can be modelled using the power law equation expressed in Equation (3).
In this equation,
and
denote wind speeds at heights
and
, respectively, while α is the ground surface friction coefficient set at 1/7. The hourly output power
of the wind turbine is calculated using Equation (4), as referenced in sources [
8,
9].
The variables are defined as follows: v represents the wind velocity, corresponds to the wind speed at the reference height, and signifies the wind turbine’s rated power in kW. Additionally, and denote the rated wind speed, cut-in wind speed, and cut-out wind speed, respectively, measured in m/s. This study assumes a wind turbine efficiency of 95%.
2.2.3. Power Electronics Converter
In a grid-connected microgrid with a PV system as the sole renewable source, power electronic converters are essential for managing energy flow between the PV array, the grid, and EV charging stations. These converters enable DC-AC conversion for grid synchronization and bidirectional energy transfer during vehicle-to-grid (V2G) operations. Proper sizing, based on peak power demand, ensures efficient operation and system reliability. Recent advancements, such as multiport and adaptive droop control converters, have further optimized the performance of microgrids, enhancing their flexibility and stability [
10,
11].
Converter Sizing: The size of the power converter is determined by the peak power demand of the system, including the simultaneous operation of EV charging stations and PV generation. A commonly used formula for sizing the converter is as follows:
where
refers to the converter’s specified power rating and
represents the peak power demand of the system. This 20% margin ensures reliable operation and accounts for transient surges during peak load conditions [
12,
13].
2.2.4. Utility Grid
The current system is integrated with the bulk power network operated by the government distribution company, WBSEDCL. The specifications of the utility grid include a contract demand of 350 kVA, a supply voltage of 11 kV, a three-phase system, and a power factor of 0.9841. The tariff structure consists of a two-part system: The first part includes fixed charges, while the second part is based on energy consumption. The demand charge is set at INR 384/kVA per month, accompanied by a meter rental fee of INR 2400 per month. After analyzing all relevant parameters and considering findings from previous studies, the unit cost of the utility grid has been calculated at INR 10.90/kWh, with a selling price of INR 3.00/kWh [
9].
2.2.5. Diesel Generator
When designing a microgrid, factors such as efficiency, fuel consumption, and CO
2 emissions are critical considerations. To calculate the fuel consumption of a diesel generator,
Equation (4) is used.
In this equation,
represents the rated power of the diesel generator (kW), and
refers to the output power (kW). The coefficients
and
indicate the generator’s fuel consumption rate (load/kWh) [
14]. The system integrates a Cummins-250 KVA diesel generator, and these parameters are fundamental for assessing the diesel generator’s performance and operational efficiency within the microgrid configuration.
2.2.6. Net Metering
This study explores the measurement of bi-directional energy flow through net metering systems, which function as automated billing solutions for electricity consumption. Net metering facilitates the determination of the payable or receivable amount by evaluating the difference between the electrical energy consumed from the utility grid and the energy fed back into the host microgrid system.
2.3. Stakeholder Perspectives
This study examines two perspectives: The institution seeks reliable, cost-effective green energy without upfront costs, while the vendor aims to supply power year-round at a fixed rate of INR 4.5/kWh under a 15-year agreement. The researcher provides recommendations on optimal renewable generator capacity and sustainable system design for ecological and economic benefits.
2.4. Meteorological Data and Load Profile
2.4.1. Meteorological Data
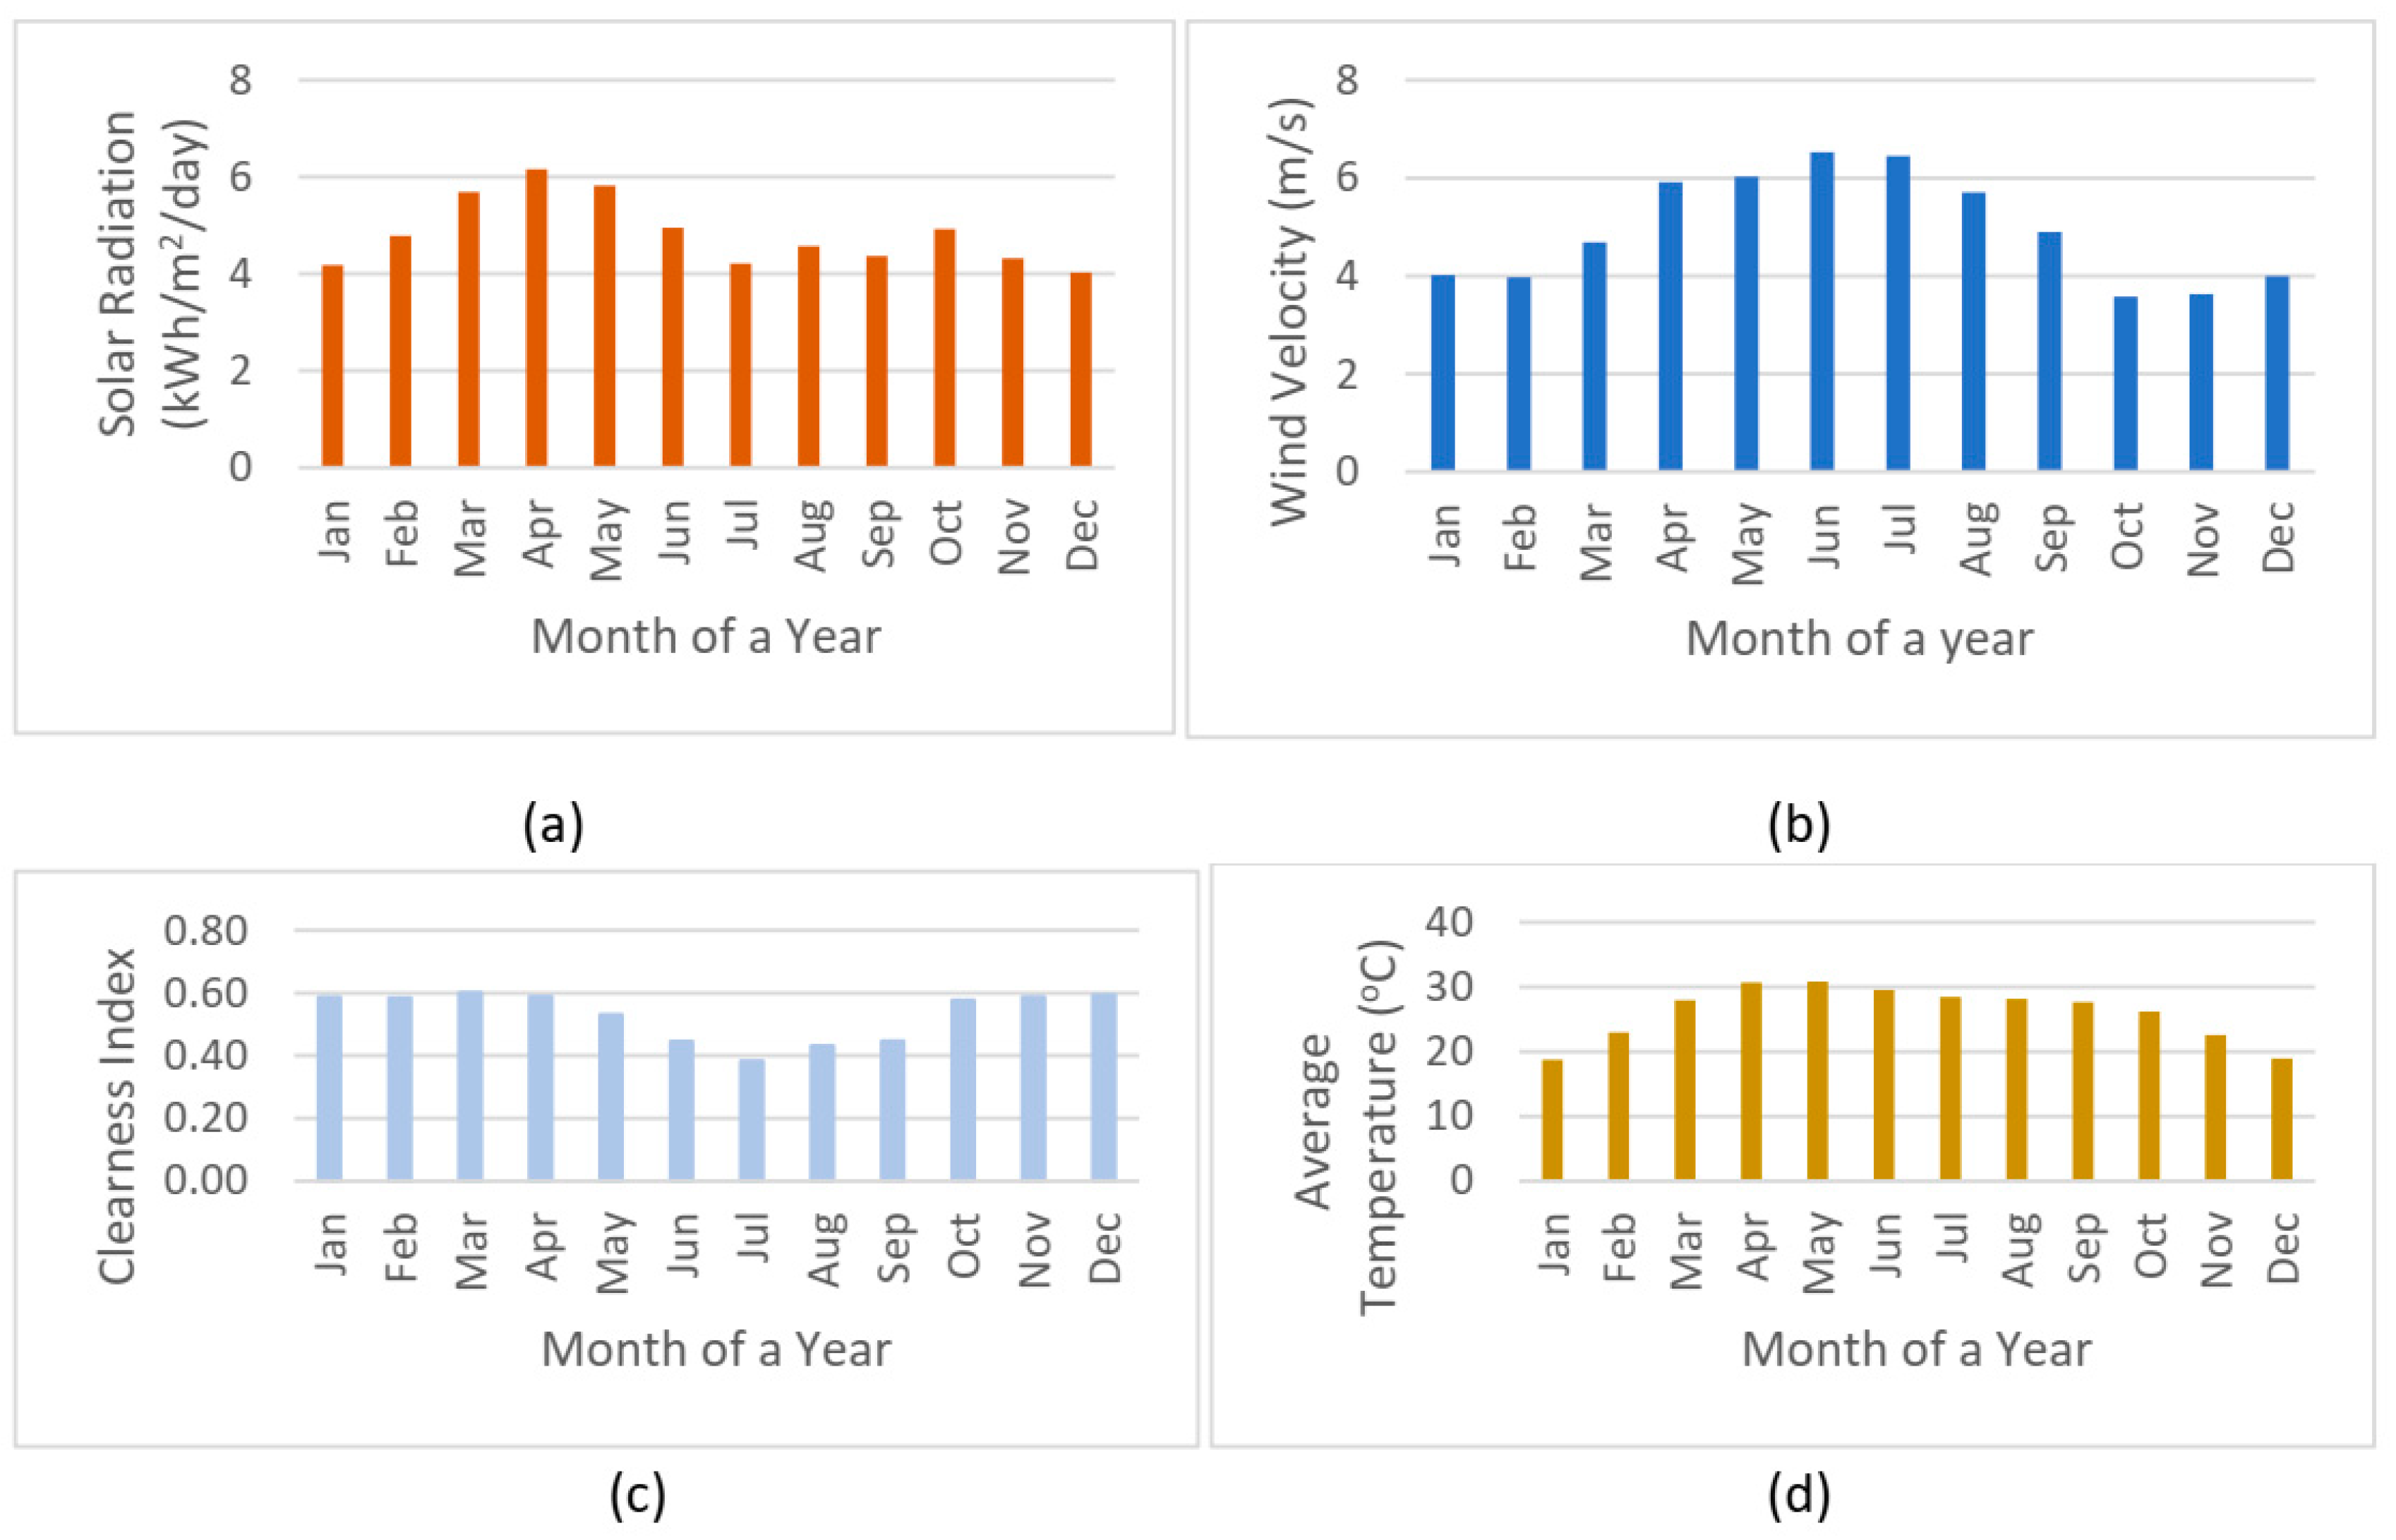
The test site, nestled in a rural expanse of South 24 Parganas district, boasts a geographical position at a latitude of 22°15′39″ N and longitude of 88°11′44″ E, offering a promising backdrop for harnessing solar radiation and wind energy throughout the year. This research endeavors to provide a comprehensive analysis, as depicted in
Figure 2a–d, delineating the monthly averages of solar radiation, wind velocity, clearness index, and atmospheric temperature, respectively. Notably, the site exhibits a monthly average solar radiation of 4.84 kWh/m
2/day, with a corresponding average monthly wind velocity of 4.95 m/s at the hub height of 10 m, coupled with an atmospheric monthly average temperature of 26.06 °C [
15].
2.4.2. Electrical Load Demand
The intricate dynamics of electrical load fluctuations, particularly during university-listed holidays, contribute to the complexity of the design process. Notably, the upper load demand reaches 159 kWh, while the lower end touches only 15 kWh, amplifying the intricacies of designing a resilient energy system. The comprehensive insights derived from this study are pivotal for formulating effective strategies to address the energy challenges faced by TNU.
2.4.3. EV Charging Station
The proposed EV charging station is intended for an educational institute in rural West Bengal, India, where rising fuel prices have highlighted the need for alternatives like EVs. To encourage the transition to EVs, a cost-effective charging station model has been designed, addressing the lack of existing infrastructure in the region. Considering charging losses of 10–15%, a typical four-seater EV in India requires 34.5 to 46 kWh of electricity per full charge. It is estimated that 10 to 15 EVs will be charged daily at the institute, operating 250 days a year within 8 hours of working duration. The additional daily energy demand for EV charging ranges from 402.5 kWh to 603.75 kWh, excluding the institute’s regular consumption. The charging cost is INR 9/kWh when powered by REGs and INR 12/kWh when supplied from UG.
3. Problem Formulation
This study proposes a grid-connected hybrid energy system aimed at balancing cost-effectiveness and reliability. It focuses on optimizing solar PV and wind turbine sizing, detailing the operational strategy, objective function, constraints, and algorithm used for analysis.
3.1. Operational Strategy
The proposed microgrid system accommodates two types of loads: system-connected electrical loads and EV charging loads. The primary goal is to meet these demands using REGs. However, the intermittent nature of RES poses a significant challenge to system design. In this setup, the UG serves as a backup power source, while a DG functions as an emergency power supply to enhance reliability.
EV charging operates within a specific time window (10:00 AM–5:00 PM) and is active only when either the REGs or the UG, or a combination of both, can meet the required power demand. In the event of a power outage, if the REGs fail to supply sufficient energy for EV charging, the charging facility is temporarily disabled, prioritizing the supply of essential electrical loads using the DG. Any surplus power generated by the REGs is fed back to the UG via a net metering system, ensuring optimal energy utilization.
3.2. Objective Function
The primary objective of the proposed HMGS is to minimize the overall COE while ensuring a reliable and uninterrupted energy supply. Achieving the optimal system configuration involves key decision variables, including the number of wind turbines and solar photovoltaic panels. The problem is formulated as a COE minimization function, represented by Equation (7), with the COE calculation detailed in Equation (8).
where
indicates the cost of energy of
ith source and
represents the power generated by the
ith source during
tth hour. Here,
i indicates the different types of sources like PV, WT, DG, power from the UG, and power to the UG. In case of power sell to the grid, sign of
P(
t) will be −
Ve.
To ensure reliable and stable operation, the power equation must be balanced. Given the variability in renewable energy generation, perfect matching of supply and demand is unfeasible. Hence, this approach maintains a generation capacity slightly exceeding the load demand, as outlined in constraint Equation (9).
Here,
and
are the total power generation including grid power as shown in Equation (10) and total load demand at
ith hour, respectively.
Excess power generation can be sold back to the UG to balance the power equation and reduce overall costs. The amount of power sold to the UG, denoted as
is determined using Equation (11).
The system seeks to reduce the carbon footprint by optimizing its renewable factor (RF), which measures the share of energy generated from renewable sources in comparison to DG and UG. An RF of 100% indicates complete reliance on renewables, while 0% means equal contributions from renewable and non-renewable sources [
7]. The RF is calculated using Equation (12).
3.3. Pelican Optimization Algorithm
POA is a recently introduced stochastic, evolutionary optimization method known for its robust exploration and exploitation abilities in finding the global optimum. Developed by Trojovský P. and Dehghani M. in 2022 [
16], this algorithm is inspired by the cooperative hunting strategies of pelicans. In their hunting process, pelicans work in groups to locate prey and then dive strategically, spreading their wings to drive the prey toward the water surface and shallow regions, making it easier to capture.
It initializes a population of pelicans (candidate solutions) that adapt their positions based on the best solutions to simulate prey pursuit. The algorithm ensures global optimization by dynamically searching new regions (exploration) and refining promising areas (exploitation), achieving efficient and robust results for complex problems.
4. Results and Discussion
According to the optimized results obtained through POA analysis, the system requires 507 photovoltaic (PV) panels and 23 wind turbines to operate the HMGS efficiently and cost-effectively. This configuration successfully meets 100% of the electrical load demand, achieving a reduced unit cost of INR 5.2/ kWh and an impressive renewable energy factor of 90.42%. The detailed simulation results are presented in
Table 1.
In the proposed model, there is no unmet electrical load within the system; however, only 94.81% of the EV charging demand can be fulfilled using a mix of renewable energy and the utility grid or the presence of either one. This limitation arises because the REGs are unable to produce excess power beyond what is required to meet essential electrical loads during utility grid power outages. The incorporation of an EV charging facility has significantly addressed a pressing issue faced by the institution’s staff and students, generating an annual revenue of INR 12.22 lakhs. Optimum size, DRGs specification, and valuable information are illustrated in
Table 2.
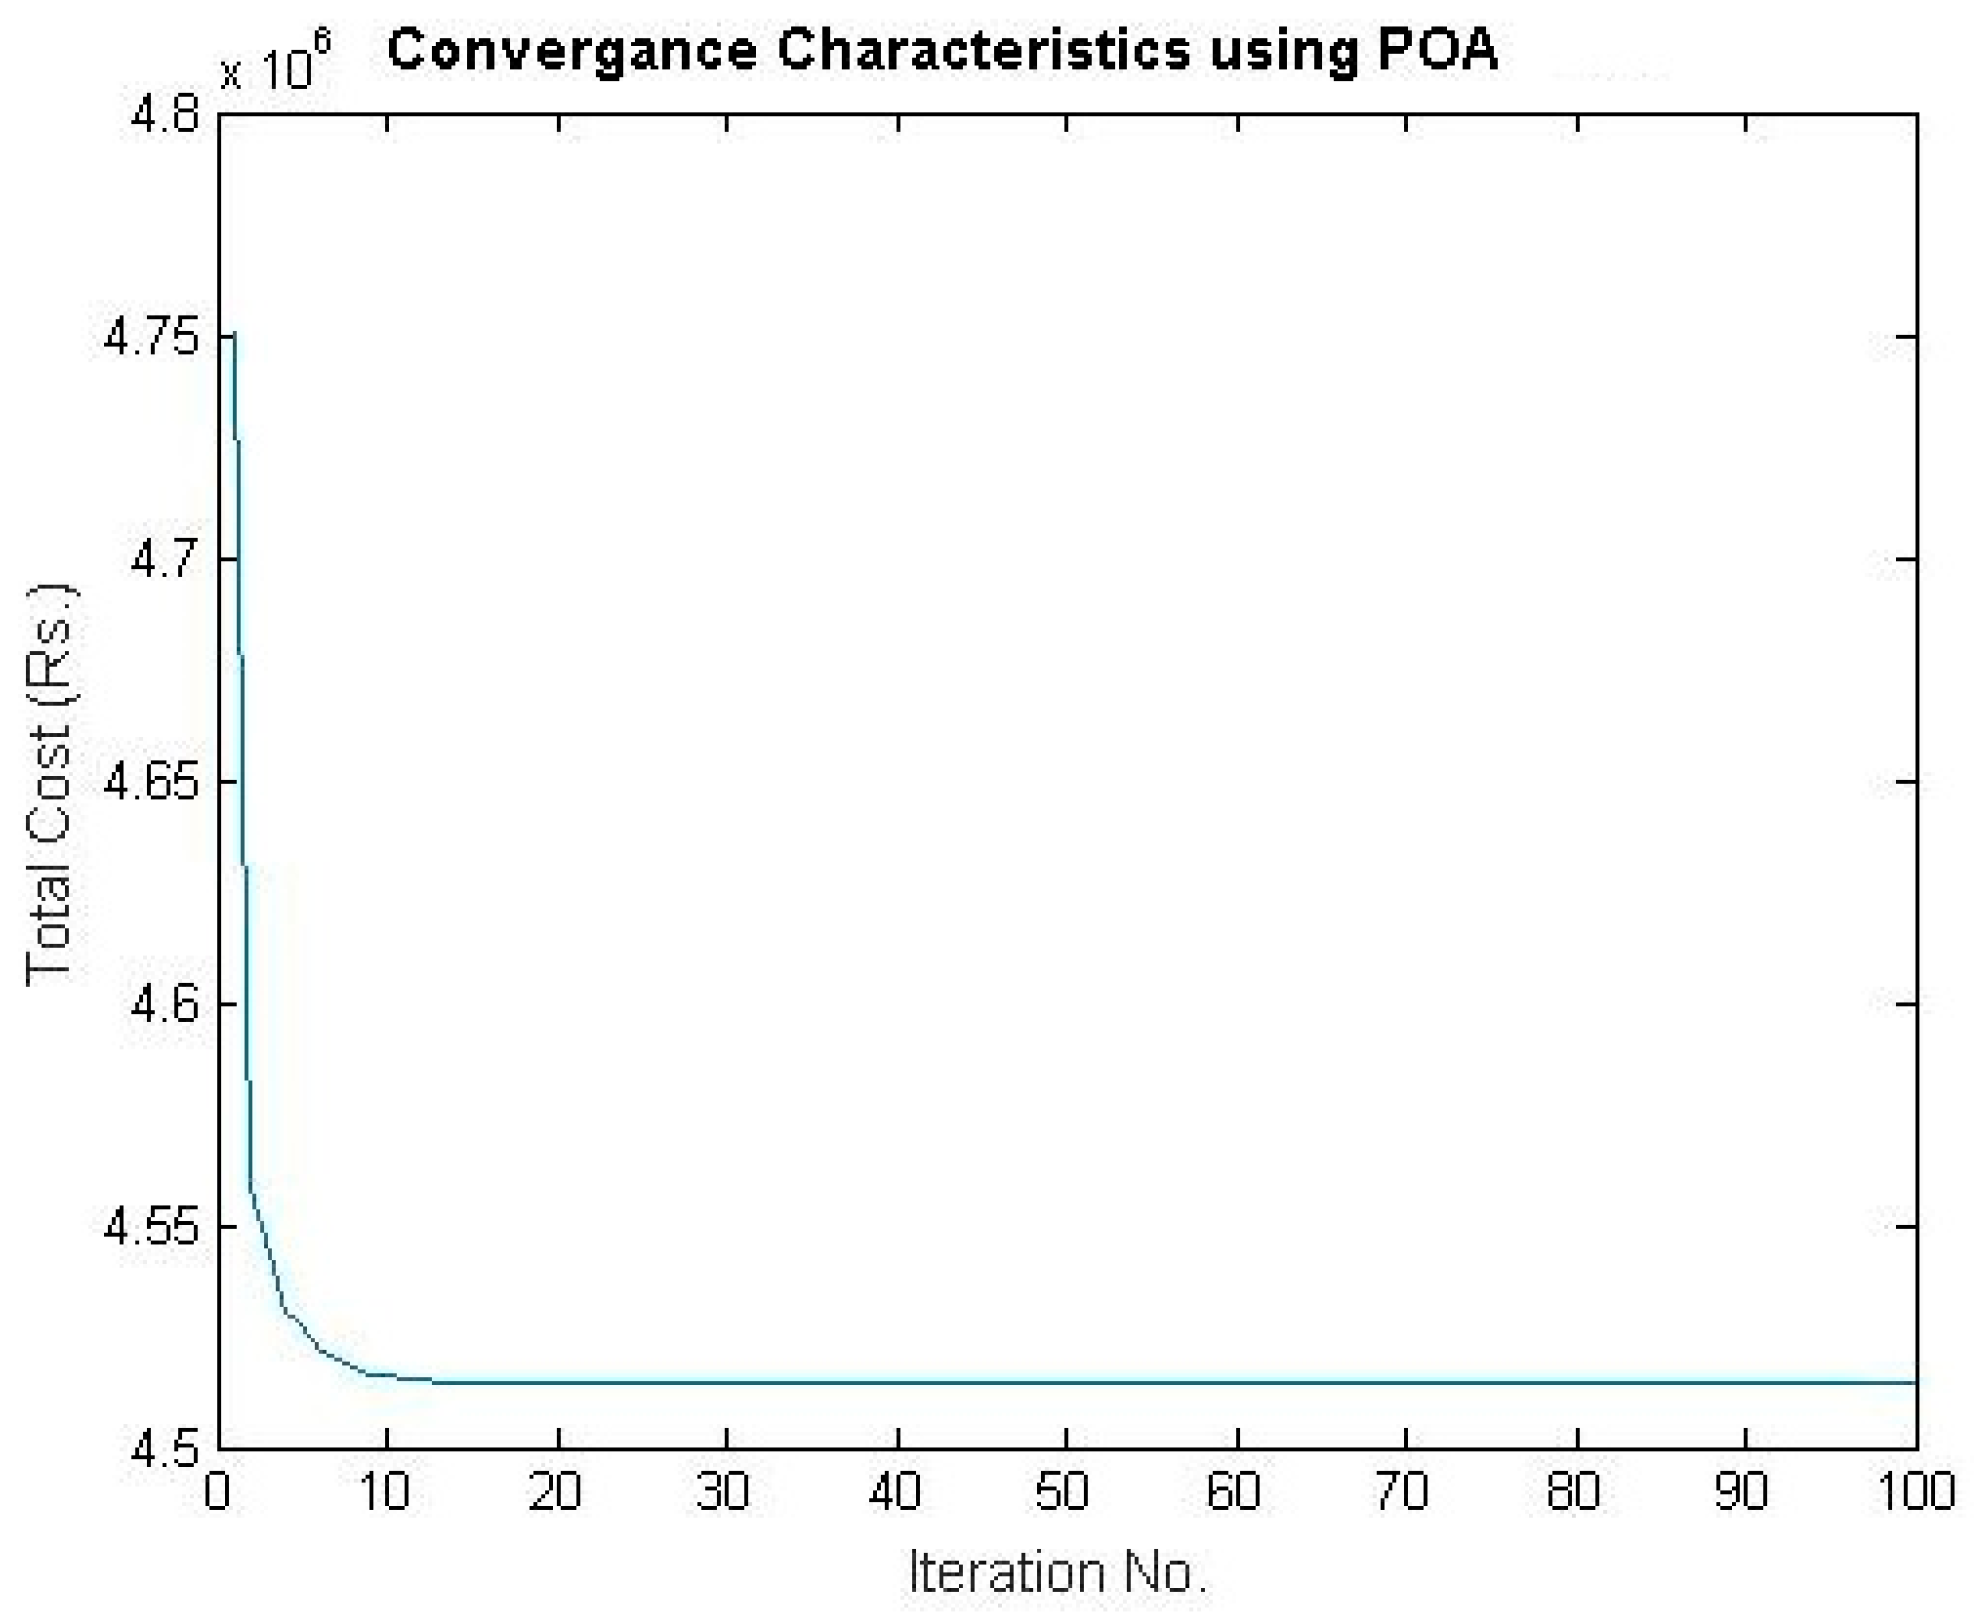
The yearly energy contributions (in percentages) and the corresponding convergence characteristics for POA are depicted in
Figure 3 and
Figure 4, respectively.
5. Conclusions
The results of this study demonstrate that a well-designed grid-connected hybrid energy system can reliably fulfill the total load requirements of the selected test site. Careful planning and optimization significantly lower the cost of energy (COE) per unit, making the system economically competitive when compared to conventional energy sources. Additionally, reduced reliance on diesel generators (DG) helps curtail greenhouse gas emissions, advancing environmental sustainability goals. The optimization of system parameters, such as the number of photovoltaic (PV) and wind turbine (WT) units, was carried out using the pelican optimization algorithm (POA), which effectively minimized the COE. In the test scenario, the COE was reduced from INR 11.74/kWh to INR 5.20/kWh, while CO2 emissions dropped from 650 tons to 114 tons. Furthermore, approximately 95% of the electric vehicle (EV) load was met without the operation of DG. The POA also demonstrated robust performance with rapid convergence to the global optimum, confirming its suitability for such optimization challenges. This research highlights the potential of hybrid energy systems integrated with EV charging stations as a sustainable, cost-efficient, and environmentally responsible energy solution.
Author Contributions
Conceptualization, A.M. and S.K.; methodology, A.M. and S.K.; software, A.M. and S.K.; validation, A.M., S.K., and P.P.; formal analysis, A.M.; investigation, A.M. and P.P.; resources, A.M.; data curation, P.P.; writing—original draft preparation, A.M. and S.K.; writing—review and editing, A.M., S.K., and P.P.; visualization, A.M., S.K., and P.P.; supervision, S.K. and P.P. All authors have read and agreed to the published version of the manuscript.
Funding
This research received no external funding.
Institutional Review Board Statement
Not applicable.
Informed Consent Statement
Not applicable.
Data Availability Statement
The data utilized in this study can be obtained upon request from the corresponding author, ensuring the protection of critical infrastructure.
Acknowledgments
The authors acknowledge the School of Agriculture and Allied Science (SAAS), The Neotia University, for providing the primary meteorological data and the Administrative Department for sharing the load data necessary to conduct this study.
Conflicts of Interest
The authors declare no conflicts of interest.
References
- Li, J.; Chen, R.; Liu, C.; Xu, X.; Wang, Y. Capacity Optimization of Independent Microgrid with Electric Vehicles Based on Improved Pelican Optimization Algorithm. Energies 2023, 16, 2539. [Google Scholar] [CrossRef]
- Hassan, M. Machine learning optimization for hybrid electric vehicle charging in renewable microgrids. Sci. Rep. 2024, 14, 13973. [Google Scholar] [CrossRef] [PubMed]
- El-Sattar, H.A.; Hassan, M.H.; Vera, D.; Jurado, F.; Kamel, S. Maximizing hybrid microgrid system performance: A comparative analysis and optimization using a gradient pelican algorithm. Renew. Energy 2024, 227, 120480. [Google Scholar] [CrossRef]
- Jamal, S.; Pasupuleti, J.; Rahmat, N.A.; Tan, N.M.L. Multi-Objective Optimal Energy Management of Nanogrid Using Improved Pelican Optimization Algorithm. IEEE Access 2024, 12, 41954–41966. [Google Scholar] [CrossRef]
- Chowdary, A.; Rao, S.S. Grid-connected photovoltaic-based microgrid as charging infrastructure for meeting electric vehicle load. Front. Energy Res. 2022, 10, 961734. [Google Scholar] [CrossRef]
- Bilal, M.; Bokoro, P.N.; Sharma, G.; Pau, G. A Cost-Effective Energy Management Approach for On-Grid Charging of Plug-in Electric Vehicles Integrated with Hybrid Renewable Energy Sources. Energies 2024, 17, 4194. [Google Scholar] [CrossRef]
- Jayachandran, M.; Ravi, G. Design and Optimization of Hybrid Micro-Grid System. Energy Procedia 2017, 117, 95–103. [Google Scholar] [CrossRef]
- Borhanazad, H.; Mekhilef, S.; Gounder Ganapathy, V.; Modiri-Delshad, M.; Mirtaheri, A. Optimization of micro-grid system using MOPSO. Renew. Energy 2014, 71, 295–306. [Google Scholar] [CrossRef]
- Maity, A.; Kumar, S.; Pattanayak, P. Hybrid Energy Initiative for University Campus: A Techno-Economic Case Study. In Proceedings of the 2023 International Conference on Advanced and Global Engineering Challenges, AGEC, Surampalem, Kakinada, India, 23–24 June 2023. [Google Scholar]
- Parimalasundar, E.; Aditya, S.S.M.; Sumalatha, P.; Shivani, U.K.; Sree, M.J.; Pavan, S. Multiport Converter and Photovoltaic Cell Fusion for EV Charging Stations. In Proceedings of the 2024 10th International Conference on Advanced Computing and Communication Systems (ICACCS), Coimbatore, India, 14–15 March 2024; pp. 1305–1310. [Google Scholar]
- Sohani, A.; Cornaro, C.; Shahverdian, M.H.; Pierro, M.; Moser, D.; Nižetić, S.; Karimi, N.; Li, L.K.B.; Doranehgard, M.H. Building integrated photovoltaic/thermal technologies in Middle Eastern and North African countries: Current trends and future perspectives. Renew. Sustain. Energy Rev. 2023, 182, 113370. [Google Scholar] [CrossRef]
- Jadeja, R.; Ved, A.; Trivedi, T.; Khanduja, G. Control of Power Electronic Converters in AC Microgrid. In Microgrid Architectures, Control and Protection Methods; Springer International Publishing: Cham, Switzerland, 2019; pp. 329–355. [Google Scholar]
- Ansari, S.; Chandel, A.; Tariq, M. A Comprehensive Review on Power Converters Control and Control Strategies of AC/DC Microgrid. IEEE Access 2021, 9, 17998–18015. [Google Scholar] [CrossRef]
- Daud, A.K.; Ismail, M.S. Design of isolated hybrid systems minimizing costs and pollutant emissions. Renew. Energy 2012, 44, 215–224. [Google Scholar] [CrossRef]
- Maity, A.; Kumar, S.; Pattanayak, P.; Yadav, S. Optimal Design of Hybrid Microgrid for a University Campus using HOMER Software. In Proceedings of the 2024 10th International Conference on Electrical Energy Systems (ICEES), Chennai, India, 22–24 August 2024; pp. 1–6. [Google Scholar]
- Trojovský, P.; Dehghani, M. Pelican Optimization Algorithm: A Novel Nature-Inspired Algorithm for Engineering Applications. Sensors 2022, 22, 855. [Google Scholar] [CrossRef] [PubMed]
| Disclaimer/Publisher’s Note: The statements, opinions and data contained in all publications are solely those of the individual author(s) and contributor(s) and not of MDPI and/or the editor(s). MDPI and/or the editor(s) disclaim responsibility for any injury to people or property resulting from any ideas, methods, instructions or products referred to in the content. |
© 2025 by the authors. Licensee MDPI, Basel, Switzerland. This article is an open access article distributed under the terms and conditions of the Creative Commons Attribution (CC BY) license (https://creativecommons.org/licenses/by/4.0/).


