1. Introduction
ARDUINO is an open-source platform designed for the development of a wide range of embedded systems and interactive projects. It integrates both hardware and software components, enabling users to easily create devices capable of interacting with their environment through sensors and control buttons. The core board features a power supply unit and a microcontroller, which serves as the central processing unit. Various types of sensors—both analog and digital—provide input data to the controller for further processing. Programming is carried out within the dedicated ARDUINO Integrated Development Environment (IDE). One of the major advantages of the ARDUINO platform lies in its accessibility and ease of use for beginners, while simultaneously offering sufficient power and flexibility to meet the demands of more advanced users. Due to the extensive availability of open-source libraries and its low-cost hardware, the ARDUINO ecosystem is widely adopted by hobbyists, educators, and engineers alike.
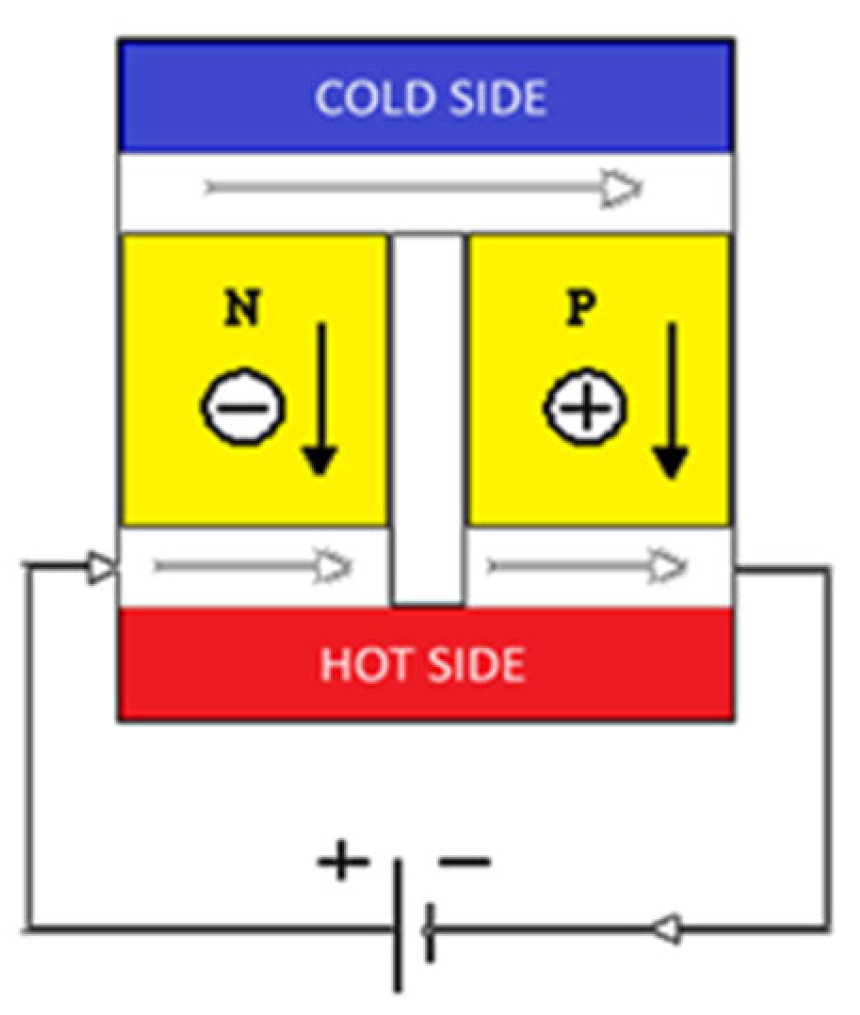
The Peltier effect is a thermoelectric phenomenon wherein the passage of an electric current through the junction between two dissimilar materials results in the absorption or release of heat. Discovered by Jean-Charles Peltier in 1834, the effect is attributed to the transfer of energy by charge carriers—electrons or holes—as they move between distinct energy states in different materials [
1,
2,
3,
4]. Depending on the differences in electronic configurations and energy band structures of the materials involved, the carriers either absorb or emit energy, which manifests as localized cooling or heating at the junction. The internal structure of a typical thermoelectric module is illustrated in
Figure 1.
The aim of the paper is to present an approach for the automatic acquisition, collection, and processing of data through custom-developed software based on the ARDUINO platform. Additionally, the work focuses on analyzing the physical properties of the Peltier element and outlining the methodology for experimentally determining its efficiency. The developed measurement and monitoring system is intended to support the educational process of students across various academic disciplines and engineering specializations.
2. Materials and Methods
The most widely used materials in thermoelectric applications are doped semiconductor compounds and solid solutions, where the ability to control thermoelectric properties enables the identification of conditions under which the figure of merit reaches its maximum value. Typical representatives of efficient thermoelectric materials for p-type semiconductors include Sb
2Te
3, SbTe, PbTeSe, CeFe
4Sb
12, and various derivatives of these compounds doped with additional elements. For n-type semiconductors, commonly used materials include Bi
2Te
3, PbTe, CoSb
3, La
3Te
4, and SiGe, as well as their respective doped variations [
5,
6,
7].
When an electric current flows through the junction of two dissimilar materials, the charge carriers transition between different energy bands. This results in a change in their energy state, which manifests as either the release or absorption of heat at the point of contact. The resulting heat flux is directly proportional to the magnitude of the electric current. This relationship is expressed by (1) [
4].
where
Q—heat energy transferred;
I—electric current flowing through the element;
Π—Peltier coefficient.
The Peltier coefficient is a material-specific parameter that characterizes a given pair of thermoelectric materials. Physically, it represents the amount of heat transported by charge carriers per unit electric charge as it passes through the material.
The electronic density of states defines the number of available energy levels within a given energy interval, while the Fermi–Dirac distribution determines the probability that charge carriers occupy specific energy states at a given temperature [
8,
9,
10]. In semiconductors under steady-state conditions, electrons fill all energy states below a certain level known as the Fermi level, and the probability of occupation of states above it decreases exponentially. However, in thermoelectric transport, it is the carriers with energies near the Fermi level that predominantly contribute to heat transfer. These carriers play a crucial role in determining the efficiency of the thermoelectric process, which can be considered in two aspects—cooling and heating [
11,
12].
The cooling efficiency, expressed as the Coefficient of Performance (COP), is defined by the following (2)
where
—heat absorbed from the cold side
—input electrical power.
The heat flux on the cold side of the thermoelectric element can be calculated as follows (3)
where
α—material-specific coefficient, equal to 0.08 for the investigated element;
—temperature on the cold side of the element;
—electric current flowing through the element;
—internal electrical resistance, determined based on the applied voltage using Ohm’s law.
The Coefficient of Performance during heating is defined as (4)
where
—heat released on the hot side of the element.
To implement the experimental setup, a Peltier element TEC1-12706 was used. Two temperature sensors were attached directly to the element, while a third sensor was employed to monitor the ambient temperature. The electrical circuit includes a module for measuring both the current flowing through the Peltier element and the voltage applied across it. The collected data are fed into the analog and digital inputs of the ARDUINO controller for acquisition and processing. A custom-developed program executes the measurement procedure, as illustrated in
Figure 2.
The experimental investigations presented in this study were conducted using two approaches.
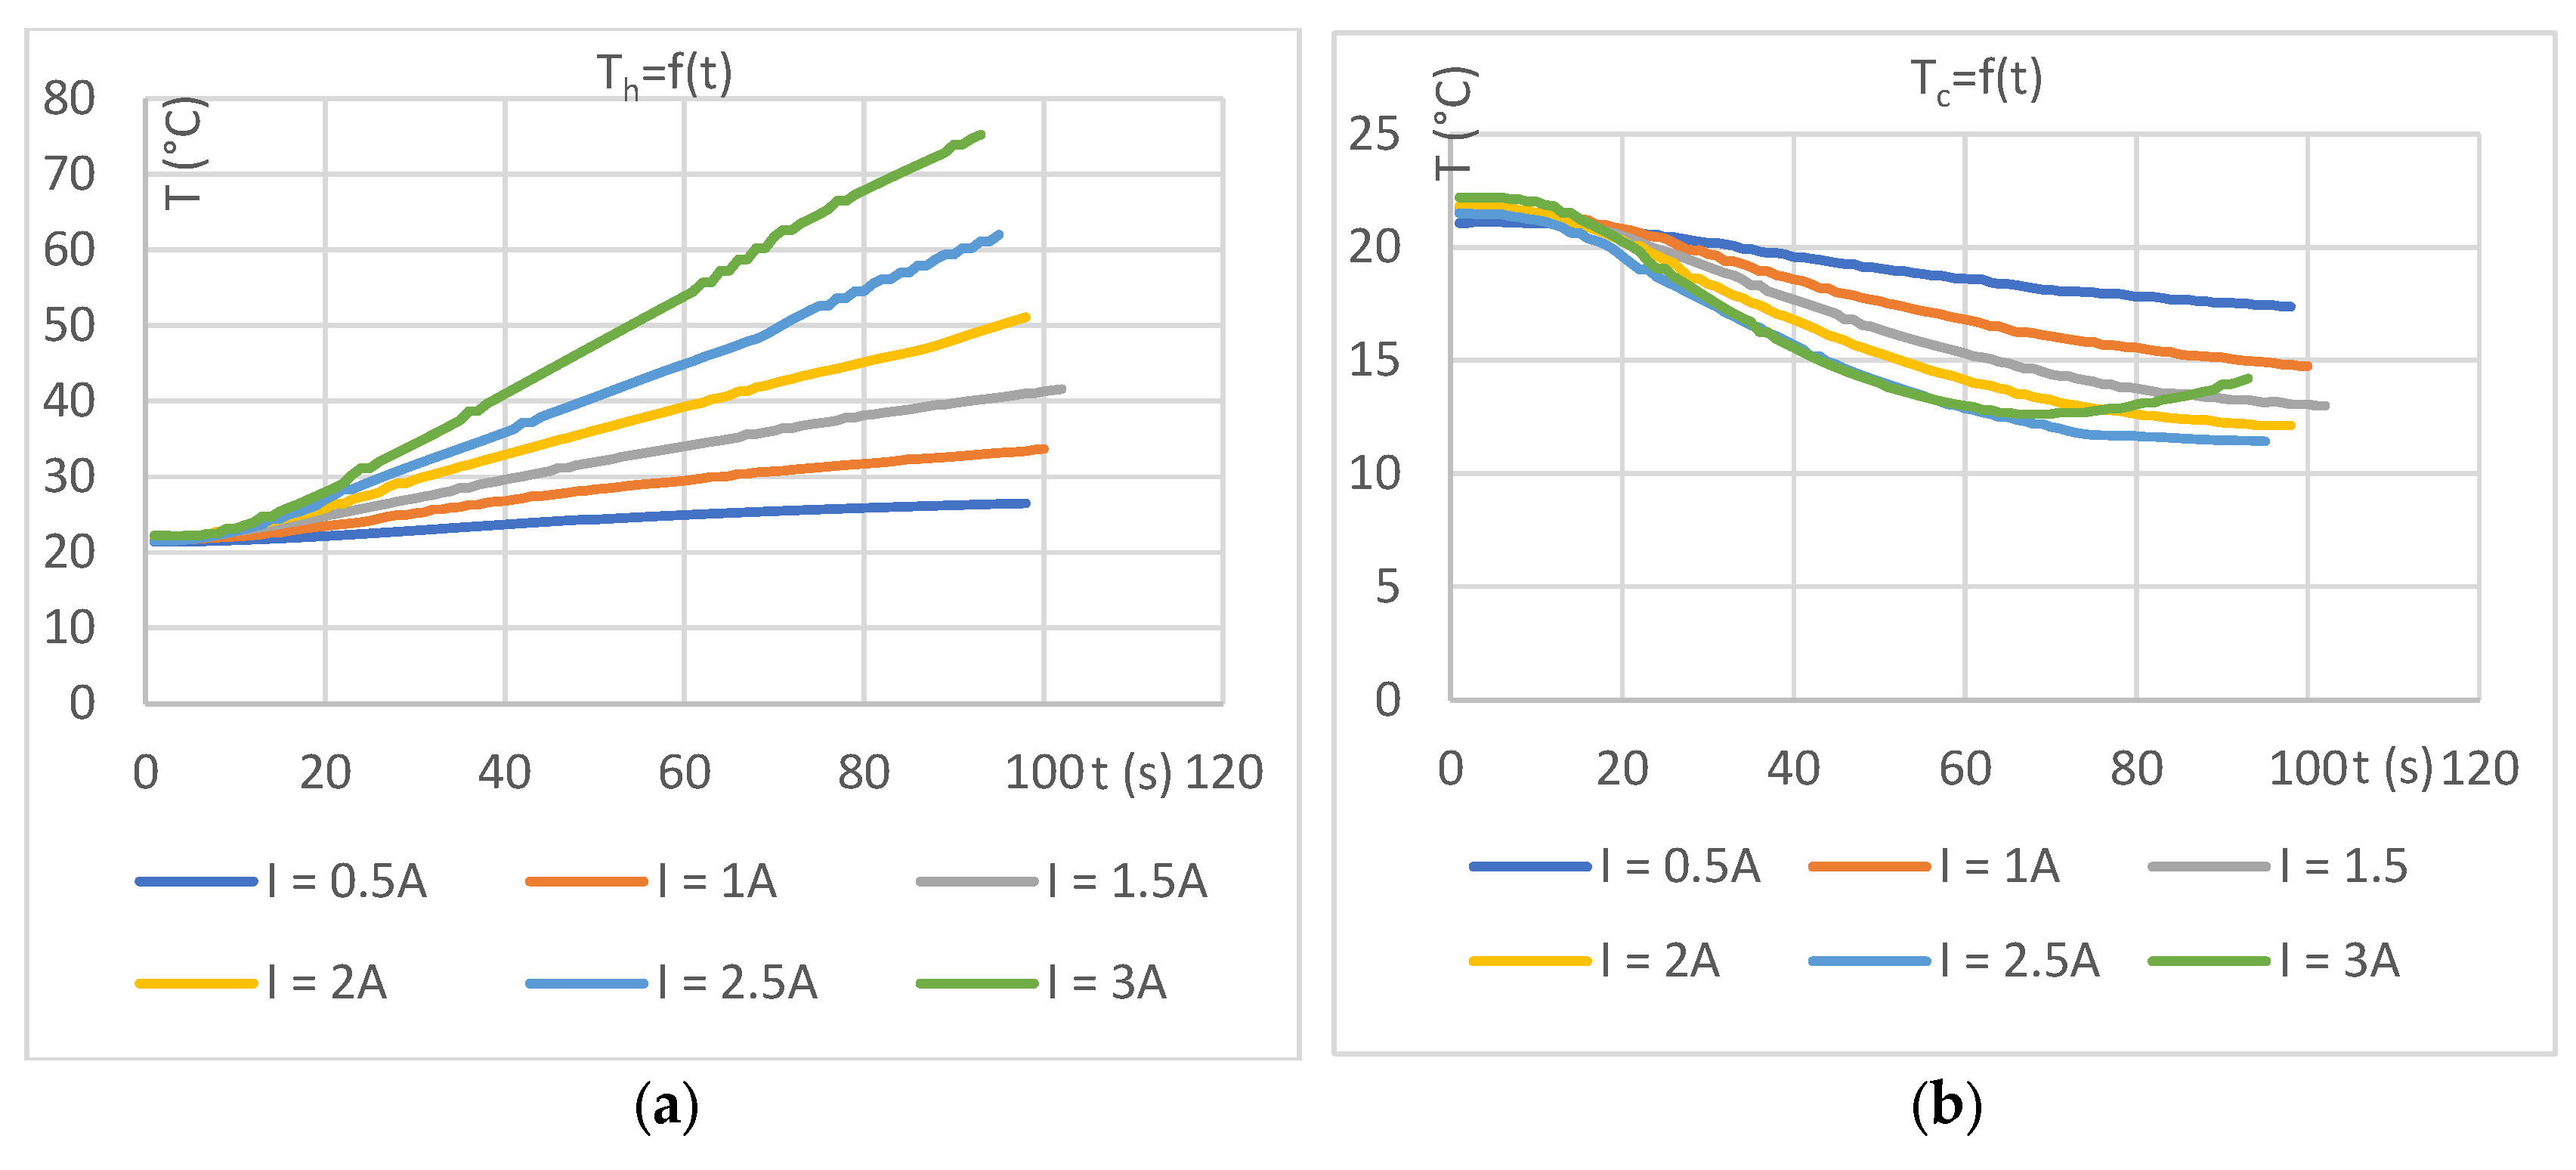
2.1. At a Constant Current
Figure 3 and
Figure 4 show the time-dependent temperature profiles under various constant current values applied to the Peltier element. The graphs illustrate the temperature evolution on both the hot and cold sides, as well as the differential temperature between them.
The experimental relationships obtained between the electric current and the resulting thermal effect exhibit an approximately linear behavior. This linearity facilitates easier system calibration and improves the predictability of the device’s performance.
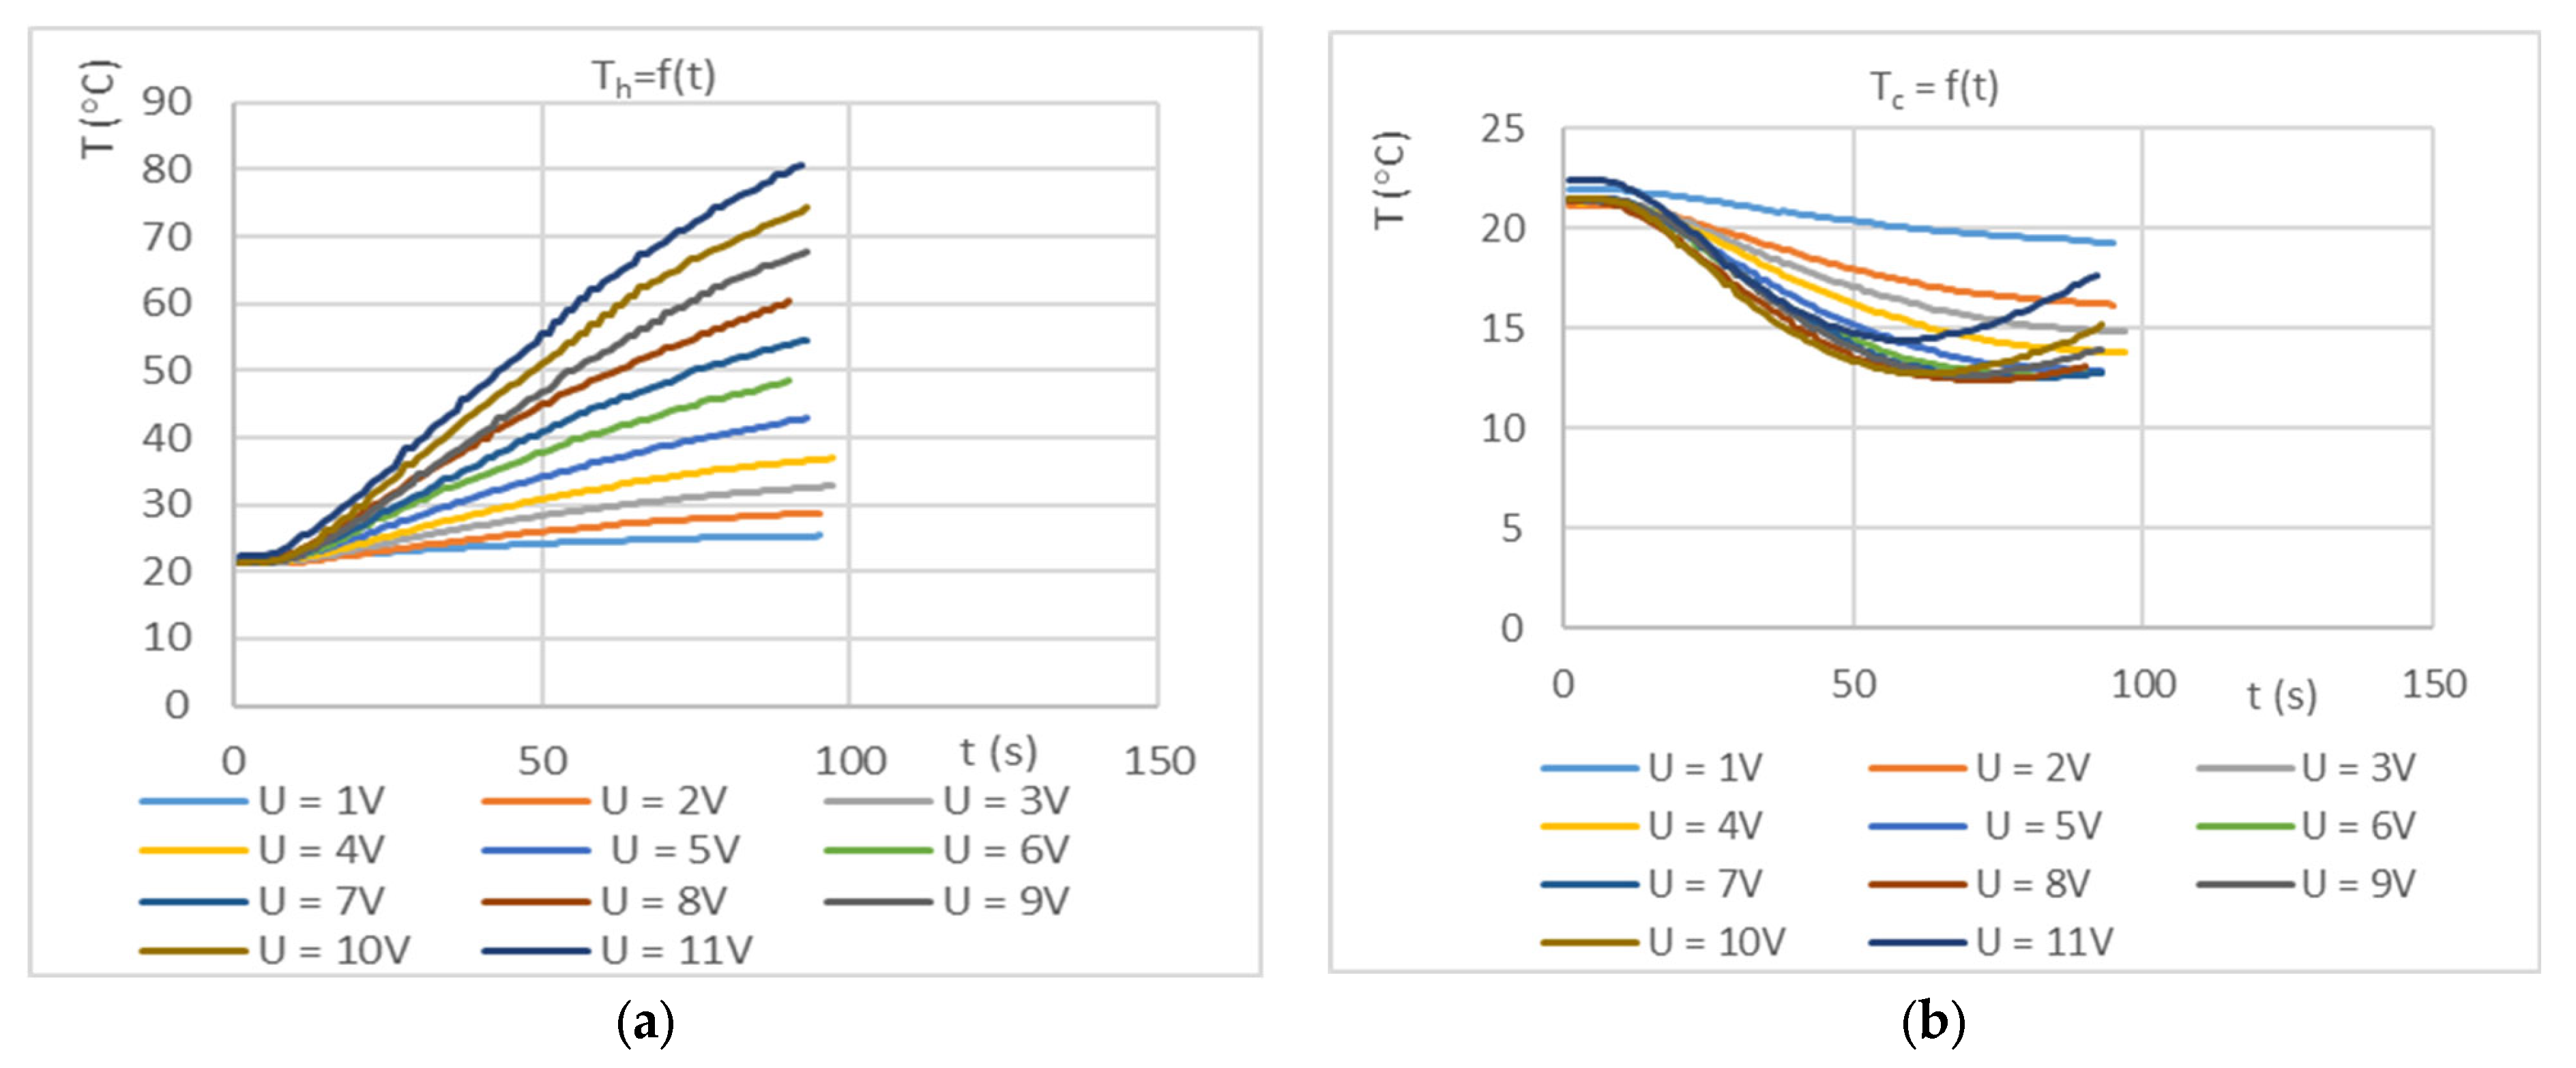
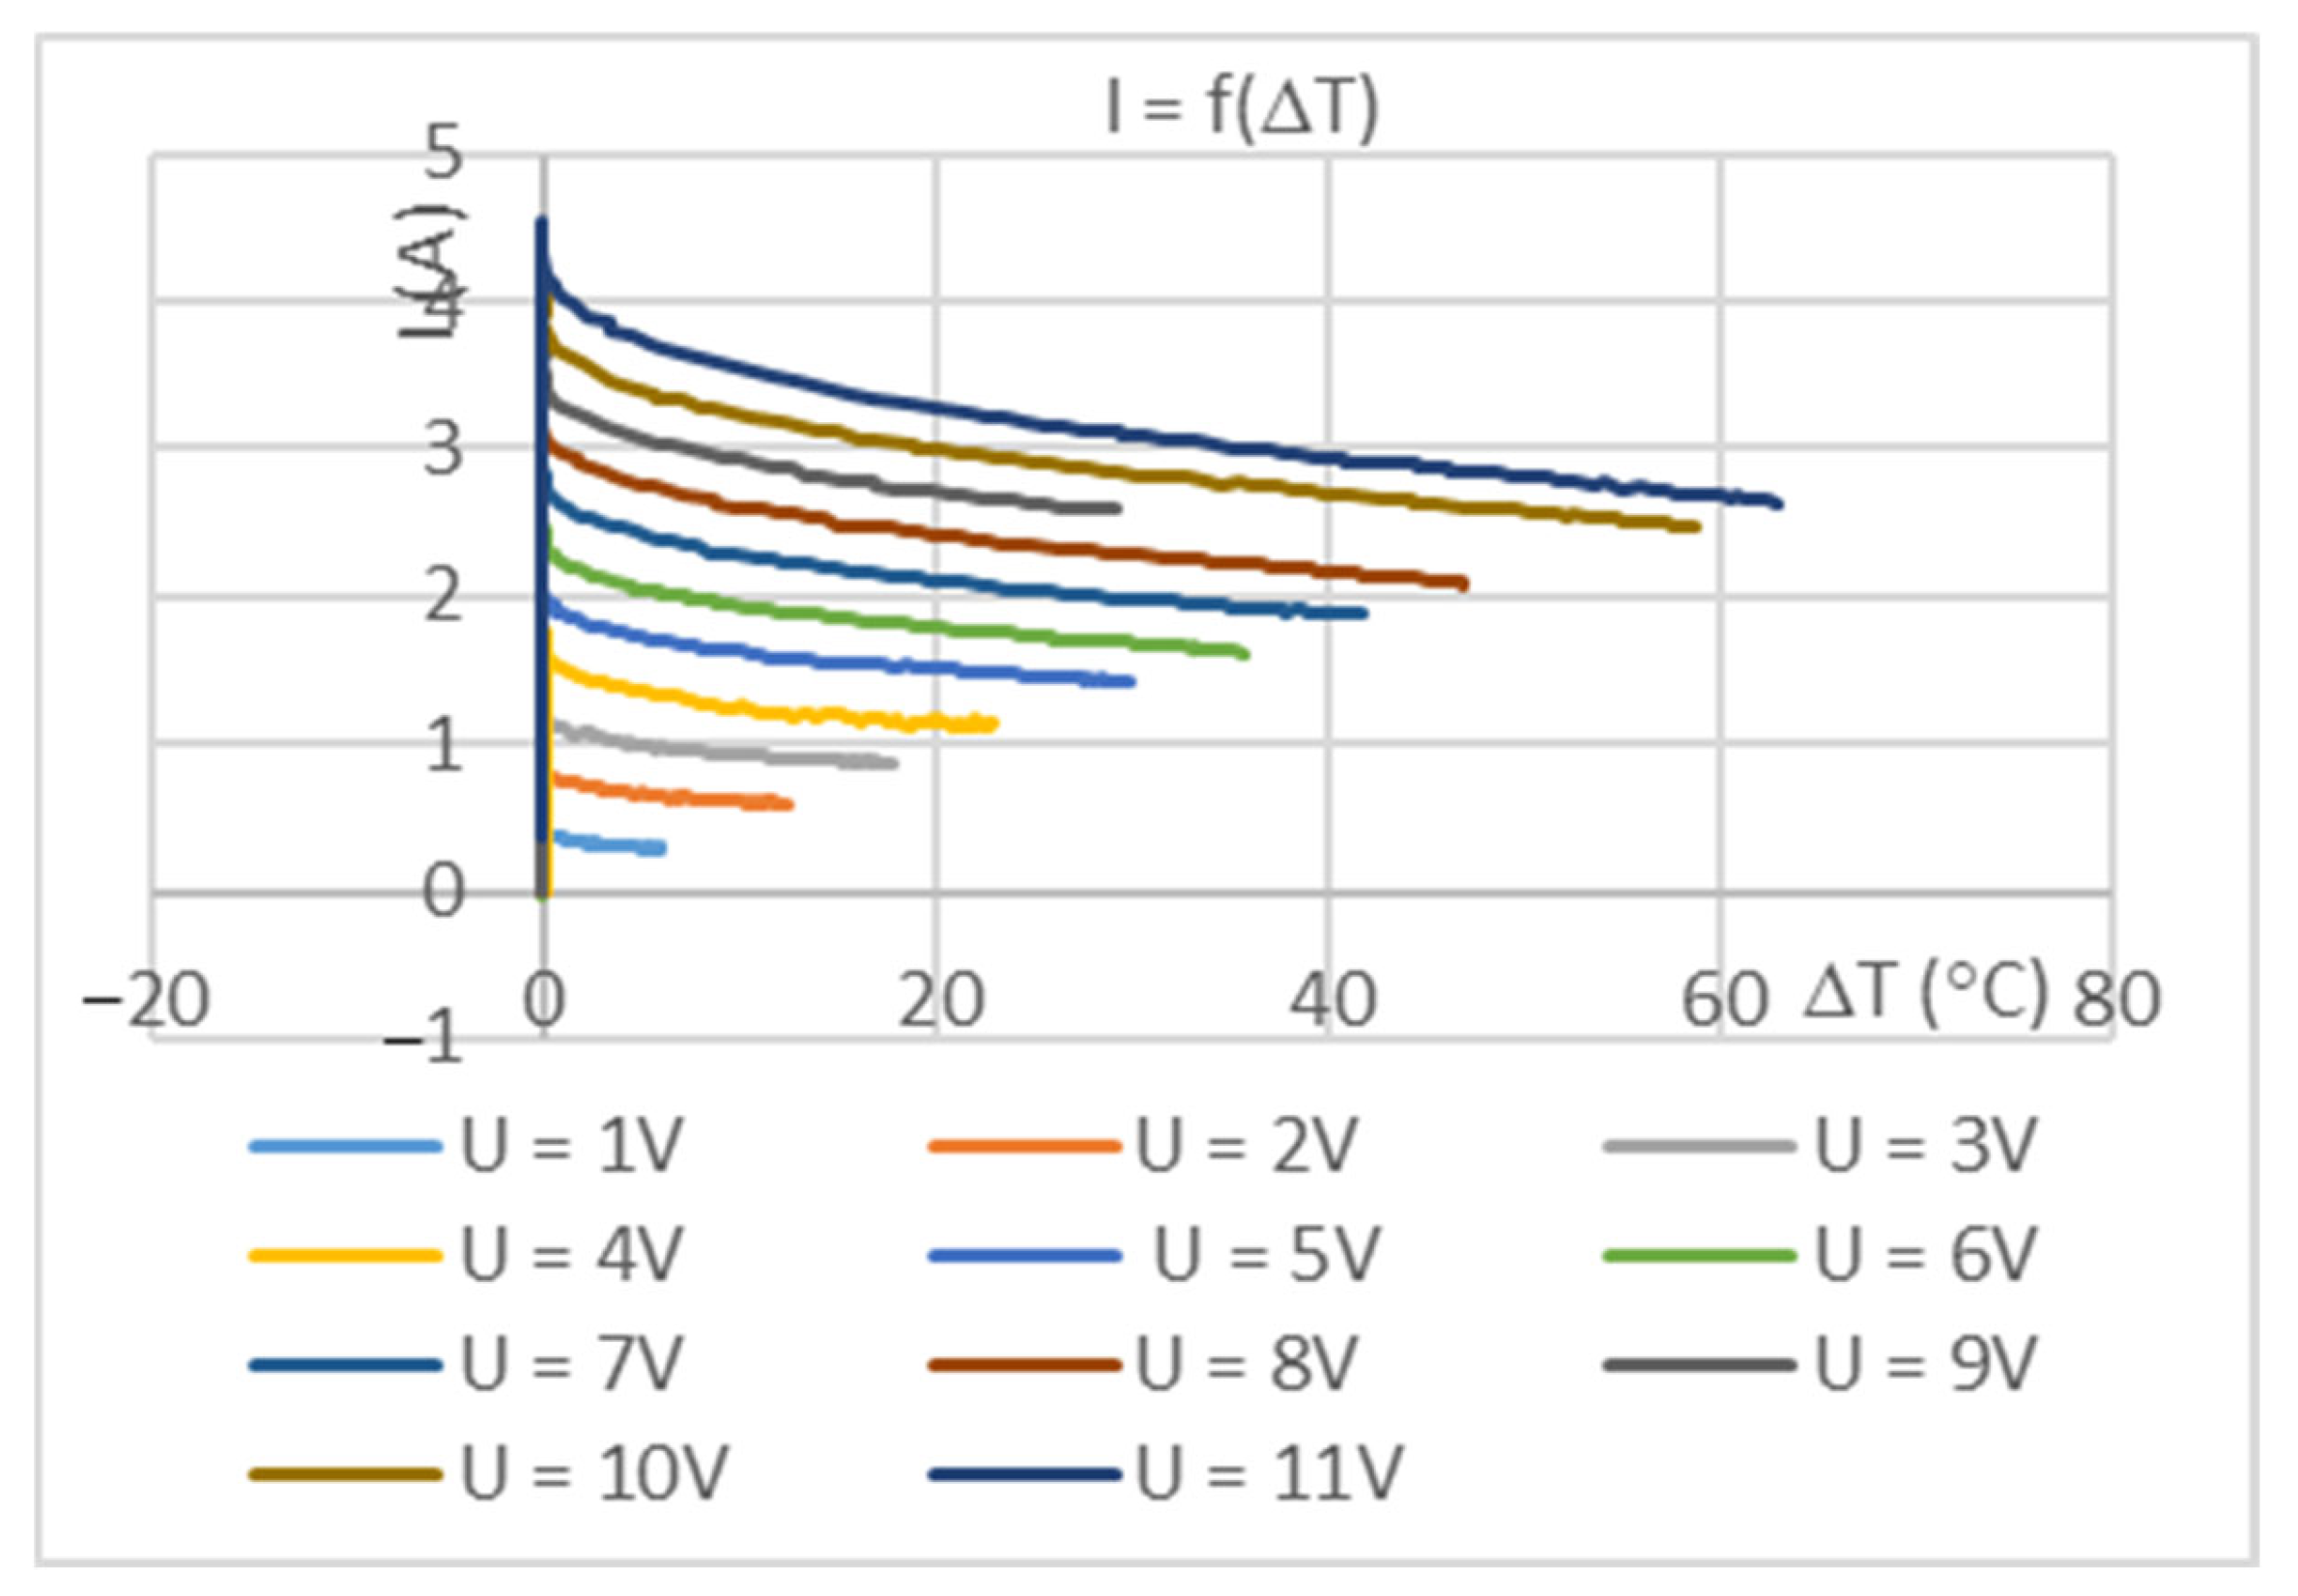
2.2. At a Constant Voltage
Figure 5 and
Figure 6 graphically present the temperature evolution over time under various constant voltage values applied to the Peltier element, showing the temperatures on the hot and cold sides, as well as the differential temperature between them.
According to (1), the temperature variation is directly dependent on the electric current. In this method of investigation, the current continuously fluctuates, which results in less stable operation, less predictable measurements, and increased difficulty in controlling the cooling and heating processes.
3. Results and Discussion
3.1. Graphs at a Constant Current
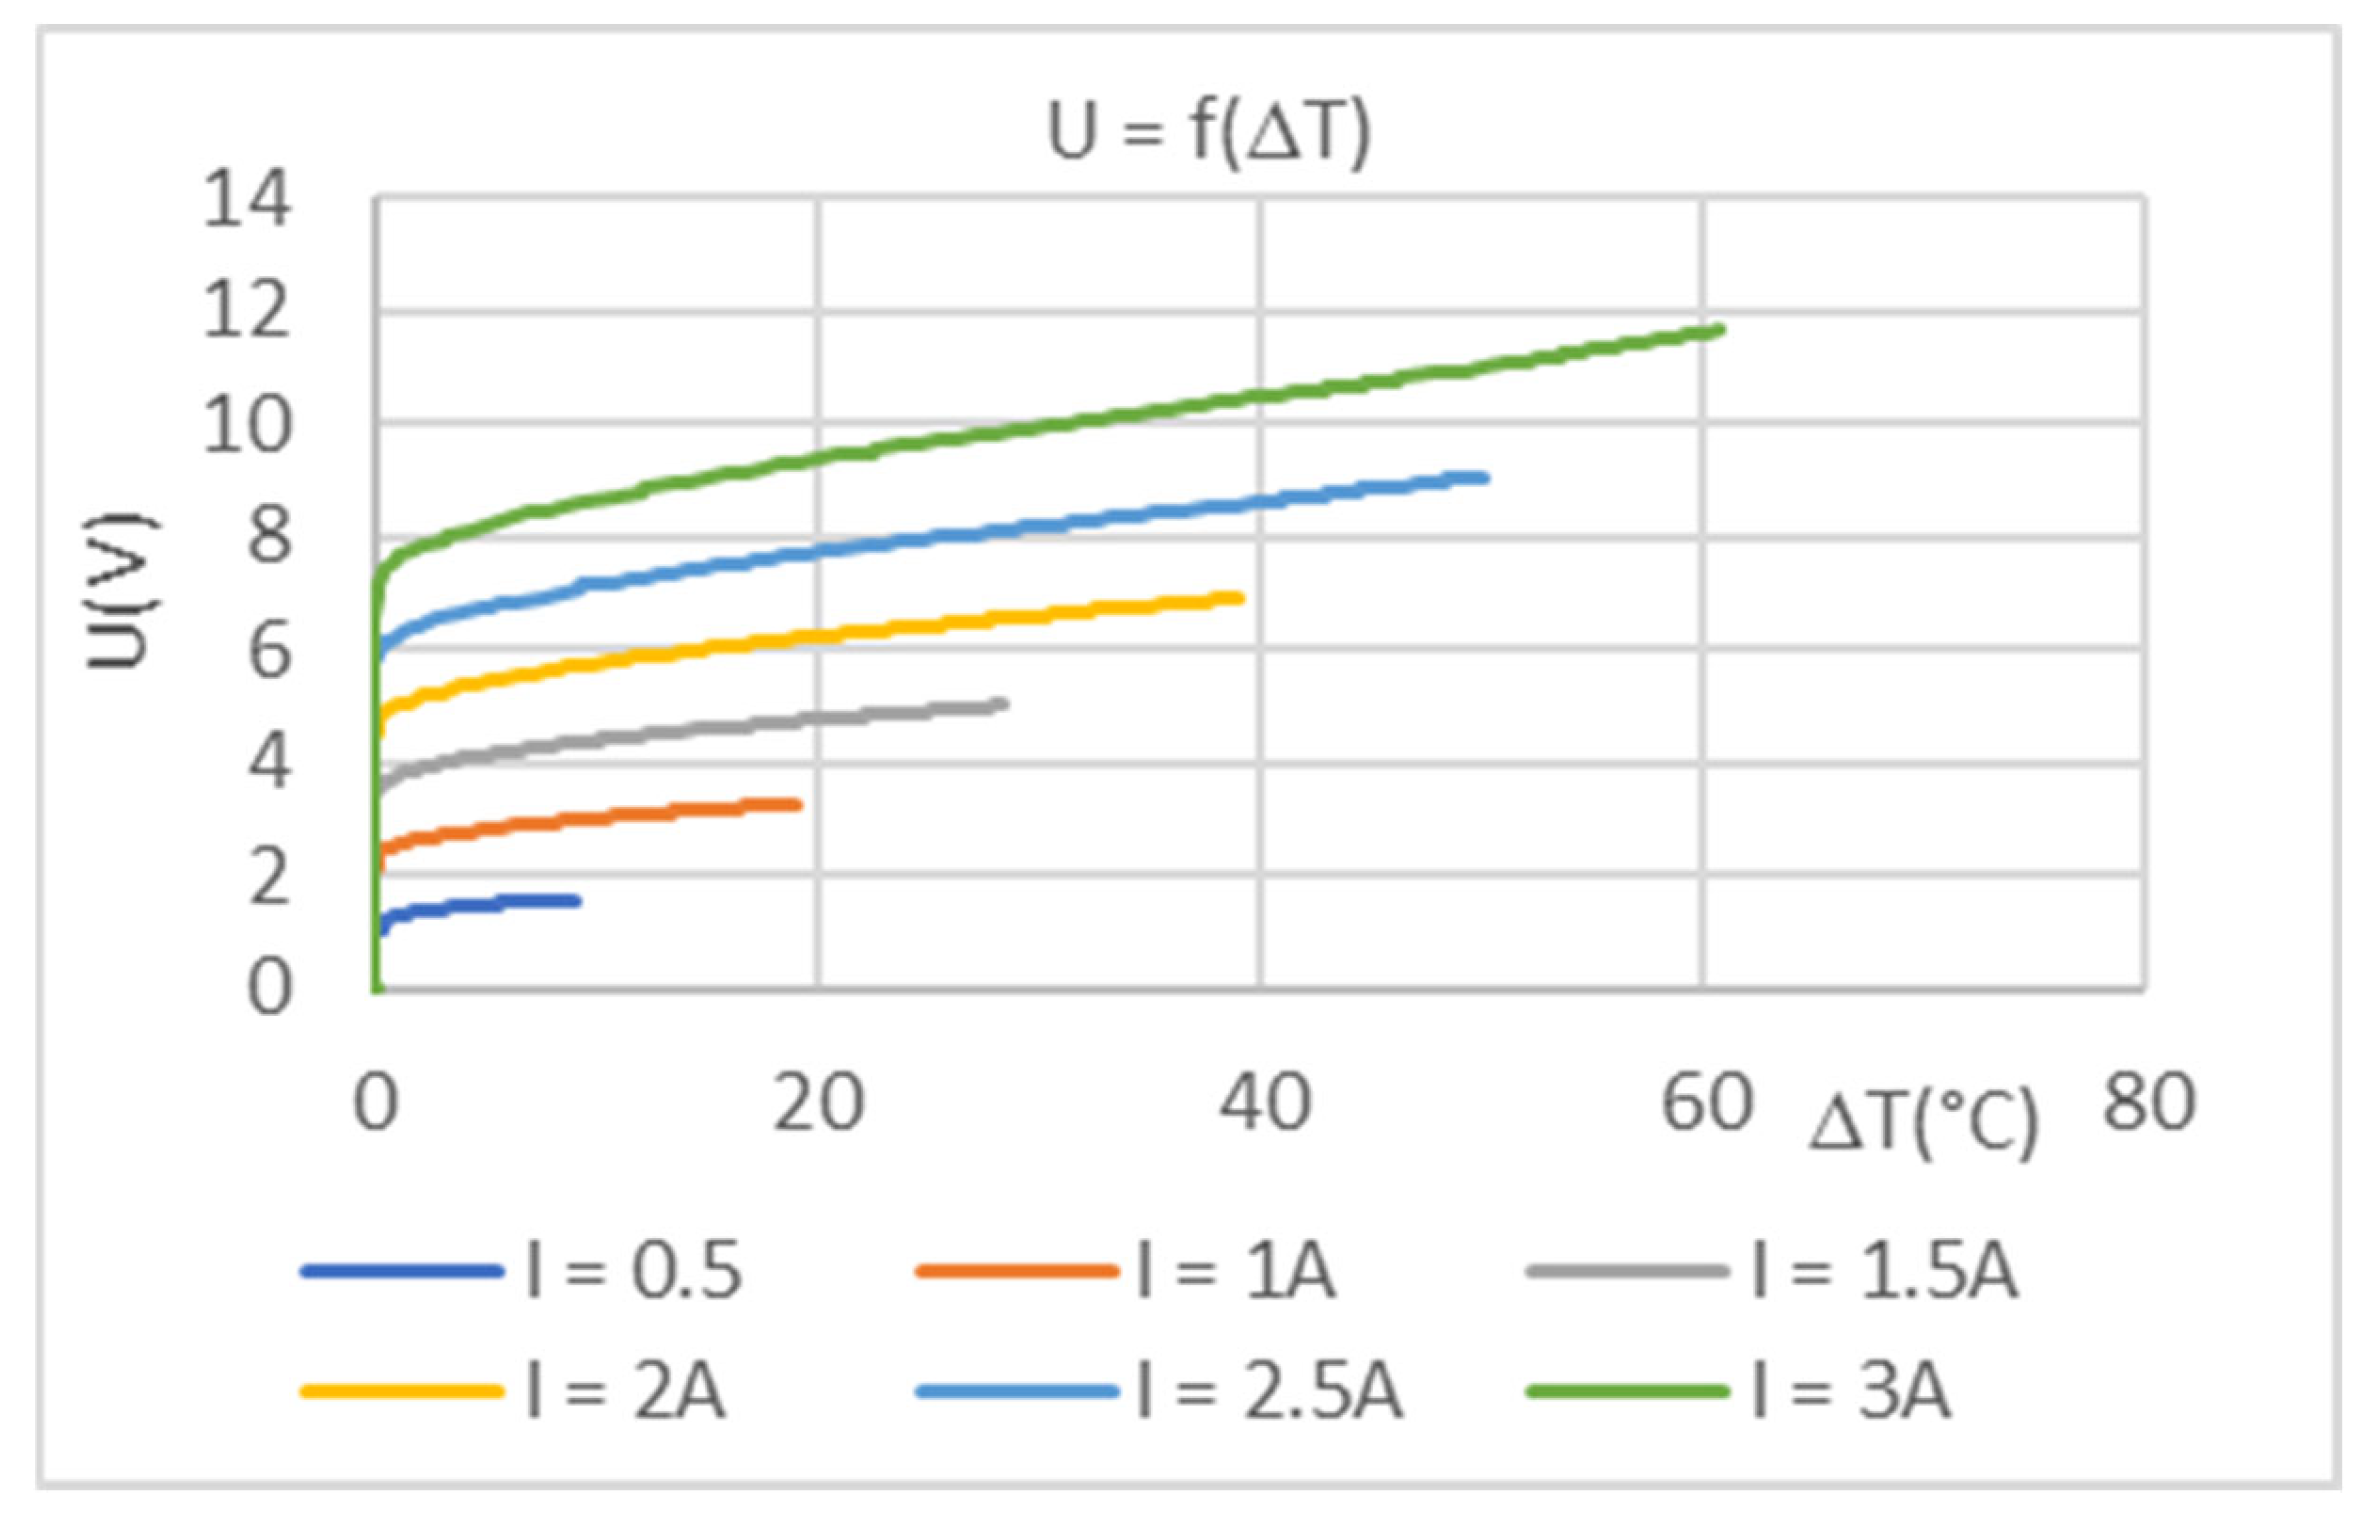
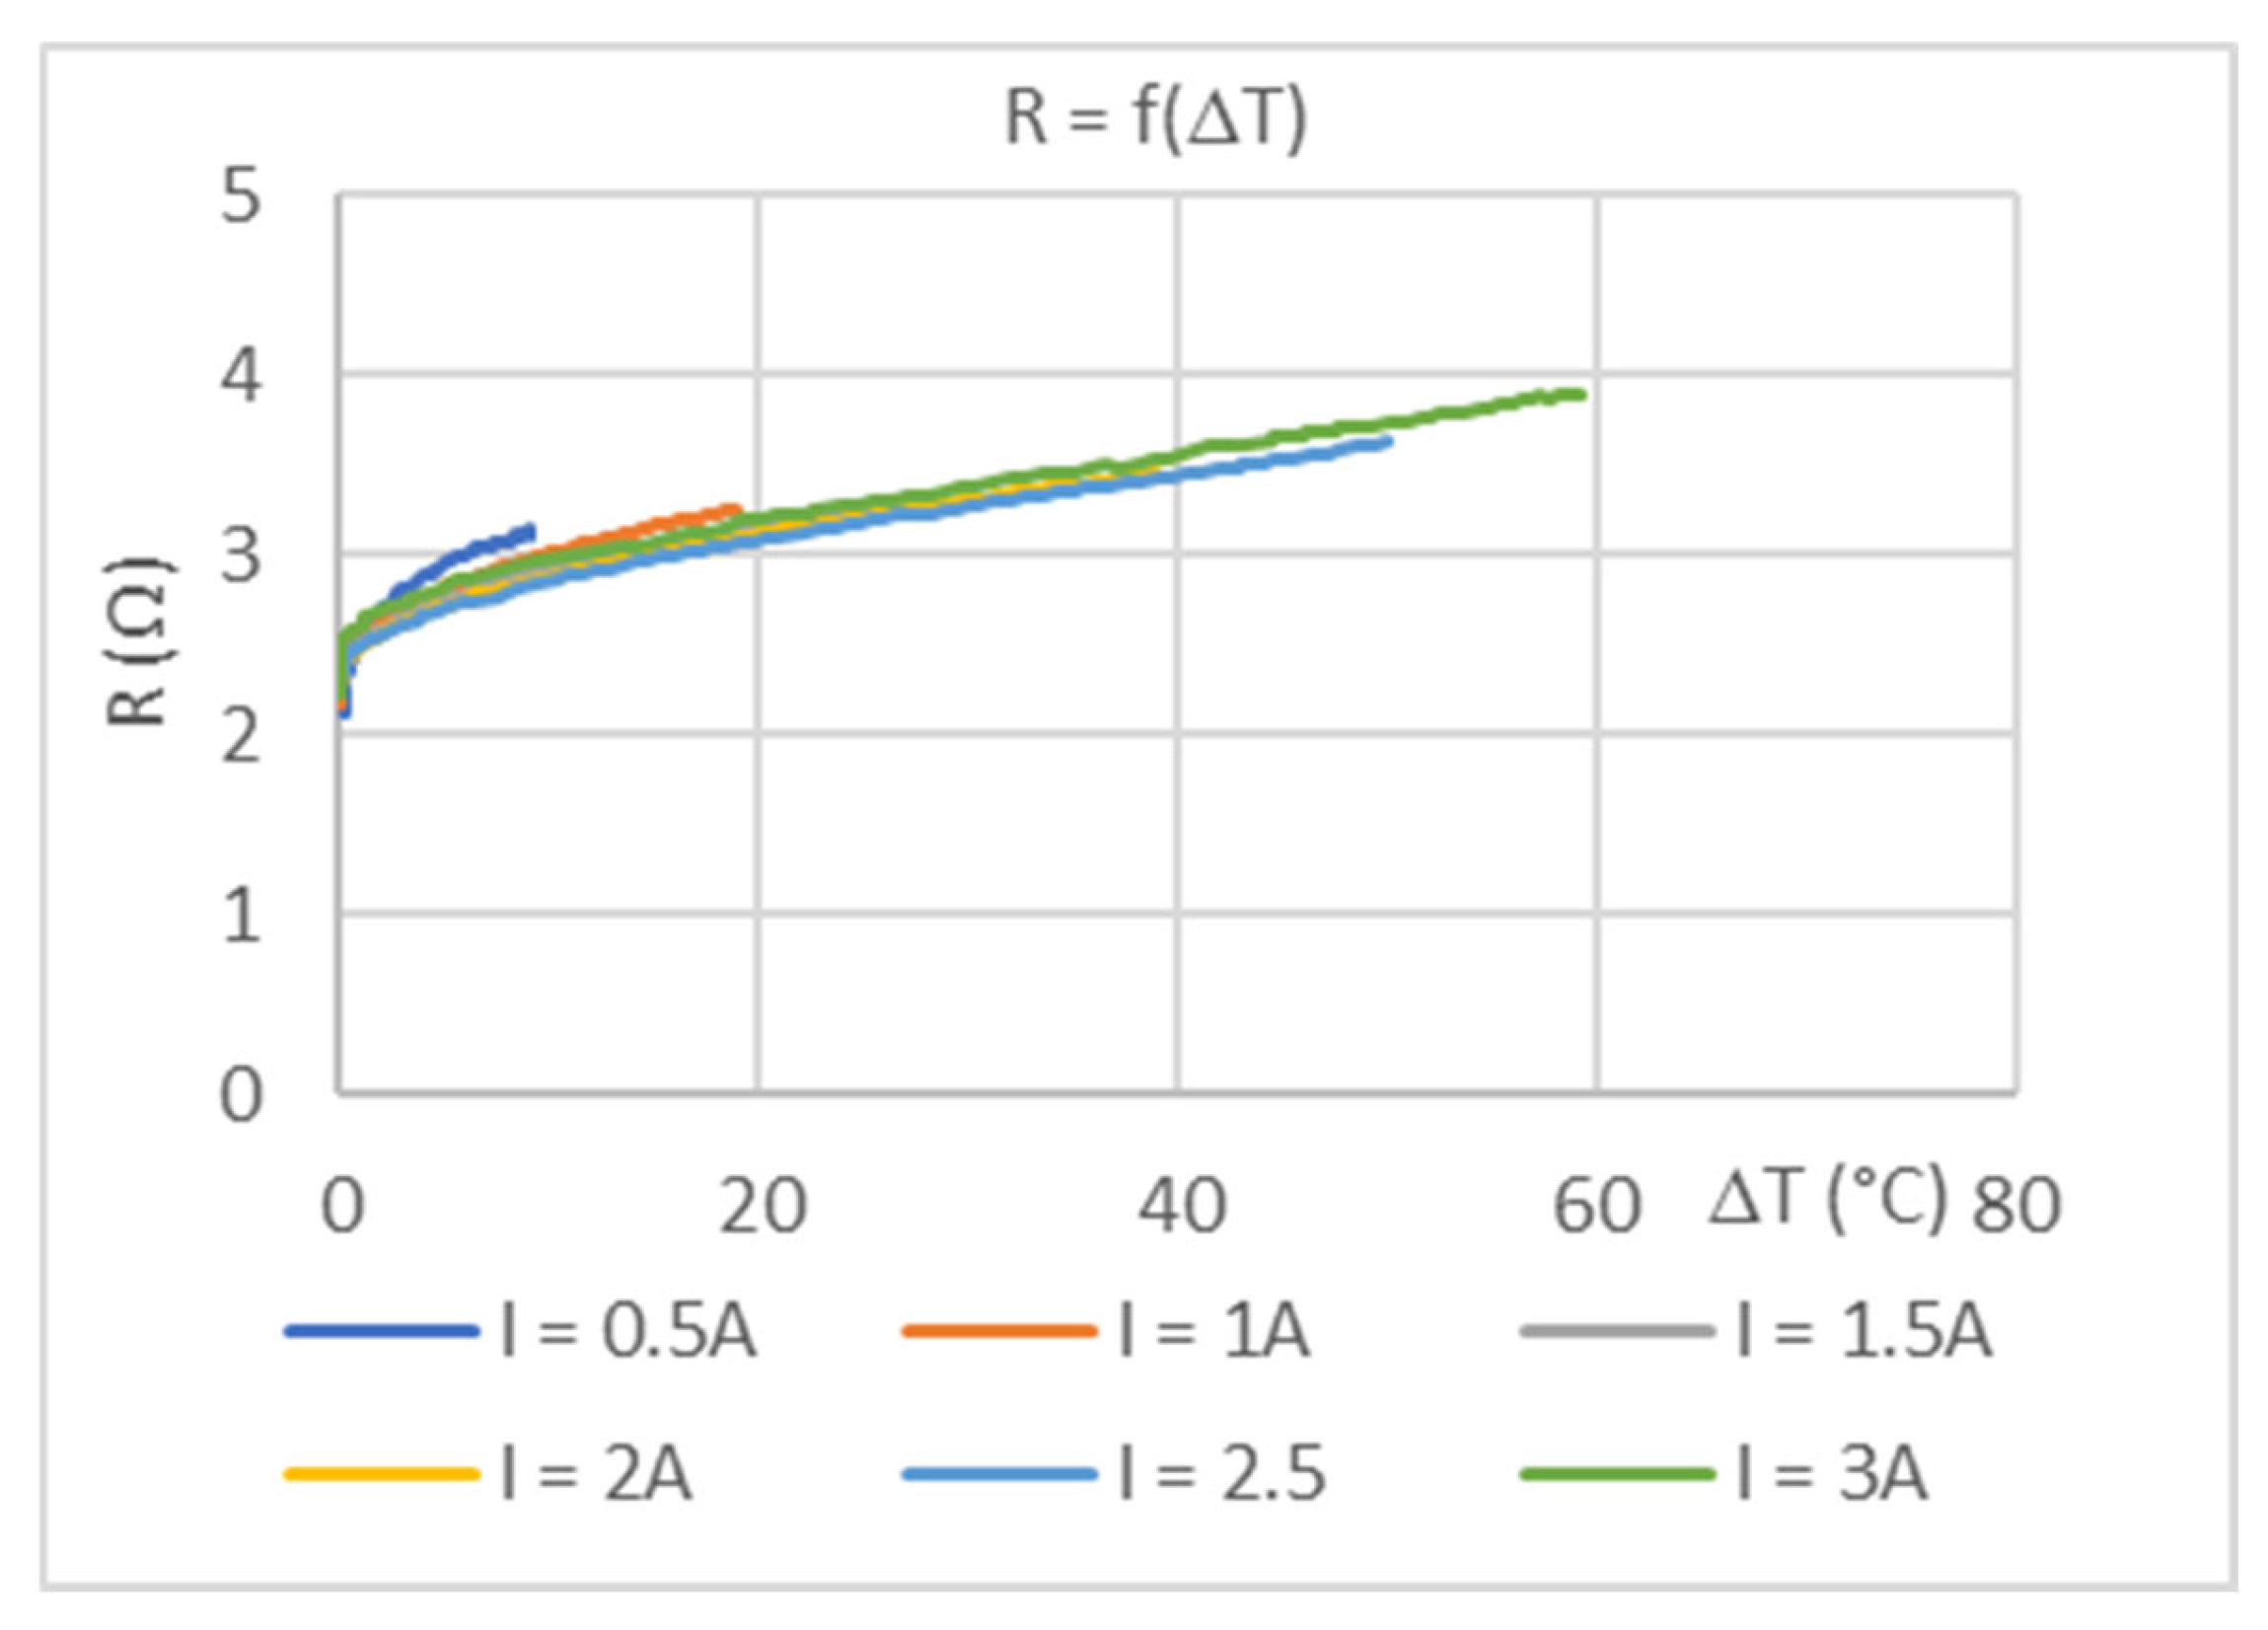
Figure 7 shows the dependence of the calculated internal electrical resistance R of the thermoelectric module TEC1-12706 on the temperature difference ΔT (between the hot and cold sides of the module) under various current levels.
At low temperature differences (0–20 °C), a steeper gradient is observed, which can be attributed to the increased sensitivity of Bi2Te3 within this temperature range.
The observed increase in resistance with rising temperature difference is due to changes in the mobility of charge carriers (electrons and holes), which is characteristic of semiconductor materials. In the case of Bi2Te3, elevated temperatures lead to enhanced phonon activity and, consequently, increased carrier scattering, resulting in higher electrical resistance.
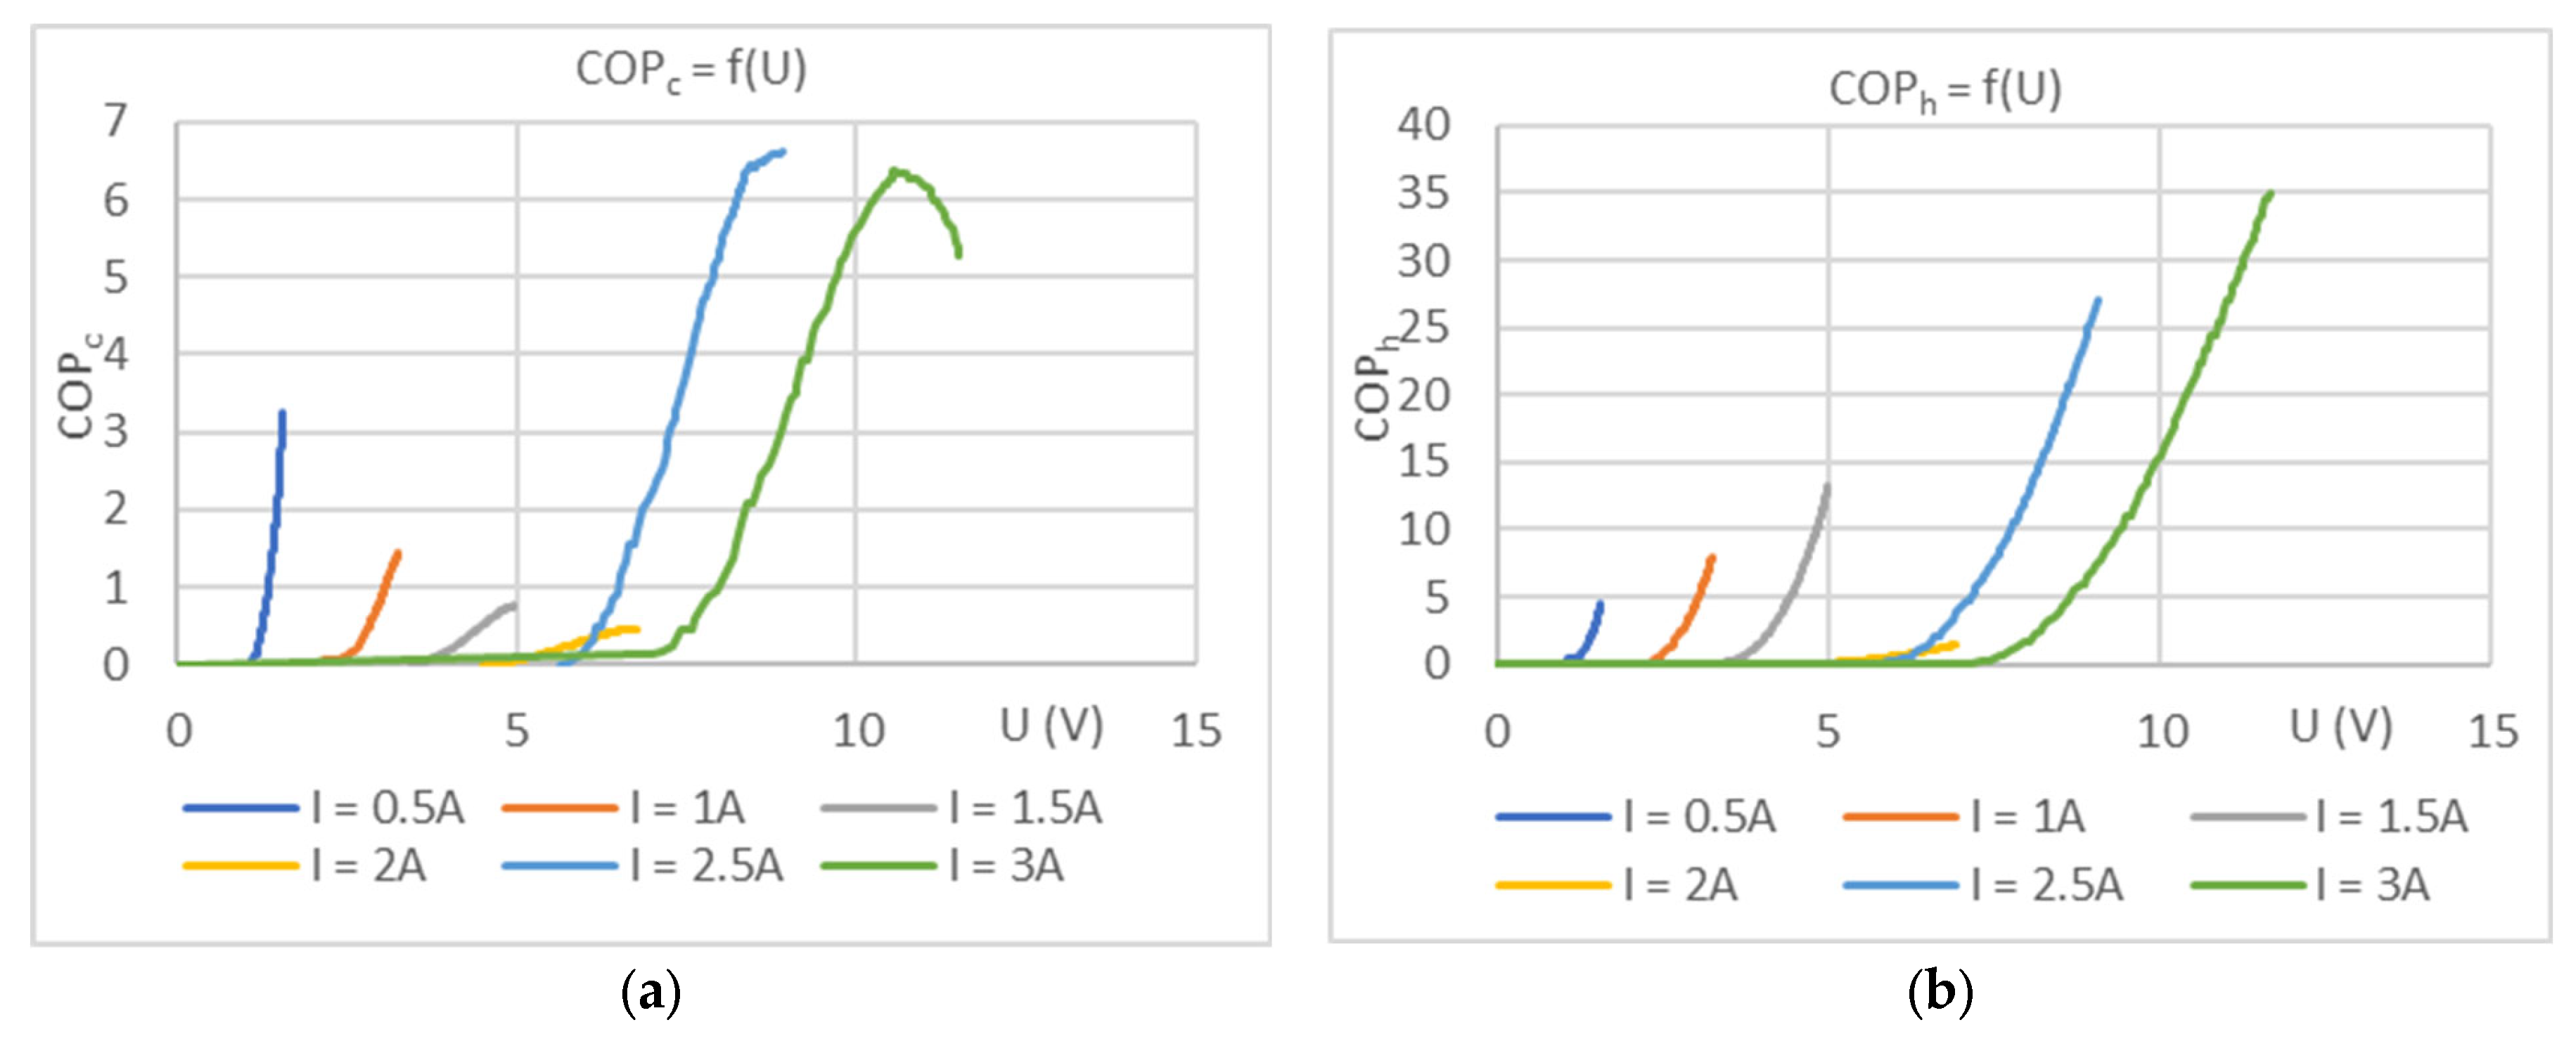
Figure 8 presents the dependencies of the Coefficient of Performance for cooling (COP
c) and the thermal efficiency coefficient on the hot side (COP
h) as functions of the applied voltage, for various fixed values of electric current flowing through the Peltier element.
At current levels between 0.5 and 1 A, COP
c (
Figure 8a) increases, along with the applied voltage at a fixed current. COP
c reaches its maximum within the voltage range of 3–6 V. At higher current levels (2–3 A), the efficiency decreases significantly, and the COP maxima shift toward higher voltages (8–10 V), but with lower values.
The highest cooling efficiency is achieved at a current of 0.5 A and a voltage between 4 and 5 V, where COPc exceeds 3. This confirms that the thermoelectric module operates most efficiently at low current levels, as higher currents lead to increased internal resistance losses, resulting in excessive heating and reduced cooling performance.
The most efficient operating range is found to be within 0.5–1 A and 3–5 V.
Figure 8b shows the dependence of COP
h on the applied voltage. The heating efficiency increases almost exponentially with increasing voltage.
At a current of 3 A and voltages above 10 V, COPh exceeds values of 30, indicating significant thermal power generation on the hot side of the element. At lower current levels, COPh also increases with voltage, but reaches lower maximum values.
This behavior is expected, as higher electrical input power leads to increased heat generation on the hot side—not only due to the Peltier effect, but also as a result of Joule heating losses.
While heat output becomes more efficient at higher currents and voltages, this also leads to greater energy losses and an increased risk of thermal overload or overheating of the module.
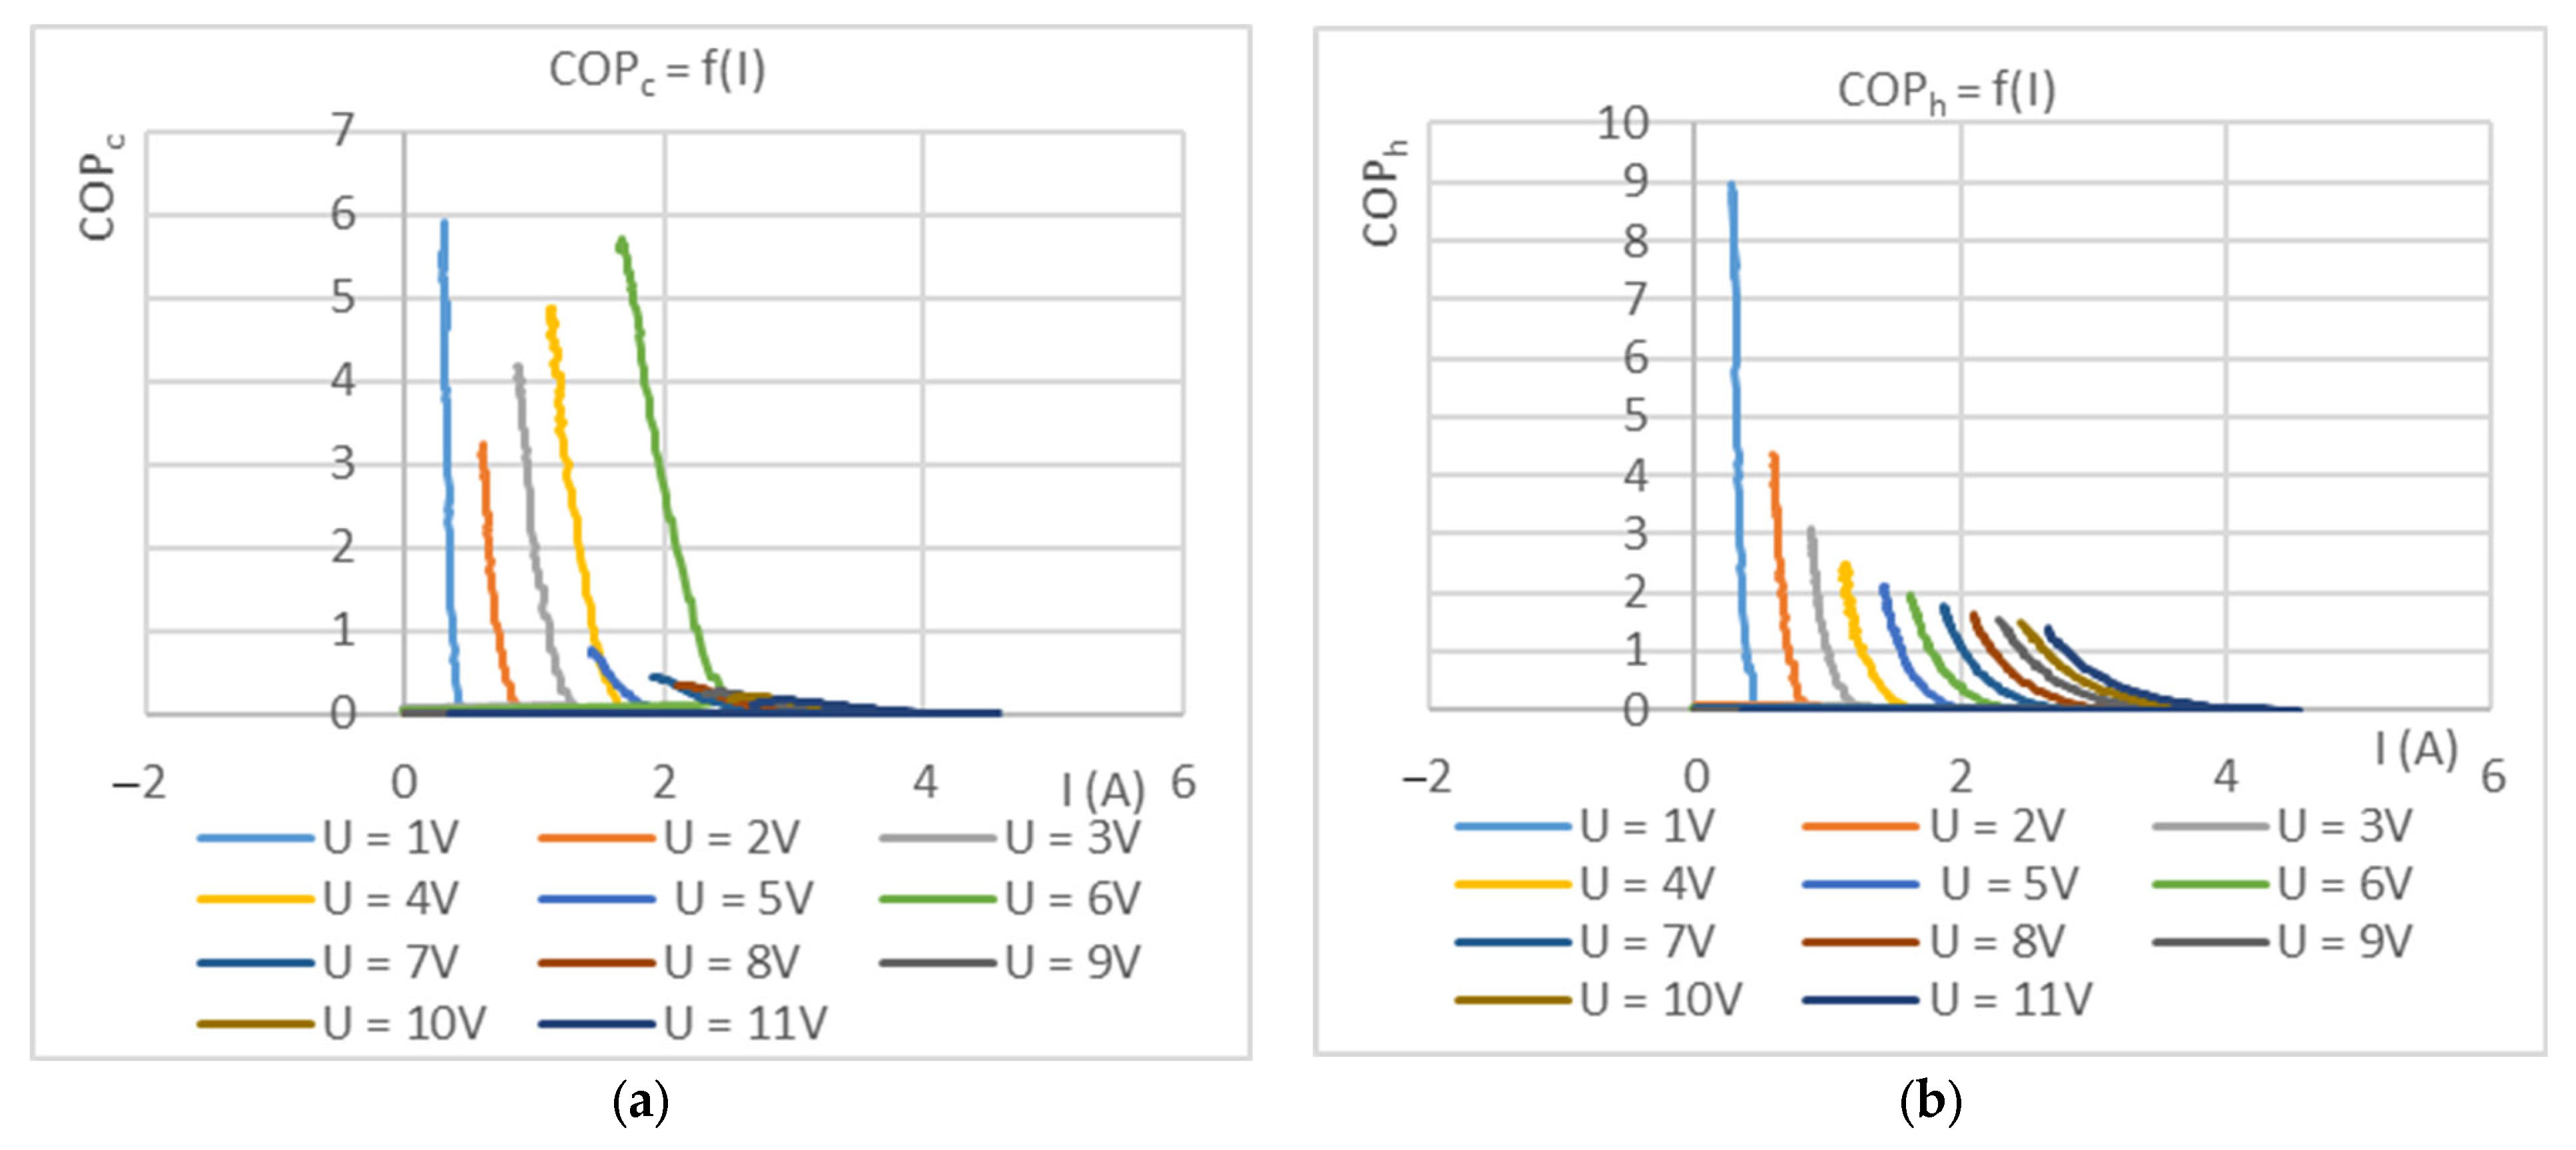
3.2. Graphs at a Constant Voltage
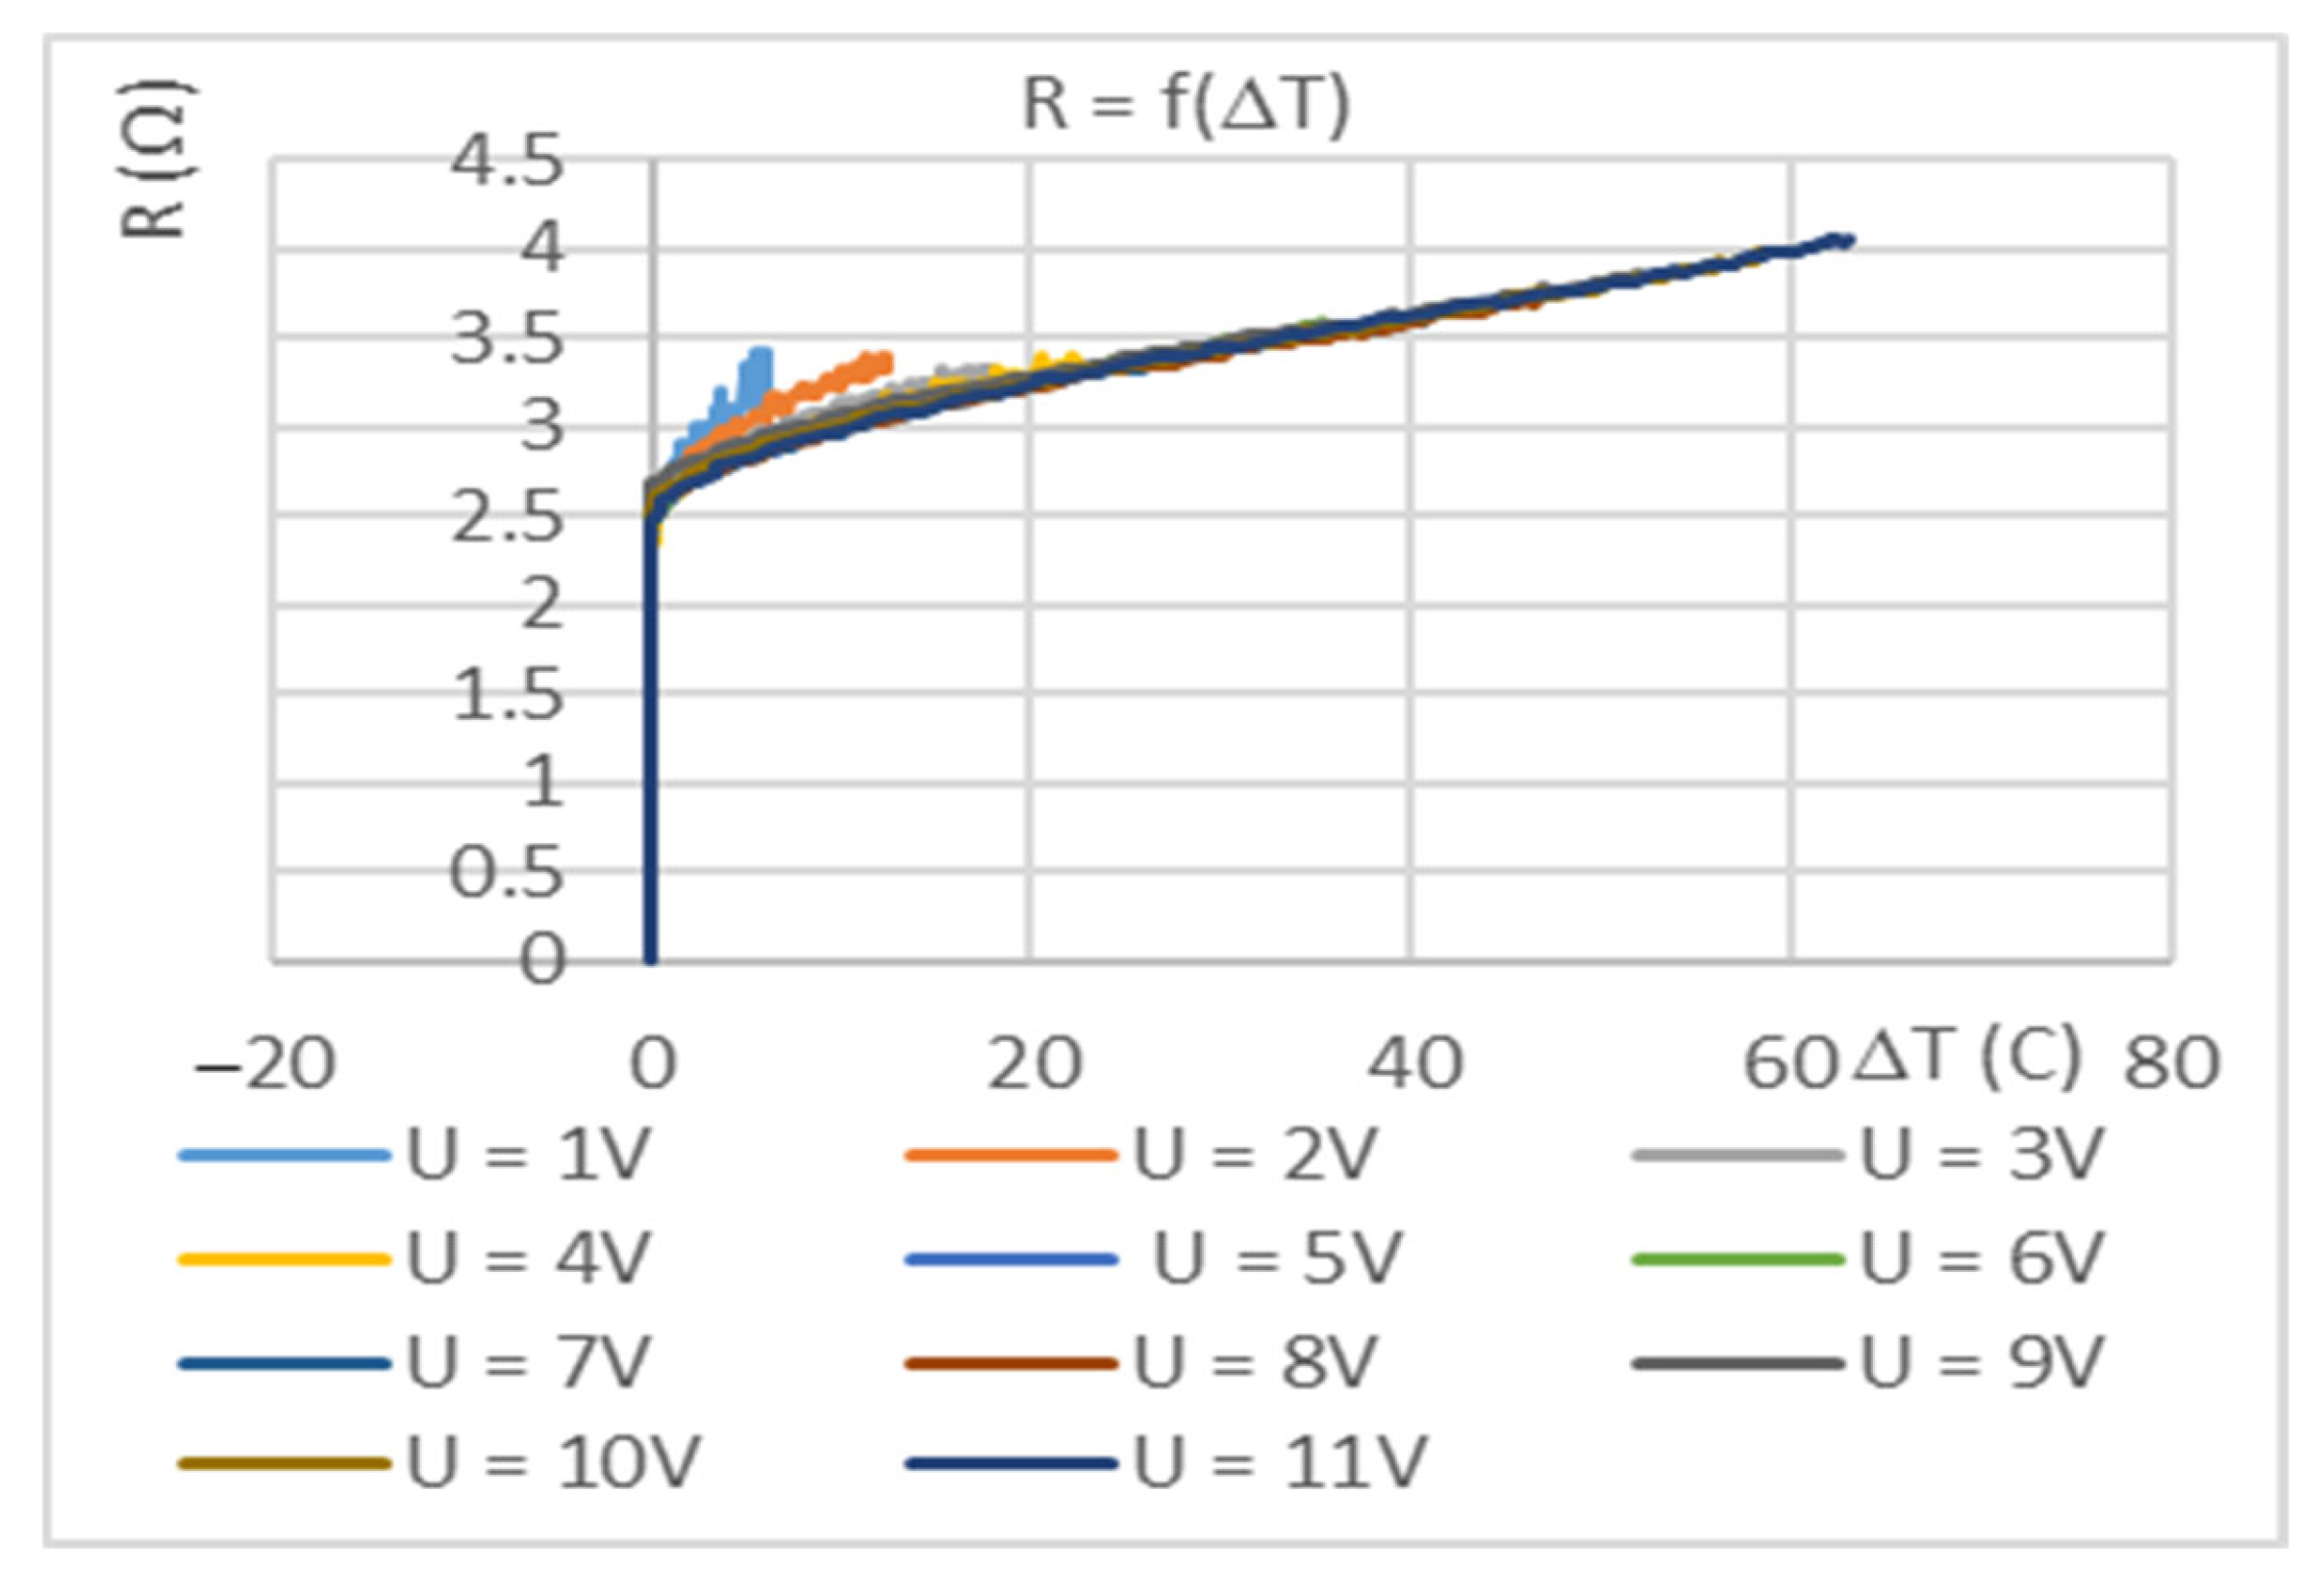
Figure 9 presents the investigation of internal resistance variation using the constant voltage method. In this approach, the current continuously changes in response to variations in the internal resistance. As a result, the system operates less stably, the measurements become less predictable, and control over the cooling/heating process is more difficult to maintain. The degree of noise and instability is particularly pronounced at low temperatures and under low constant voltage values.
Figure 10a illustrates the dependence COP
c = f(I). Maximum cooling efficiency is achieved at low current values—up to 0.5 A—and relatively low voltage levels. At higher voltages, particularly above 6 V, COP
c remains low even at the initial current range and rapidly declines toward zero, indicating a deterioration in cooling performance.
Figure 10b presents the dependence COP
h = f(I). The investigated element demonstrates smoother and more stable heating efficiency under the same conditions. A maximum is observed at low current levels, although its magnitude is lower compared to COP
c. Nevertheless, as the current increases, the heating efficiency does not drop sharply.
The dependence COPh = f(U) (under constant current conditions) provides higher and more stable thermal efficiency, particularly at elevated current and voltage levels. In contrast, the dependence COPh = f(I) (under constant voltage conditions) reveals sensitivity to current and a rapid decline in efficiency under increased electrical load. Therefore, to achieve maximum heat output, current-controlled operation—where the voltage can be increased in a controlled manner—is more suitable than fixed-voltage operation with increasing current. This approach ensures better control over efficiency and helps to avoid operating conditions that lead to overheating and reduced COPh.
4. Conclusions
The primary factor influencing the internal resistance is temperature, rather than the electrical operating mode. The difference between the two modes is mainly reflected in the level of noise and instability observed at low temperatures and under low constant voltage conditions. The constant current mode demonstrates smoother and more stable results.
The obtained relationship between the electric current and the resulting thermal effect is relatively linear, which facilitates easier system calibration and improves operational predictability
In the constant voltage method of investigation, the current continuously varies in response to changes in the internal resistance. This leads to less stable operation, reduced measurement predictability, and increased difficulty in controlling the cooling and heating processes.
COP is more sensitive to changes in current than to changes in voltage. While variations in voltage lead to smooth changes in COP, fluctuations in current result in sharp drops, reflecting the high thermal instability of the module under high current conditions. In both cases, maximum efficiency is achieved at low electrical power input.
Author Contributions
A.R., M.D., and M.M. were involved in the full process of producing this paper, including conceptualization, methodology, modeling, investigation, validation, visualization and preparing the manuscript. All authors have read and agreed to the published version of the manuscript.
Funding
This research was funded by the European Regional Development Fund within the OP “Research, Innovation and Digitalization Programme for Intelligent Transformation 2021-2027”, Project No BG16RFPR002-1.014-0005 Center of competence “Smart Mechatronics, Eco-and Energy Saving Systems and Technologies”.
Institutional Review Board Statement
Not applicable.
Informed Consent Statement
Not applicable.
Data Availability Statement
Data are available in this manuscript.
Conflicts of Interest
The authors declare no conflict of interest.
References
- Besançon, R.M. The Encyclopedia of Physics, 3rd ed.; Van Nostrand Reinhold Company: New York, NY, USA, 1985; ISBN 0-442-25778-3. [Google Scholar]
- Rowe, D.M. (Ed.) Thermoelectrics Handbook: Macro to Nano, 1st ed.; Taylor & Francis: Abingdon, UK, 2006; Available online: https://www.taylorfrancis.com/books/mono/10.1201/9781420038903 (accessed on 18 February 2025).
- Hwang, E.H.; Rossi, E.; Das Sarma, S. Theory of thermopower in two-dimensional graphene. Phys. Rev. B. 2009, 80, 235415. [Google Scholar] [CrossRef]
- Seeger, K. Semiconductor Physics: An Introduction; Springer: Berlin/Heidelberg, Germany, 2004; ISBN 3-540-21957-9. [Google Scholar]
- Sootsman, J.R.; Chung, D.Y.; Kanatzidis, M.G. New and Old Concepts in Thermoelectric Materials. Angew. Chem. 2009, 48, 8616–8639. [Google Scholar] [CrossRef] [PubMed]
- Datta, S. Quantum Transport: Atom to Transistor; Cambridge University Press: Cambridge, UK, 2005; ISBN 978-0-521-63145-7. [Google Scholar]
- Bulusu, A.; Walker, D.G. Review of electronic transport models for thermoelectric materials. Superlattices Microstruct. 2008, 44, 1–36. [Google Scholar] [CrossRef]
- Ioffe, A.F. Semiconductor Thermoelements and Thermoelectric Cooling; Infosearch: London, UK, 1957; ISBN 0-85086-039-3. [Google Scholar]
- Blundell, S.; Blundell, S.J.; Blundell, K.M. Concepts in Thermal Physics; Oxford University Press: Oxford, UK, 2010; p. 415. ISBN 978-0-19-956210-7. [Google Scholar]
- Imai, H.; Shimakawa, Y.; Kubo, Y. Large thermoelectric power factor in TiS2 crystal with nearly stoichiometric composition. Phys. Rev. B 2001, 64, 241104. [Google Scholar] [CrossRef]
- Northwestern Materials Science and Engineering. Thermoelectrics. Available online: https://thermoelectrics.matsci.northwestern.edu (accessed on 18 February 2025).
- Kong, L.B. Waste Energy Harvesting. In Lecture Notes in Energy; Springer: Berlin/Heidelberg, Germany, 2014; Volume 24, pp. 263–403. ISBN 978-3-642-54634-1. [Google Scholar] [CrossRef]
| Disclaimer/Publisher’s Note: The statements, opinions and data contained in all publications are solely those of the individual author(s) and contributor(s) and not of MDPI and/or the editor(s). MDPI and/or the editor(s) disclaim responsibility for any injury to people or property resulting from any ideas, methods, instructions or products referred to in the content. |
© 2025 by the authors. Licensee MDPI, Basel, Switzerland. This article is an open access article distributed under the terms and conditions of the Creative Commons Attribution (CC BY) license (https://creativecommons.org/licenses/by/4.0/).

