Proceeding Paper

Early-Stage Research to Characterize the Electrical Signal of Optically Stimulated Hydroponic Strawberries Using Machine Learning Techniques †

by
Levi Garcia-Menchaca
1,
Carlos Guerra-Sánchez
1,
Néji Tarchoun
2,
Raouia Lebbihi
3,
Oscar Cruz-Dominguez
4,*,
Claudia Sifuentes-Gallardo
1,
Juan Gerardo Peréz-Martínez
1,
Mario Cleva
5,
José Ortega-Sigala
1 and
Héctor Durán-Muñoz
1,*
1
Unidad Académica de Ingeniería Eléctrica, Universidad Autónoma de Zacatecas, Zacatecas 98000, Mexico
2
Research Laboratory LR21AGR05, High Agronomic Institute of Chott Mariem, Sousse University, Sousse 4042, Tunisia
3
Laboratory of Research in Management and Control of Animal and Environmental Resources in Semi-Aride Ecosystem, Higher Agronomic Institute of Chott Meriem, University of Sousse, P.O. Box 42, Sousse 4042, Tunisia
4
Carrera de Ingeniería Industrial, Universidad Politécnica de Zacatecas, Plan de Pardillo Sn, Fresnillo 99056, Mexico
5
Facultad Regional Resistencia, Universidad Tecnológica Nacional Formación en Tecnología, Resistencia 1900, Argentina
*
Authors to whom correspondence should be addressed.
Presented at the 5th International Electronic Conference on Applied Sciences, 4–6 December 2024; https://sciforum.net/event/ASEC2024.
Eng. Proc. 2025, 87(1), 44; https://doi.org/10.3390/engproc2025087044
Published: 14 April 2025

Abstract

:
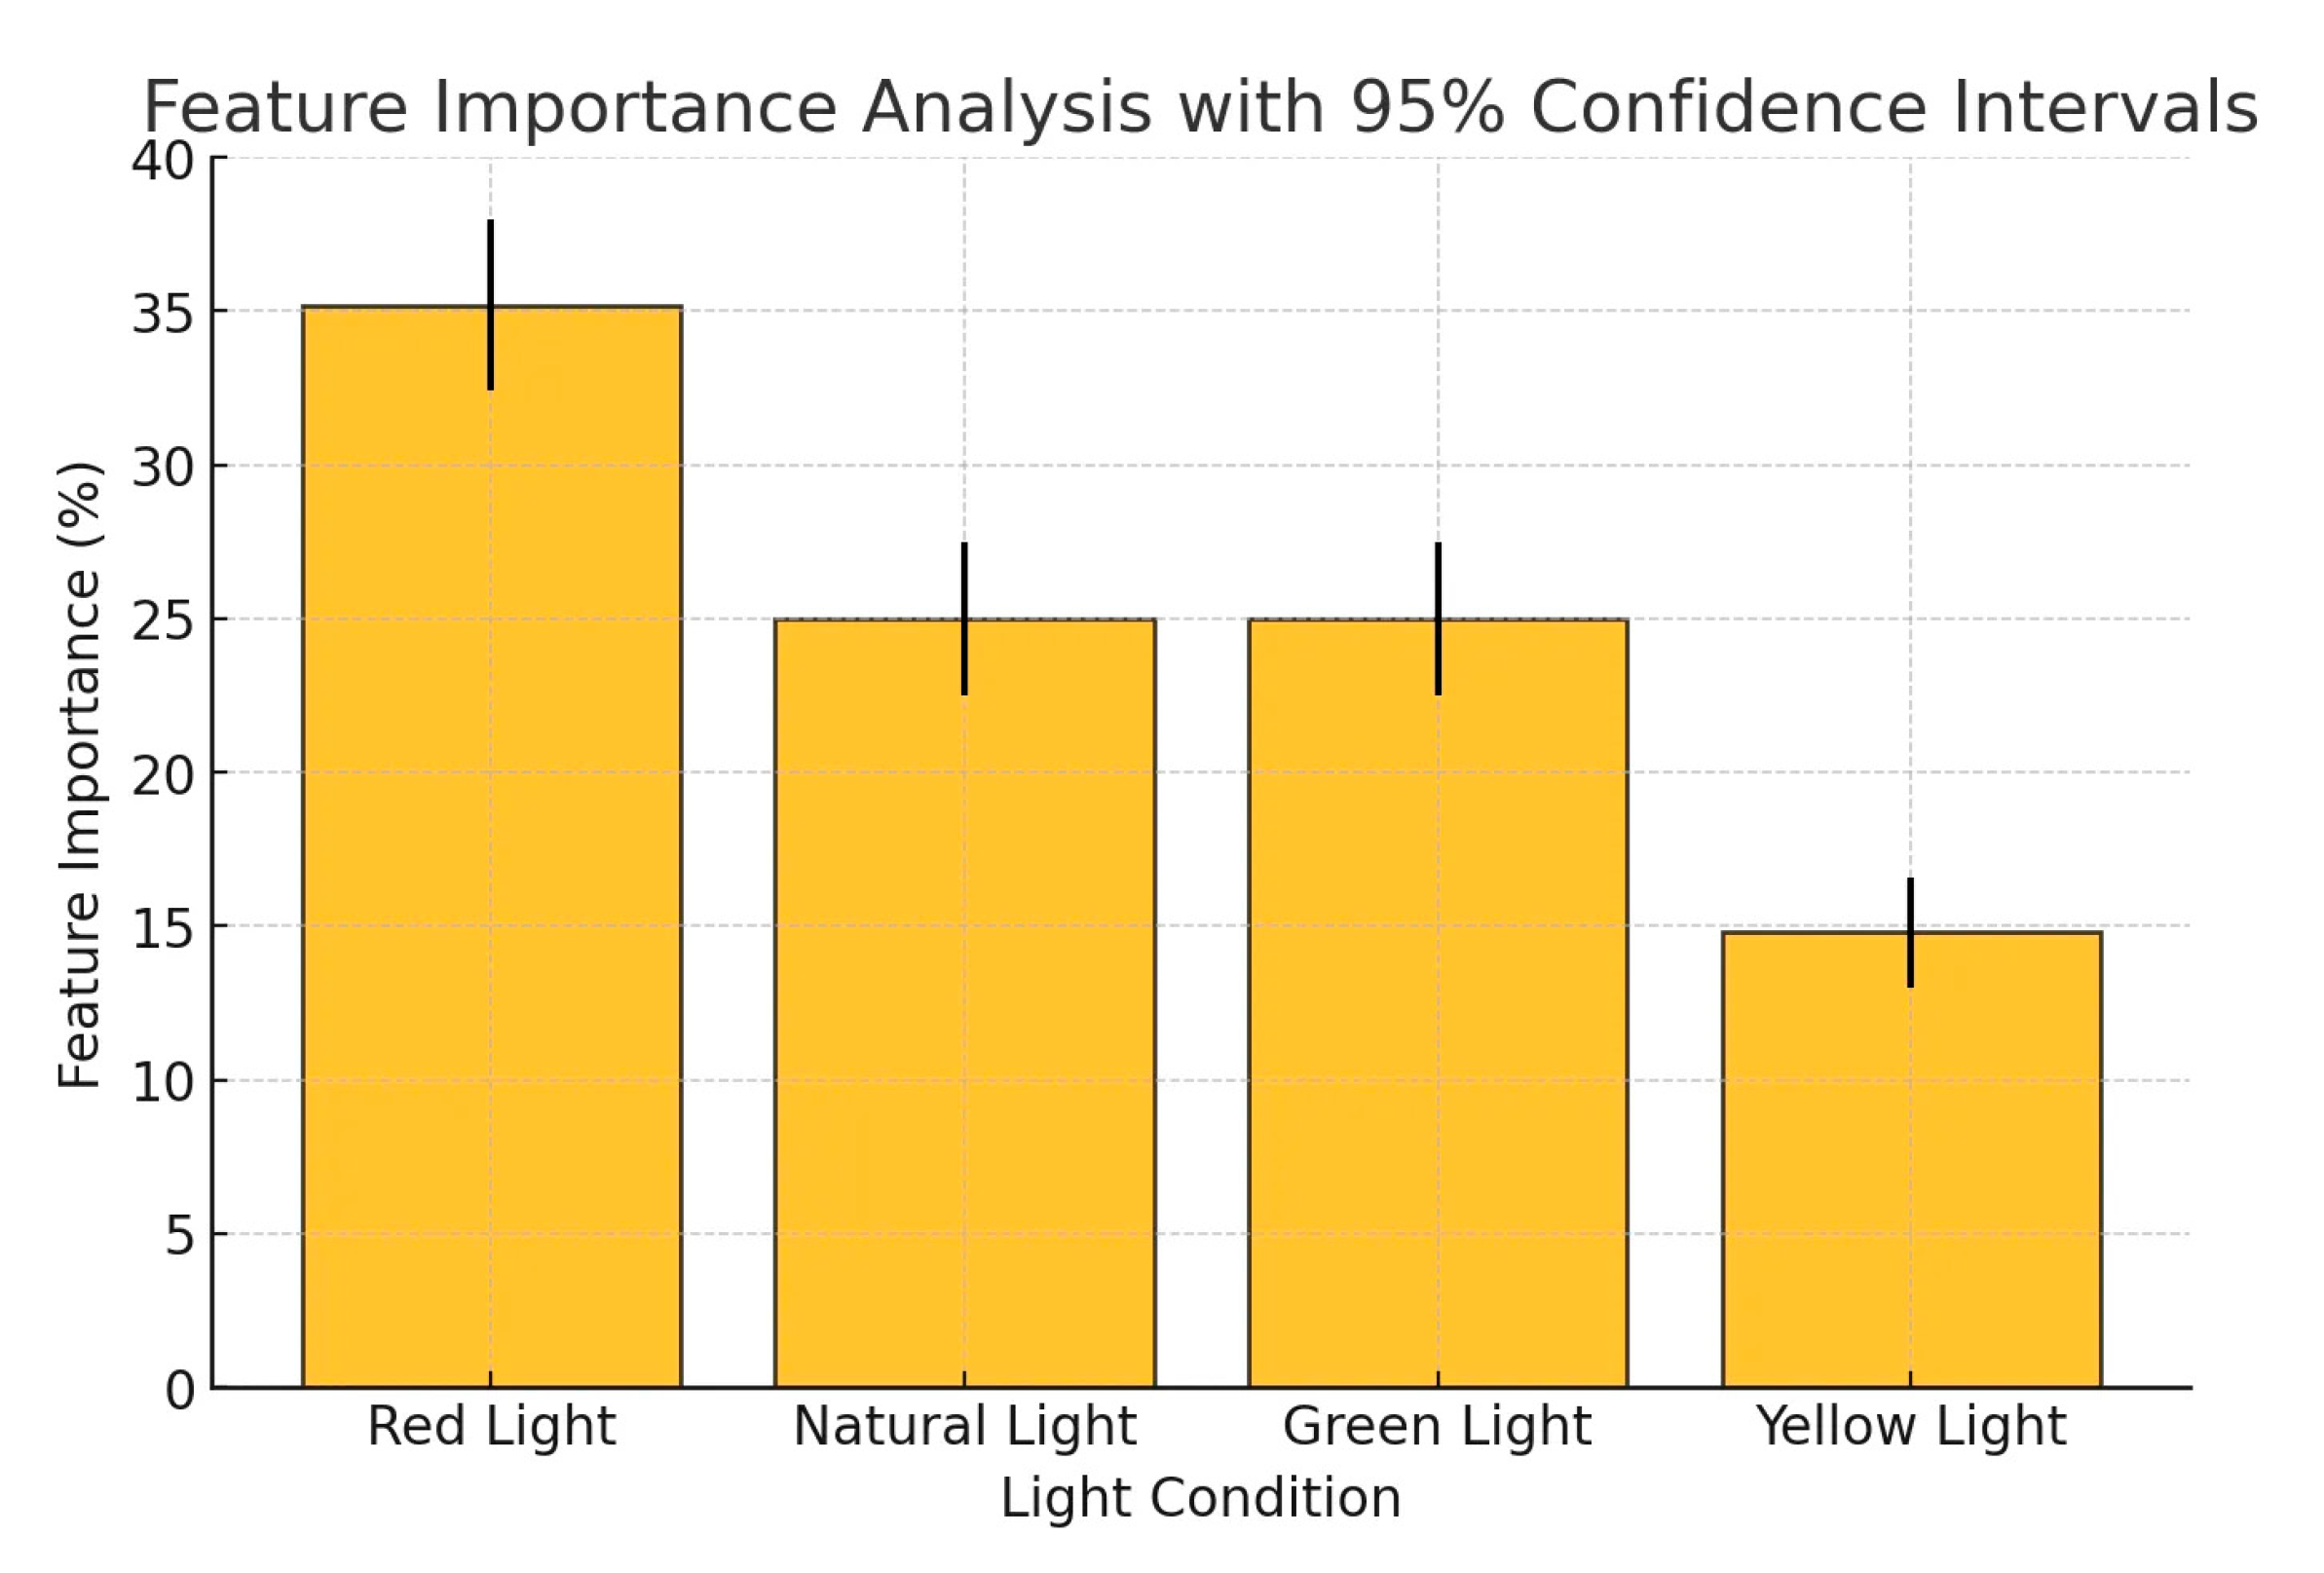
Through the electrical signal generated by a plant, it is possible to identify water stress, pests on its roots, a sick plant, or even identify the optimal growing conditions. In particular, the optimal growing conditions in the strawberry plant can be identified by its electrical signal, which can be useful to increase its production, since its fruits are in high demand for human consumption. Therefore, the aim of this pilot study is to use machine learning techniques to characterize the electrical signal of optically stimulated hydroponic strawberries, in order to identify the optimal growing conditions. The electrical signal was monitored using a home-made electronic system, based on Arduino. The principal result obtained shows that red light is the most informative feature in the random forest (RF) model, demonstrating superior performance in minimizing misclassification rates. In contrast, the support vector machine (SVM) model exhibited increased sensitivity to data variations, resulting in elevated misclassification rates. The feature importance analysis shows that the variable red light contributes 35% to the predictive capability of the model. Natural light and green light follow with approximately 25% each, while the contribution of yellow light is negligible at 15%. Finally, in this exploratory study, it would appear that the electrical signal from the plant is sensitive to specific light conditions, with red light being most impactful.

1. Introduction

Plants produce low-intensity electrical signals, which spread from the roots to the leaves. The science responsible for studying this electrical presence is plant electrical signal [1]. The electrical signal generated in a plant originates from the imbalance in ion concentrations, producing a potential difference. Electrical signals can be transmitted between organs, tissues, and membranes of adjacent plant cells [2]. Electrical signals in plants can be divided into three types: local electric potential (LEP), action potential (AP), and displacement potential (DP).
LEP is a subthreshold response, and is induced by a change in environmental factors (e.g., soil, water, fertility, light, temperature, and air humidity). In contrast to AP and VP LEP is only generated locally and is not transferred to other parts of the plant [3]. The action potential is triggered by non-invasive stimuli, while the variation potential is triggered by invasive stimuli and depends on the position and intensity of the lesion [4].
The electrical signal of the plant is useful for determining stress in plants, and this signal can be obtained by placing small electrodes inserted in different tissues throughout the plant, from the root to the fruits [5]. The electrical response of plants generated from environmental stimuli can be measured and quantitatively related to the intensity of the stimulating source, such as solar radiation, soil water content, evapotranspiration rates, sap flow, etc. Through the electrical signal in plants, it is possible to analyze the water stress generated in plants by soil dryness [6]. Therefore, changes in environmental variables generate modifications in the electrical signal, which is generated at the stimulation site [7,8]. The electrical signal generated by a plant can be useful as a robust sensor and acts as a monitoring system. Also, monitoring various parameters related to crop plant growth (phytomonitoring) on a large scale is of great interest for agriculture [9]. In addition, the electrical signal can provide valuable information for monitoring environmental conditions, such as air pollution. Thus, a plant can be used as a biosensor to monitor air quality [10].
Additionally, the topic of plant growth and development through optical stimulation is the subject of numerous studies, all with the aim of better understanding the relationship between light and plants. Basically, the LED (light-emitting diode) light is emerging as a technology with great potential to improve agricultural production [11]. Its introduction is relevant due to its optimization of agricultural production, in addition to presenting the need to investigate closed production systems [12]. Light plays a fundamental role in the growth and development of plants. In particular, monochromatic LED light has emerged as an efficient option for in vitro cultivation, due to its efficiency and ability to alter plant morphology. Specifically, red monochromatic LED light was shown to be more beneficial to plant quality compared to blue [13]. Even LED technology has revolutionized greenhouse horticulture, offering precise control to optimize plant growth. Different colors of light significantly influence some important aspects such as stomatal opening, plant height, flowering, and leaf expansion [14]. For example, a detailed study on tomato leaves showed that supplemental lighting was able to significantly improve photosynthesis and stomatal conductance [15]. Even in tomatoes grown under artificial light, UVA irradiation was found to increase fruit quality and yield. This evidence highlights the potential of this irradiation in plants under artificial light [16]. Studies in lettuce and cucumber indicate that plant morphology varies according to these factors, showing how light can modulate biomass and development in controlled environments. Light quality has also been shown to influence the growth of bean plants. Exposure to different light levels affected stem length, leaf area, and dry matter production [17].
Strawberry is a perennial herbaceous plant that is easily propagated by crown division. In addition, flowering induction is sensitive to thermal photoperiod and several nutritional factors [18]. However, some areas have adverse climatic conditions for strawberry production, which makes strawberry production in greenhouses costly [19]. An interesting alternative for strawberry production is high tunnel (HT) greenhouses, which are unheated passive solar greenhouse structures used to extend the growing season.
These tunnels are an excellent option when temperatures drop dramatically during the fall and winter. A high tunnel fruit growing system provides a competitive advantage in the market compared to a field growing system [20].
The study of the electrical signal generated by strawberry is important due to the high-water demand of this plant, but it has a low tolerance to waterlogging. Therefore, the study of the electrical signal in strawberry has been widely studied in different works, demonstrating that the effects of water stress on strawberry are significant for its water management [21].
The use of LED technology impacts the production of high-quality ornamental plants compared to traditional lighting systems [22]. On the other hand, a variable that is very useful for monitoring the quality of crops stimulated with LED light is through the electrical signal of the plant. These measurements are made without damaging the plant. Its measurement consists of an electrode system that allows for surface contact with the roots. This method allows for precise measurements in different parts of the plant and is useful for studying responses to environmental factors and long-term monitoring, without affecting the growth or health of the plants. The experimental results obtained with the system demonstrate the efficiency of the non-invasive method in accurately measuring the bioelectric potentials of the plant [23]. The technique of measuring biopotentials in plants in hydroponic systems can be beneficial for agriculture, due to the optimization of water resources. Hydroponics can be considered as a tool for water conservation and sustainability in agriculture. It is mentioned that agriculture accounts for about 70% of the world’s freshwater consumption and that hydroponics can be a useful tool to achieve the conservation of this resource. For example, the effects of different LED light spectra and intensity levels on lettuce growth in a greenhouse hydroponic growing environment have been studied.
Finally, the combined use of machine learning (ML), hydroponic systems, and biopotential response can become a highly effective tool, as it can become a study method for crop optimization. The combinations of the previous techniques to analyze the growing processes of strawberry plants have been taken into consideration in this work due to their importance as food. Thus, the aim of this pilot study is to use machine learning techniques to characterize the electrical signal of optically stimulated hydroponic strawberries, in order to identify the optimal growing conditions, which were monitored using a low-cost Arduino system. This work models and predicts the behaviors of plants under different light conditions using machine learning techniques.

2. Materials and Methods

2.1. Hydroponic System

The first step in this study was the design and construction of a hydroponic system using PVC tubes. This system was selected for its simplicity and low cost. The PVC tubes were cut and assembled to form a structure that allows for the continuous flow of water through the use of low-power pumps. Strawberry plants were placed in slots made in the tubes to facilitate vertical growth, which optimizes the use of space. The system was designed so that plants could be easily inserted and removed during the growing cycle (Figure 1).

2.2. Electrical Signal Sensing System

This section presents the design and implementation of a low-cost electronic system to monitor strawberry plants under different conditions. Temperature, humidity (DHT11), light (LDR), and electrical signal sensors were used, all connected to an Arduino microcontroller, which is characterized by its accessibility and ease of programming. The Arduino board acquired the sensor readings and transmitted the data to a real-time analysis platform. Temperature and humidity sensors were used to monitor environmental conditions, while LDR sensors measured light intensity, which is critical to assess the impact of light sources on plant growth (Figure 1E). The humidity-temperature sensor (DHT11) is installed inside each vertical tube. The choice of the DHT11 is due to its reliability and easy integration into microcontroller systems, while the Light Sensor (LDR) was installed to measure the light intensity of the LEDs. The LEDs (5 mm) used are commercial, are powered with 5 V, and the photoperiod used is 8 h. The rest of the optical and electronic characteristics of each LED are shown in Table 1.
At the start of the experiment, strawberry plants were in the vegetative stage, with an average age of 4 weeks post-germination. Plants had developed 5–6 fully expanded leaves, ensuring they were physiologically mature enough to generate consistent electrical signals under different light conditions. Plant selection was standardized to minimize variability due to growth stage differences, ensuring that the observed electrical responses were primarily due to light exposure rather than plant maturity.
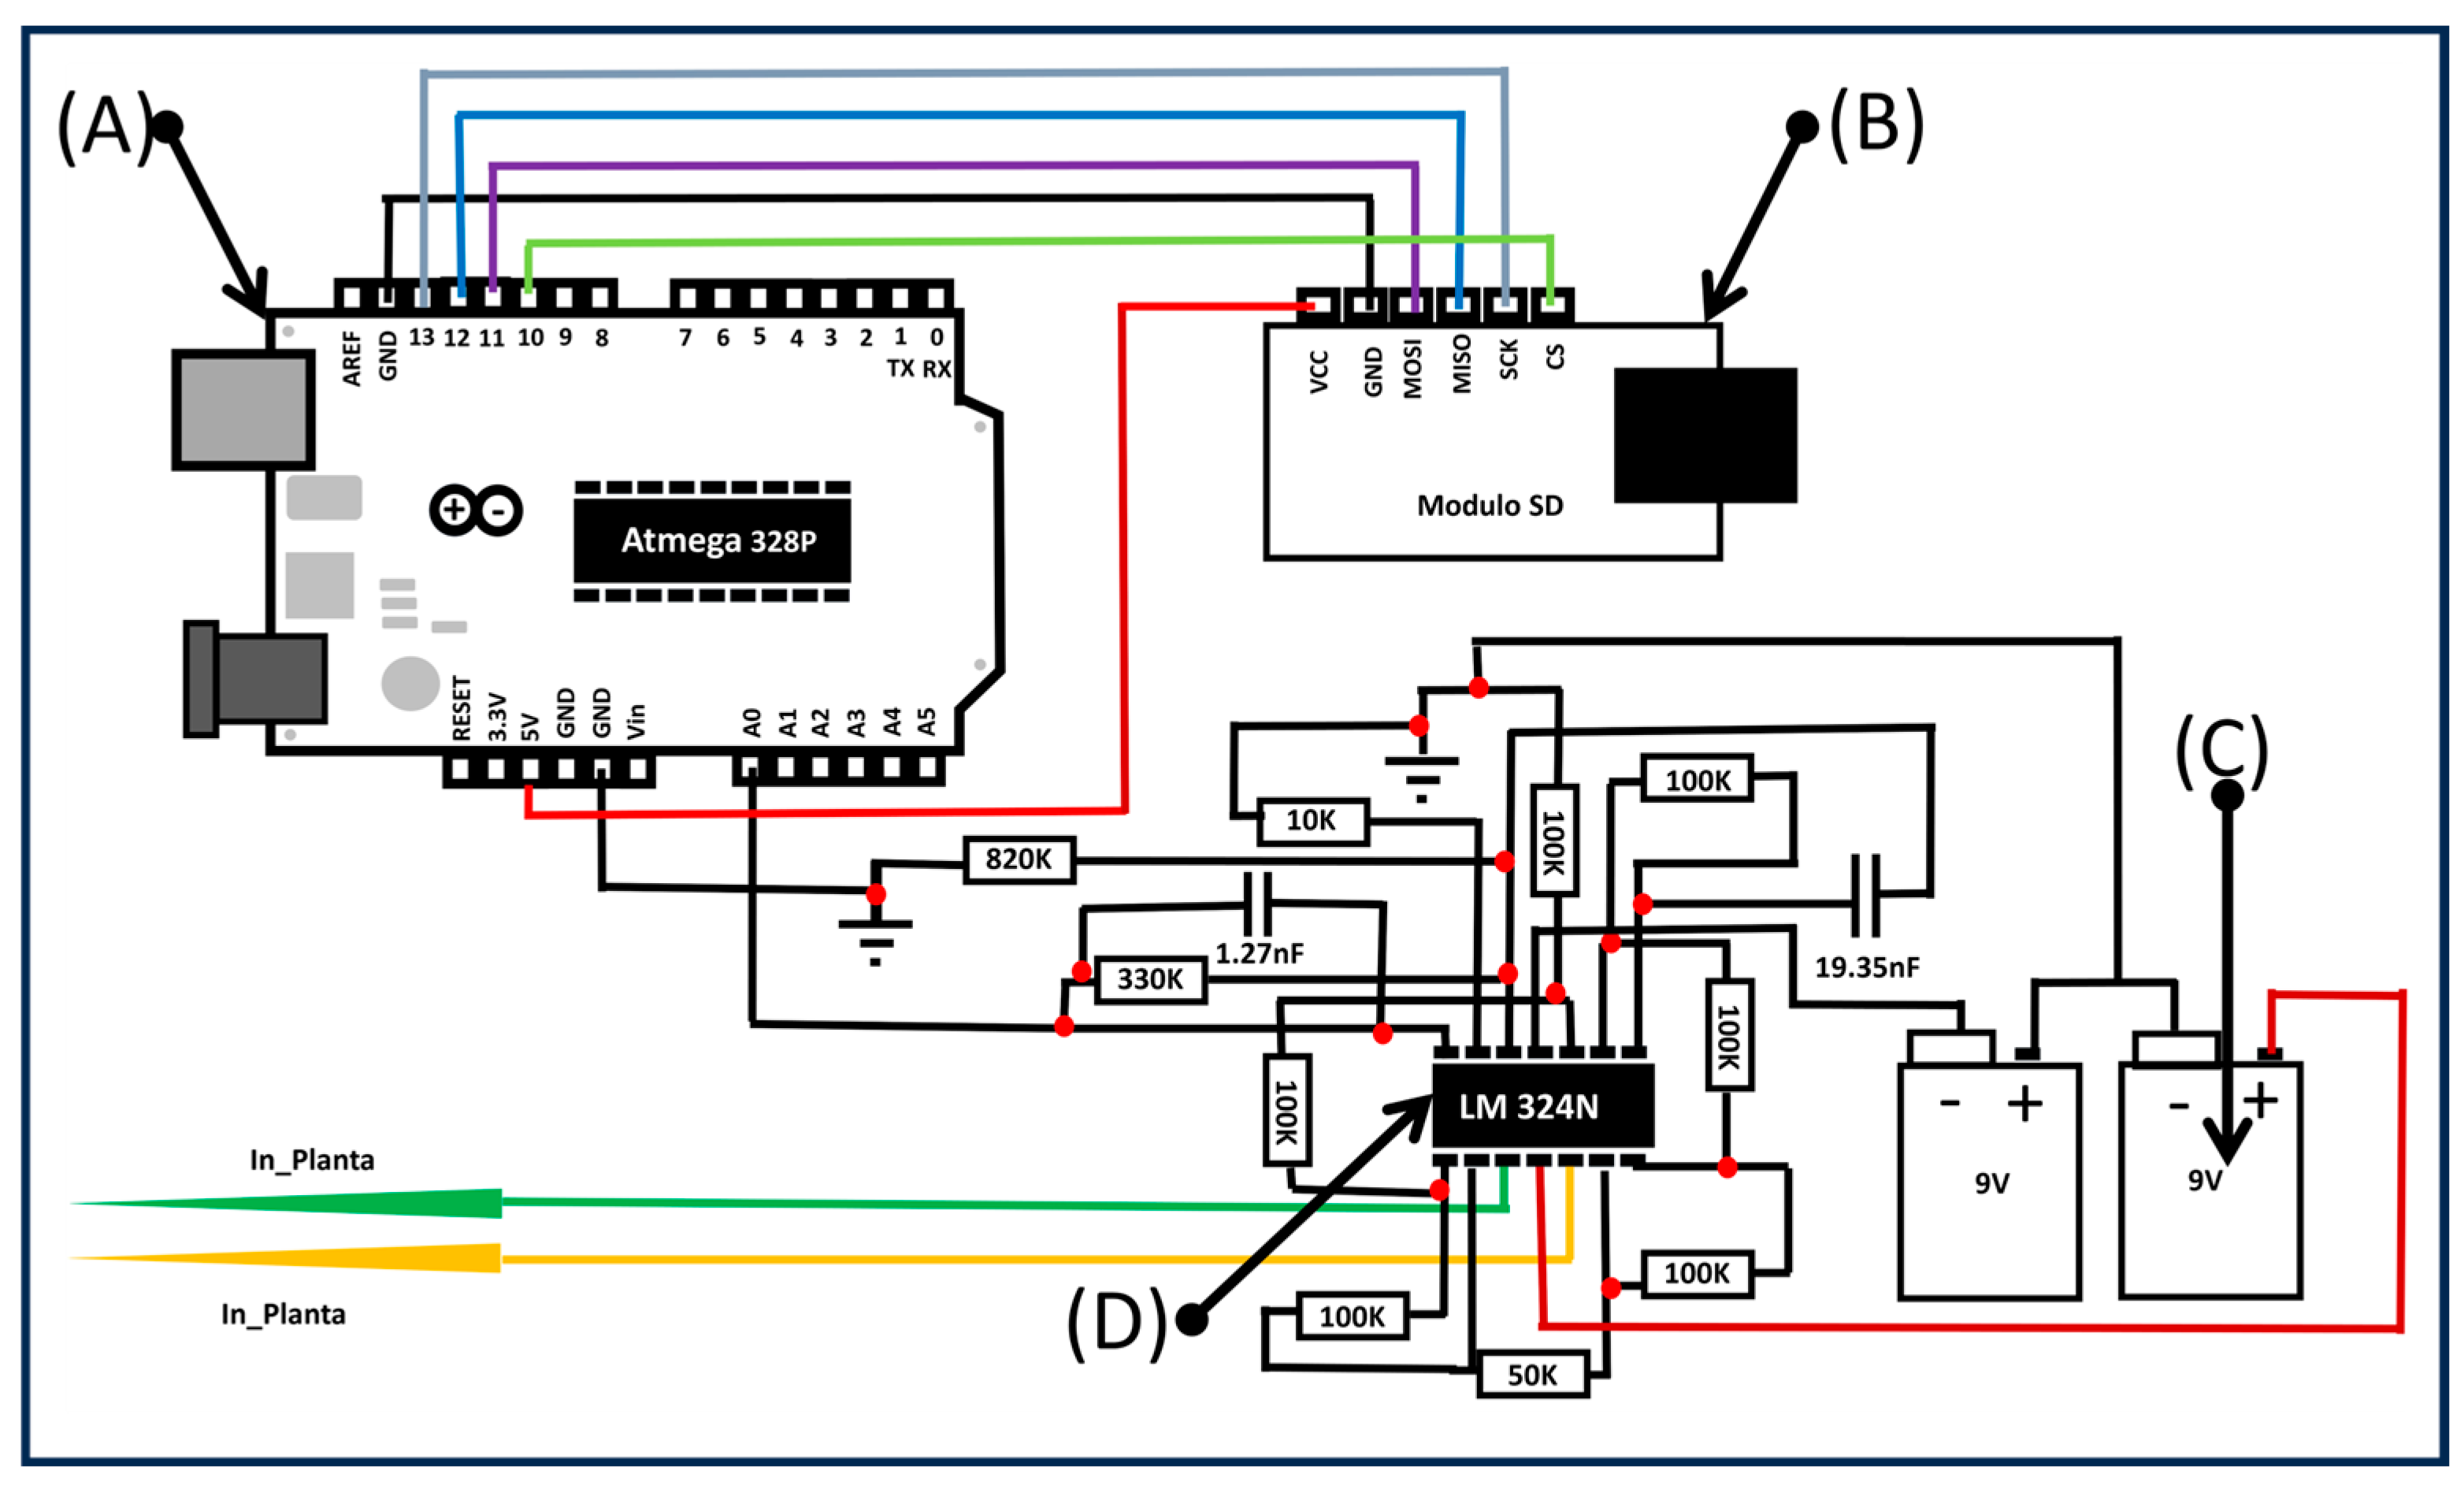
To monitor the electrical behavior of the strawberry plants and their response to environmental conditions, a custom-designed electrode system using stainless steel needle electrodes was implemented. Two electrodes were inserted into the plant tissue per plant: one near the stem base and one closer to a leaf, capturing different electrical potentials in response to light stimuli. Electrodes were inserted approximately 2 mm deep, using a non-invasive gel interface to ensure stable electrical contact without damaging the tissue. The recorded signal frequency was 1000 Hz, which aligns with values reported in the literature [20,21,22,23,24]. A high-impedance differential amplifier circuit was used to enhance signal clarity and reduce electrical noise. The shielded system operated under controlled conditions, with real-time signal acquisition and data storage managed by an Arduino-based system. The electronic setup is illustrated in Figure 2.
The details of the Arduino board programming code are shown in Table 2.
Being an elementary study, only 20 plants were used in total, with five plants for each wavelength (red, green, yellow light, and natural light). The electrical signal of each plant was recorded only once and optically stimulated during 8 min for each wavelength. The plants were kept under controlled conditions in a laboratory. For signal calibration, a BL-420E bioengineering test system from Chengdu Taimeng Science (Sichuan, China) and Technology Limited (Sichuan, China) was used. Two electrodes were inserted, the first one was placed on a leaf, approximately 1 cm apart. The second electrode was inserted into the stem. The distance between the electrode tips was 5 cm.
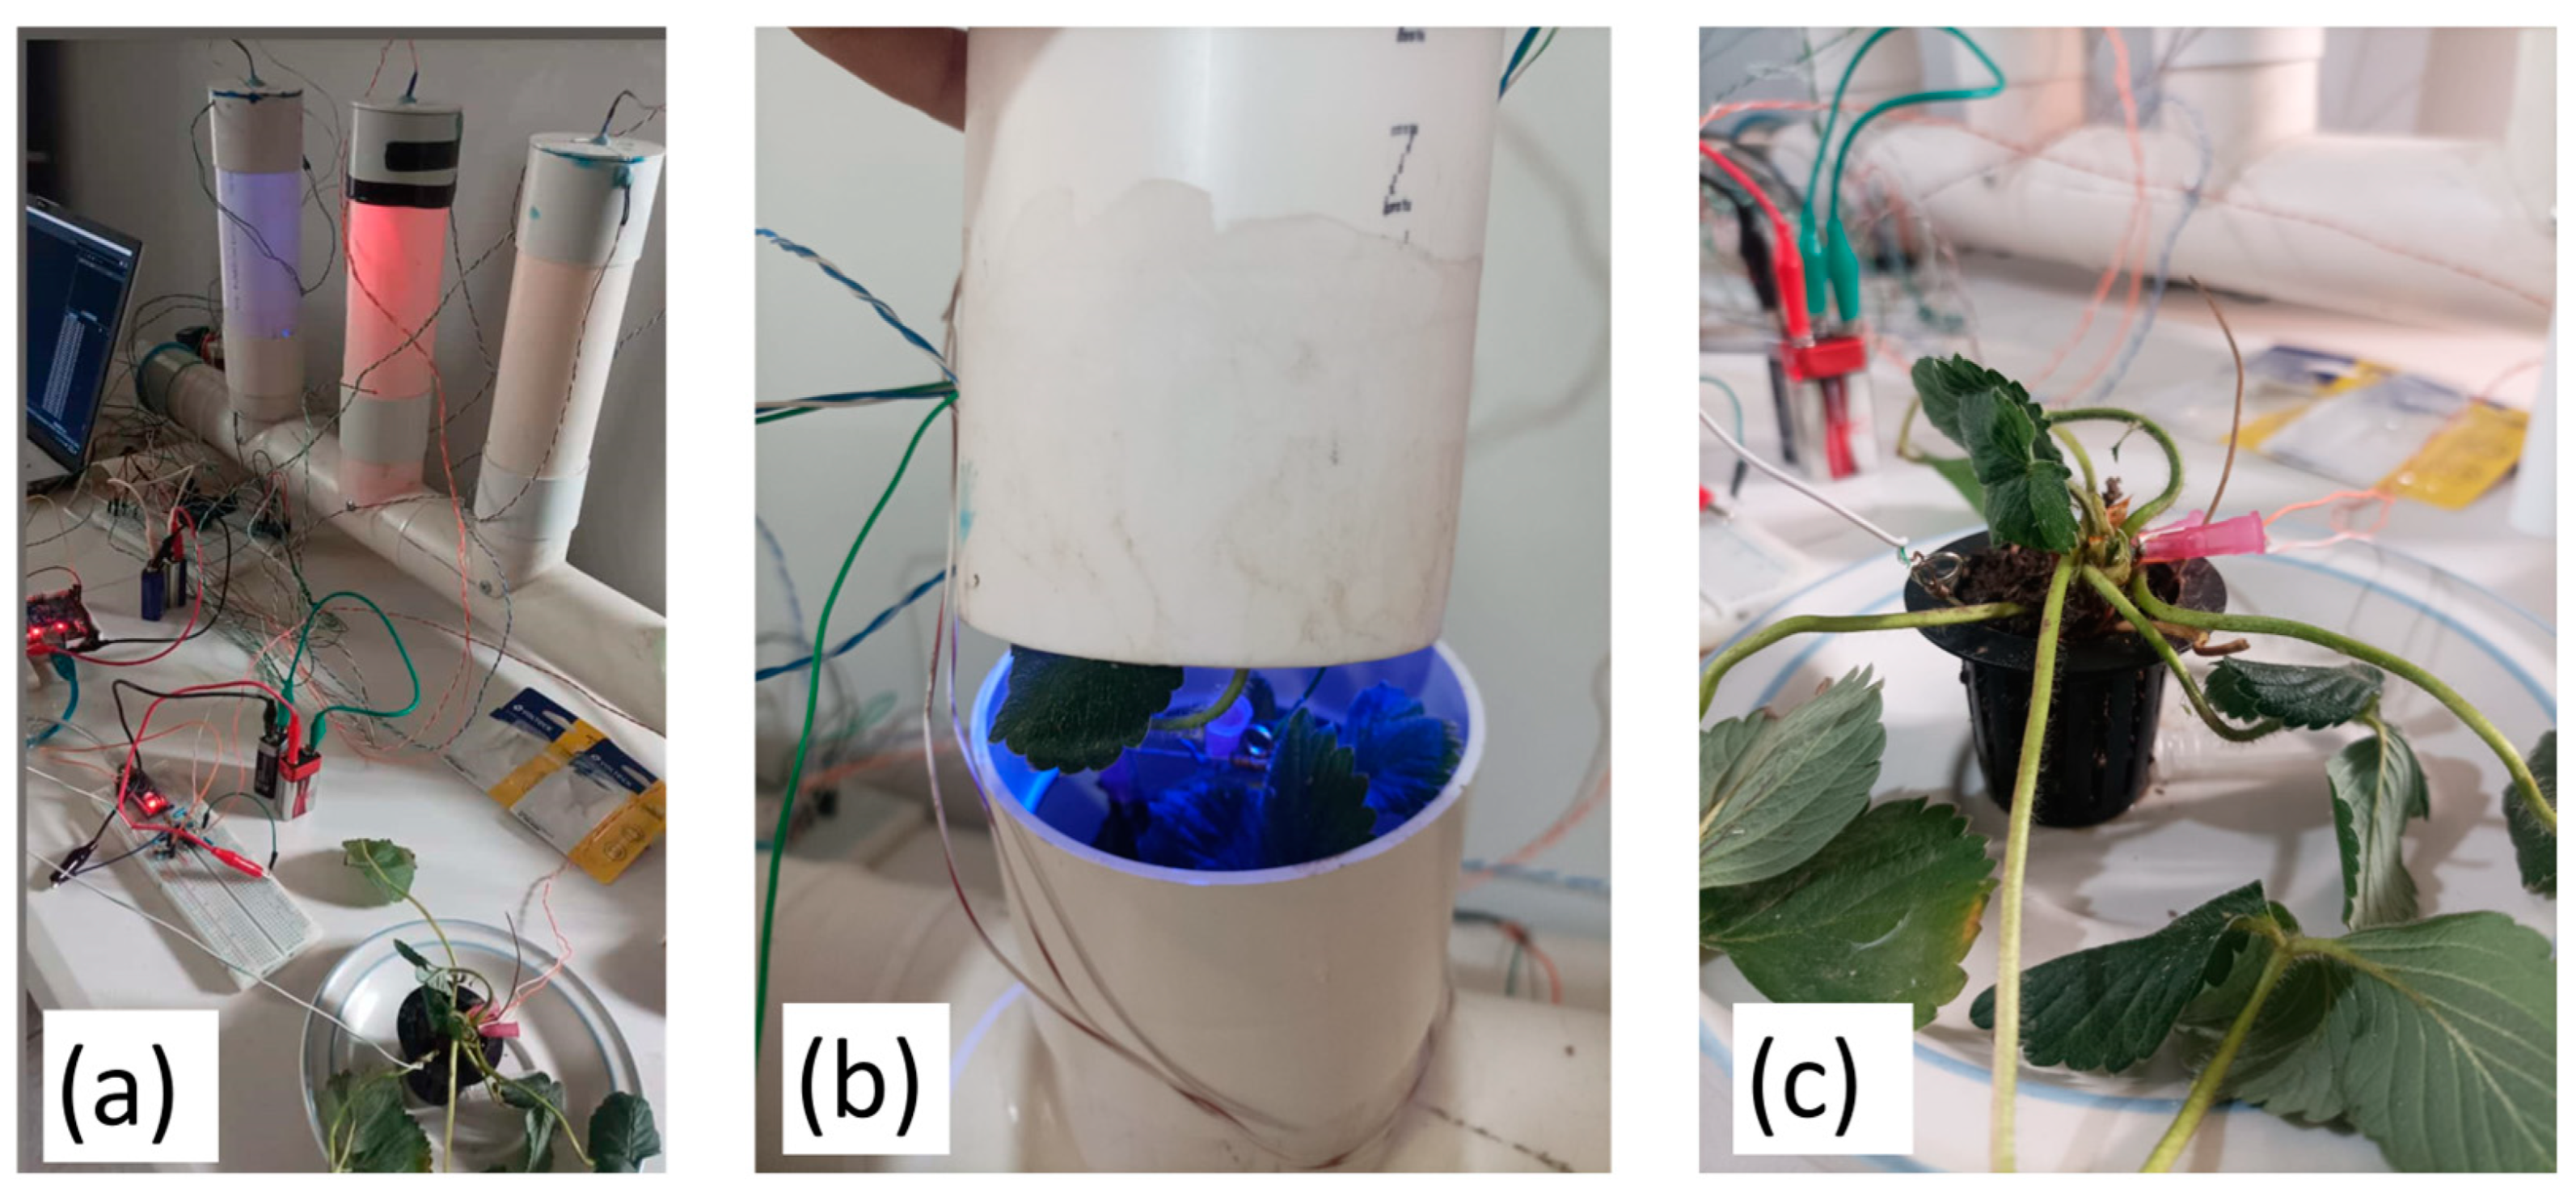
The penetration of the electrodes was parallel to the blade with a slight inclination of 25 degrees, considering a depth of approximately 0.3 cm. Strawberry plants were stimulated with LEDs of different colors to study their effect on the electrical signal. The selected wavelengths were chosen for their known impact on photosynthesis and plant development. In this work, red light (635 nm) was chosen for its ability to stimulate flowering and fruit development. Yellow light (587 nm) was selected as an intermediate control and was used to compare the effects of the other colors. Finally, green light (520 nm) was selected due to its role in the structure and overall growth of plants, as shown in Figure 3. The 8 h photoperiod was selected to match the strawberry’s short-day plant characteristics, where flowering and growth depend on daylight duration. Studies show that shorter photoperiods (6–10 h) promote early flowering and optimal growth under artificial lighting. The 8 h cycle balances photosynthetic efficiency with energy consumption in hydroponic systems, providing adequate light exposure while avoiding photoinhibition.

2.3. Implementation of Machine Learning in Precision Agriculture

The dataset underwent preprocessing to ensure data quality and reliability for accurate modeling. The process began with the removal of invalid values, anomalies, and outliers identified through statistical methods. Noise reduction techniques, including signal averaging and smoothing, were then applied to minimize measurement variability. A feature analysis was conducted to evaluate each variable’s relevance. Through correlation analysis, the study examined relationships between the independent variables (electrical signal under different light conditions) and the dependent variable (light type). Highly correlated features were retained while redundant ones were removed to reduce dimensionality and prevent overfitting. These preprocessing steps were essential for creating a clean, optimized dataset. The selection of the most informative predictors enhanced the machine learning models’ predictive power and reliability.

Machine Learning—Classification

The dataset preprocessing phase involved rigorous quality control measures. Statistical methods eliminated invalid values, anomalies, and outliers, while a Fast Fourier Transform (FFT) extracted relevant frequency components. A comprehensive correlation analysis identified and retained highly relevant predictors, effectively reducing dimensionality and mitigating overfitting risks.
Model optimization incorporated hyperparameter tuning through Grid Search Cross Validation (five-fold CV). The random forest configuration was optimized across multiple parameters, yielding optimal settings of 200 trees, max depth = 20, and min samples split = 5. For the support vector machine (SVM), implementation with a Radial Basis Function (RBF) kernel achieved optimal performance at C = 10 and Gamma = 0.1. This systematic optimization process enhanced model predictive capabilities, while maintaining robust generalization for classifying plant electrical responses under varying light conditions. To mitigate the risk of overfitting, tree depth was limited and the minimum number of samples per split was increased. Cross validation confirmed that these constraints preserved generalization, while avoiding performance inflation on the training set.
The following analysis implemented two machine learning algorithms in the study: Decision Tree Classification and the support vector machine. The independent variables or features in the study involved light conditions, which included natural, yellow, red, and green; the target variable was the type of light based on the electrical signal of the plant. Decision Trees were used to classify light types based on the plants’ electrical signal. This supervised learning algorithm creates a hierarchical model by systematically dividing the data. Decision Trees excel at handling both numerical and categorical data, while remaining easy to interpret. The study used them to identify patterns in electrical responses under different light conditions and provide clear insights into the classification process. Decision Trees were chosen for their simplicity, reliability, and effectiveness in managing non-linear relationships.
Meanwhile, support vector machines (SVMs) were used for the classification of the electrical signal of strawberry plants subjected to natural, yellow, red, and green lights. Support vector machines are a multi-purpose, supervised learning algorithm which can be applied for either classification or regression problems. Herein, this work applies the approach of SVM to classify the plant responses according to the type of wavelength of light used, considering all small variations in data. The SVM was selected because it is robust, flexible, and efficient in handling multi-dimensional datasets; therefore, this assures appropriate classification within a rather complex agricultural context.
To evaluate the efficiency of the models and its ability to predict, statistical validation must be applied with different metrics. The Mean Absolute Error (MAE) measures the average absolute difference between the predicted and actual CO(GT) values. A lower MAE indicates better model performance. MAE can be calculated with yi as the predicted value and yi as the actual value, as follows:
M A E = 1 n i = 1 n | y i y i ^ |
The Mean Squared Error (MSE) calculates the average squared difference between the predicted and actual values. MSE penalizes larger errors more than MAE. MSE can be calculated with Equation (2), knowing that yi is the predicted value and yi is the actual value, as follows:
M S E = 1 n i 1 n ( y i y i ^ ) 2
The R-squared (R2) Coefficient represents the proportion of variance in the target variable explained by the independent variables. R2 values closer to 1 indicate a better fit. R-squared can be calculated with Equation (3), with (yi) ̂ being the predicted value and yi is the actual value, as follows:
[ R 2 = 1 i = 1 n { y i y i ^ ) 2 i = 1 n ( y i y ¯ ) 2 ]
And the Root Mean Squared Error (RMSE) measures the average magnitude of the residuals or errors between the predicted and actual values; a lower RMSE value indicates smaller errors and better accuracy of the model’s predictions. RMSE can be calculated with Equation (4) as follows:
R M S E = i = 1 n ( y i y i ^ ) 2 n
Finally, cross validation (CV) is a technique used in machine learning that assesses performance and the generalization ability of a model. This method has been one of the prominent ones, in which one divides the available dataset into several subsets or “folds” and systematically rotates through them as both training and testing sets independently. Furthermore, it will enable us to evaluate the model performance on different subsets of the data, thereby making sure that the performance of the model is not biased due to a specific training–testing set split. Therefore, averaging the scores from cross validation provides a better and more robust representative estimate of the performance of our model than a single training–testing set split. It will actually give us a good estimate of how well this model generalizes to unseen data and provides a better barometer of its predictive capability. Cross validation is a very useful technique in model evaluation and selection, since it allows for a more complete and unbiased view of the performance of the model.

3. Results and Discussions

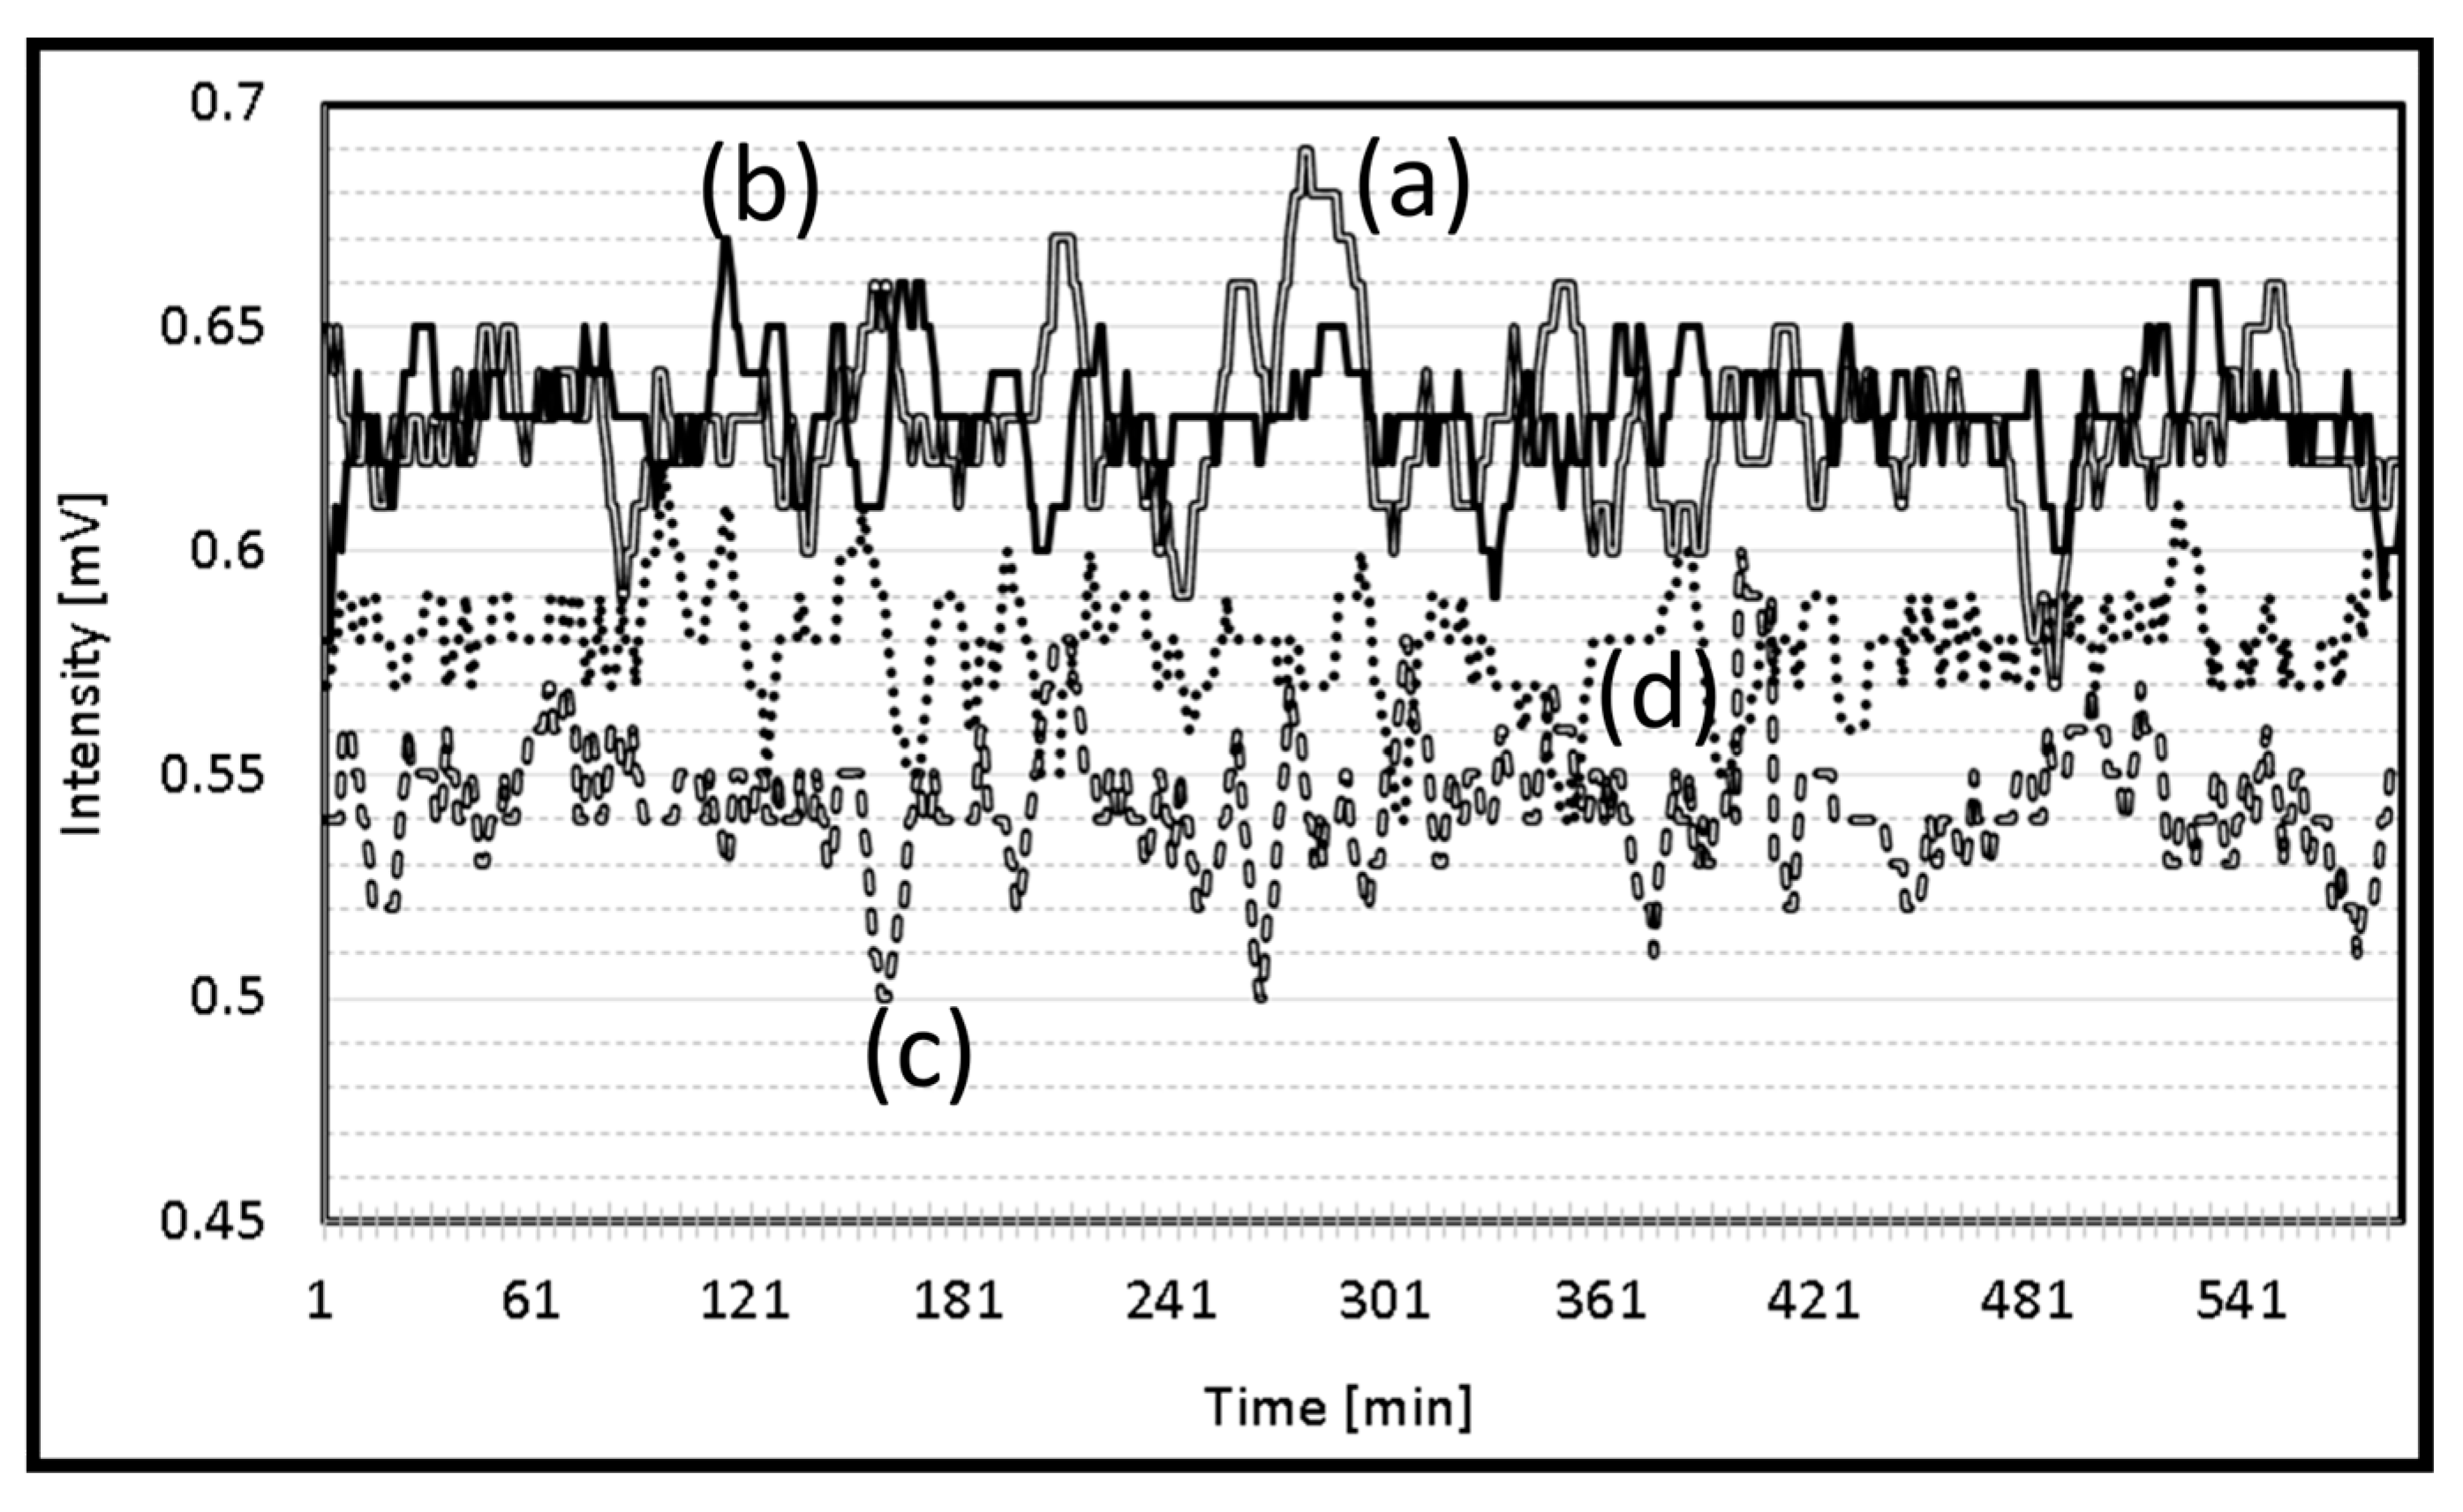
The performance, accuracy, precision, recall, and F1 score of the support vector machine (SVM) and random forest model (RFM) were compared. The results point out the strengths and weaknesses of each model in the context of the dataset. The strawberry plant that showed the highest electrical signal was exposed to red light (Figure 4a), followed by the plant exposed to green light (Figure 4b). While natural light and yellow light showed almost the same electrical signal.

3.1. Comparison of Models

The performance of both SVM and RF is judged based on the classification performance of light intensity data. Table 3 shows the overall performance measures with respect to accuracy, precision, recall, and F1 score in relation to the overall strengths of both models. It can be observed that the random forest model outperformed the SVM with higher accuracy in view of the efficient handling of the dataset.
The comparison of the models presented in Figure 5 highlights the key differences in performance metrics between SVM and the random forest model. Overall, random forest achieved higher accuracy and F1 score compared to SVM, reflecting better generalization ability across the entire dataset. While SVM demonstrated competitive accuracy, its recall values were slightly lower, particularly for certain classes such as yellow light.
The random forest model obtained an accuracy of 88%, outperforming SVM, which achieved 83%. This suggests that random forest is better at correctly predicting the overall classification of the plant electrical signal. Both algorithms showed closely related precisions, with the random forest performing slightly better than SVM, with an average macro precision of 88% versus 84%. This shows that random forest is slightly better on all classes at keeping the false positive rate low. Another area where random forest outperformed SVM was recall. The macro recall for random forest was 87%, while that of SVM was 80%, meaning that random forest identified a higher proportion of true positives. The F1-Score further highlights the advantage of random forest, which achieved a value of 88%, while SVM lagged slightly behind at 82%. Confusion matrices were created to further explore the results of each model classification. These will provide the correct and incorrect predictions breakdown within each class, helping to gauge the strengths and weaknesses of each model.

3.2. Support Vector Machine (SVM)

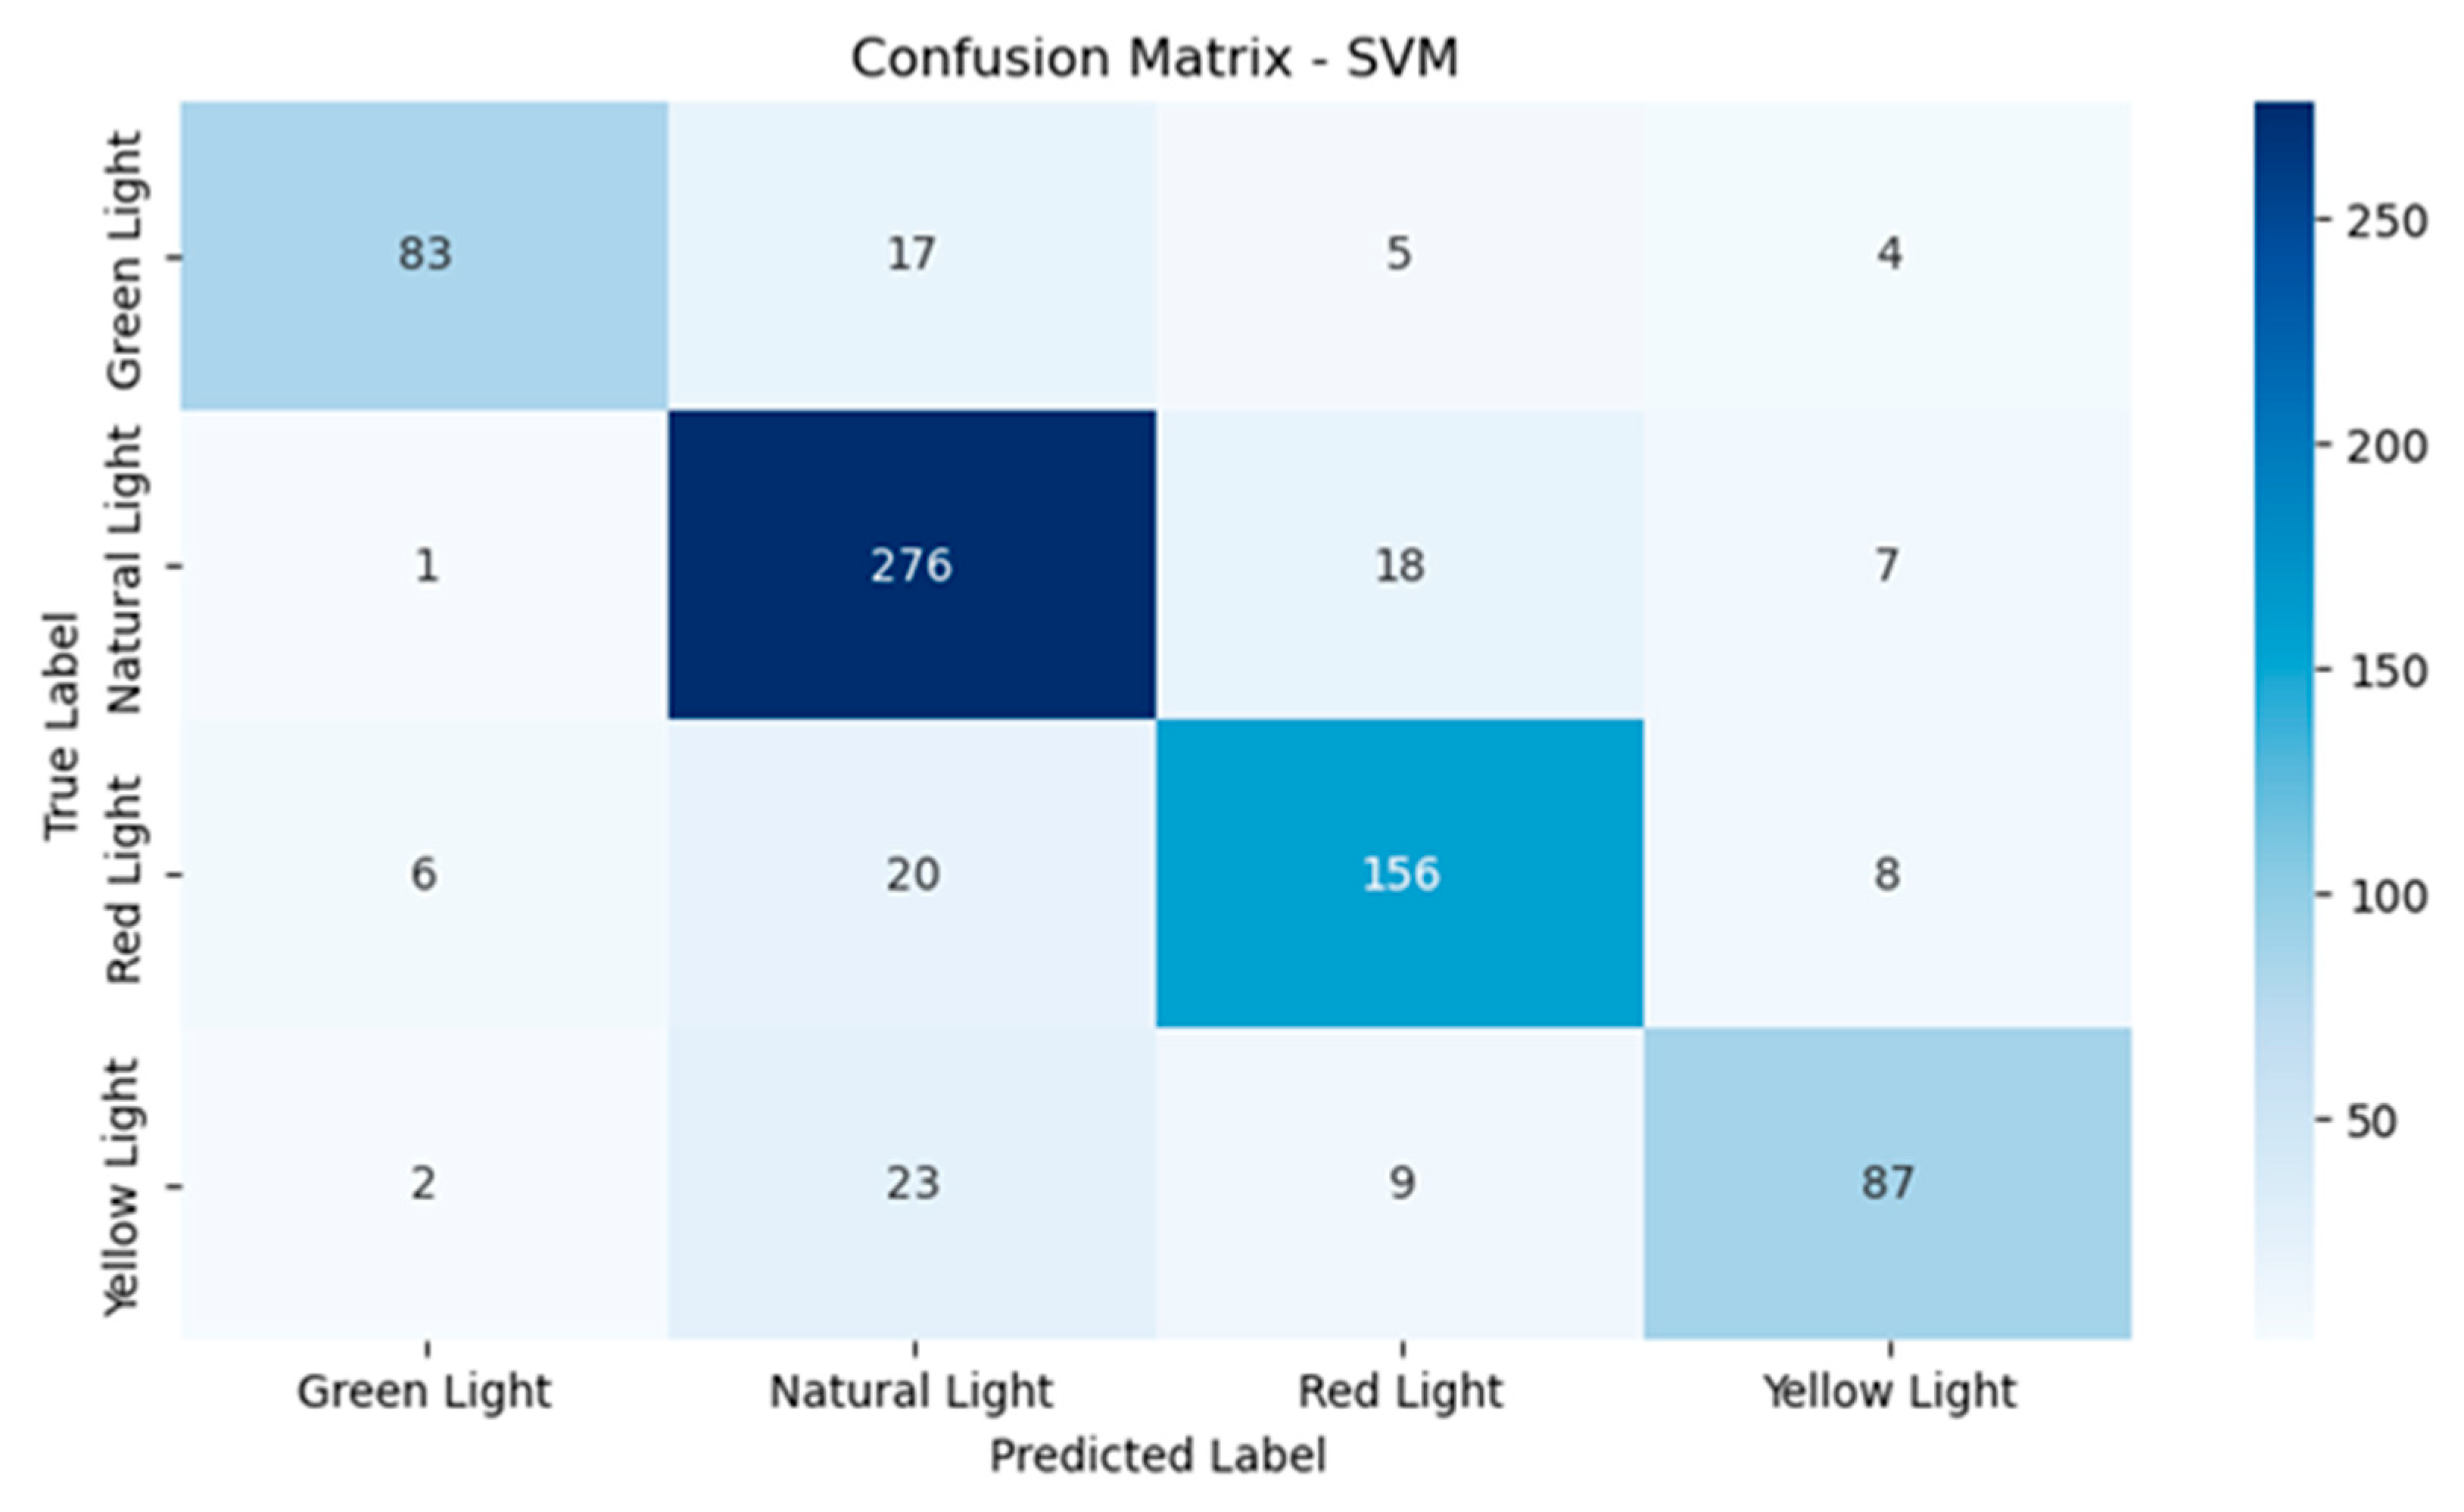
As can be observed from Figure 6, the performance of the SVM model was relatively good, although there are some confusions. With green light, 83 instances were classified correctly, with 17 instances misclassified as natural light and a few more as red light and yellow light. Natural light had 276 instances classified correctly, which means it was very solid in this class, with 18 being misclassified as red light and seven as yellow light. For red light, 156 instances were identified correctly and 20 instances were misclassified as natural light. Finally, yellow light had 87 correct classifications and 23 misclassifications for natural light, which is a challenge in this class.

3.3. Random Forest Model (RFM)

The random forest model (Figure 7) demonstrates a more balanced and consistent performance across all classes. With green light, 102 instances were classified correctly with only three instances being misclassified as natural light, reflecting better handling of this class compared to SVM. For natural light, there were 264 instances that were correctly classified, 18 instances were confused with red light and 14 with yellow light, though these errors were less frequent than in SVM. Under red light, 164 instances were accurately classified and had fewer confusions with natural light at 14 instances compared to SVM. Finally, yellow light had 103 instances that were classified correctly and only eight instances were misclassified as natural light, significantly improving on the performance of SVM for this class.
The feature importance analysis (Figure 8) shows that red light contributed 35% to the predictive capability of the model, followed by natural light (25%), green light (25%), and yellow light (15%). To validate this result, a permutation importance test was conducted by randomly shuffling feature values and measuring the impact on model accuracy. The results confirmed that red light consistently had the highest contribution, with a mean importance of 35.2% ± 2.8% (95% CI) across multiple randomizations. A Kruskal-Wallis H-test (p < 0.05) further indicated a statistically significant difference in feature contributions, confirming that red light had a more substantial effect on plant electrical signal responses than other wavelengths. These findings align with prior studies in plant electrical signal, where red light plays a dominant role in photosynthetic activity, stomatal conductance, and bioelectric signaling.
To explore temporal patterns in the plant electrical signal responses, electrical signals were continuously recorded at 1000 Hz during the entire 8 h light exposure period for each spectral condition. Signal segments were extracted at defined intervals (0–2 h, 2–4 h, 4–6 h, 6–8 h) and analyzed independently using Fast Fourier Transform (FFT) and moving average smoothing to assess signal stability, amplitude modulation, and frequency domain characteristics over time.
Red light stimulation produced a progressive increase in signal amplitude and a shift toward lower frequency components after the first two hours, suggesting potential adaptation processes related to enhanced photosynthetic activity and membrane polarization. In contrast, green and yellow light conditions resulted in relatively stable signals with minimal temporal variation, while natural light showed intermediate variability. These findings suggest that specific light wavelengths not only influence the magnitude of plant electrical signal responses, but also their evolution over time.
This agrees with previous studies in plant electrical signal that have pointed out the participation of certain wavelengths of light in the electrical signal.

4. Discussion

This study demonstrates the feasibility of using electrical signals to classify plant responses under controlled light conditions in hydroponic systems. The signals captured under different light wavelengths reflected distinct physiological processes, with red light showing the most pronounced electrical activity. This supports existing literature on red light’s role in photosynthesis, ion transport, and membrane polarization.
The machine learning approach provided a robust classification framework, with random forest outperforming SVM due to its ability to model non-linear relationships and reduce variance through ensemble learning. These findings reinforce the potential of integrating plant electrical signal monitoring with AI models for real-time crop management. Applications extend to commercial strawberry cultivation, where such systems could automate light adjustments and detect early stress responses. Future studies should expand datasets, explore continuous monitoring over growth cycles, and integrate complementary sensors such as chlorophyll fluorescence or ion flux probes to deepen physiological interpretations. By advancing methods for analyzing bioelectric signals in crops, this research supports the development of precision agriculture tools that are scalable, non-invasive, and biologically informative.

5. Conclusions

The results of this pilot study offer important insights into the classification of electrical signal under the optical stimulation of strawberry plants using machine learning techniques. The main result shows that red light is the most important feature of the random forest model. Strawberry plants show more electrical activity when they receive certain types of light radiation, especially in the red spectrum. The random forest model demonstrated superior performance in minimizing misclassification rates, particularly for yellow light classifications. In contrast, the SVM model showed greater sensitivity to data variations, resulting in elevated misclassification rates. This comparative analysis highlighted the superior ability of the random forest model to handle datasets with diverse feature contributions. Meanwhile, the SVM model exhibited higher sensitivity to data variations, resulting in elevated misclassification rates. The feature importance analysis shows that the variable red light contributes 35% to the predictive capacity of the model. It is followed by natural light and green light with approximately 25% each, while the contribution of yellow light is insignificant at 15%. Finally, in this exploratory study, it would appear that the plant’s electrical signal is sensitive to specific light conditions, with red light having the greatest impact.
The random forest model achieved an accuracy of 88%, outperforming the SVM, which achieved 83%. This suggests that random forest is better at correctly predicting the overall classification of the plant’s electrical signal. Both algorithms showed closely related accuracies, with random forest performing slightly better than SVM, with an average macro accuracy of 88% versus 84%.

Author Contributions

Conceptualization, L.G.-M. and C.G.-S.; methodology, N.T. and R.L.; software, O.C.-D. and C.S.-G.; validation, J.G.P.-M. and M.C.; formal analysis, J.O.-S.; investigation, H.D.-M. All authors have read and agreed to the published version of the manuscript.

Funding

This research received no external funding.

Institutional Review Board Statement

Not applicable.

Informed Consent Statement

Not applicable.

Data Availability Statement

Not applicable.

Acknowledgments

The authors would like to thank Consejo Nacional de Humanidades Ciencias y Tecnologías (CONAHCYT) for the scholarship support for the development of this work.

Conflicts of Interest

The authors declare no conflicts of interest.

References

  1. Ndung’u, R.; Kamweru, P.; Kirwa, A. Action and variation potential electrical signals in higher plants. Afr. J. Biol. Sci. 2021, 3, 1–18. Available online: https://ssrn.com/abstract=3771952 (accessed on 12 December 2024).
  2. Volkov, G.; Ranatunga, A. Plants as Environmental Biosensors. Plant Signal. Behav. 2006, 1, 105–115. [Google Scholar] [CrossRef] [PubMed]
  3. Davies, E. Electrical Signals in Plants: Facts and Hypotheses. In Plant Electrophysiology; Volkov, A.G., Ed.; Springer: Berlin/Heidelberg, Germany, 2006; pp. 407–422. [Google Scholar] [CrossRef]
  4. Vodeneev, V.; Akinchits, E.; Sukhov, V. Variation potential in higher plants: Mechanisms of generation and propagation. Plant Signal. Behav. 2015, 10, e1057365. [Google Scholar] [CrossRef] [PubMed]
  5. Samhita, V.; Prathyusha, K.; Kondaveeti, H. A Review on Plant Signal Processing. In Proceedings of the 2021 7th International Conference on Advanced Computing and Communication Systems (ICACCS), Coimbatore, India, 19–20 March 2021; pp. 124–128. [Google Scholar] [CrossRef]
  6. Ríos-Rojas, L.; Morales-Moraga, D.; Alcalde, J.; Gurovich, L. Use of plant woody species electrical potential for irrigation scheduling. Plant Signal. Behav. 2015, 10, e976487. [Google Scholar] [CrossRef] [PubMed]
  7. Volkov, G. Green plants: Electrochemical interfaces. J. Electroanal. Chem. 2000, 483, 150–156. [Google Scholar] [CrossRef]
  8. Volkov, A.; Markin, V. Active and Passive Electrical Signaling in Plants. Prog. Bot. 2015, 76, 143–176. [Google Scholar] [CrossRef]
  9. Cadosch, D.; Huang, P.; Damian, D.; Miyashita, S.; Aoyama, A.; Pfeifer, R. Attempt on plant machine interface. In Proceedings of the 2011 IEEE International Conference on Systems, Man, and Cybernetics, Anchorage, AK, USA, 9–12 October 2011; pp. 791–796. [Google Scholar] [CrossRef]
  10. Dolfi, M.; Colzi, I.; Morosi, S.; Masi, E.; Mancuso, S.; Del Re, E. Plant electrical activity analysis for ozone pollution critical level detection. In Proceedings of the 2015 23rd European Signal Processing Conference (EUSIPCO), Nice, France, 31 August–4 September 2015; pp. 2431–2435. [Google Scholar] [CrossRef]
  11. Brito, C. Different LED light intensity and quality change perennial ryegrass (Lolium perenne L.) physiological and growth responses and water and energy consumption. Front. Plant Sci. 2023, 14, 1160100. [Google Scholar] [CrossRef] [PubMed]
  12. Bantis, F.; Koukounaras, A. Impact of Light on Horticultural Crops. Agriculture 2023, 13, 828. [Google Scholar] [CrossRef]
  13. Abdouli, D. Effects of Monochromatic Light on Growth and Quality of Pistacia vera L. Plants 2023, 12, 1546. [Google Scholar] [CrossRef] [PubMed]
  14. Paradiso, R.; Proietti, S. Light-quality manipulation to control plant growth and photomorphogenesis in greenhouse horticulture: The state of the art and the opportunities of modern LED systems. J. Plant Growth Regul. 2022, 41, 742–780. [Google Scholar] [CrossRef]
  15. Jiang, C. Integrating omics reveals insights into tomato abaxial/adaxial leafy supplemental lighting. Front. Plant Sci. 2023, 14, 1118895. [Google Scholar] [CrossRef] [PubMed]
  16. Kobayashi, T.; Tabuchi, T. Tomato cultivation in a plant factory with artificial light: Effect of UV-A irradiation during the growing period on yield and quality of ripening fruit. Hortic. J. 2022, 91, 16–23. [Google Scholar] [CrossRef]
  17. Hanyu, H.; Shoji, K. Effects of blue light and red light on kidney bean plants grown under combined radiation from narrow-band light sources. Environ. Control Biol. 2000, 38, 13–24. [Google Scholar] [CrossRef]
  18. Savini, G.; Neri, D.; Zucconi, F.; Sugiyama, N. Strawberry Growth and Flowering. Int. J. Fruit Sci. 2005, 5, 29–50. [Google Scholar] [CrossRef]
  19. Kadir, S.; Carey, E.; Ennahli, S. Influence of High Tunnel and Field Conditions on Strawberry Growth and Development. Hort Sci. 2006, 41, 329–335. [Google Scholar] [CrossRef]
  20. Lamont, W.; Orzolek, M.; Holcomb, E.; Crassweller, M.; Demchak, K.; Burkhart, E.; White, L.; Dye, B. Penn state high tunnel extension program. HortTechnology 2002, 12, 732–735. [Google Scholar] [CrossRef]
  21. Zhou, J.; Yuan, W.; Di, B.; Zhang, G.; Zhu, J.; Zhou, P.; Ding, T.; Qian, J. Relationship among Electrical Signals, Chlorophyll Fluorescence, and Root Vitality of Strawberry Seedlings under Drought Stress. Agronomy 2022, 12, 1428. [Google Scholar] [CrossRef]
  22. Trivellini, A. LED lighting to produce high-quality ornamental plants. Plants 2023, 12, 1667. [Google Scholar] [CrossRef] [PubMed]
  23. Konrad, K. Optogenetic Methods in Plant Biology. Annu. Rev. Plant Biol. 2023, 74, 313–339. [Google Scholar] [CrossRef] [PubMed]
  24. Torre, M.Z.; Sifuentes-Gallardo, C.; González-Ramírez, E.; Cruz-Dominguez, O.; Ortega-Sigala, J.; Díaz-Flórez, G.; Vargas, J.I.; Durán-Muñoz, H. Electrical Signal Characterization of Aloe vera Var. Chinensis Using Non-Parametric and Parametric Signal Analysis. Appl. Sci. 2025, 15, 1708. [Google Scholar] [CrossRef]
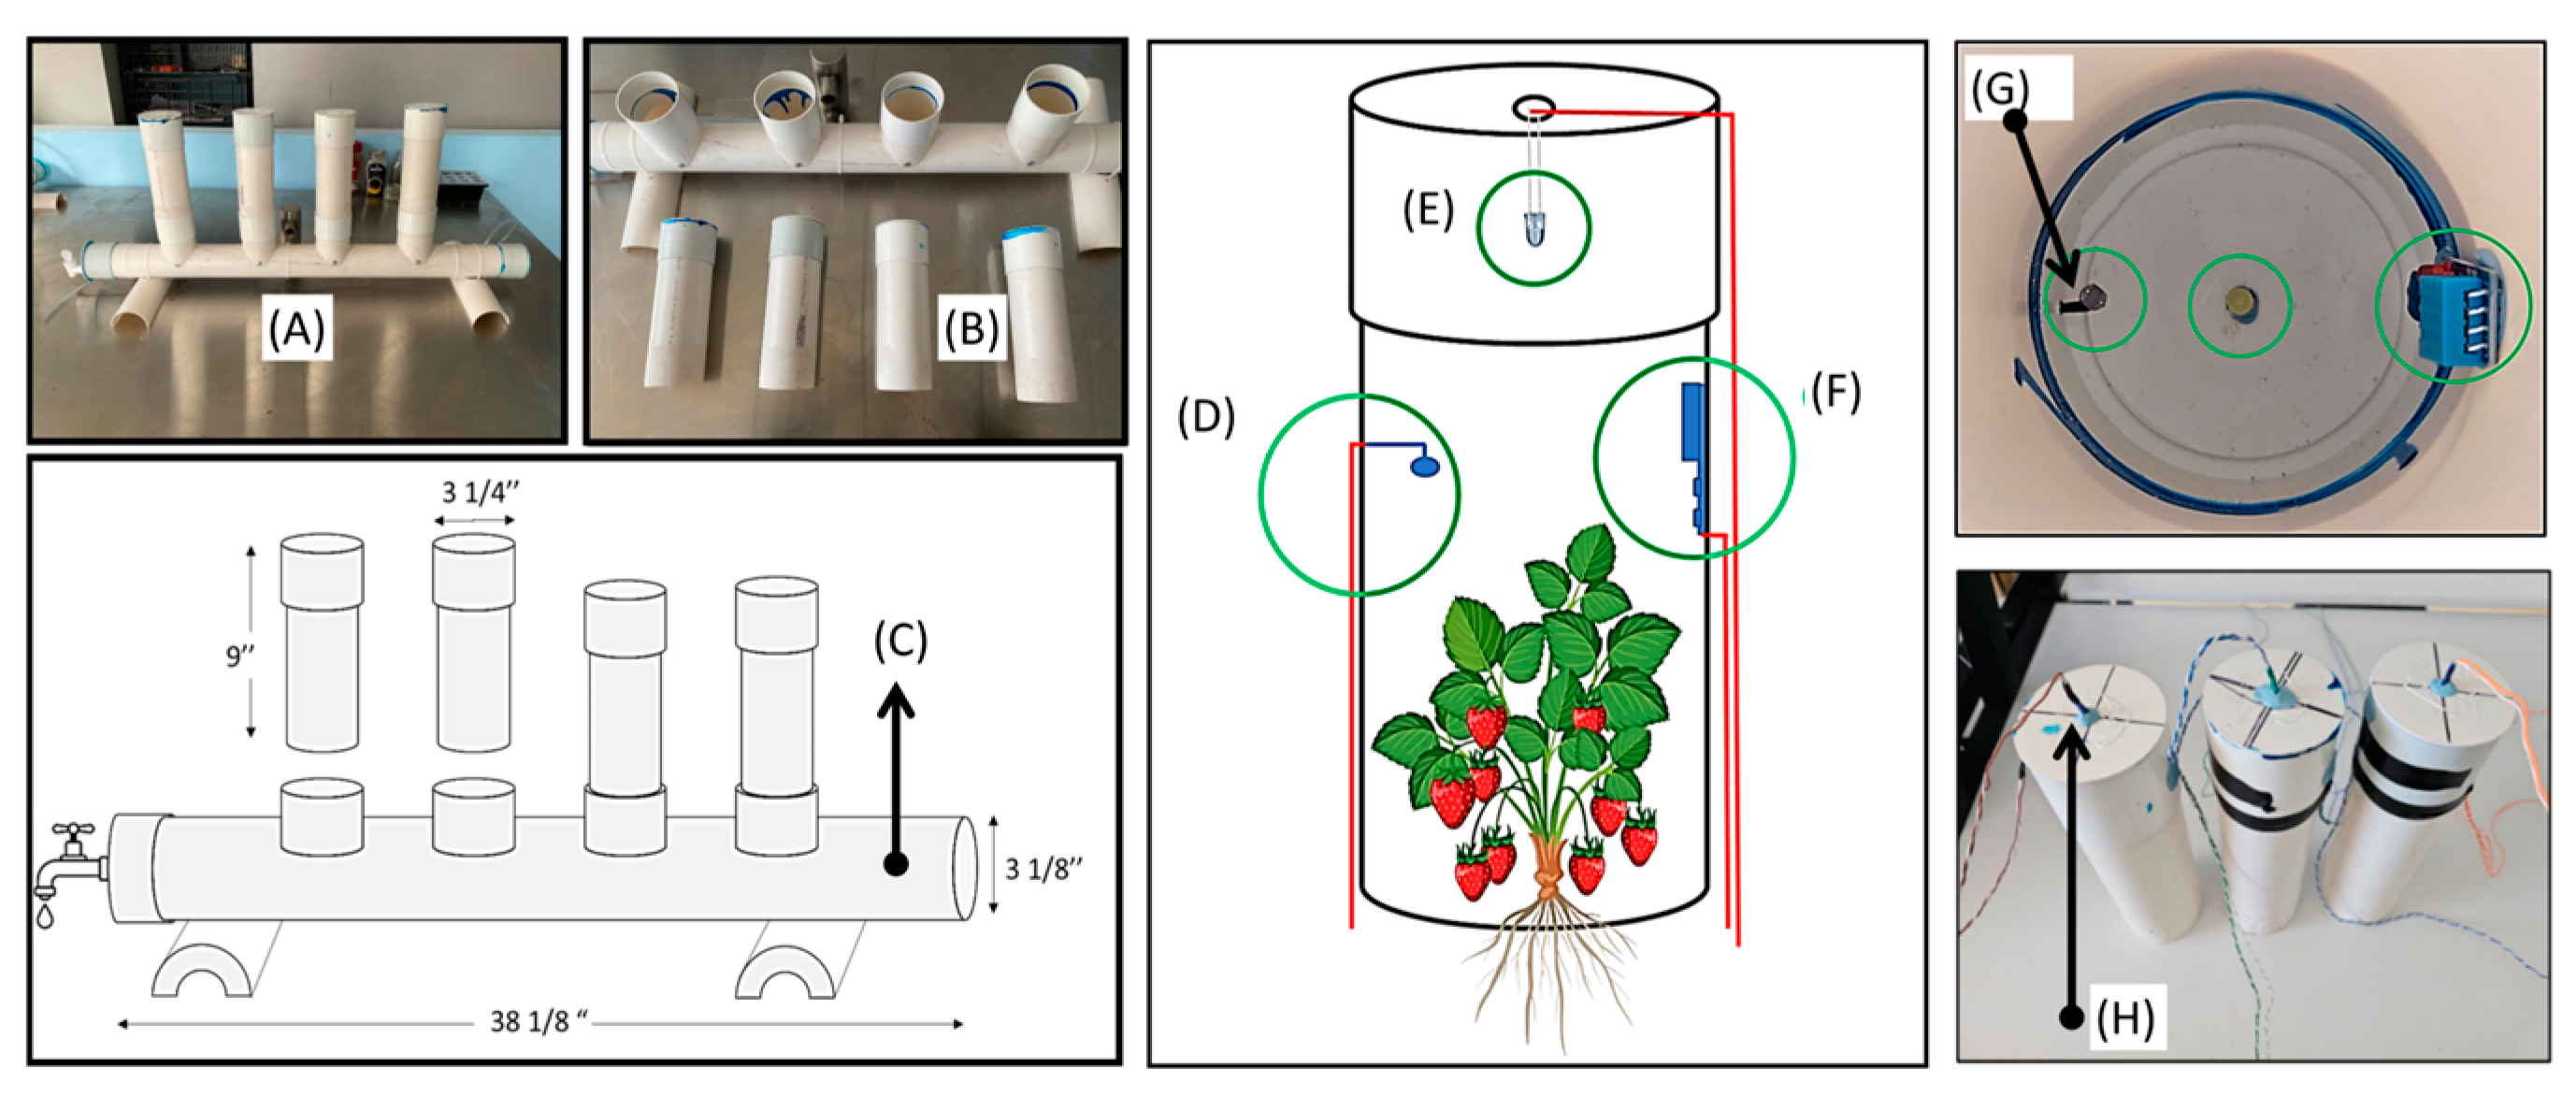
Figure 1. (A) Hydroponic system, (B) tubes of light stimulation, (C) hydroponic system support, (D) photodiode sensor, (E) LED, (F) temperature-humidity sensor, (G) internal view of the photodiode sensor, and (H) LED holder.
Engproc 87 00044 g001
Figure 2. Electronic setup to determine the electrical signal. (A) Arduino board, (B) SD module, (C) 9 V batteries, and (D) LM324N amplifier.
Engproc 87 00044 g002
Figure 3. (a) Electronic setup; (b) optical stimulation of strawberry plants; (c) measurement of electrical signal.
Engproc 87 00044 g003
Figure 4. Electrical signal of the strawberry plant exposed to (a) red light, (b) green light, (c) natural light, and (d) yellow light.
Engproc 87 00044 g004
Figure 5. Comparison of SVM and random forest model performance.
Engproc 87 00044 g005
Figure 6. Confusion matrix for the support vector machine model.
Engproc 87 00044 g006
Figure 7. Confusion matrix for the random forest model.
Engproc 87 00044 g007
Figure 8. Feature importance analysis.
Engproc 87 00044 g008
Table 1. Optical and electronic characteristics of LEDs.
LEDLuminous Intensity
[mcd at 20 mA]
Dominant Wavelength
[nm] at 20 mA
Red light40635
Yellow light9.8587
Green light45520
Table 2. Programming code.
#include <SD.h>
const int pin_analogico = A0;
// Entrada de datos analogicos
const int chipSelect = 8;
// Pin de selección de la tarjeta SD
int valor = 0;
//inicializamos valores en cero
float volt = 0.0;
// inicializamos el valor del voltaje en cero
// Parámetros del filtro pasa bandas
const int numMuestras = 10;
// Número de muestras para el filtro de media móvil
float muestras[numMuestras] = {0};
// Buffer para almacenar las últimas muestras
void setup() {
Serial.begin(9600);
// Inicializar la tarjeta SD
if (SD.begin(chipSelect)) {
Serial.println(“Tarjeta SD inicializada correctamente”);
} else {
Serial.println(“Error al inicializar la tarjeta SD”);
return;
}
}
void loop() {
valor = analogRead(pin_analogico);
volt = valor * 5.0/1023.0;
// Aplicar el filtro pasa bandas (media móvil)
float suma = volt;
for (int i = 0; i < numMuestras − 1; i++) {
muestras[i] = muestras[i + 1];
suma += muestras[i];
}
muestras[numMuestras − 1] = volt;
float resultadoFiltro = suma / numMuestras;
Serial.println(resultadoFiltro);
// Guardar el resultado en el archivo en la tarjeta SD
File dataFile = SD.open(“datos.txt”, FILE_WRITE);
if (dataFile) {
dataFile.println(resultadoFiltro);
dataFile.close();
} else {
Serial.println(“Error al abrir el archivo en la tarjeta SD”);
}
delay(1000);
// Esperar antes de la próxima lectura
}
Table 3. Comparison of model results.
SVMRandom Forest Model
Accuracy0.830.88
Precision (Macro Avg)0.840.88
Recall (Macro Avg)0.800.87
F1 Score (Macro Avg)0.820.88
Disclaimer/Publisher’s Note: The statements, opinions and data contained in all publications are solely those of the individual author(s) and contributor(s) and not of MDPI and/or the editor(s). MDPI and/or the editor(s) disclaim responsibility for any injury to people or property resulting from any ideas, methods, instructions or products referred to in the content.