Abstract
One of the ingredients that make up concrete is coarse aggregate. The coarse aggregate used is generally in a non-uniform shape (a mixture of cubic, oval or flat, or neither oval nor flat). This research uses coarse aggregate in the form of cubes only and in the form of a mixture, with the aim of determining the compressive strength of concrete using the Indian standard mixture design method and the ACI method. The materials used are cement obtained on the market with various types of PPC, OPC and PCC, fine aggregate (from Muntilan, Yogya, Indonesia) and local coarse aggregate (from Jumantono, Karanganyar, Indonesia), specifically coarse aggregate in the form of cubes and mixtures. The shape of the test objects is cylindrical, and the testing age of the test objects is 7 and 14 days with a design concrete compressive strength of 35 MPa. The highest compressive strength results were obtained for the following type of cement variation: PPC = 14.21 MPa (7 days) and 16.62 MPa (14 days). The lowest compressive strength results for the PCC cement variation were 7.45 MPa (7 days) and 8.75 MPa (14 days). Meanwhile, the compressive strength value of concrete using the ACI method obtained the highest compressive strength results for the PPC cement variation of 20.11 MPa (7 days) and 33.74 (14 days), and the lowest concrete compressive strength for the PCC cement variation was 11.96 MPa (7 days) and 15.26 MPa (14 days). Also, from the research results, the highest packing density value obtained in the CA and FA mixture aggregate test was 0.751 g/cm3, in the proportion CA3/8″:CA3/16″:FA = 12%:28%:60%. It is known that the use of PPC cement can produce the highest compressive strength values compared to using PCC and OPC cement, which shows that even when the same form of coarse aggregate and the same design concrete quality are used, variations in cement can affect the high compressive strength of the concrete. The use of coarse aggregate in the form of cubes produces higher aggregate packing density and compressive strength of concrete compared to using coarse aggregate in mixed forms (cubes, flat and oval).
1. Introduction
The main composition of concrete includes aggregate, water and Portland cement or what we usually call conventional concrete [1]. Concrete is a very important material and is widely used to build various infrastructures such as buildings, bridges, roads and the underground, otherwise known as foundations [2]. In the main composition of concrete, there is coarse aggregate, with different shapes (a mixture of cubic, oval or flat, or neither oval nor flat) [3].
In dense concrete research, the packing density method is used. Packing density itself is a method of planning an aggregate mixture to obtain the highest possible density by minimizing empty spaces between granules [4]. The principle of the packing density theory is to plan a selection of grain gradations that can reduce voids between aggregates to the maximum [5]. In some of these studies, it is used to obtain the maximum density of concrete, but in its implementation, it does not pay attention to the shape of the coarse aggregate which can include cubes, ovals or flats, or can be not ovals and not flats [6].
This research aims to determine the packing density value of combined aggregate in the form of cubes with aggregate in the form of a mixture of two aggregate fractions measuring 3/8″ and 3/16″ and fine aggregate. It also aims to find out the compressive strength value of concrete using coarse aggregate in the form of cubes and a mixture of cement variations (PPC, OPC and PCC) and variations in the curing times of 7 days and 14 days. Finally, it also aims to find out the effect when using the Indian standard (packing density) [7,8,9,10,11] and ACI concrete-mix planning methods [12].
The benefits of the research carried out are expected to be able to determine the effect of coarse aggregate shapes (cubes and mixtures) on the compressive strength of concrete by considering various types of cement (PPC, OPC and PCC), curing times (7 days and 14 days) and concrete design methods (IS and ACI). It is also hoped that it can become an alternative/reference for making concrete mixes by contractors, consultants and owners.
Previously, the researchers studied related topics and concluded as follows:
In concrete, an aggregate particle shape has been linked to durability [13], workability [14], compressive strength [15] and split tensile strength [16]. Processing techniques are widely used to analyze the shape characteristics of aggregate particles [17]. The test results show that there is a good correlation between several aggregate shape properties and compressive strength [18]. Thus, the shape of the particles affects the strength of the aggregate and the strength of the mixture of materials such as concrete, asphalt and railroad aggregate [19]. Aggregates with a rough surface compared to a smooth surface will bind stronger to both asphalt and concrete [20]. Generally, the aggregate with a rough surface is crushed stone [21]. Aggregate strength influences the production of high-strength concrete [22,23]. The shape of the aggregate produced is influenced by the stone-crusher model [24,25]. Statistical analysis shows that the shape, surface texture and modulus of elasticity of aggregate are the main causes of variations in concrete strength. The greater the strength of the concrete, the more important these influences are [26]. Also, the results of previous research show that the physical characteristics of the aggregate determine the strength of the concrete [27]. The compressive strength of concrete produced with angular and round aggregates increases with increasing aggregate size [15]. The influence of coarse aggregate type is more prominent in high-strength concrete due to the limited water/cement ratio [28]. The aggregate surface texture has the greatest effect on the fracture behavior of concrete at early ages [29]. Discrete Element Methods (DEM) are increasingly used in fracture studies of nonhomogeneous continuous media, such as rock and concrete. A 2D circular rigid DEM formulation, developed for modeling concrete, has been adopted [30]. Some of the available analytical methods are affected by angularity and changes in aggregate shape and, as a result, are not suitable for distinguishing between these two characteristics. In addition, some analysis methods are adequate for measuring texture and angularity when changes are made to the image resolution and magnification level [31]. To distinguish aspects of rock particle shape, and to discover through empirical analysis and consideration the most appropriate parameters to describe these aspects. Roundness has three types of measures, namely those that estimate the average roundness of corners, those based on the sharpest corners and those that estimate the convexity in the particle outline. The modified Wentworth sphericity is the most satisfactory for estimating the roundness of the sharpest corners. The Cailleux Roundness Index should not be used because it includes aspects of roundness and shape. Unambiguous interpretations of particle shapes in terms of source materials and processes will always be difficult due to the large number of natural variables and their interactions [32]. In measurements using the image method, special calipers are used to measure the length of the longest 3D dimension and the thinnest 3D dimension of the particle [33]. The angularity of the coarse aggregate can be installed with a normal distribution or log-normal distribution at a 95% confidence level, which will result in an increase in the split tensile strength of concrete with an increase in the aspect ratio or angularity index of the coarse aggregate [34]. The interfacial tensile and shear bond strengths increase and tend to remain constant as the aggregate surface roughness increases. Splitting tensile strength, uniaxial compressive strength, elastic modulus and Poisson’s ratio increase with the increase in surface roughness of coarse aggregate, but the increase decreases gradually [35]. Quantification of shape, angles and surface texture is important because high-quality pavements are required to meet increasing traffic volumes and loads [36]. Based on image analysis, with a review of angularity, surface texture and aggregate surface area, the resulting area differences based on the number of imaging pixels from each 2D image before and after the same cycle of erosion and dilation are closely related to the surface micro-irregularities of the aggregate particles [37]. The shape of the aggregate has an influence on the strength of concrete [38]. For fine or coarse aggregates in terms of shape characteristics, higher water requirements and strength on rougher surfaces affect the compressive strength of concrete [39]. Compressive strength increases with increasing cement content, as expected. An aggregate with the largest grain size of 12.5 mm provides the highest compressive strength and ductility compared to other grain sizes and is chosen as the optimal choice and finally, a sharp-edged aggregate has higher compressive strength [40]. Various degradation measurement methods were considered, and appropriate engineering assessments were carried out on the engineering properties of aggregates in construction materials [41]. The shape and configuration of the aggregate have an effect on the stress–strain relationship of concrete [42]. Concrete strength varies as a function of the form of the coarse aggregate, with the aggregate form being an important parameter in determining the suitability of the coarse aggregate for preparing cement concrete for rigid pavements [43]. Normal concrete-mix proportioning methods that combine aggregate shape characteristics often lead to inconsistent results and variable concrete properties. Thus, the quantification of these properties is important to further rationalize the concrete mix proportioning process [44]. The DIP method yields more information about particle shape than the manual method. It is used to measure the thickness/width ratio and average length/width of aggregates directly [45]. Uniform gradation of aggregate with the right amount of each size produces an aggregate mixture with a high density and concrete with low water requirements [46].
2. Research Methods
The implementation of this research was carried out using qualitative research methods in a way that consisted of determining the concrete constituent materials to be used, including water, cement (PPC, OPC and PCC), fine aggregate ex Muntilan and coarse aggregate ex Karanganyar with a maximum size of 20 mm (CA 4/8″ and 4/16″), using a mixed design of Indian standard (IS) and ACI methods, and treatment times of 7 days and 14 days. The focus of this research is on the compressive strength value using coarse aggregate in the form of cubes compared to that in the form of a mixture. The research stages carried out were as follows:
- 2.1
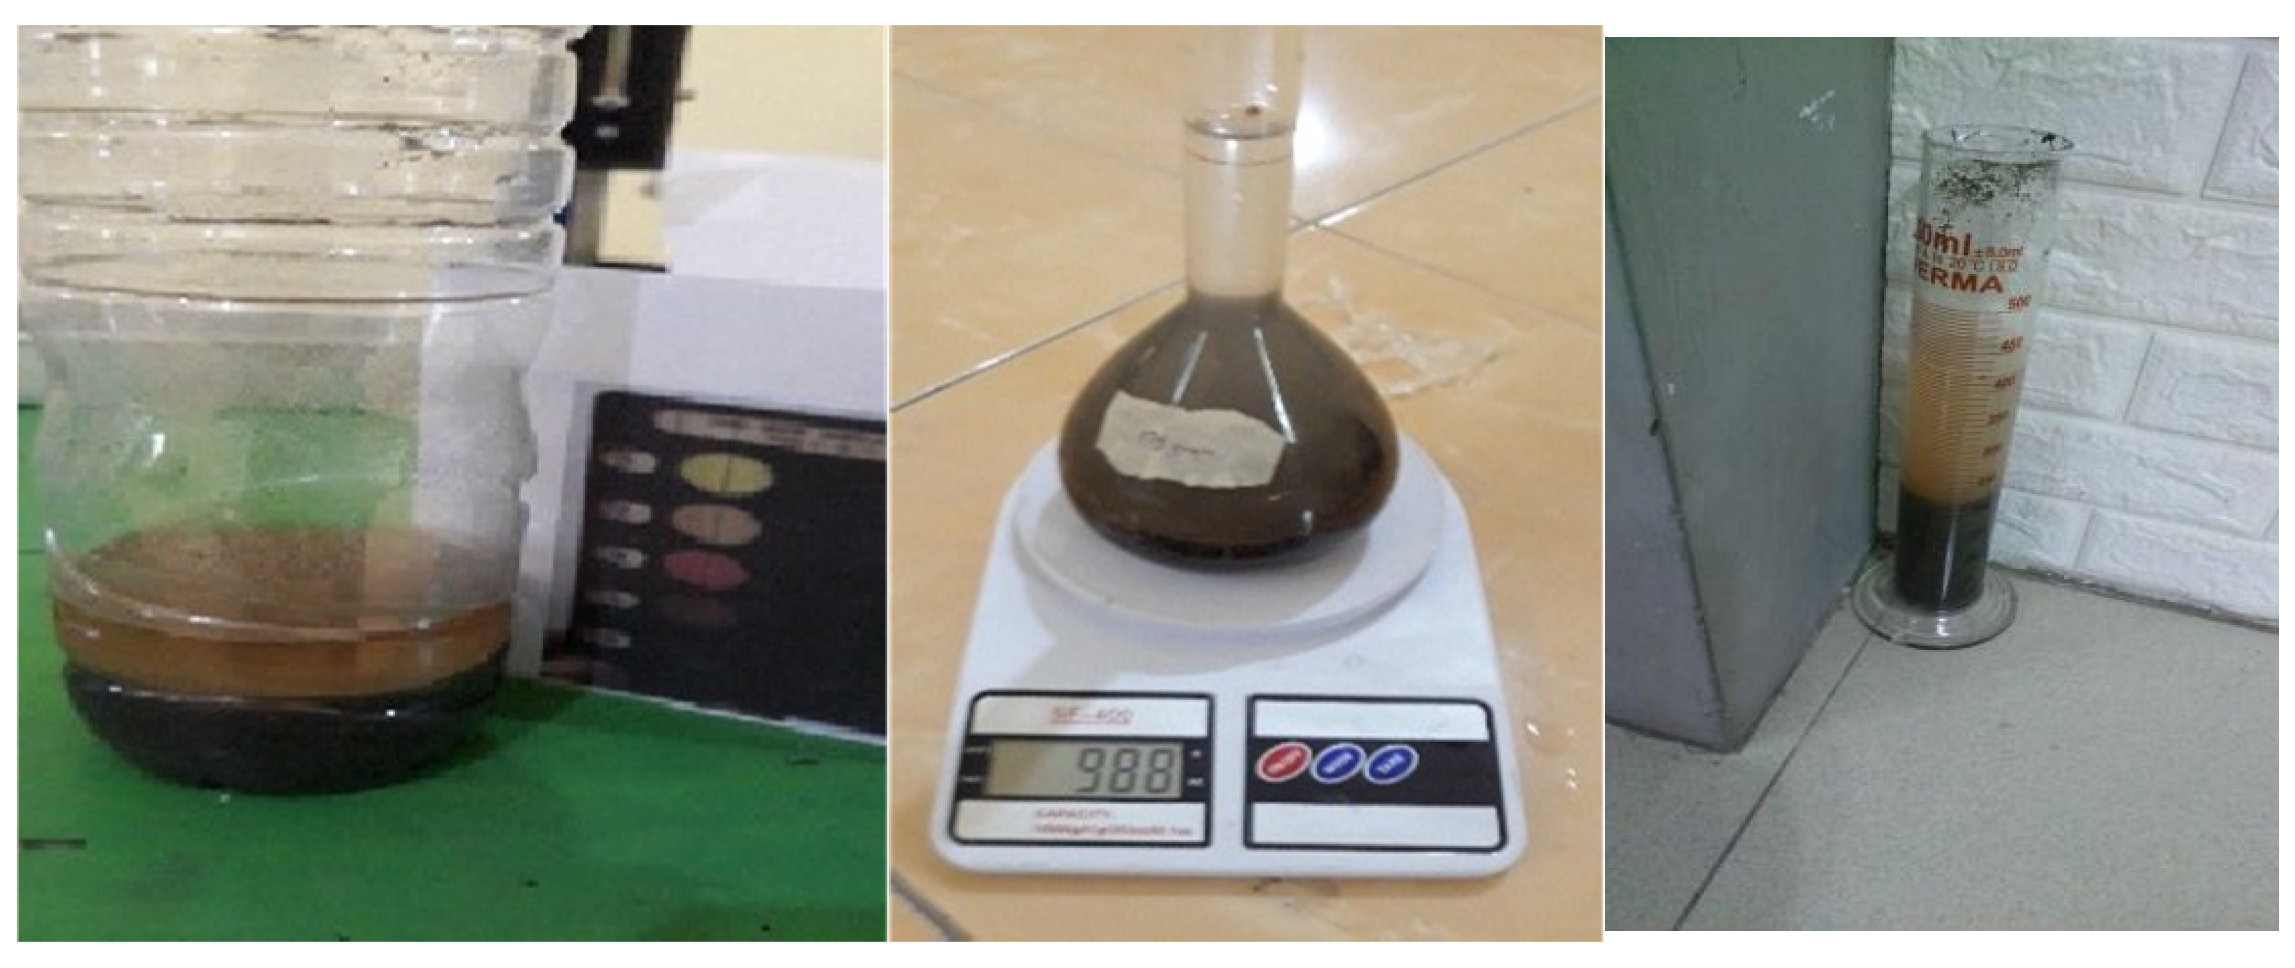
- All constituent materials were tested to determine that they meet the requirements for being used as constituent materials for concrete [47,48,49,50,51,52,53,54,55,56,57,58,59,60,61]; Figure 1 and Figure 2;
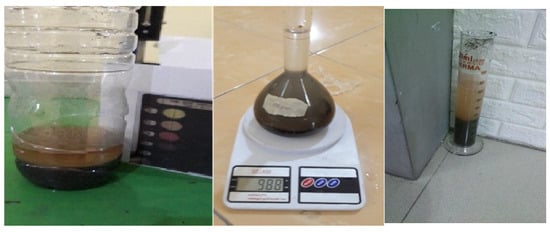 Figure 1. Inspection of concrete constituent materials.
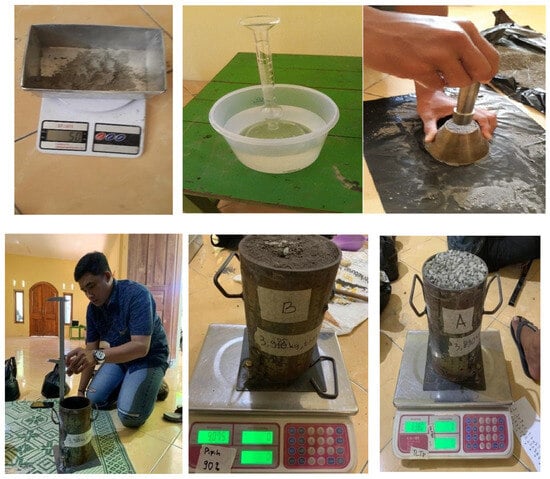 Figure 2. Packing density test of coarse aggregate and fine aggregate.
 - 2.2
- Then, the mixed form of the coarse aggregate was sorted to obtain cube-shaped coarse aggregate in 2 existing fractions, namely sizes 20 mm and 12.5 mm;
- 2.3
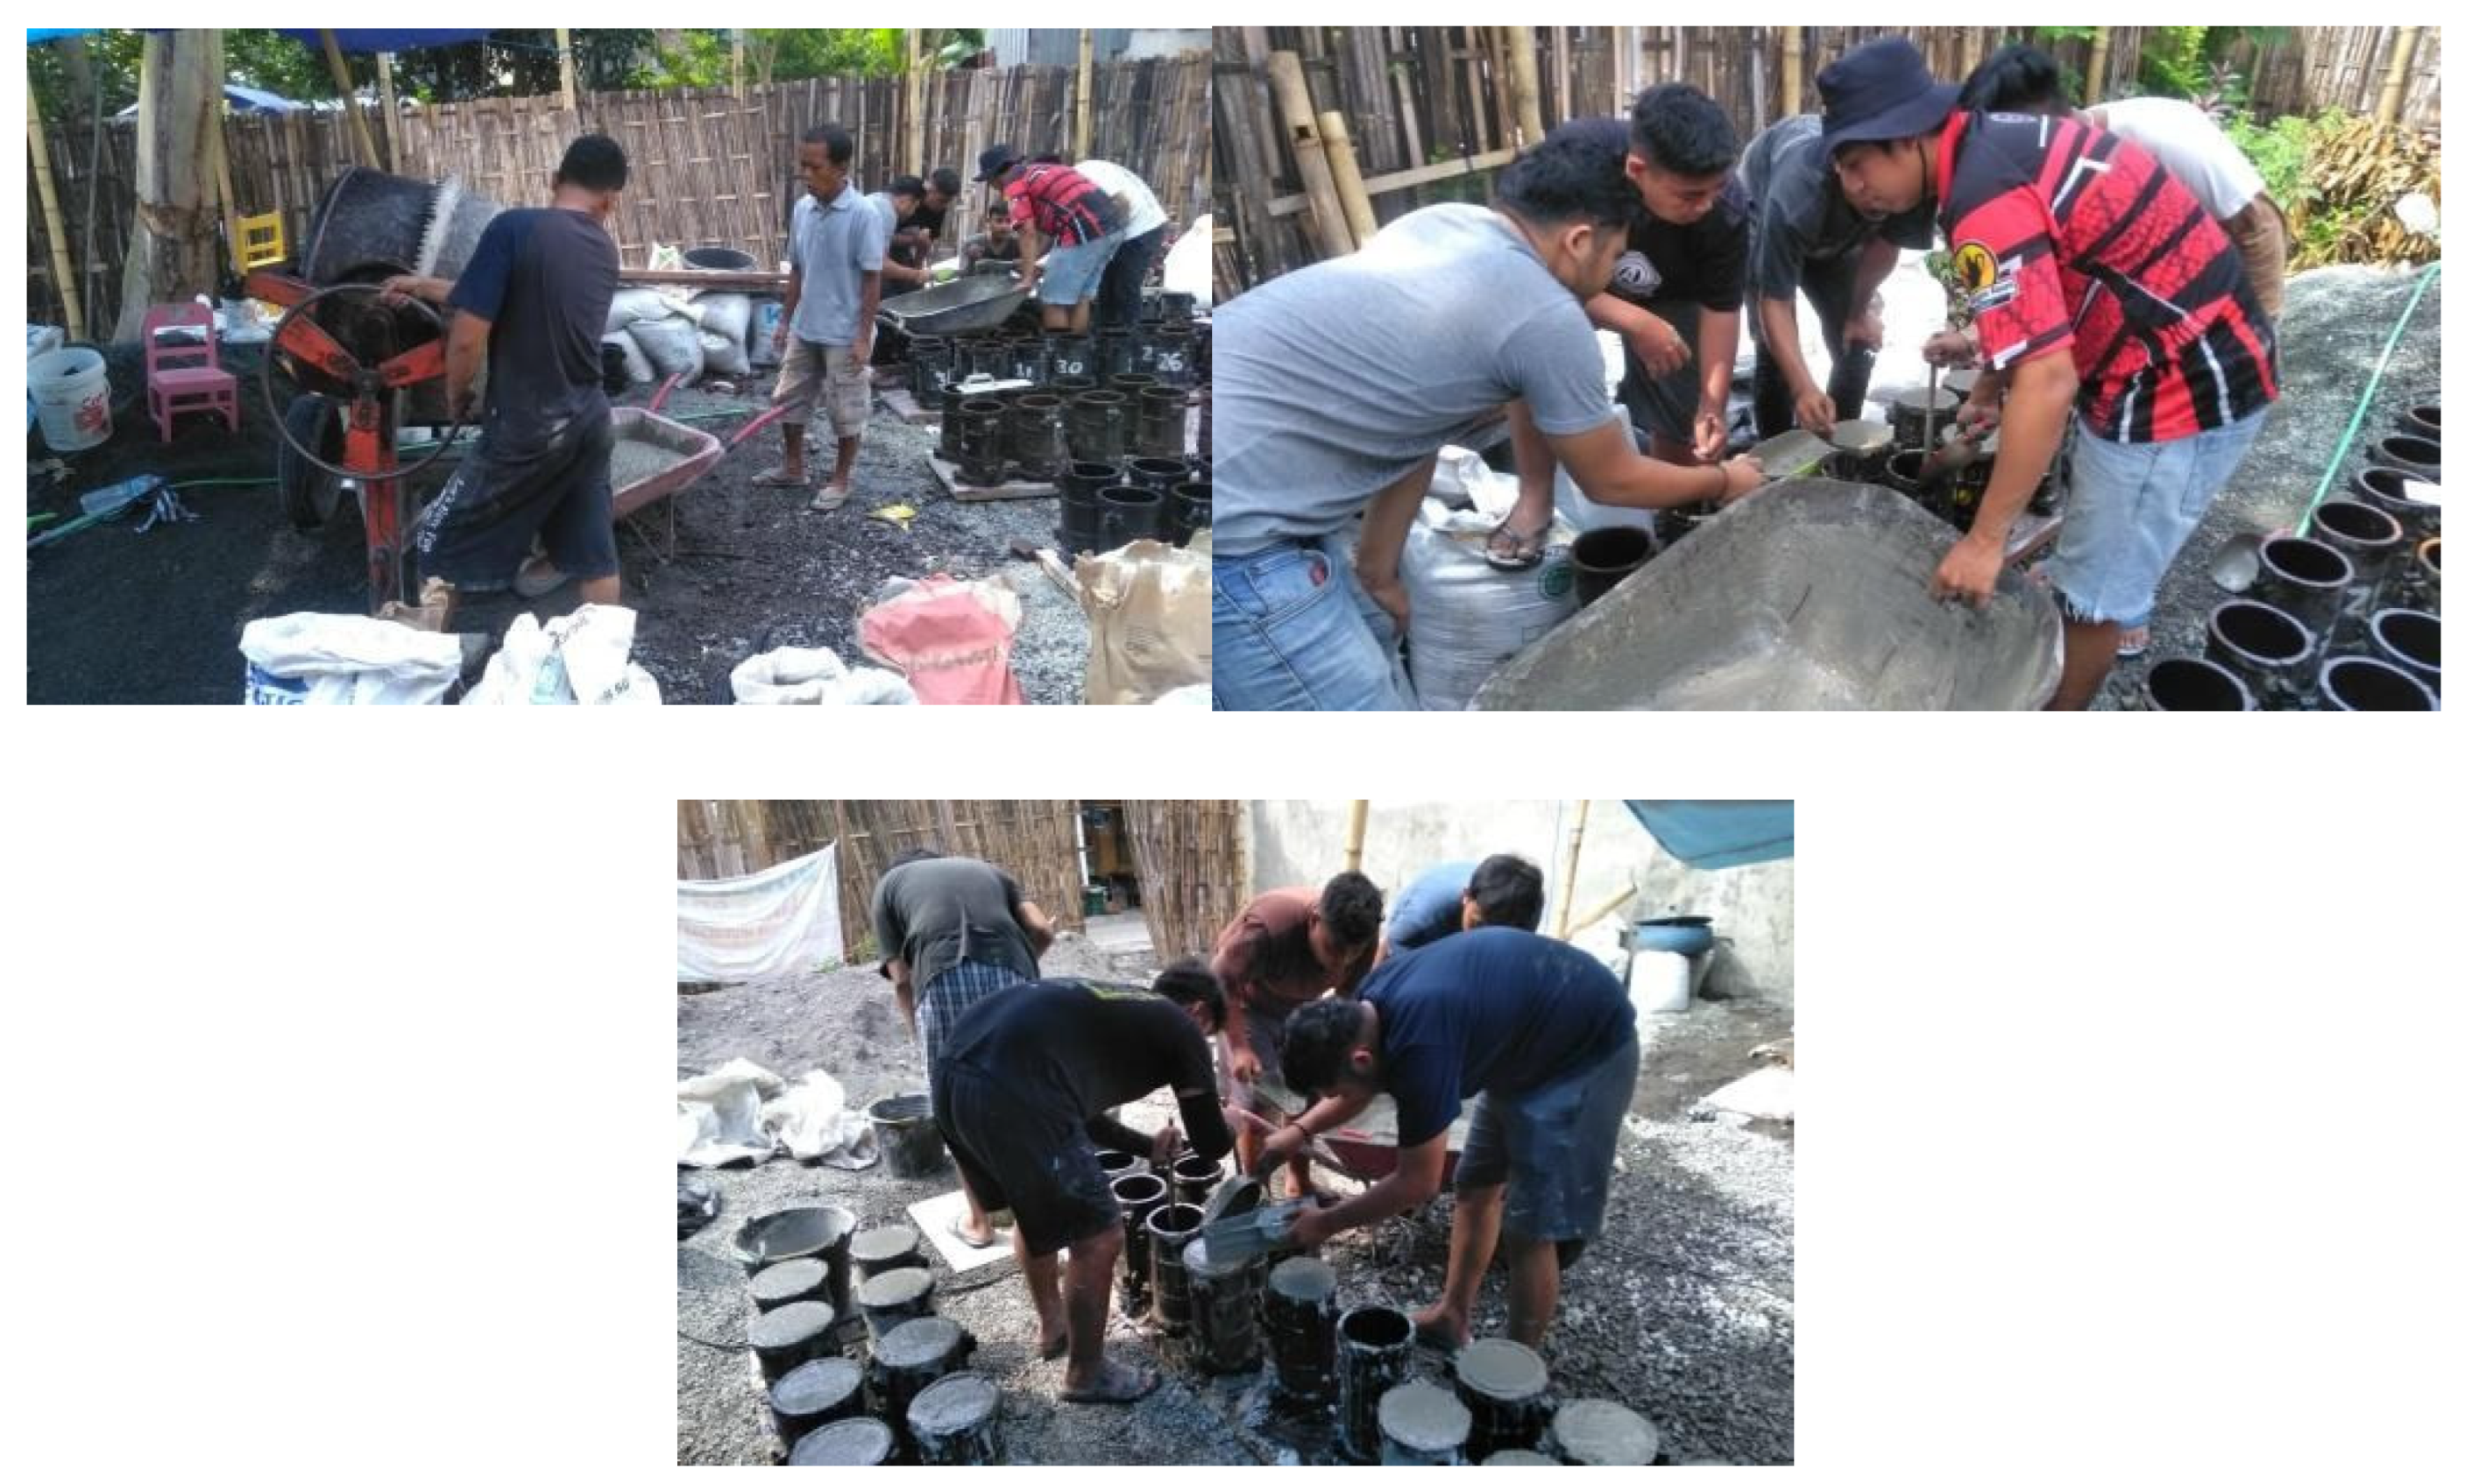
- The packing density of the 2 types of coarse aggregate fractions was tested to obtain the largest packing density value for the weight presentation composition of the coarse aggregate fraction, followed by combining with fine aggregate; Figure 3;
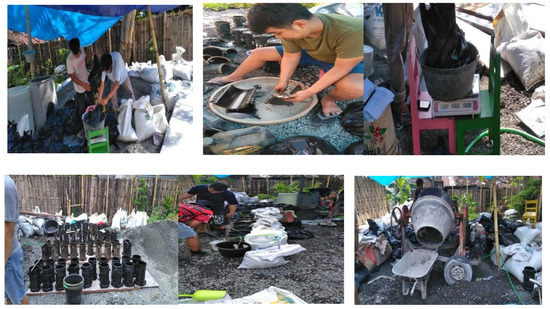 Figure 3. Preparation of constituent materials and tools for making concrete mix.
 - 2.4
- After that, the concrete mix design was calculated using the Indian standard (IS) [7] method and the ACI method [12];
- 2.5
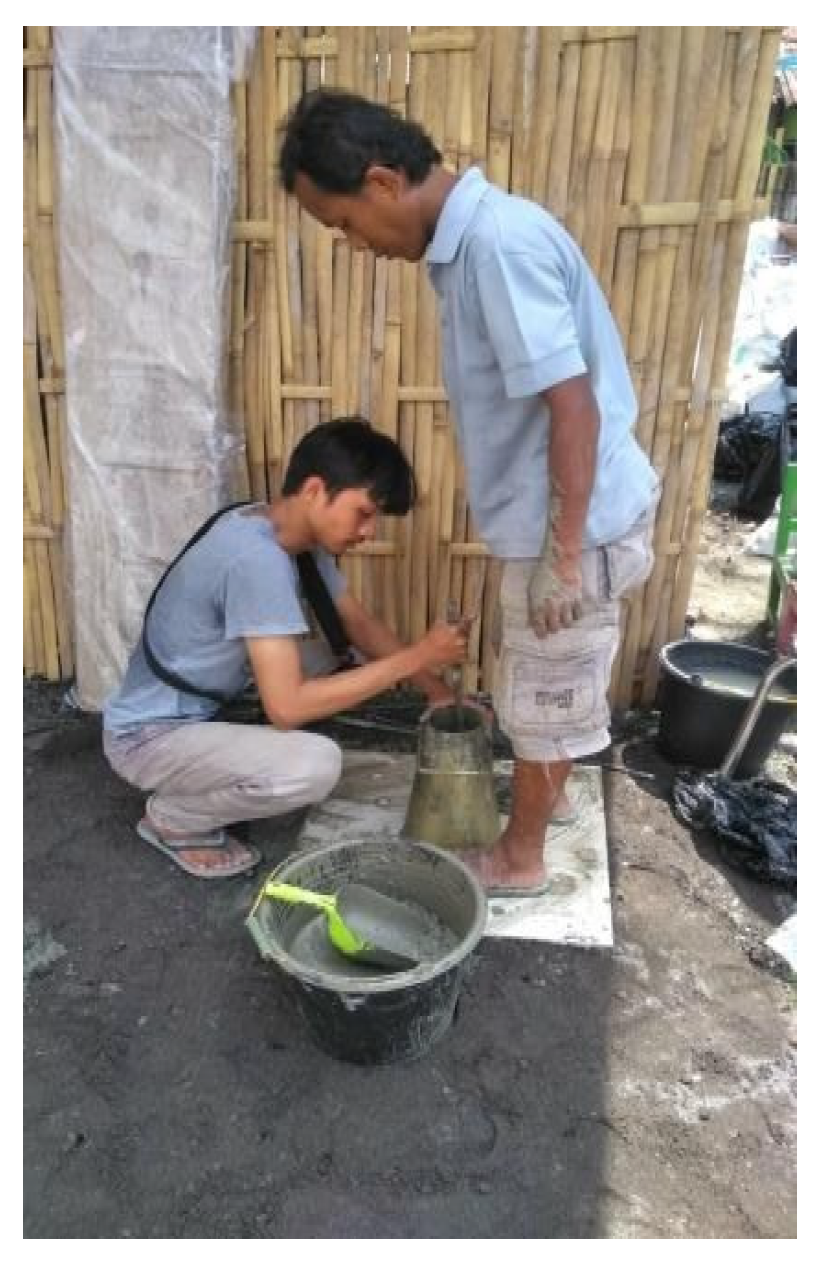
- The next step was to make a concrete mixture [62], Figure 4; and take the fresh concrete to be tested [63] with a slump test, Figure 5; and make concrete test specimens into cylindrical concrete molds measuring 15 cm and 30 cm in diameter [64];
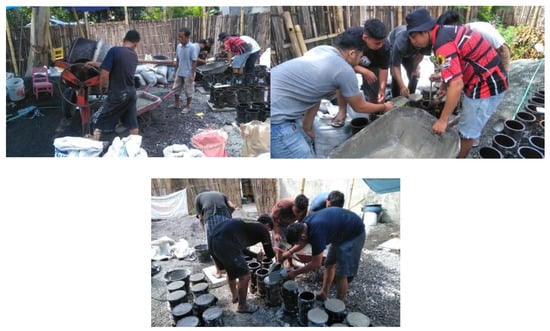 Figure 4. Making concrete samples.
 Figure 5. Slump Test.
 - 2.6
- After at least a day, the test object was removed from the mold and placed in a soaking place or by sprinkling the entire surface with water every day to care for the concrete [65];
- 2.7
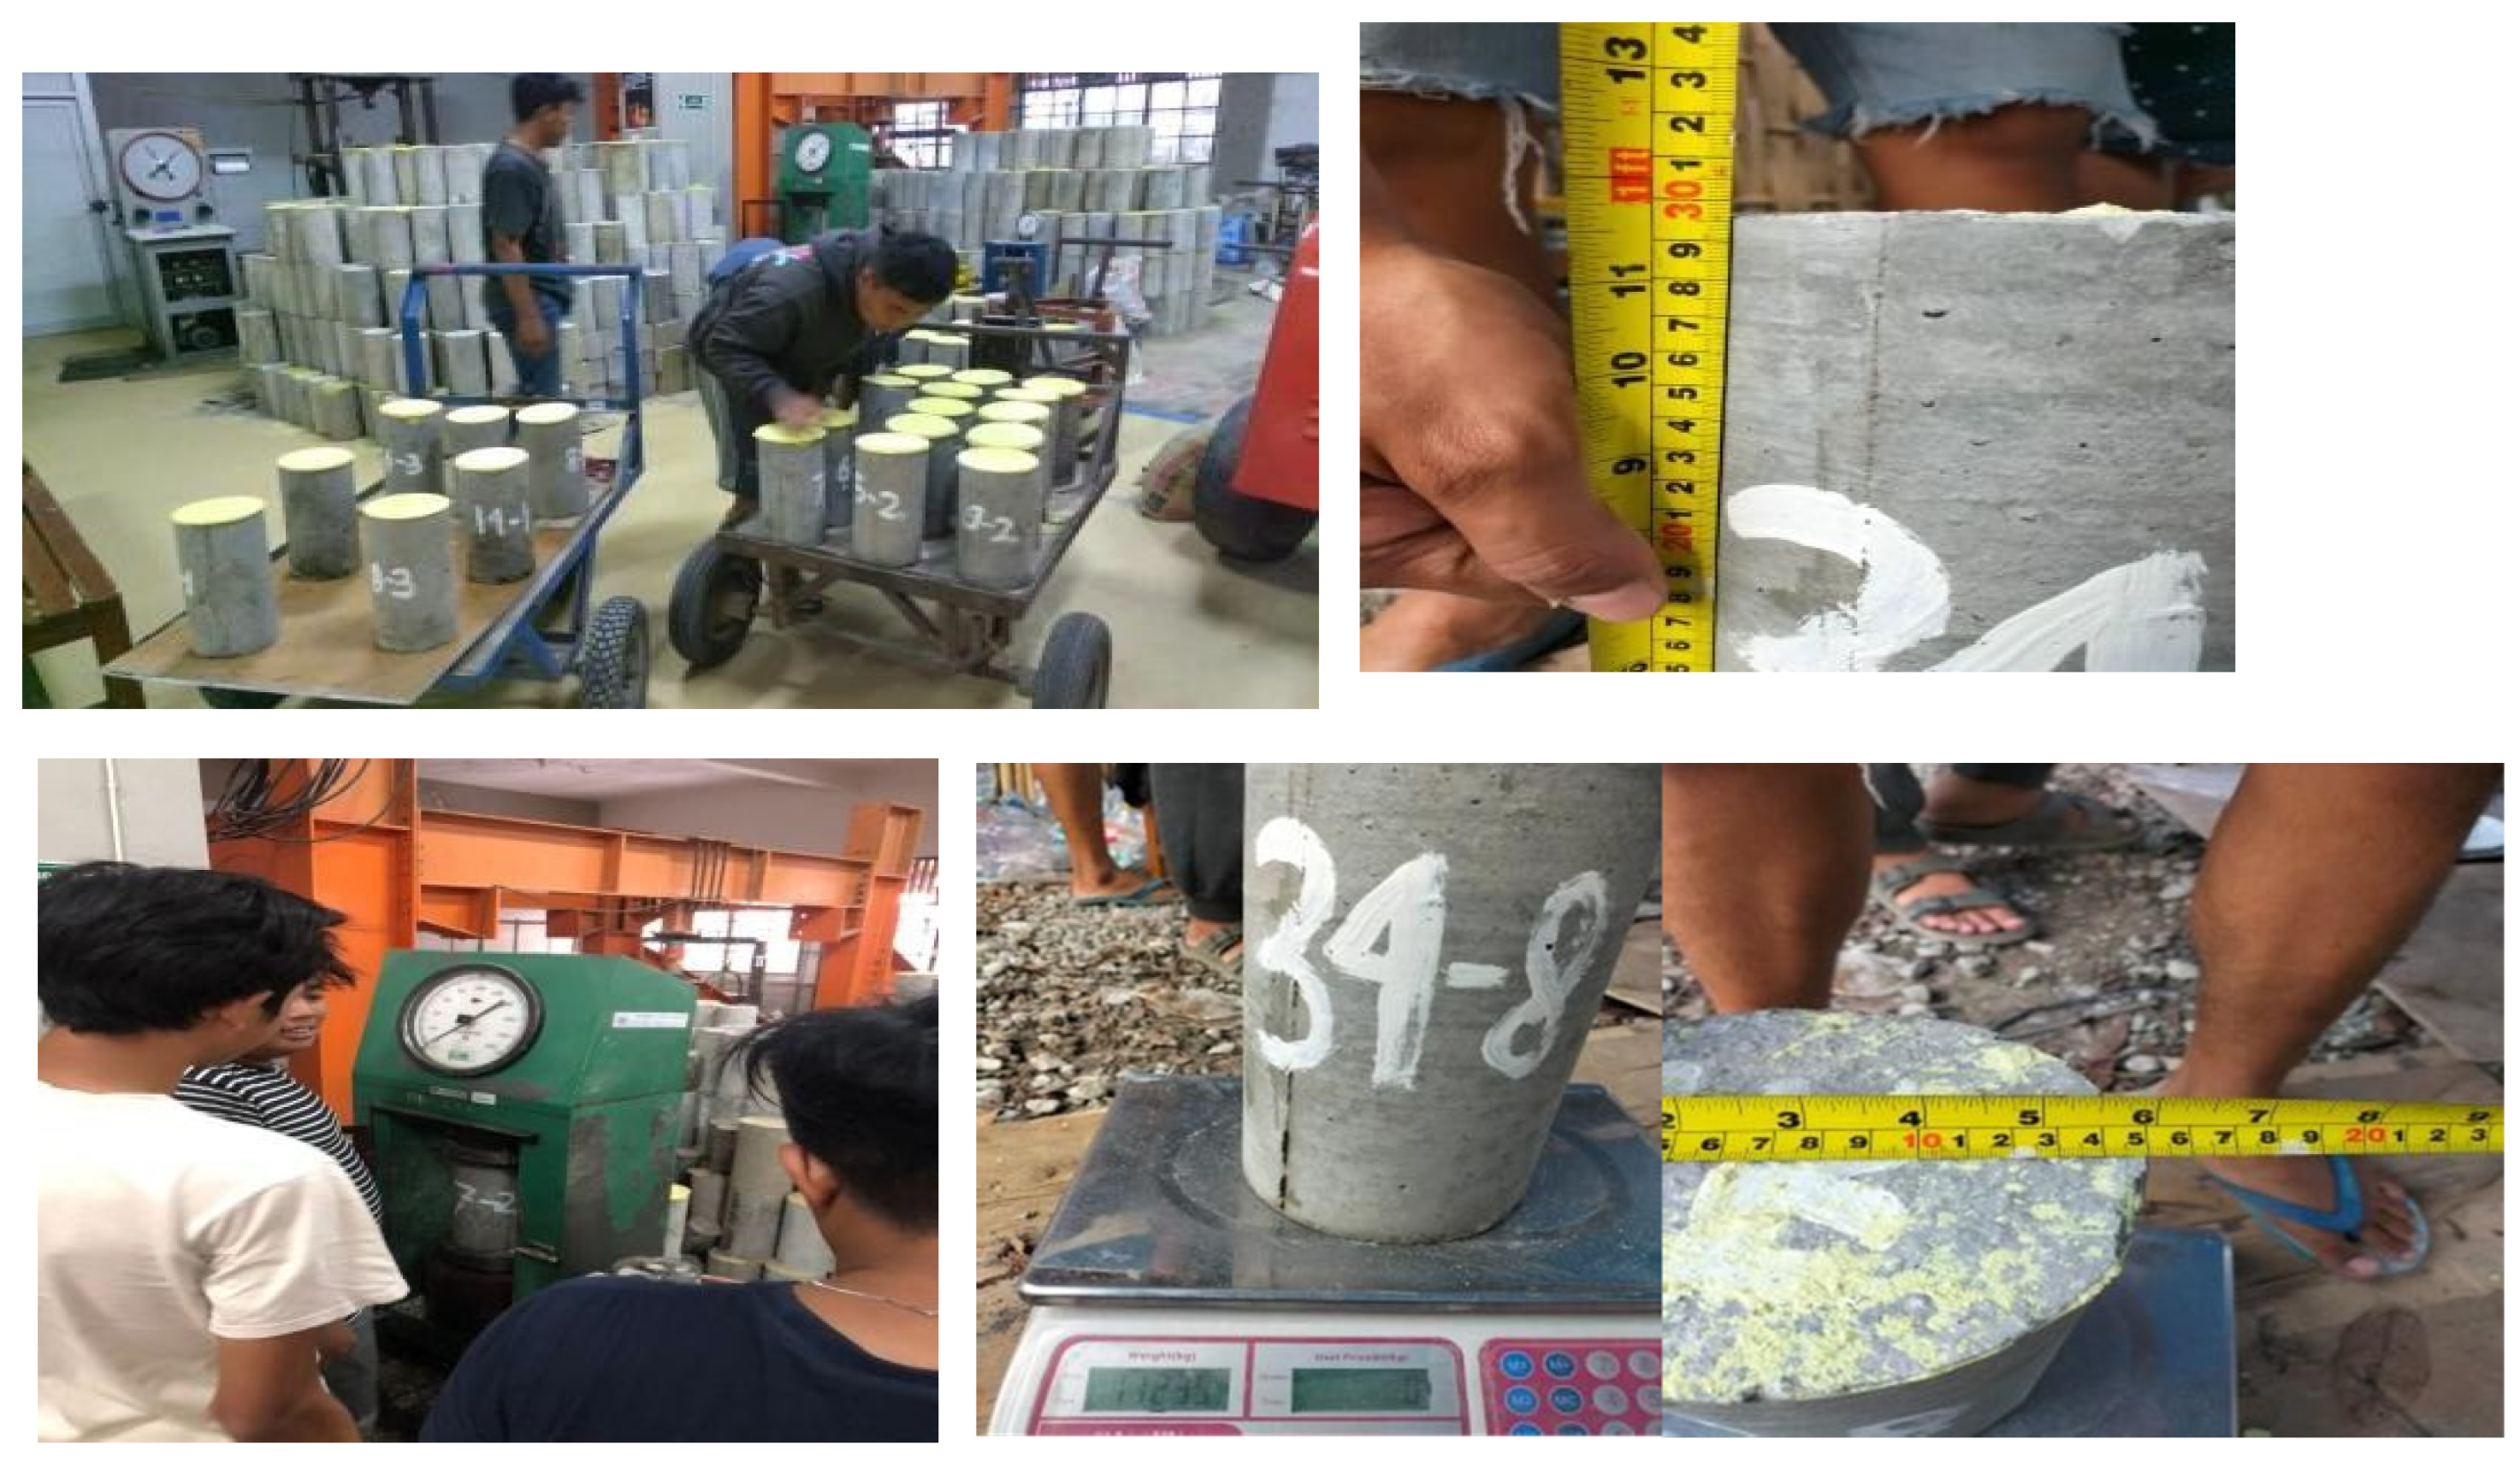
- Next, the concrete specimens were tested with a compression test using a Universal Testing Machine at a curing age of 7 days and 14 days [64,66,67], Figure 6, with the following formula:
 Figure 6. Unit Weight Test and Concrete Compression Test.
Compressive strength of concrete =
where
= Compressive strength of concrete (MPa or N/mm2).
P = Pressing force (Newton = N).
A = Cross-sectional area of the test object (mm2).
- 2.8
- The results of the concrete compressive strength test were entered into a table and a graphic image was made;
- 2.9
- Lastly, a discussion and conclusion of the research results was carried out.
Photo documentation of research implementation is displayed as follows:
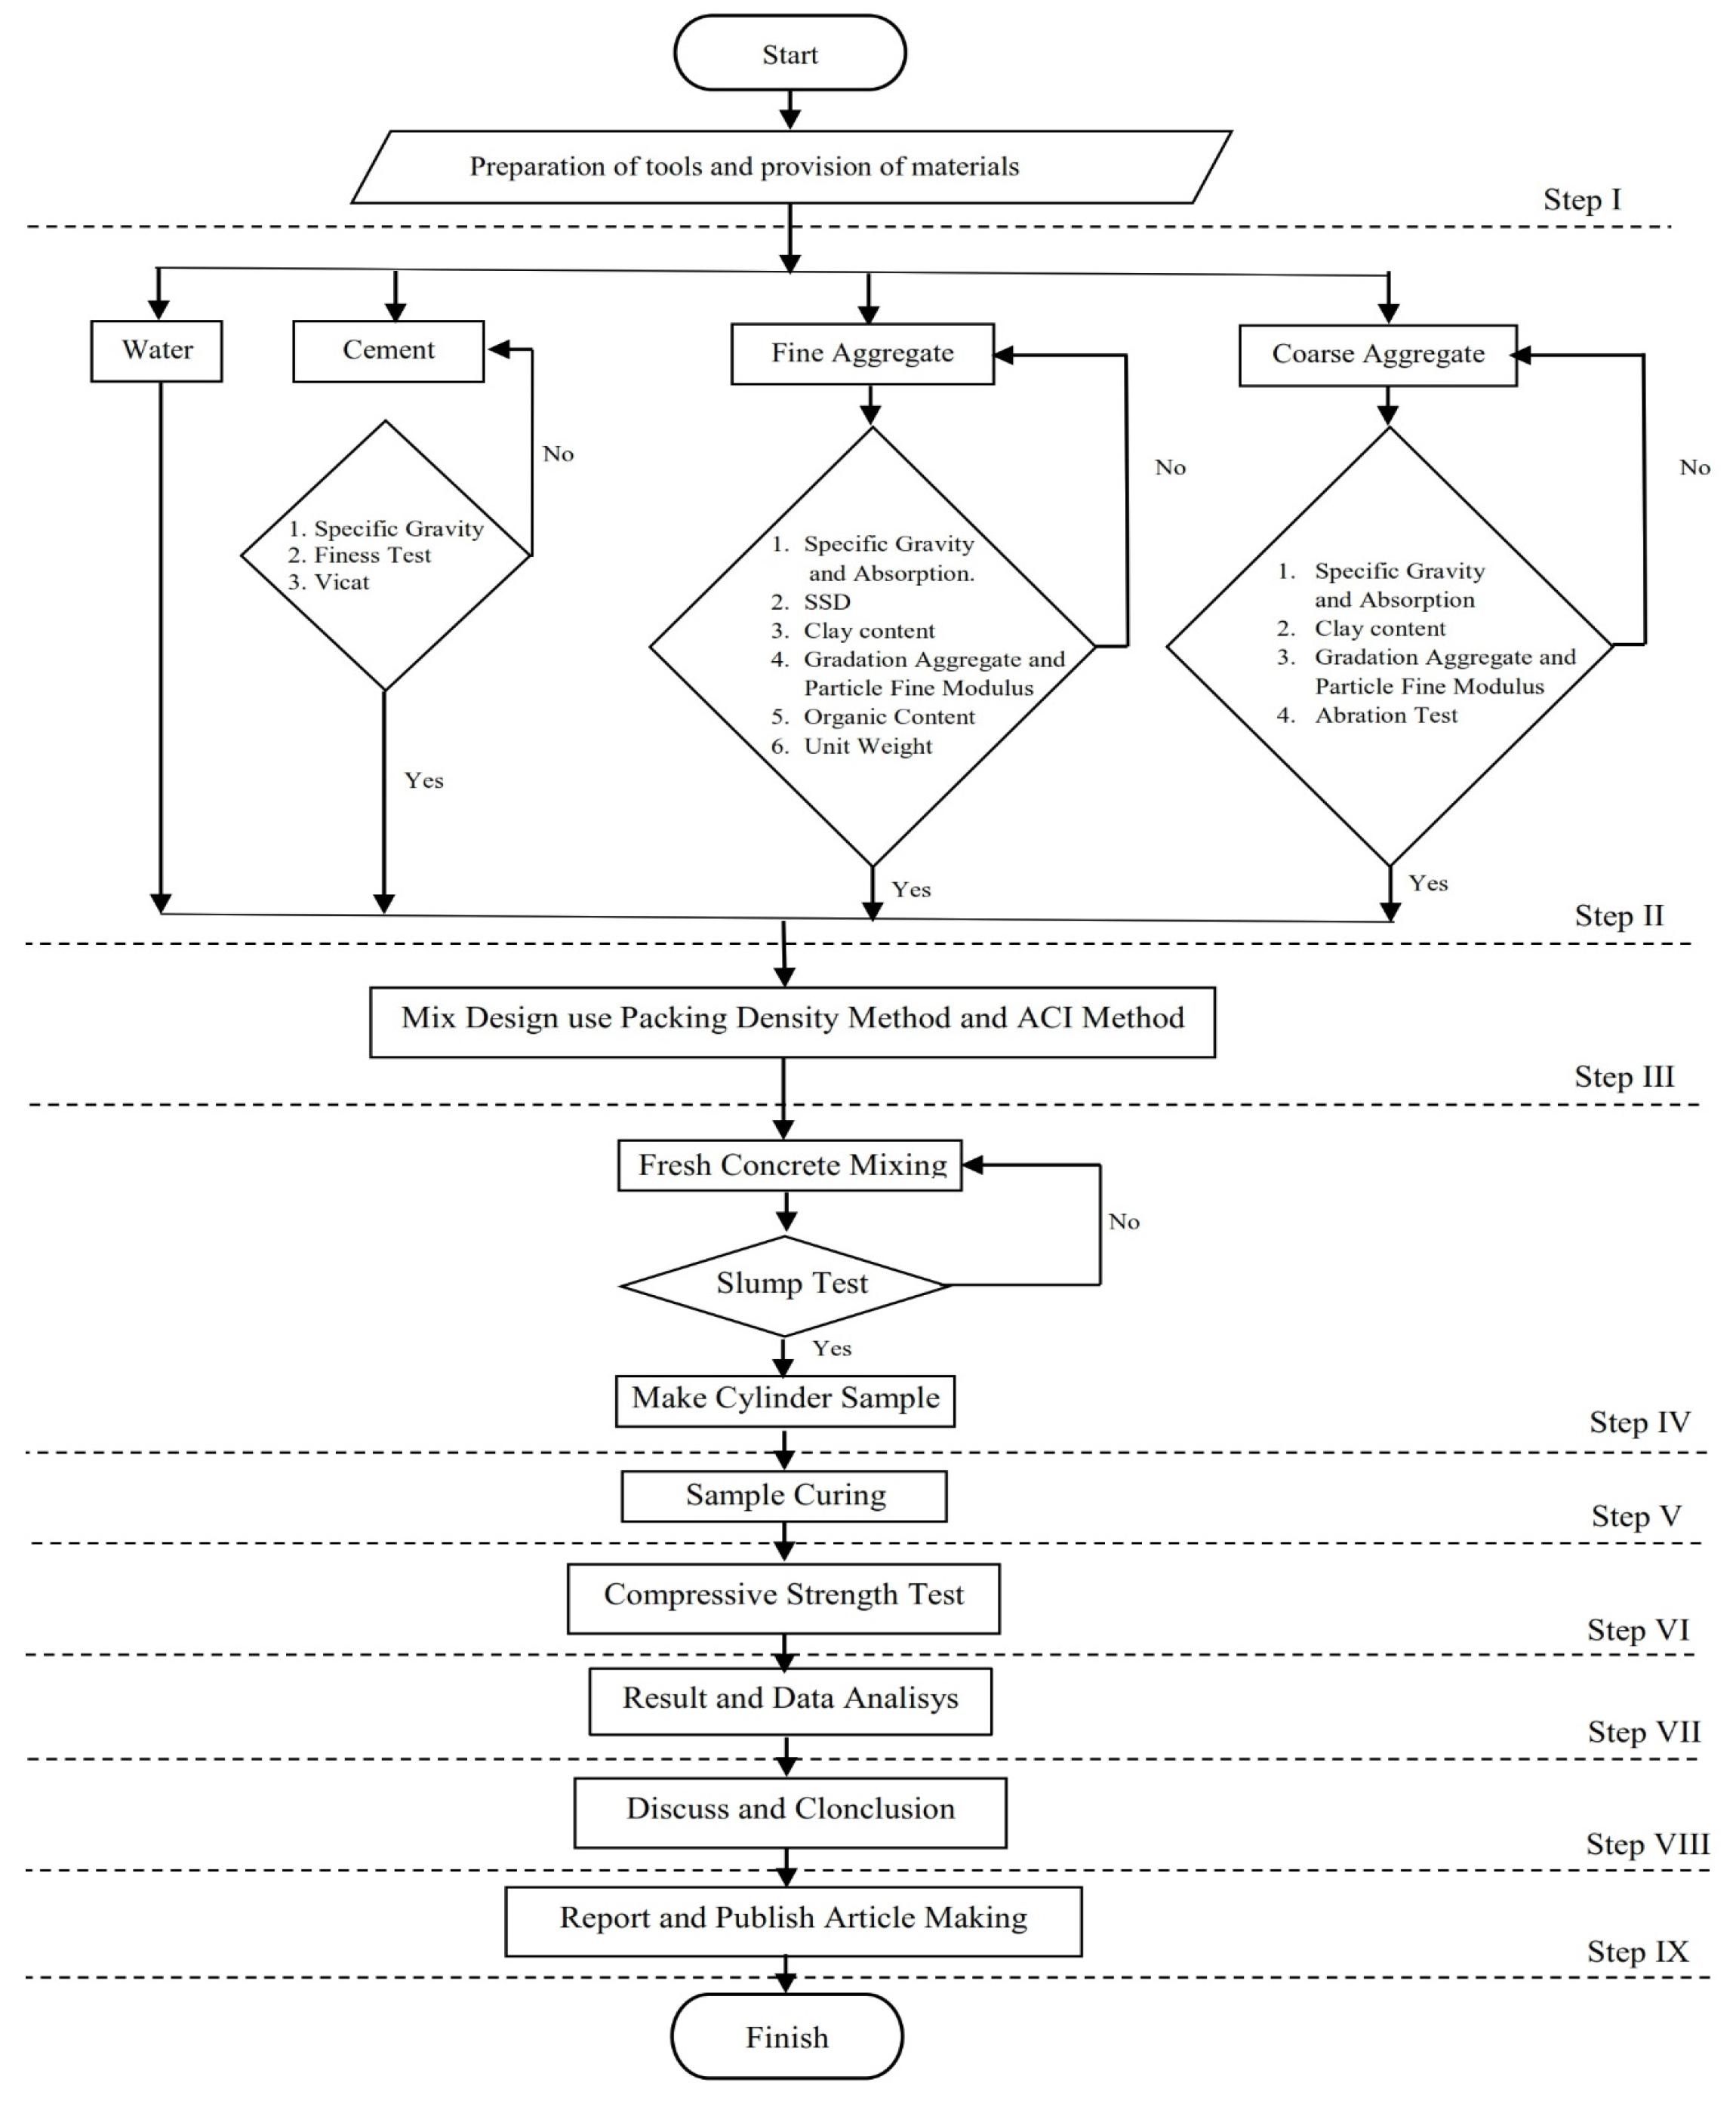
Also displayed is a flow chart of research implementation, Figure 7:
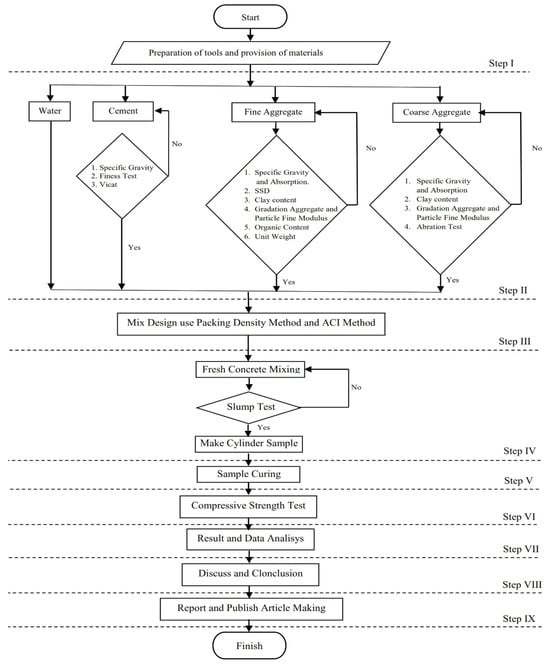
Figure 7.
Research flow chart.
3. Research Results and Discussion
The results of testing the concrete constituent materials and testing the packing density of coarse aggregate and fine aggregate, as well as testing the slump and compressive strength of concrete are as follows.
3.1. Fine Aggregate Testing
The results of tests carried out on fine aggregate in this research include testing for organic substance content, saturated surface dry (SSD), mud content, specific gravity, absorption, fine-grain modulus (MHB) and sand gradation to meet the Indonesian national standard material requirements for concrete.
3.2. Coarse Aggregate Testing
The coarse aggregate testing carried out in this research includes wear testing, specific gravity and absorption, coarse aggregate gradation and coarse aggregate flatness and curvature testing, all of which meet the Indonesian national standard material requirements for concrete.
3.3. Cement Testing
The cement used includes three types of Portland cement, namely PPC, OPC and PCC, which are in good condition; there is no clumping and they are still in the form of powder. The test results for the initial bond of cement, the specific gravity of cement and the fineness of cement all meet the requirements of the Indonesian national standard material for concrete.
3.4. Bulk Density, Packing Density and Void Ratio Testing
The results of testing bulk density, void ratio and packing density value of coarse aggregate from two fractions and then combined with fine aggregate are as follows.
3.4.1. Testing the Bulk Density of Cube-Shaped Coarse Aggregate Size 3/8″ and Size 3/16″
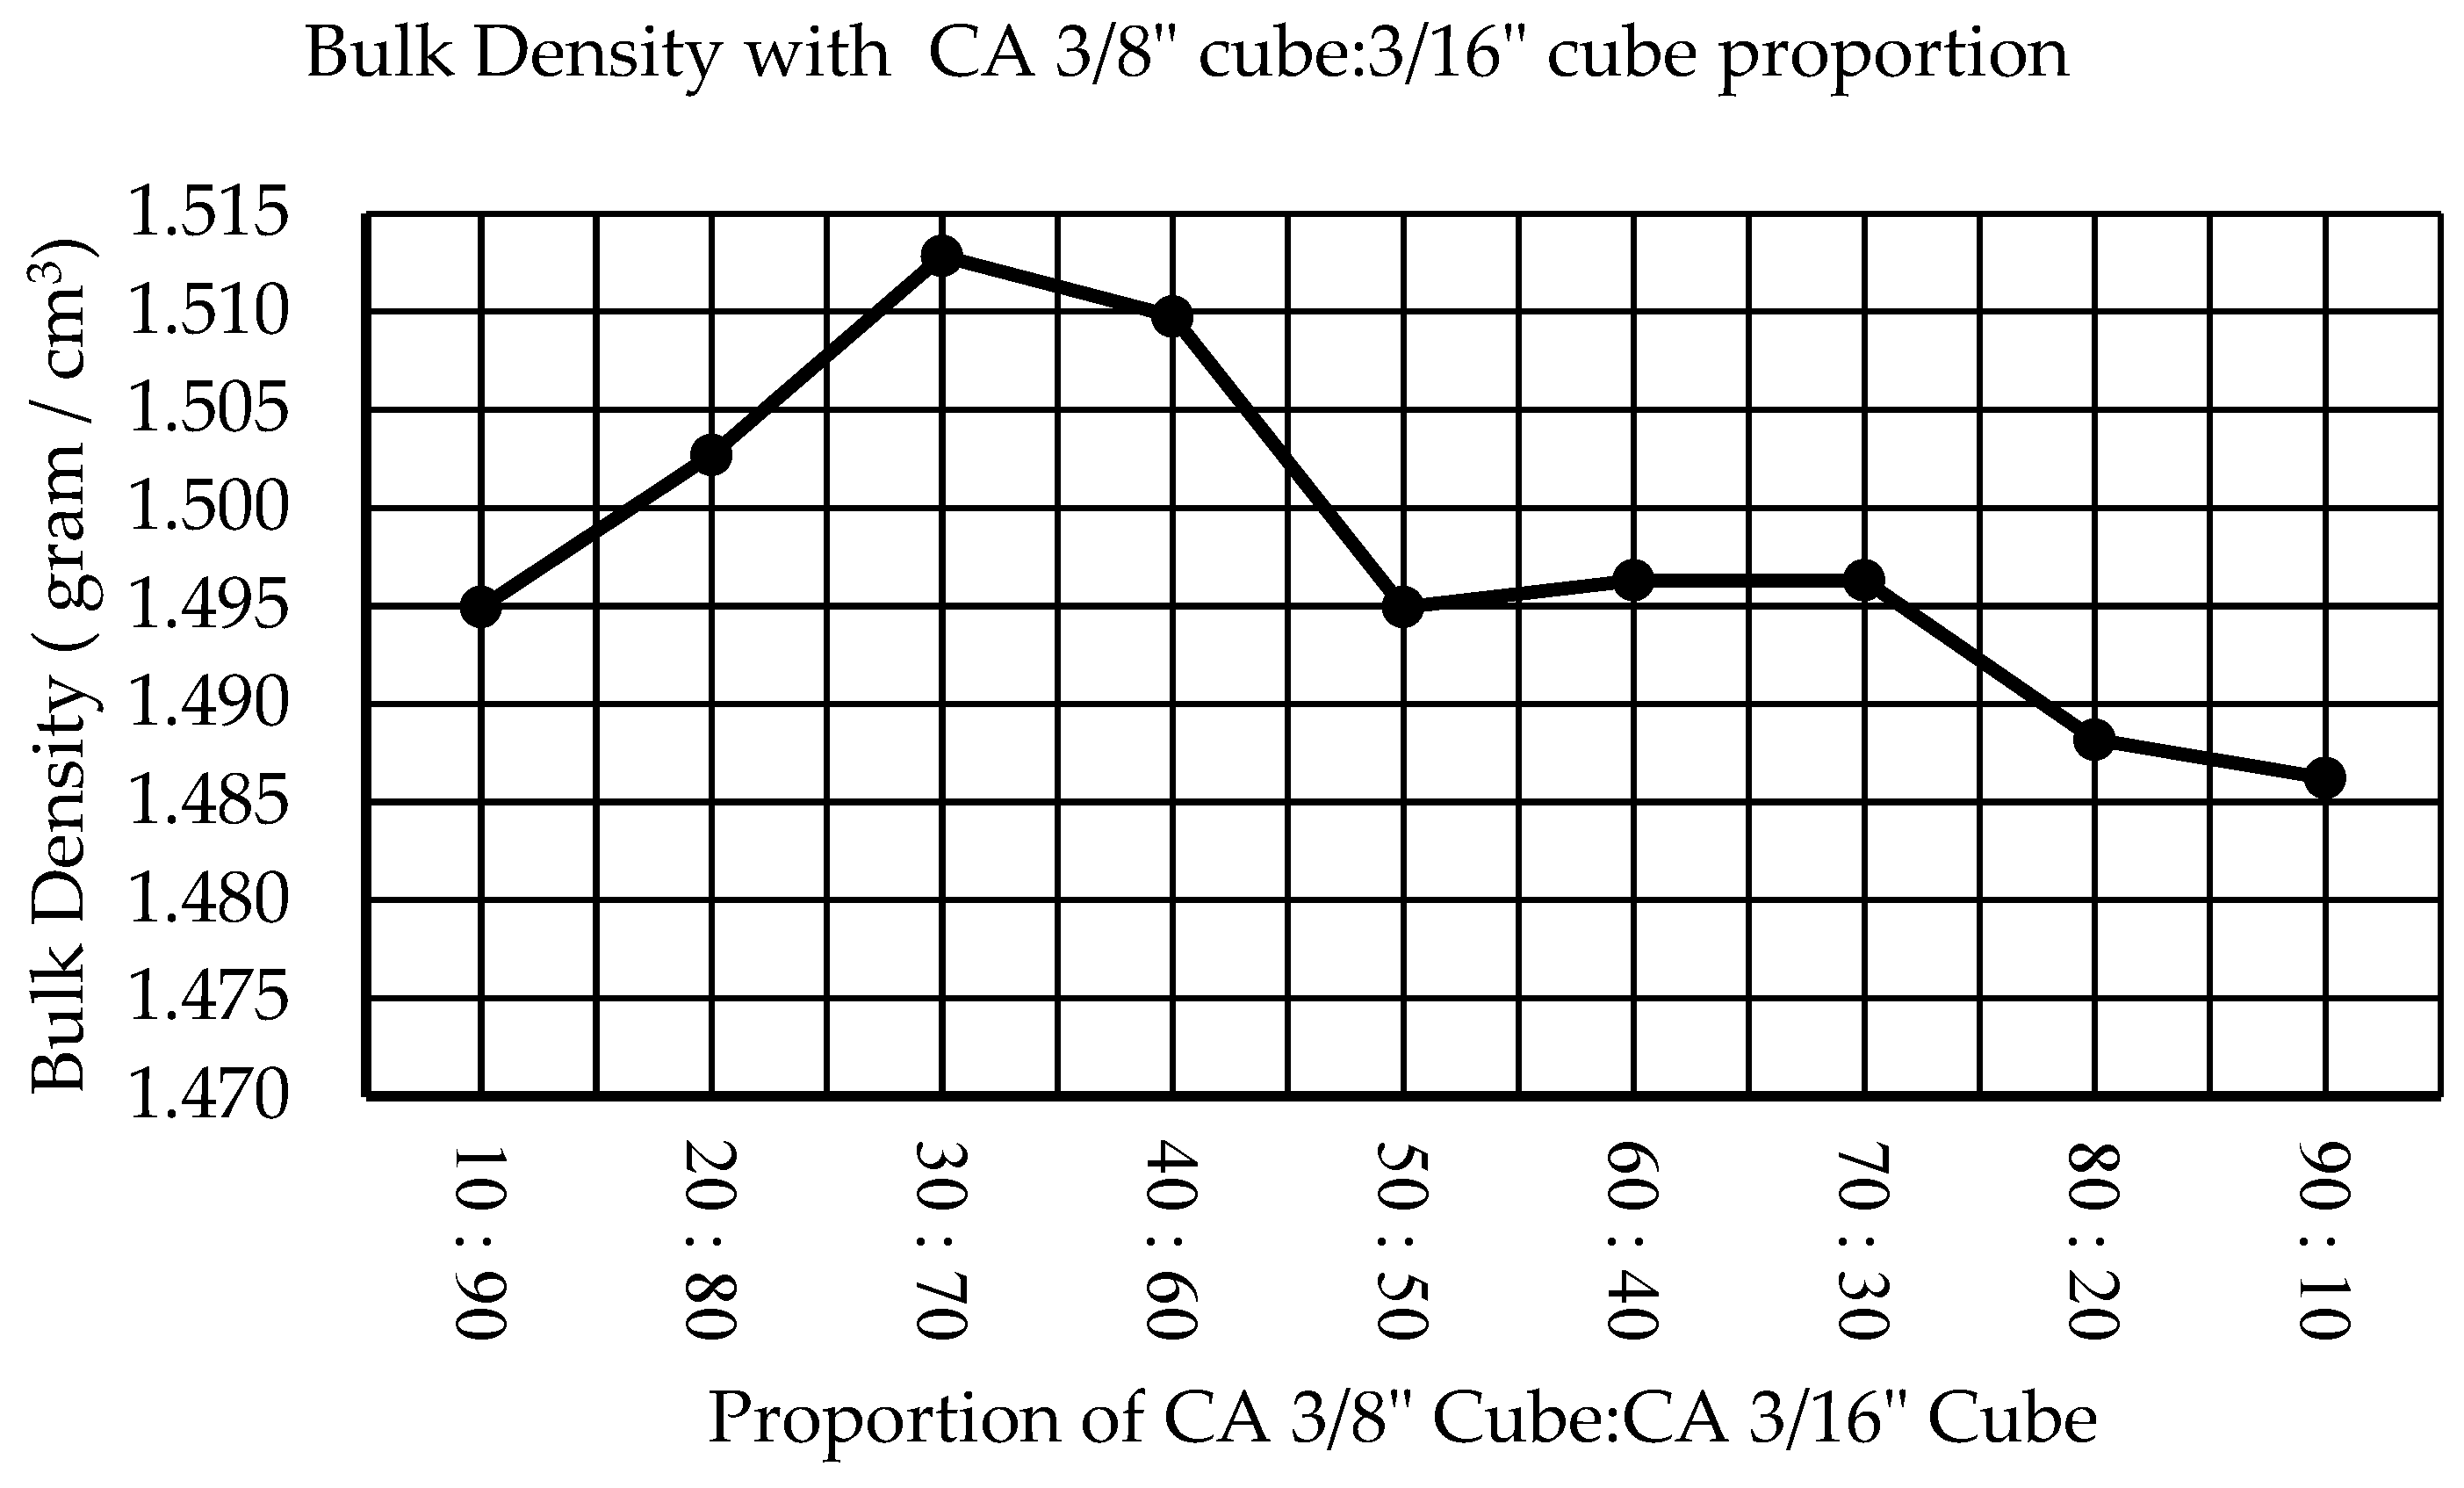
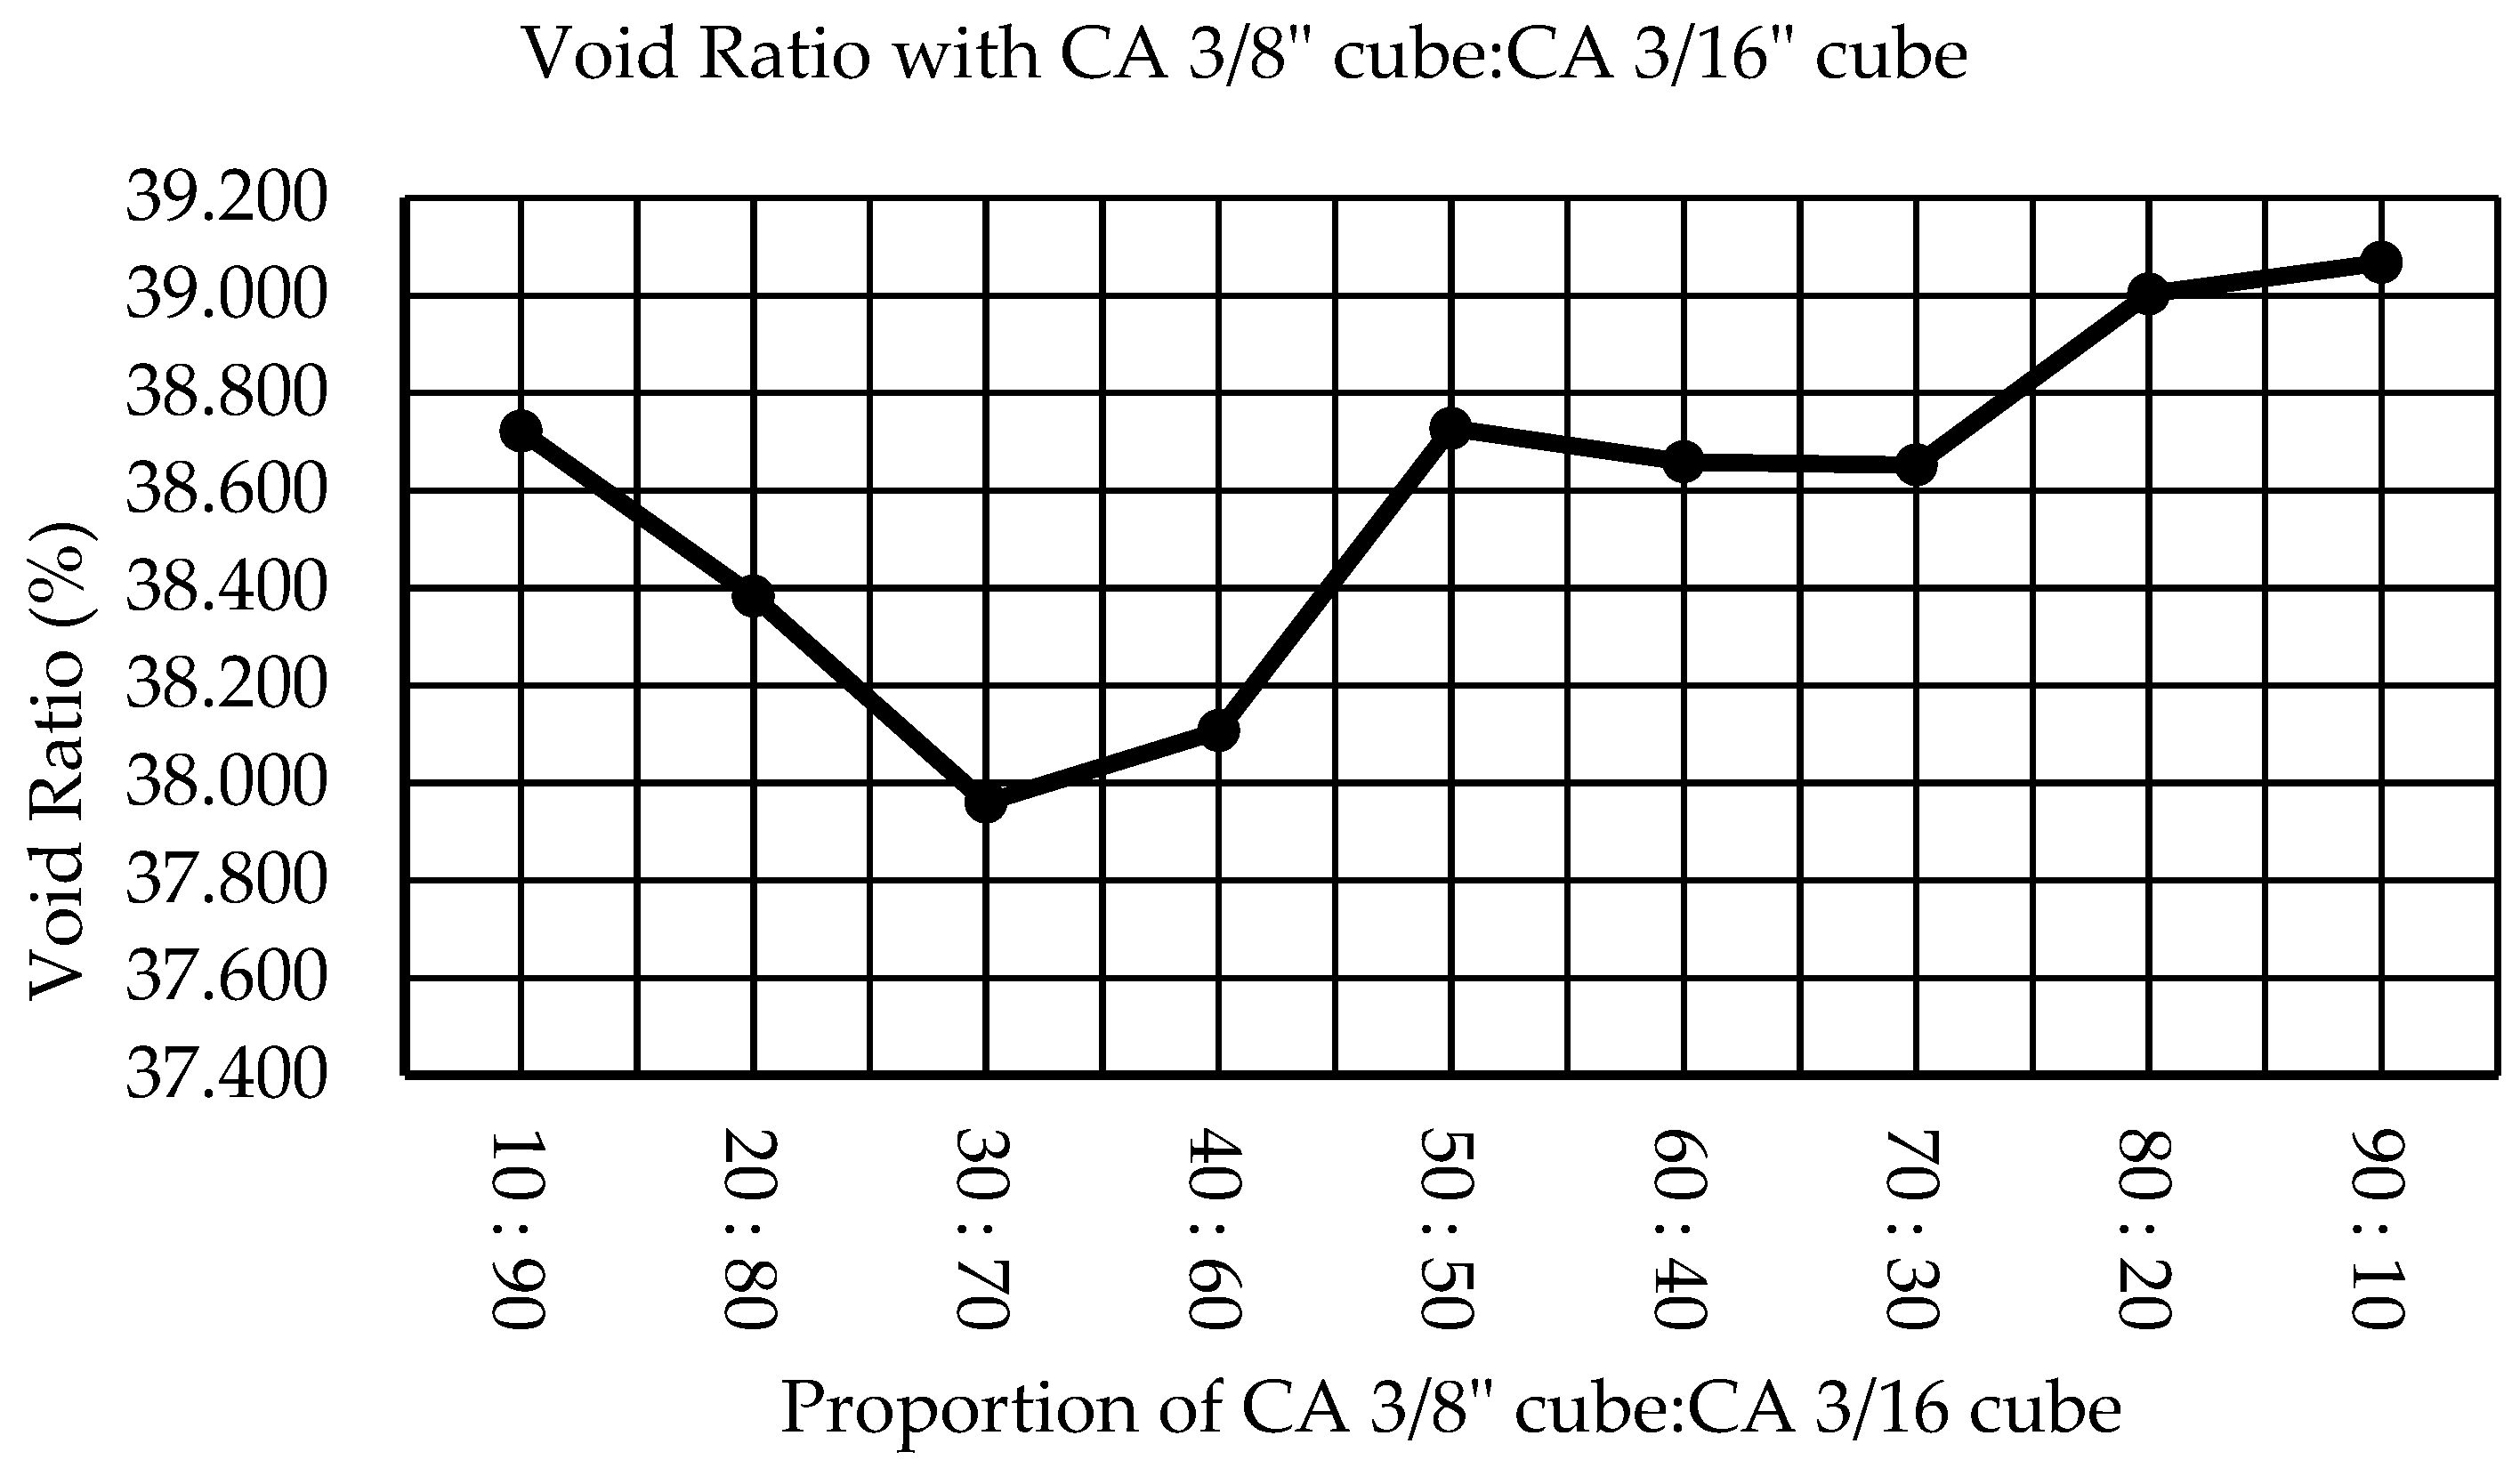
From the bulk density test of a mixture of coarse aggregate size 3/8″ and size 3/16″ with proportions based on weight, namely 10:90, 20:80, 30:70, 40:60, 50:50, 60:40, 70:30, 80:20 and 90:10, the highest maximum bulk density value of 1,513 g/cm3 was obtained at a ratio of 30:70, Table 1; Figure 8. So, from the maximum bulk density value, the maximum packing density value can be calculated, Table 2; Figure 9, which is 0,6204 g/cm3 and the minimum void value is 37,96% Table 3; Figure 10. For more details, see Table 1, Table 2 and Table 3 and Figure 8, Figure 9 and Figure 10 below:

Table 1.
Bulk density calculation results for CA 3/8″ and CA 3/16″ mixtures.
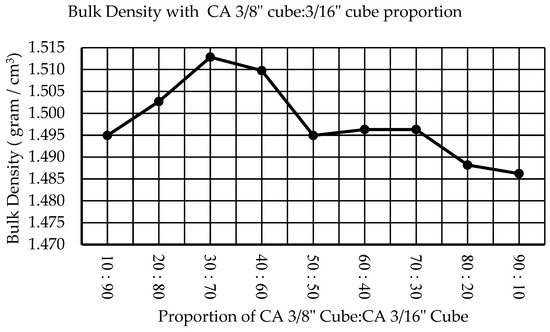
Figure 8.
Graph of the relationship between bulk density and the proportion of CA 3/8″: CA 3/16″ in the form of a cube.
Table 2.
Calculation results of mixed packing density CA 3/8″ and CA 3/16″.
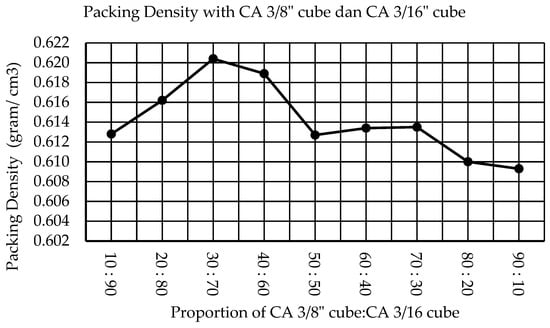
Figure 9.
Graph of the relationship between the proportion of CA 3/8:CA 3/16 and packing density (maximum).
Table 3.
Calculation results of minimum void ratio mixture CA 3/8″ and CA 3/16″.
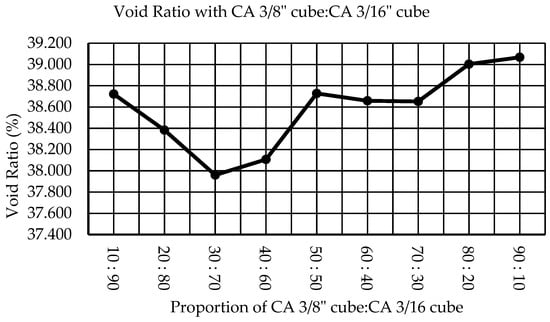
Figure 10.
Graph of the relationship between CA proportion: CA and minimum air void ratio.
3.4.2. Bulk Density, Packing Density and Void Ratio Testing of FA and CA Mixtures
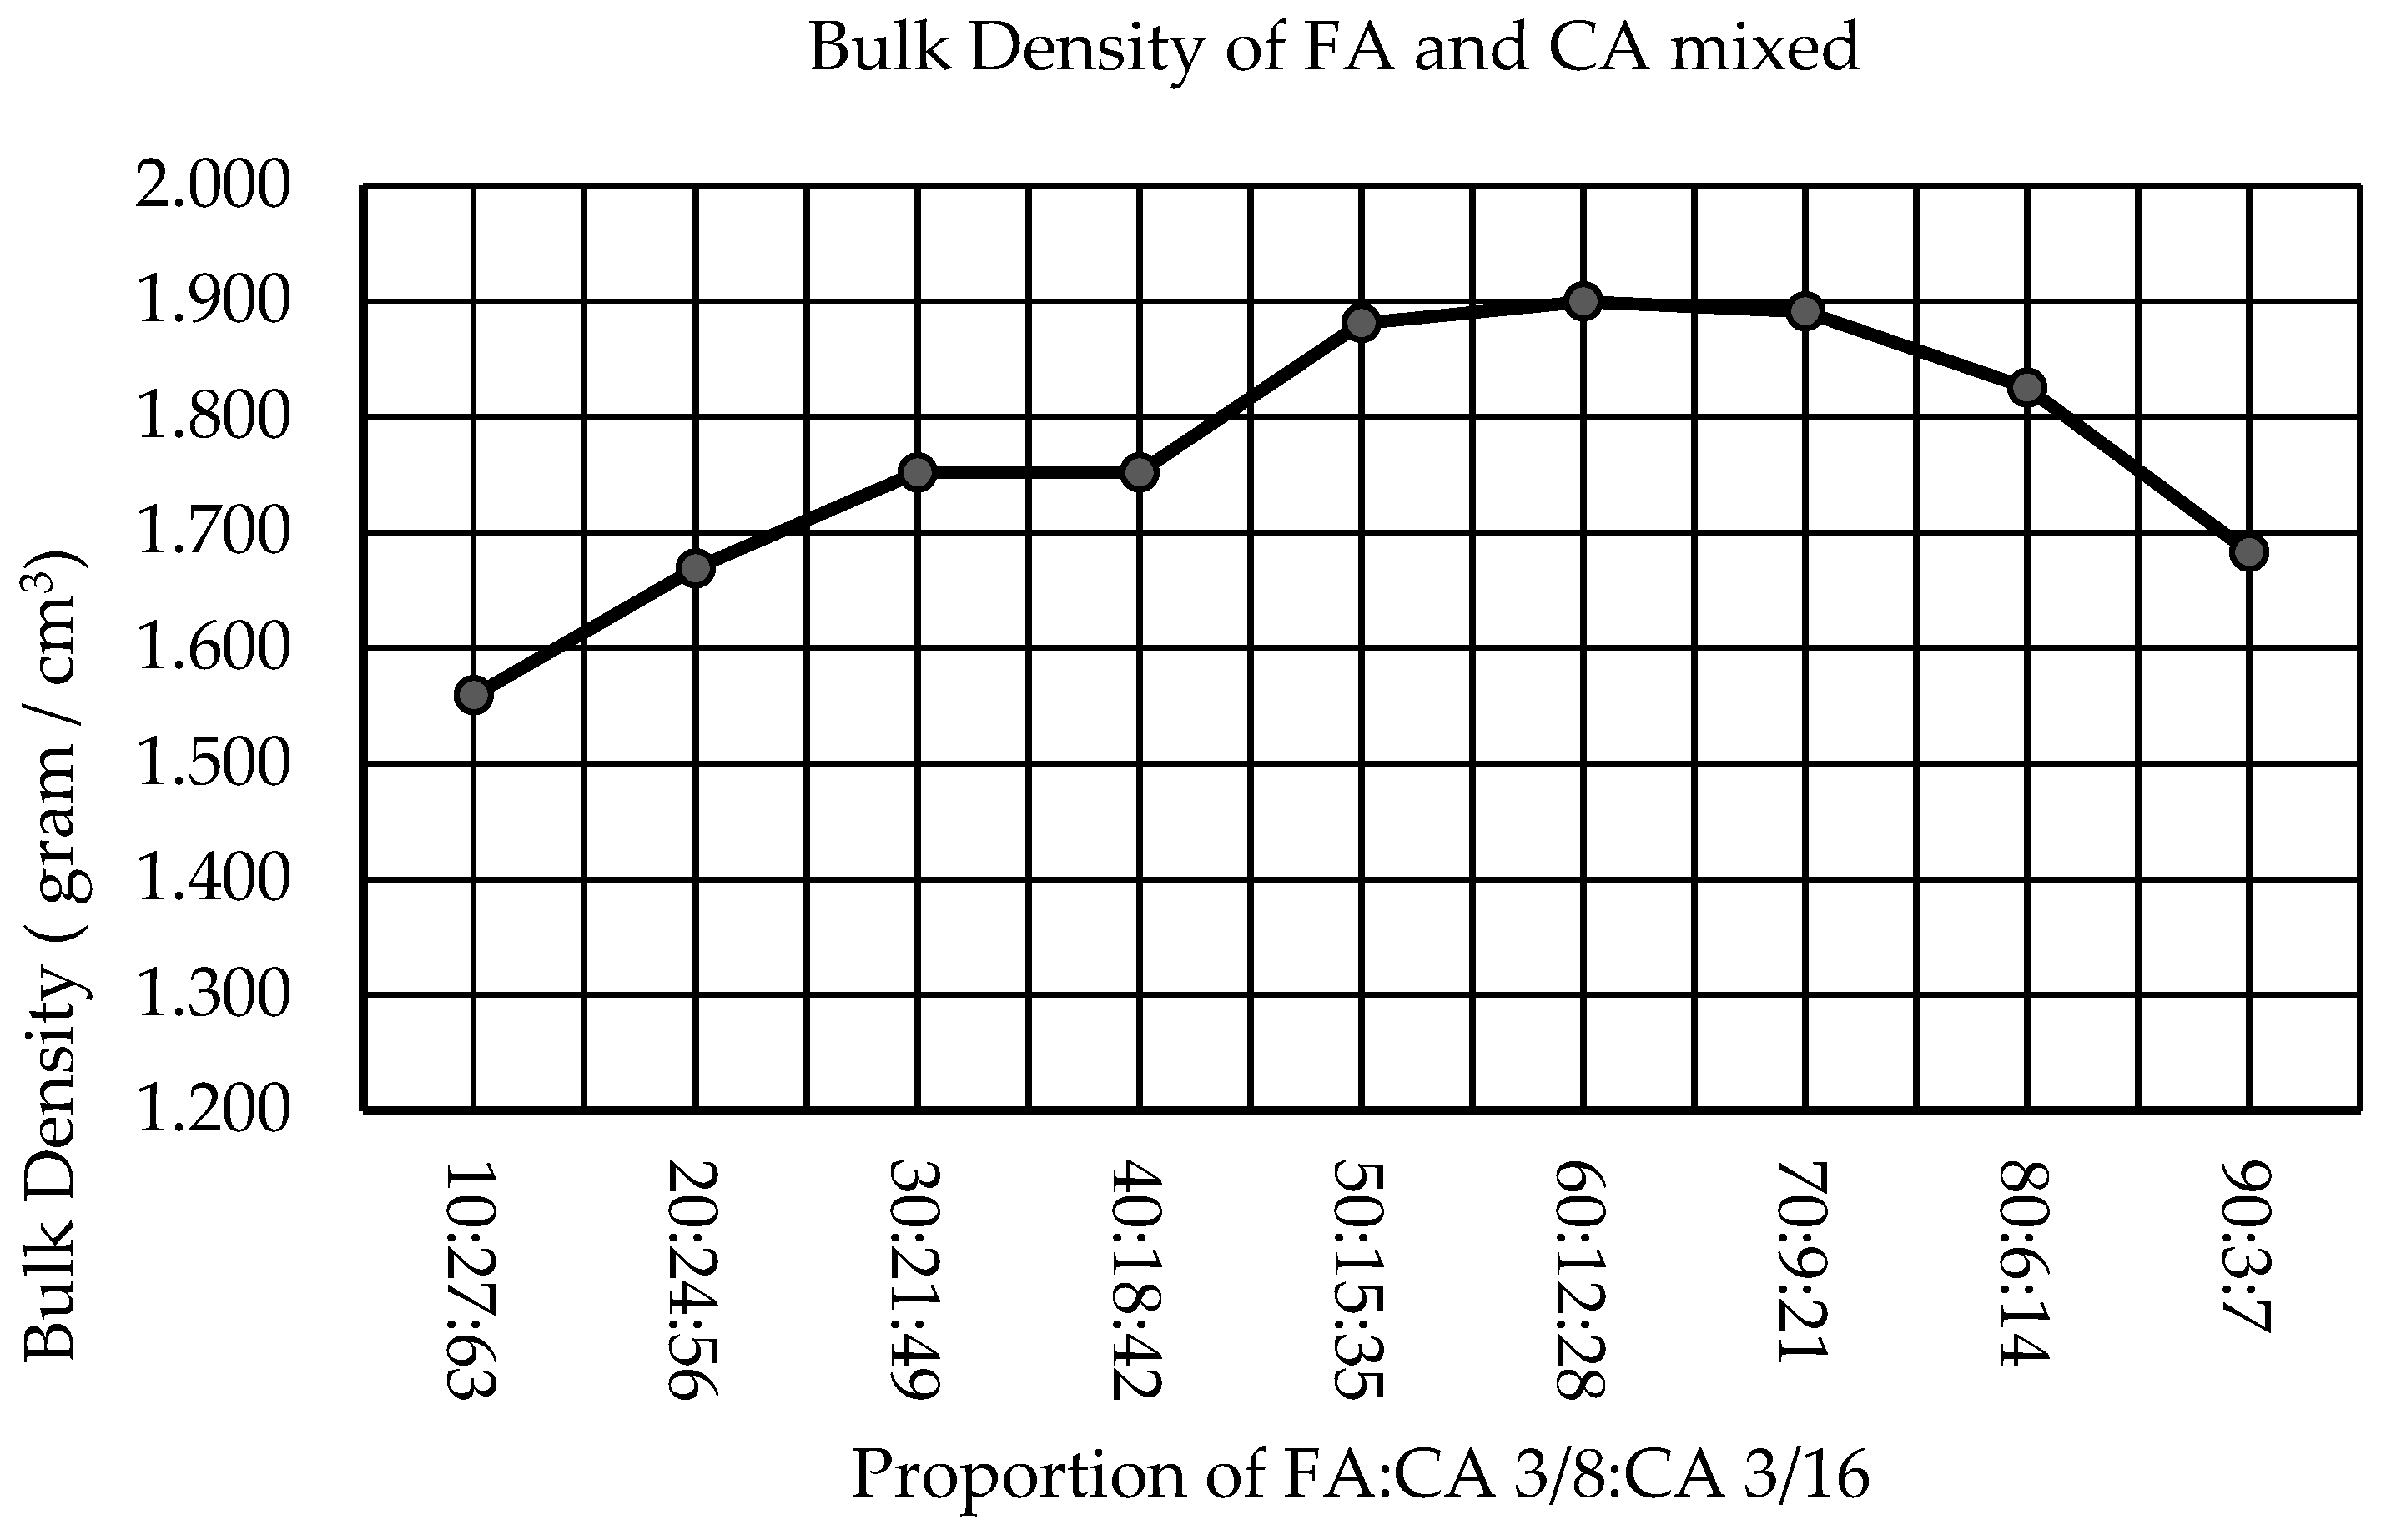
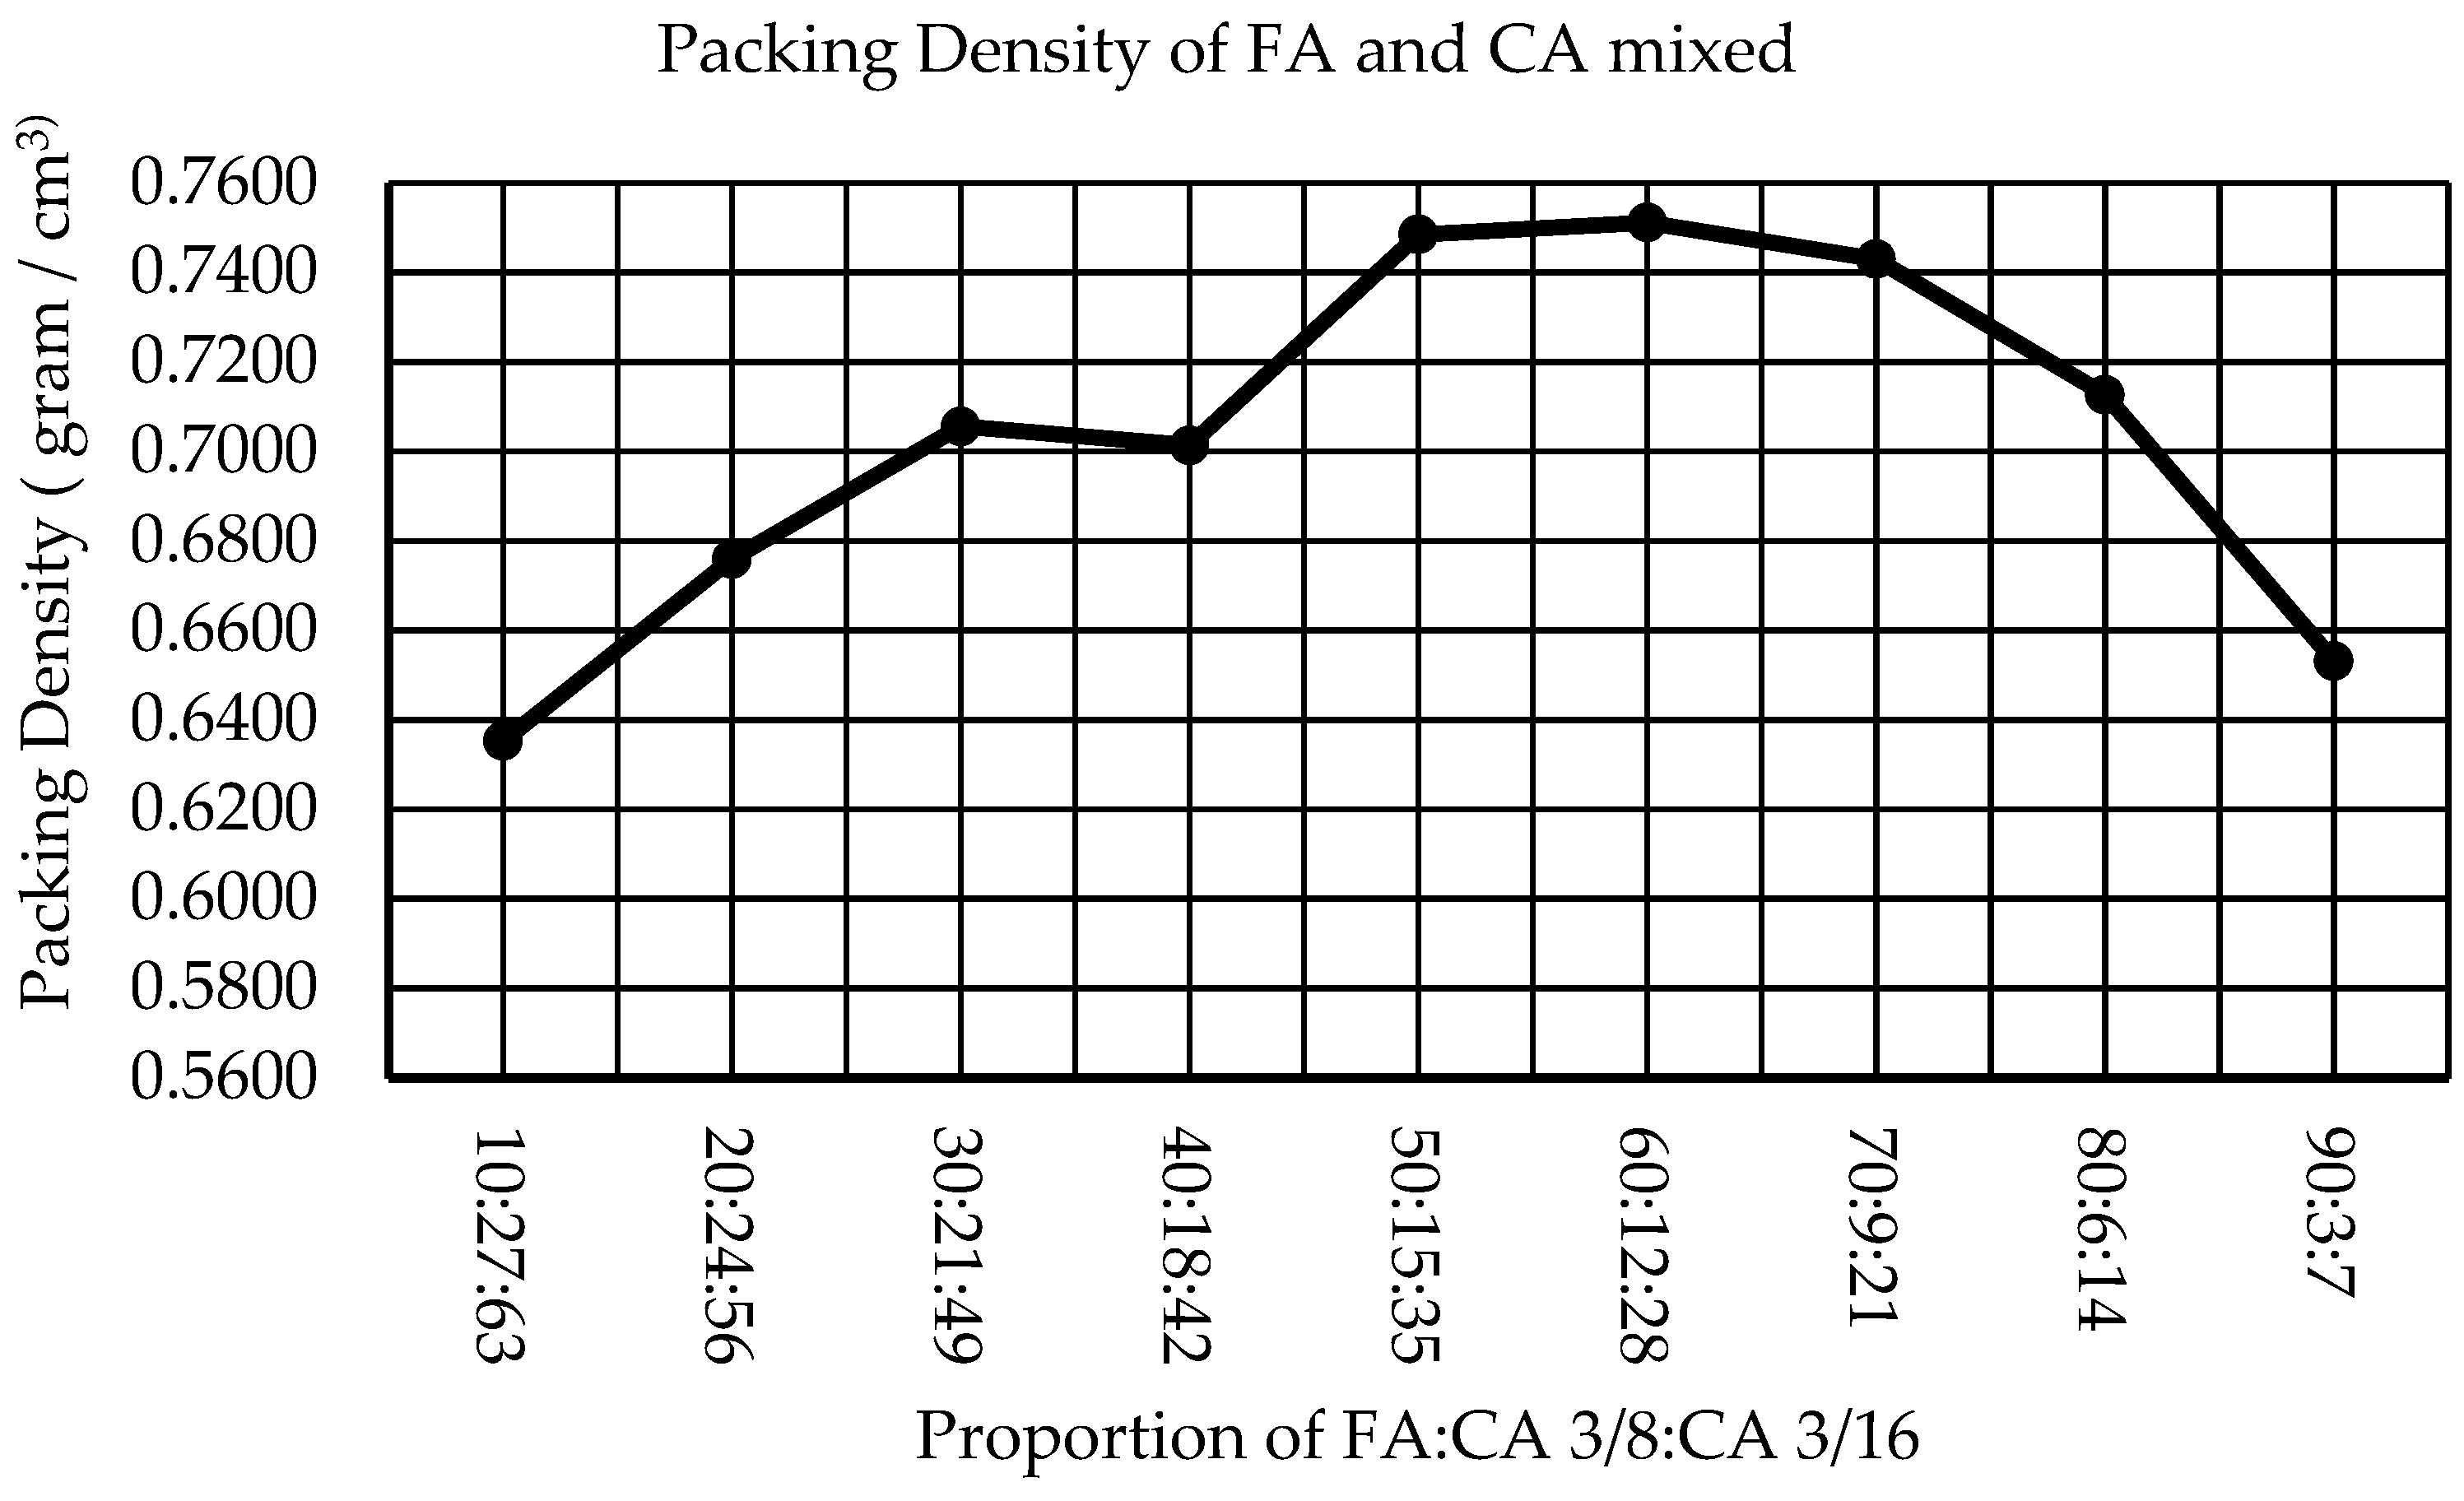
From the bulk density test of the coarse aggregate mixture sizes 3/8″ and 3/16″, the maximum bulk density value was obtained at a ratio of 30:70, so the bulk density test of the FA, 3/8 and 3/16 mixtures was obtained. The proportions obtained based on weight are 10:27:63, 20:24:56, 30:21:49, 40:18:42, 50:15:35, 60:12:28, 70:9:21, 80:6:14, and 90:3:7; the highest maximum bulk density value is 1,900 g/cm3 at a ratio of 60:12:28, Table 4; Figure 11. From the maximum bulk density value, the maximum packing density value can then be calculated, Table 5; Figure 12, namely 0,751 g/cm3, and the minimum voids value, namely 24,491%, Table 6; Figure 13. For more details, see Table 4, Table 5 and Table 6 and Figure 11, Figure 12 and Figure 13 below:
Table 4.
Bulk density test results for FA and CA mixtures (CA 3/8″ and CA 3/16″).

Figure 11.
Graph of the relationship between the FA:CA proportion and bulk density.
Table 5.
Packing density calculation results for FA and CA mixtures.
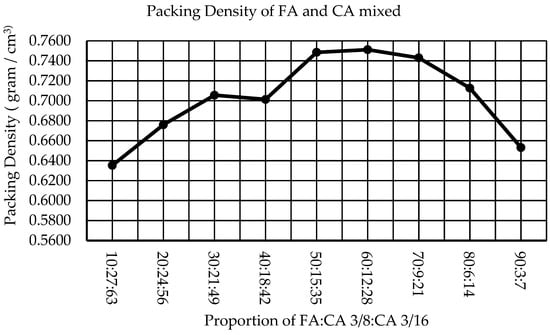
Figure 12.
Graph of the relationship between the FA:CA proportion and packing density (maximum).
Table 6.
Calculation results of the minimum void ratio for a mixture of FA and CA.
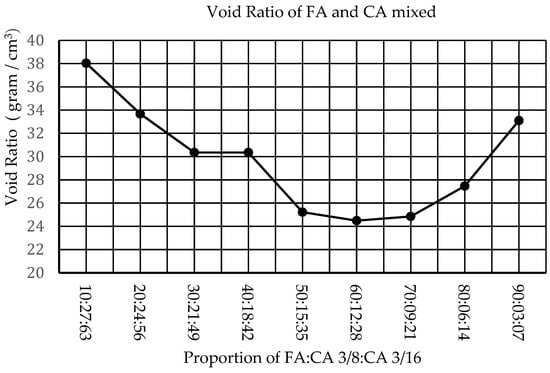
Figure 13.
Graph of the relationship between the FA:CA proportion and the minimum air void ratio.
3.5. Concrete Mix Design
In this research, the concrete mix design used the packing density (Indian standard) and American Concrete Institute (ACI) methods. Results of normal concrete mix design use IS method for m3 in Table 7 and Table 8; and Results of normal concrete mix design use ACI method for m3 in Table 9 and Table 10;
Table 7.
Results of normal concrete mix design use IS method for m3 (PD-IS).
Table 8.
Results of normal concrete mix design for nine cylinders (PD-IS).
Table 9.
Results of normal concrete mix design use ACI method for m3 (PD-ACI).
Table 10.
Results of normal concrete mix design for nine cylinders.
In the mix design above, what is meant by PD (packing density) is for the proportion of aggregate used, and ACI (American Concrete Institute) and IS (Indian standard) for the methods used in designing concrete mix.
3.6. Concrete Testing
Testing of fresh concrete mixtures and concrete that has hardened is shown as follows:
3.6.1. Workability of Concrete Mix
The workability of the concrete mix is carried out by a slump test with the aim of determining the viscosity of the concrete mix from the slump value so that it can meet the specified requirements. The viscosity of the concrete mix can be checked by testing the slump test, so it must be taken directly from the mixer machine using a bucket or tool that does not absorb water. If necessary, the concrete mixture is stirred again before testing the slump test. This test was carried out using an Abrams cone with a top diameter of 10 cm, a bottom diameter of 20 cm and a height of 30 cm. The slump test results are presented in Table 11 following:
Table 11.
Slump test results on mixture.
The results of the research that has been carried out show that the slump test value for PD-IS PPC is 21 cm, PD-IS OPC is 17 cm, PD-IS PCC is 24 cm, PD-ACI PPC is 20.5 cm, PD-ACI OPC is 21 cm and PD-ACI PCC is 20.5 cm.
3.6.2. Concrete Compressive Strength Test Results
Concrete compressive strength testing is carried out using a concrete compressive strength testing tool, namely the Compression Machine Test. The Compression Machine Test has an accuracy of 5 kN, a maximum compressive strength capacity of 2000 kN, and is the PANAIRSAN PRATAMA brand, with no. serial 2000.01.07.10.67. The results of the concrete cylinder compressive strength tests carried out in this research can be seen are summarized in Table 12 and Table 13 below.
Table 12.
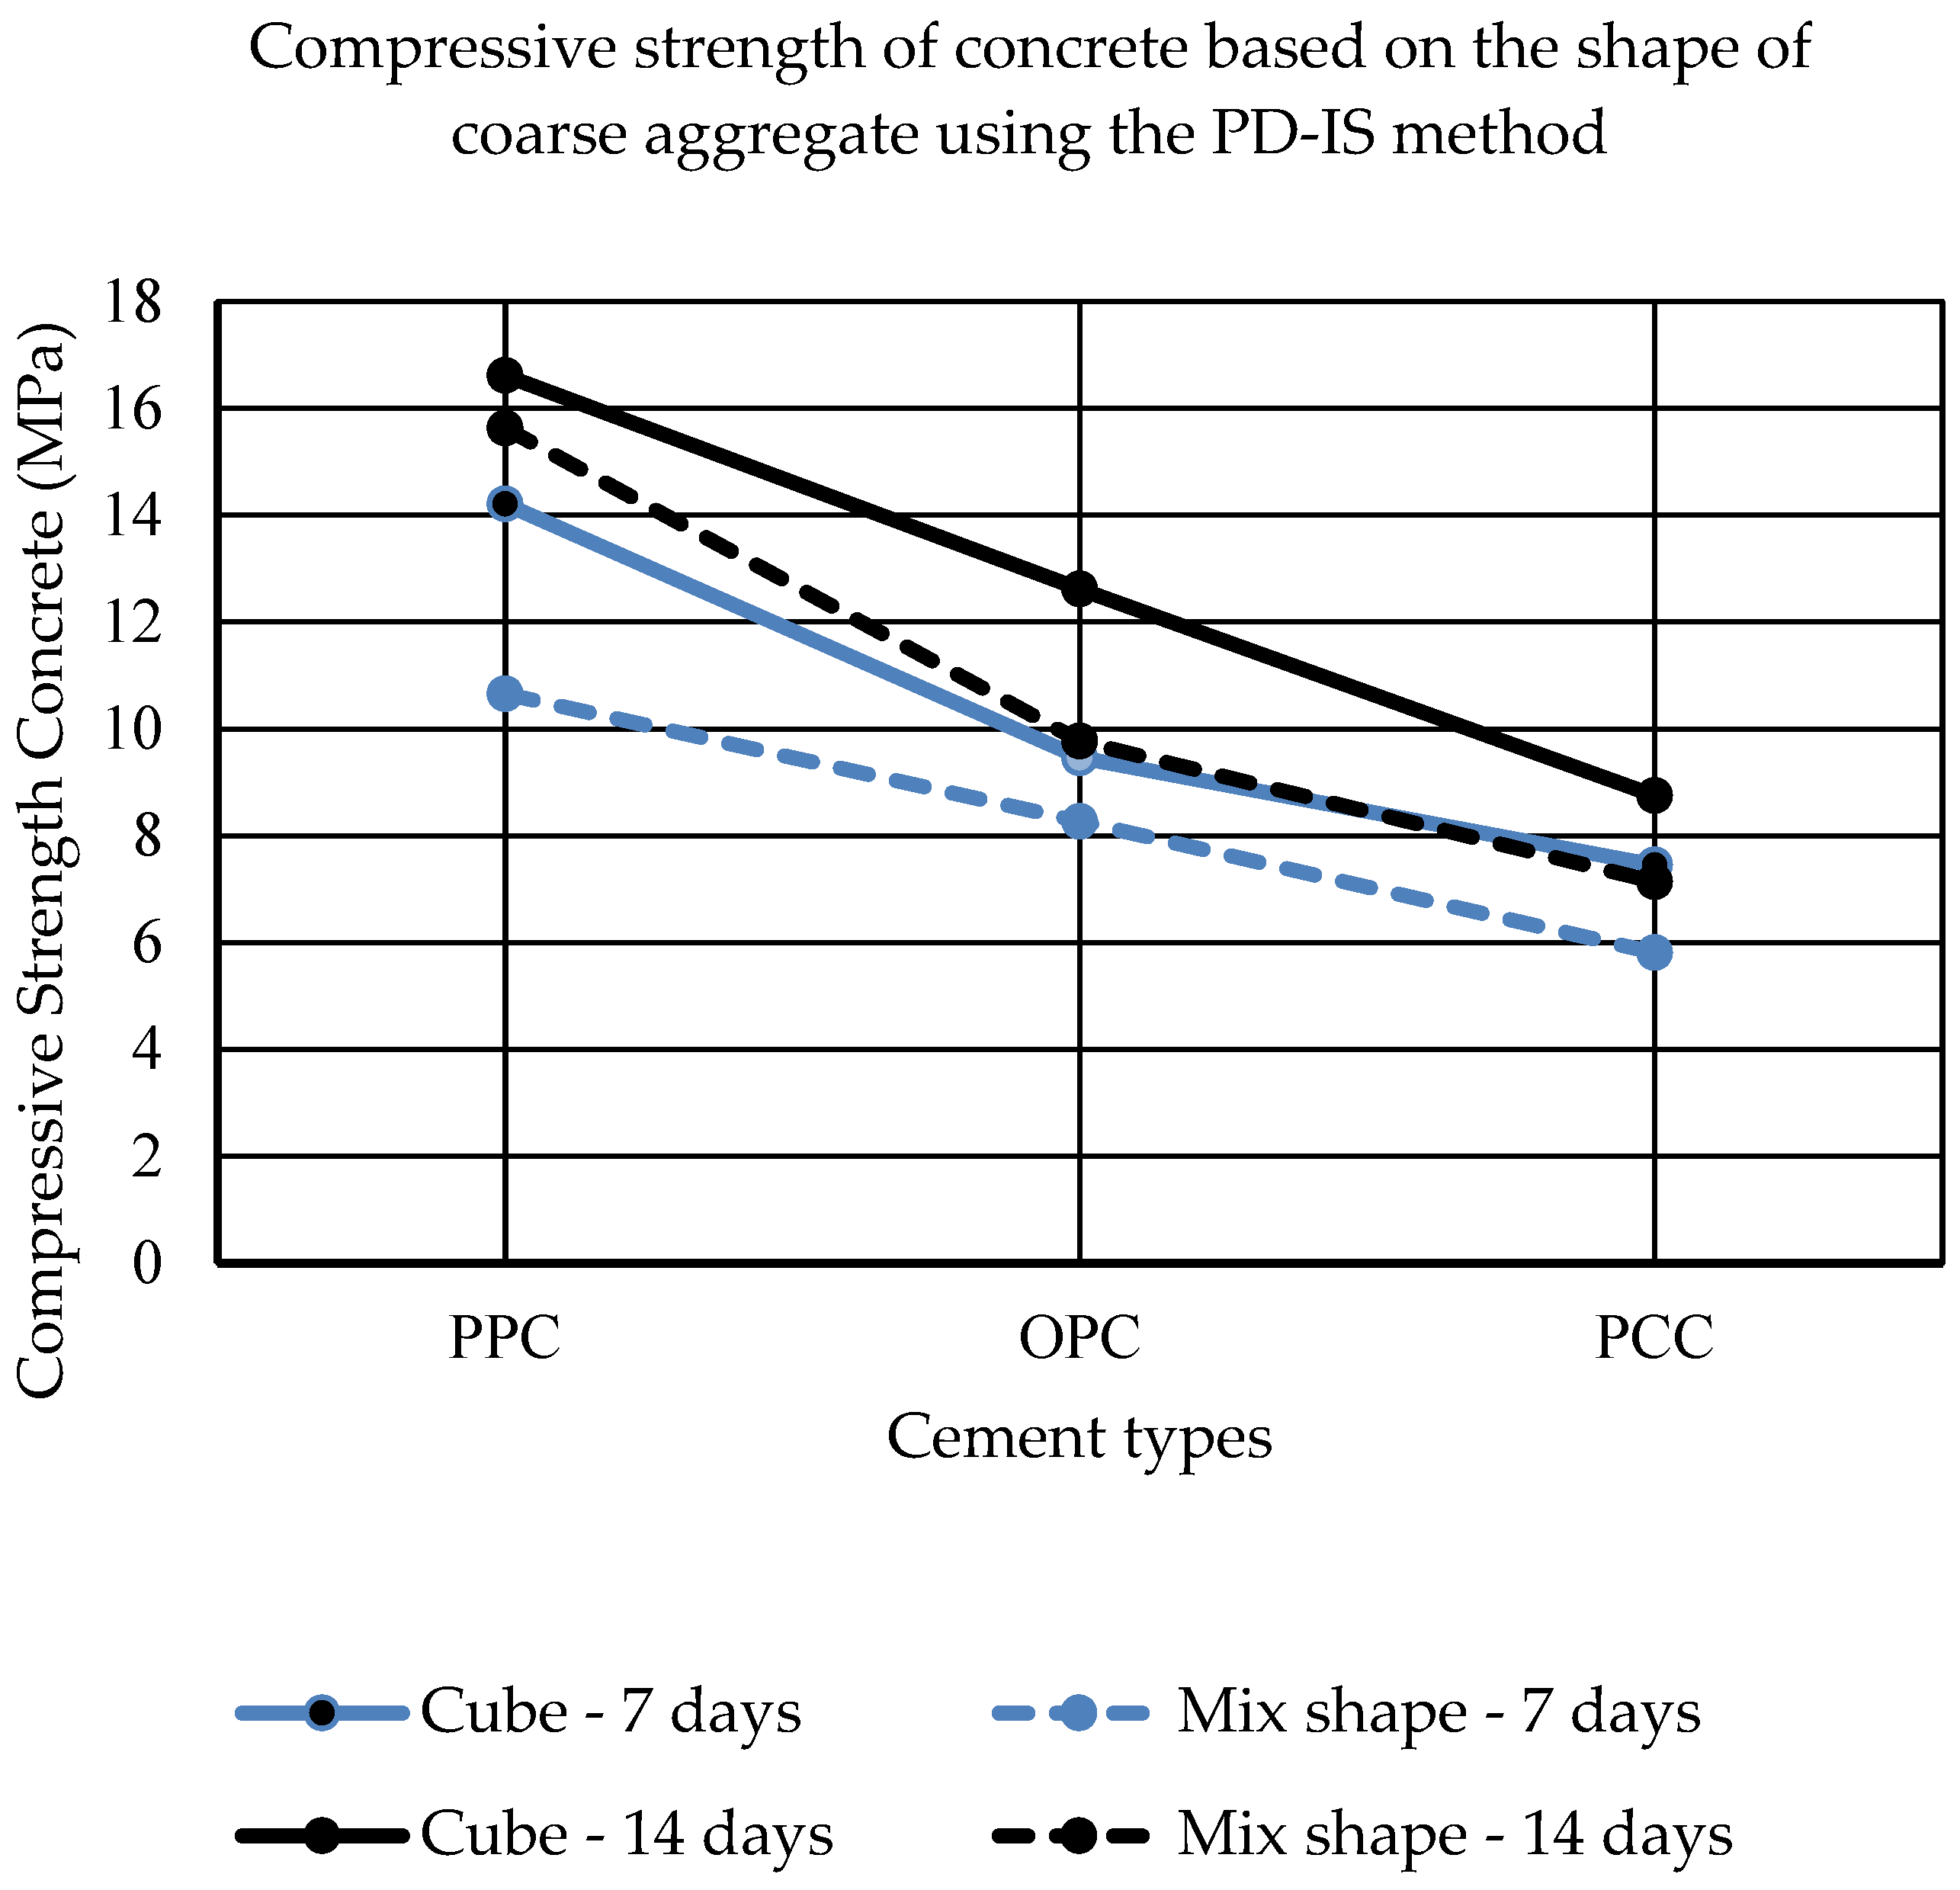
Compressive strength of concrete based on the shape of coarse aggregate using the PD-IS method.
Table 13.
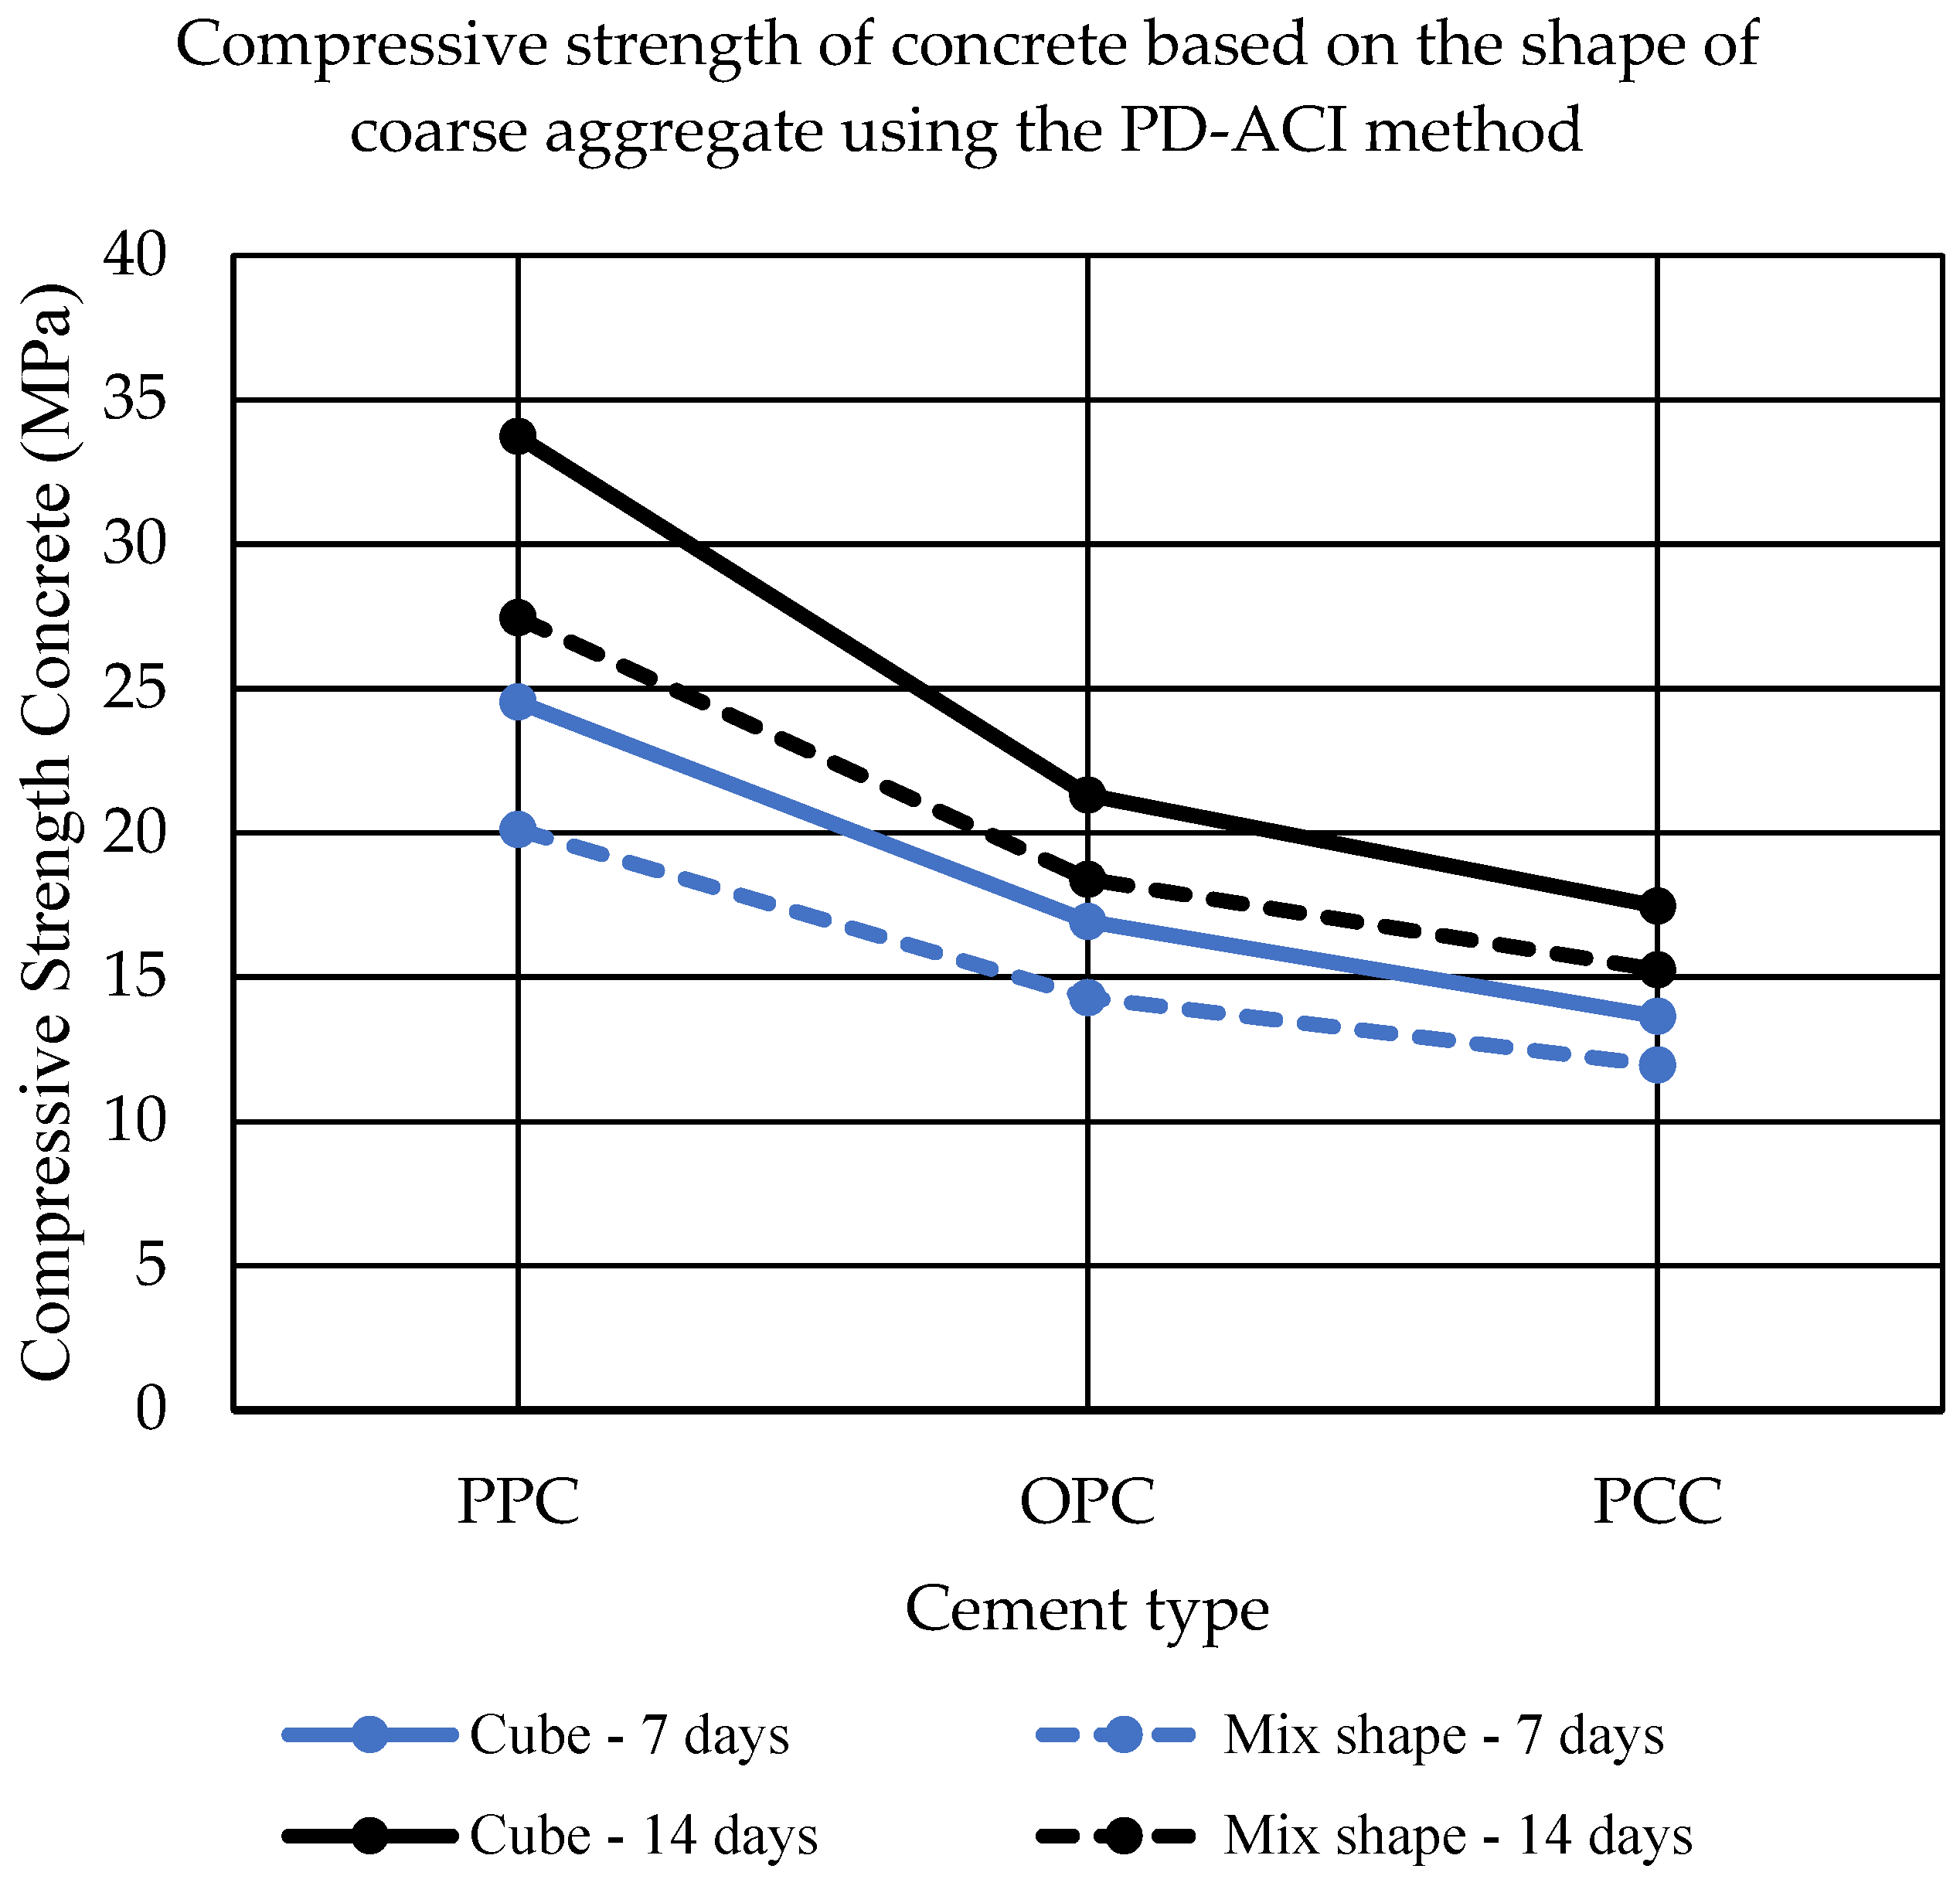
Compressive strength of concrete based on the shape of coarse aggregate using the PD-ACI method.
Figure 14 and Figure 15 show the results of compressive strength of concrete using variations in mix design (ACI and IS), variations in cement (PPC, OPC and PCC), variations in the shape of coarse aggregate (cube shape and mixed shape) and variation in treatment age (7 days and 14 days).
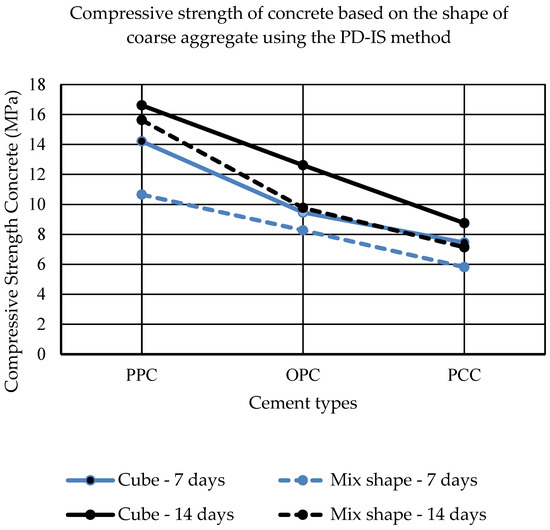
Figure 14.
Graph of the relationship between cement type and concrete compressive strength for variations in coarse aggregate form and curing age using the Indian standard (IS) method.
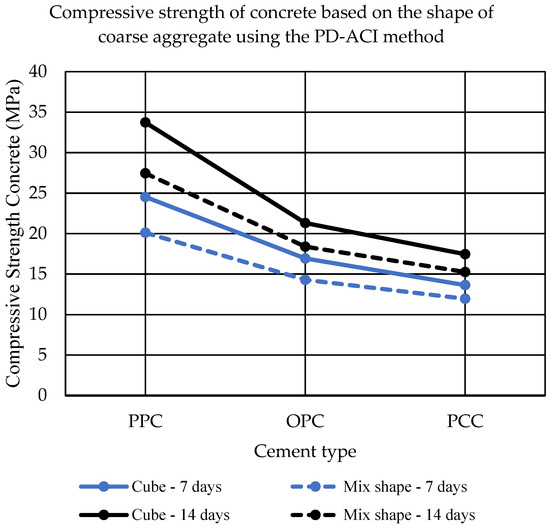
Figure 15.
Graph of the relationship between cement type and concrete compressive strength in variations of coarse aggregate form and treatment age using the ACI method.
4. Conclusions
From the results of this research, we can conclude the following:
- Concrete-mix planning using the ACI method using a cube shape for the coarse aggregate and PPC cement, gives higher concrete compressive strength results with compressive strength fc’ = 24.54 MPa (7 days) and 33.74 MPa (14 days) than the design concrete using the Indian standard (IS) method with the same form of aggregate and cement, amounting to 14.21 MPa (7 days) and 16.62 MPa (14 days). Likewise, the use of coarse aggregate in the form of a mixture and OPC and PCC cement.
- The use of PPC cement in concrete provides the highest compressive strength of concrete compared to the use of OPC and PCC cement, whether using cube aggregate or mixed form, whether the curing age is 7 days or 14 days or whether the ACI or IS concrete mix design method is used.
- Concrete that uses coarse aggregate in the form of cubes produces higher compressive strength than using coarse aggregate in the form of a mixture when using different cements, different curing times and different methods of designing concrete.
- The longest curing age, namely 14 days, has a higher compressive strength of concrete than 7 days for variations in coarse aggregate form, cement variations and variations in concrete design methods.
- Feasibility or whether or not the above research method can be applied to direct work in the field needs to be considered at the scale of the work, for research or small-scale work that can be carried out and allows the implementation of the method, selecting aggregates with sufficient energy and time which is sufficient too. For large-scale work/applications in the field, it is necessary to have a crushing plant/quarry that provides certain aggregate shapes, so that there is no need to sort the aggregate shapes. Therefore, if in the future there is a crushing plant/quarry that provides a certain form of aggregate to be offered, then the method above can be applied to large-scale work.
Author Contributions
T.S. and R.A.N. conceptualized the idea for this work. T.S. designed and developed the hardware. R.A.N. carried out the investigation and data curation. T.S. and R.A.N. designed the visualization. T.S. and R.A.N. validated the acquired results and prepared the original draft. T.S. and R.A.N. reviewed and edited the original draft. T.S. and R.A.N. supervised administered the work. All authors have read and agreed to the published version of the manuscript.
Funding
This research received no external funding.
Institutional Review Board Statement
Not applicable.
Informed Consent Statement
Not applicable.
Data Availability Statement
No new data were created or analyzed in this study.
Conflicts of Interest
The authors declare no conflicts of interest.
References
- Tjokrodimuljo, K. Teknologi Beton; Jurusan Teknik Sipil, Fakultas Teknik Universitas Gadjah Mada: Yogyakarta, Indonesia, 2007. [Google Scholar]
- Mulyono, T. Teknologi Beton; Andi Offset: Yogyakarta, Indonesia, 2004. [Google Scholar]
- Neville, A.M.; Brooks, J.J. Concrete Technology; Longman Scientific & Technical: London, UK, 1987. [Google Scholar]
- Nugraha, P.d.A. Teknologi Beton dan Material, Pembuatan, ke Beton Kinerja Tinggi; Andi Offset: Yogyakarta, Indonesia, 2007. [Google Scholar]
- Collis, L.; Smith, M.R. Aggregates: Sand, Gravel, and Crushed Rock Aggregate for Construction Purposes; Geological Society of London: London, UK, 1985. [Google Scholar]
- ASTM D-4791-95; Standard Test Method for Flat Particles, Elongated Particles, or Flat and Elongated Particles in Coarse Aggregate. ASTM Committee on Standards: West Conshohocken, PA, USA, 2023.
- Narasimha, R.; Patil, G.S.; Bhattacharjee, B. Concrete Mix Design By Packing Density Method; Indian Institute of Technology: Delhi, India, 2014. [Google Scholar]
- Wong, H.H.; Kwan, A.K. Packing Density: A Key Concept for Mix Design of High Performance Concrete. Available online: https://www.alccofine.com/wp-content/uploads/dlm_uploads/2015/02/Packing-Density-Prof-Albert-KWAN.pdf (accessed on 31 March 2025).
- Tanpure, R.P. Concrete Mix Design By Packing Density Method. IJSART 2023, 9, 1217–1227. [Google Scholar]
- Adiguno, D.W. Pengaruh Packing Density Method dan Cara Perawatan Terhadap Mutu Beton Umur 1 Hari dengan Bahan Tambahan Fly Ash Abu Limbah Batu Bara; Program Studi Teknik Sipil Fakultas Teknik Universitas Muhammadiyah Surakarta: Surakarta, Indonesia, 2017. [Google Scholar]
- Wibowo, D.B. Kuat Lentur Beton Menggunakan Blended Cement Pada Variasi Umur Perawatan, Komposisi Semen Dan Fly Ash Menggunakan Metode Packing Density Dan ACI; Fakultas Teknik, Jurusan Teknik Sipil, Universitas Muhammadiyah Surakarta: Surakarta, Indonesia, 2020. [Google Scholar]
- ACI PRC-211.1-22—Selecting Proportions for Normal-Density and High-Density Concrete Guide. 2022. Available online: https://storethinghiem.vn/uploads/files/31-ACI%20211.1-22.pdf (accessed on 31 March 2025).
- Oluwasola, E.A.; Afolayan, A.; Ipindola, O.O.; Popoola, M.O.; Oginni, A.O. Effect of Aggregate Shapes on the Properties of Concrete. LAUTECH J. Civ. Environ. Stud. 2020, 5, 1–10. [Google Scholar] [CrossRef] [PubMed]
- Birli, A. Workability of Concrete? Types & Effects on Concrete Strength. Available online: https://www.ultratechcement.com/for-homebuilders/home-building-explained-single/descriptive-articles/what-is-workability-of-concrete (accessed on 31 March 2025).
- Konitufe, C.; Abubakar, A.; Baba, A.S. Influence of Aggregate Size and Shape on the Compressive Strength of Concrete. Construction 2023, 3, 15–22. [Google Scholar] [CrossRef]
- Wong, I.L.K. Effect compressive strength and split tensile strength of concrete using aggregate from Tana Toraja district with fly ash substitution. IOP Conf. Ser. Earth Environ. Sci. 2021, 921, 012066. [Google Scholar] [CrossRef]
- Brown, R.H.; Marek, C.R. Effect of crusher operation on coarse aggregate shape. In The Concrete Producer; Publication #J96257; The Aberdeen Group: Waltham, MA, USA, 1996. [Google Scholar]
- Ozen, M. Investigation of Relationship Between Aggregate Sahpe Parameter and Concrete Strength Using Imaging Techniques. Master’s Thesis, Middle East Technical University, Ankara, Turkey, April 2007. [Google Scholar]
- Molugaram, K.; Shanker, J. A Study on Influence of Shape of Aggregate on Strength and Quality of Concrete for Buildings and Pavements. Adv. Mater. Res. 2014, 944, 776–779. [Google Scholar] [CrossRef]
- Polat, R.; Yadollahi, M.M.; Sagsoz, A.E.; Arasan, S. The Correlation between Aggregate Shape and Compressive Strength of Concrete. Int. J. Struct. Civ. Eng. Res. 2013, 2, 62–80. [Google Scholar]
- Ramos, M.; Smith, M.R.; Kojovic, T. Aggregate shape—prediction and control during crushing. Quarr. Manag. 1994, 21, 23–30. [Google Scholar]
- Site, S. Chapter 35—Shape, Surface Texture, Surface Area, and Coatings|Significance of Tests and Properti. pp. 1–9. Available online: https://asmedigitalcollection.asme.org/astm-ebooks/book/1258/chapter-abstract/27788022/Chapter-35-Shape-Surface-Texture-Surface-Area-and?redirectedFrom=fulltext (accessed on 31 March 2025).
- Yehia, S.; Abdelfatah, A.; Mansour, D. Effect of aggregate type and specimen configuration on concrete compressive strength. Crystals 2020, 10, 625. [Google Scholar] [CrossRef]
- Meshram, K.; Goliya, H.S. Effect of Shape of Aggregate on Pavement Quality Concrete. Indian Highway 2013, 41, 35–42. [Google Scholar]
- Bouquety, M.N.; Descantes, Y.; Barcelo, L.; de Larrard, F.; Clavaud, B. Experimental study of crushed aggregate shape. Constr. Build. Mater. 2007, 21, 865–872. [Google Scholar] [CrossRef]
- Kaplan, M.F. Furthur Tests of Dynamically Loaded Beams. ACI J. Proc. 1959, 55, 1193–1208. [Google Scholar] [CrossRef]
- Aïssoun, B.M.; Hwang, S.D.; Khayat, K.H. Influence of aggregate characteristics on workability of superworkable concrete. Mater. Struct. Constr. 2016, 49, 597–609. [Google Scholar] [CrossRef]
- Kalra, M.; Mehmood, G. A Review paper on the Effect of different types of coarse aggregate on Concrete. IOP Conf. Ser. Mater. Sci. Eng. 2018, 431, 082001. [Google Scholar] [CrossRef]
- Hong, L.; Gu, X.-L.; Lin, F.; Gao, P.; Sun, L.-Z. Effects of Coarse Aggregate Form, Angularity, and Surface Texture on Concrete Mechanical Performance. J. Mater. Civ. Eng. 2019, 31, 0002849. [Google Scholar] [CrossRef]
- Azevedo, N.M.; Lemos, J.V. Aggregate shape influence on the fracture behaviour of concrete. Struct. Eng. Mech. 2006, 24, 411–427. [Google Scholar] [CrossRef]
- Al-Rousan, T.; Masad, E.; Tutumluer, E.; Pan, T. Evaluation of image analysis techniques for quantifying aggregate shape characteristics. Constr. Build. Mater. 2007, 21, 978–990. [Google Scholar] [CrossRef]
- Cruz-Matías, I.; Ayala, D.; Hiller, D.; Gutsch, S.; Zacharias, M.; Estradé, S.; Peiró, F. Sphericity and roundness computation for particles using the extreme vertices model. J. Comput. Sci. 2019, 30, 28–40. [Google Scholar] [CrossRef]
- Fernlund, J.M.R. Image analysis method for determining 3-D shape of coarse aggregate. Cem. Concr. Res. 2005, 35, 1629–1637. [Google Scholar] [CrossRef]
- Gu, X.; Tran, Y.; Hong, L. Quantification of coarse aggregate shape in concrete. Front. Struct. Civ. Eng. 2014, 8, 308–321. [Google Scholar] [CrossRef]
- Hong, L.; Gu, X.; Lin, F. Influence of aggregate surface roughness on mechanical properties of interface and concrete. Constr. Build. Mater. 2014, 65, 338–349. [Google Scholar] [CrossRef]
- Kuo, C.-Y.; Freeman, R.B. Imaging Indices for Quantification of Shape, Angularity, and Surface Texture of Aggregates. Transp. Res. Rec. 2000, 1721, 57–65. [Google Scholar] [CrossRef]
- Pan, T.; Liu, Y.; Tutumluer, E. Microstructural Mechanisms of Early Age Cracking Behavior of Concrete: Fracture Energy Approach. J. Eng. Mech. 2011, 137, 439–446. [Google Scholar] [CrossRef]
- Rocco, C.G.; Elices, M. Effect of aggregate shape on the mechanical properties of a simple concrete. Eng. Fract. Mech. 2009, 76, 286–298. [Google Scholar] [CrossRef]
- Wills, M.H. How Aggregate Particle Shape Influences Concrete Mixing Water Requirement and Strength. J. Mater. 1967, 2, 843–865. [Google Scholar]
- Darvishvand, H.R.; Taghia, S.A.H.S.; Ebrahimi, M. The effect of size and shape of aggregate on compressive strength and ductility of concrete. Cem. Wapno. Bet. 2021, 2021, 46–54. [Google Scholar] [CrossRef]
- Lees, G.; Kennedy, C.K. Quality, shape and degradation of aggregates. Q. J. Eng. Geol. 1975, 8, 193–209. [Google Scholar] [CrossRef]
- Lie, H.A.; Nurhuda, I.; Setiawan, Y. The Effect of Aggregate Shape and Configuration to the Concrete Behavior. Smart Sci. 2014, 2, 85–90. [Google Scholar] [CrossRef]
- Nisa, M.U. Study to Find Out Shape Effect of Coarse Aggregate on Workability and Compressive Strength of Concrete. Int. J. Res. Appl. Sci. Eng. Technol. 2021, 9, 136–141. [Google Scholar] [CrossRef]
- Poloju, K.K. Properties of Concrete as Influenced by Shape and Texture of Fine Aggregate. Am. J. Appl. Sci. Res. 2017, 3, 28. [Google Scholar] [CrossRef]
- Kwan, A.K.H.; Mora, C.F.; Chan, H.C. Cement and Concrete Research Particle shape analysis of coarse aggregate using digital image processing. Cem. Concr. Res. 1998, 28, 921–932. [Google Scholar]
- Fowler, D.W.; Allen, J.J.; Folliard, K.J.; Kreger, M.E. The Effect of the Aggregates Characteristics on the Performance of Portland Cement Concrete Committee; University of Texas at Austin: Austin, TX, USA, 2003. [Google Scholar]
- SNI-15-2049-2004; Semen Portland. Badan Standarisasi Nasional: Jakarta, Indonesia, 2004.
- SNI 15-2049-2015; Karakteristik Kimia Semen Portland. Badan Standarisasi Nasional: Jakarta, Indonesia, 2015.
- ASTM C-150; Specification for Portland Cement. ASTM Internasional: West Conshohocken, PA, USA, 2024.
- SNI 15-2530-1991; Metode Pengujian Kehalusan Semen Portland. Badan Standarisasi Nasional: Jakarta, Indonesia, 1991.
- SNI 15-2531-1991; Metode Pengujian Berat Jenis Semen Portland. Badan Standarisasi Nasional: Jakarta, Indonesia, 1991.
- SNI 03-4806-1998; Metode Pengujian Kadar Semen Portland Dalam Beton Segar Dengan Cara Titrasi Volumetri. Badan Standarisasi Nasional: Jakarta, Indonesia, 1998.
- SNI-03-2816-1992; Metode Uji Bahan Organik dalam Agregat Halus untuk Beton. Badan Standarisasi Nasional: Jakarta, Indonesia, 1992.
- SNI 03-1970-2008; Cara Uji Berat Jenis dan Penyerapan Agregat Halus. Badan Standarisasi Nasional: Jakarta, Indonesia, 2008.
- SNI 03-2816-1992; Metode Pengujian Kotoran Organik Dalam Pasir Untuk Campuran Mortar Atau Beton. Badan Standarisasi Nasional: Jakarta, Indonesia, 1992.
- SNI 03-1970-1990; Metode Pengujian Berat Jenis dan Penyerapan Air Agregat Halus. Badan Standarisasi Nasional: Jakarta, Indonesia, 1990.
- SNI 03-6820-2002; Spesifikasi Agregat Halus untuk Pekerjaan Adukan dan Plesteran dengan Bahan Dasar Semen. Badan Standarisasi Nasional: Jakarta, Indonesia, 2002.
- SNI 03-4142-1996; Metode Pengujian Jumlah Bahan Dalam Agregat yang Lolos Saringan No.200 (0,075 mm). Badan Standarisasi Nasional: Jakarta, Indonesia, 1996.
- SNI 03-1969-2008; Cara Uji Berat Jenis dan Penyerapan Air Agregat Kasar. Badan Standarisasi Nasional: Jakarta, Indonesia, 2008.
- SNI 03-4141-1996; Metode Pengujian Gumpalan Lempung dan Butir-Butir Mudah Pecah dalam Agregat. Badan Standarisasi Nasional: Jakarta, Indonesia, 1996.
- SNI 03-4137-1996; Metode Pengujian Tebal dan Panjang Rata-Rata Agregat. Badan Standarisasi Nasional: Jakarta, Indonesia, 1996.
- SNI 2458: 2008; Tata Cara Pengambilan Contoh Uji Beton Segar. Badan Standarisasi Nasional: Jakarta, Indonesia, 2008.
- SNI 1972: 2008; Cara Uji Slump Beton. Badan Standarisasi Nasional: Jakarta, Indonesia, 2008.
- SNI 03-6429-2000; Metode Pengujian Kuat Tekan Beton Silinder dengan Cetakan Silinder didalam Tempat Cetakan. Badan Standarisasi Nasional: Jakarta, Indonesia, 2000.
- SNI 03-2493-2011; Tata Cara Pembuatan dan Perawatan Benda Uji Beton. Badan Standarisasi Nasional: Jakarta, Indonesia, 2011.
- SNI-1974-2011; Cara Uji Tekan Beton Dengan Benda Uji Silinder. Badan Standarisasi Nasional: Jakarta, Indonesia, 2011.
- Adistiani, P. Pengaruh Merk Semen Terhadap Kuat Tekan Beton Dengan Perendaman Air Tawar; Fakultas Teknik, Jurusan Teknik Sipil: Yogyakarta, Indonesia, 2017. [Google Scholar]


Disclaimer/Publisher’s Note: The statements, opinions and data contained in all publications are solely those of the individual author(s) and contributor(s) and not of MDPI and/or the editor(s). MDPI and/or the editor(s) disclaim responsibility for any injury to people or property resulting from any ideas, methods, instructions or products referred to in the content. |
© 2025 by the authors. Licensee MDPI, Basel, Switzerland. This article is an open access article distributed under the terms and conditions of the Creative Commons Attribution (CC BY) license (https://creativecommons.org/licenses/by/4.0/).