Proceeding Paper

Vibration Analysis for Wind Turbine Prognosis with an Uncertainty Bayesian-Optimized Lightweight Neural Network †

by
Tarek Berghout
1,* and
Mohamed Benbouzid
2,3
1
Laboratory of Automation and Manufacturing Engineering, University of Batna 2, Batna 05000, Algeria
2
UMR CNRS 6027 IRDL, University of Brest, 29238 Brest, France
3
Logistics Engineering College, Shanghai Maritime University, Shanghai 201306, China
*
Author to whom correspondence should be addressed.
Presented at the 11th International Electronic Conference on Sensors and Applications (ECSA-11), 26–28 November 2024; Available online: https://sciforum.net/event/ecsa-11.
Eng. Proc. 2024, 82(1), 47; https://doi.org/10.3390/ecsa-11-20502
Published: 26 November 2024

Abstract

Data-driven methods have emerged as indispensable tools for wind turbine prognosis, offering unparalleled insights into system health and performance monitoring. However, harnessing the full potential of these methods poses significant challenges, specifically when it comes to data complexity due to harsh conditions. This absolutely necessitates innovative approaches and less computationally intensive methods to simply and effectively navigate the inherent complexities in wind turbine data analysis. Accordingly, this study presents a novel approach to wind turbine state-of-health prognosis for maintenance purposes using a realistic high-speed shaft wind turbine dataset capturing vibration run-to-failure data. Leveraging this dataset, we employ an Uncertainty Bayesian-Optimized Extreme Learning Machine (UBO-ELM) as a lightweight neural network algorithm for predictive modeling. The optimization process focuses on identifying optimal hyperparameters, including neurons, activation functions, and regularization parameters, aiming to minimize uncertainty in predictions and enhance generalization performance. To quantify uncertainty, we employ a confidence interval-based approach, computing multiple confidence interval features to provide a comprehensive numerical evaluation of uncertainty. The neural network’s performance is further evaluated using a diverse set of error metrics, including the coefficient of determination. Despite the massive scale of the dataset, our proposed methodology proves to be simple and computationally efficient, yielding impressive approximation and generalization results. Compared to advanced deep learning methods, this approach offers practical utility by leveraging existing computational resources, minimizing costs, and enabling fast validation without prolonged wait times.

1. Introduction

Wind turbines stand as immense sentinels on landscapes worldwide, harnessing the boundless power of the wind to generate clean, renewable energy. Their significance in the global energy landscape cannot be overstated, as they represent a crucial component of efforts to combat climate change and transition towards sustainable energy sources [1]. However, the reliable operation of wind turbines is contingent upon effective monitoring and maintenance practices to ensure optimal performance and longevity [2]. The advent of data-driven methods has revolutionized the field of wind turbine prognosis, offering unparalleled insights into the health and performance of these complex systems [3,4]. By analyzing vast streams of data, including vibration patterns and operational parameters, these methods enable early detection of potential faults and predictive maintenance strategies. Such proactive approaches not only enhance operational efficiency but also minimize downtime and maintenance costs, thereby maximizing the return on investment for wind farm operators [5,6,7,8,9,10,11]. Despite the immense promise of data-driven approaches, their efficacy can be impeded by several challenges, particularly in the context of wind turbine applications. The harsh environmental conditions to which wind turbines are subjected introduce complexities in data acquisition and analysis, necessitating innovative solutions to navigate these challenges effectively. Moreover, the computational demands associated with traditional deep learning algorithms pose significant barriers, limiting their practical utility in real-world applications [12,13].
In this context, our research endeavors to address these challenges by proposing a novel approach to wind turbine prognosis for maintenance purposes. Leveraging a realistic dataset capturing vibration run-to-failure data from high-speed shaft wind turbines [14], we introduce the Uncertainty Bayesian-Optimized Extreme Learning Machine (UBO-ELM) as a lightweight neural network algorithm for predictive modeling [15,16,17]. This approach is tailored to optimize hyperparameters, such as neurons, activation functions, and regularization parameters, with a primary focus on minimizing uncertainty in predictions and enhancing generalization performance. To quantify uncertainty, we employ a confidence interval-based approach, generating multiple confidence interval features like interval width, stability, and coverage probability to provide a comprehensive numerical evaluation. Furthermore, the performance of our neural network model is rigorously evaluated using diverse error metrics, including the coefficient of determination, to ensure robustness and reliability.
Despite the complexity and scale of the dataset, our methodology demonstrates simplicity and computational efficiency, yielding impressive approximation and generalization results. By contrast with advanced deep learning methods, our approach offers practical utility by leveraging existing computational resources, minimizing costs, and enabling rapid validation without prolonged wait times. In summary, our research presents a significant contribution to the field of wind turbine prognosis, offering a pragmatic solution to the challenges associated with data complexity and computational intensity. Through the integration of uncertainty quantification and lightweight neural network algorithms, we aim to facilitate more effective maintenance strategies, ultimately enhancing the reliability and longevity of wind turbine systems.

2. Materials

The dataset used in this work simulates vibration data from a high-speed shaft bearing in a wind turbine, which is commonly associated with failure modes in such systems [14]. The dataset comprises run-to-failure vibration measurements collected from accelerometers mounted near the wind turbine’s high-speed shaft. Additionally, the dataset includes information about the operational conditions, which are crucial factors influencing the behavior of the bearing. The dataset is illustrated in Figure 1a, showcasing its complexity and variability, necessitating important preprocessing steps. Therefore, this work proposes steps outlined in Figure 1b–e, including wavelet denoising, feature extraction, outlier removal, and filtering. These steps aid in providing a linear trend of degradation. Finally, the dataset is labeled with a degraded linear function representing 50 days of remaining useful life (RUL), as in Figure 1f.

3. Methods

In this work, the Extreme Learning Machine (ELM) was employed to reduce the complexity of the learning system’s architecture. Unlike traditional learning systems, which often require iterative tuning of weights and biases across multiple layers, ELM offers a more efficient approach by utilizing a single hidden layer with randomly generated weights. The process is divided into three main steps:
1. Generating input weights and biases: The first step involves generating the input weights a and biases b randomly. These parameters are fixed once initialized, which simplifies the training process by eliminating the need for backpropagation and iterative weight updates. This step helps in defining the non-linear transformation of the input data, X .
2. Calculating and activating the hidden layer: The second step involves computing the hidden layer’s output, denoted as H . This is conducted by applying the activation function f to the input data X and the corresponding weights and biases. Mathematically, this step is represented by Equation (1). Here, H is the activated hidden layer, f is the chosen activation function (such as sigmoid or ReLU), and a X + b represents the linear combination of inputs, weights, and biases that are transformed by the non-linearity.
H = f ( a X + b )
3. Determining the output weights: In the final step, the output weights β are determined using a closed-form solution. The output weights are computed by solving a linear system, which involves the hidden layer outputs H and the target outputs y . To stabilize the solution, a regularization term C is included to prevent overfitting, especially when dealing with noisy data. The solution also utilizes the pseudo-inverse of the hidden layer matrix, represented by H H T + I C 1 , where H T is the transpose of H , and I is the identity matrix. This equation is expressed as in (2). Here, β represents the output weights that map the hidden layer outputs ‘H’ to the final predictions Y . The regularization term C helps control the trade-off between fitting the data well and keeping the model weights small to enhance generalization performance.
β = H H T + I C 1 Y
This study employs a z-score-based confidence interval (CI) to quantify uncertainty in predictions [18]. In Equation (3), X ¯ represents the sample mean, z is the score for a given confidence level (e.g., around 2.5758 for a 99% confidence level in this study), ω signifies the standard deviation of X , and n is the number of points in y . The objective function primarily focuses on the interval width, C I w , as the main objective, as shown in Equation (4). A narrower C I w indicates higher certainty in predictions.
C I = X ¯ ± z   · ω
C I w = 2 ( z   · ω )

4. Results

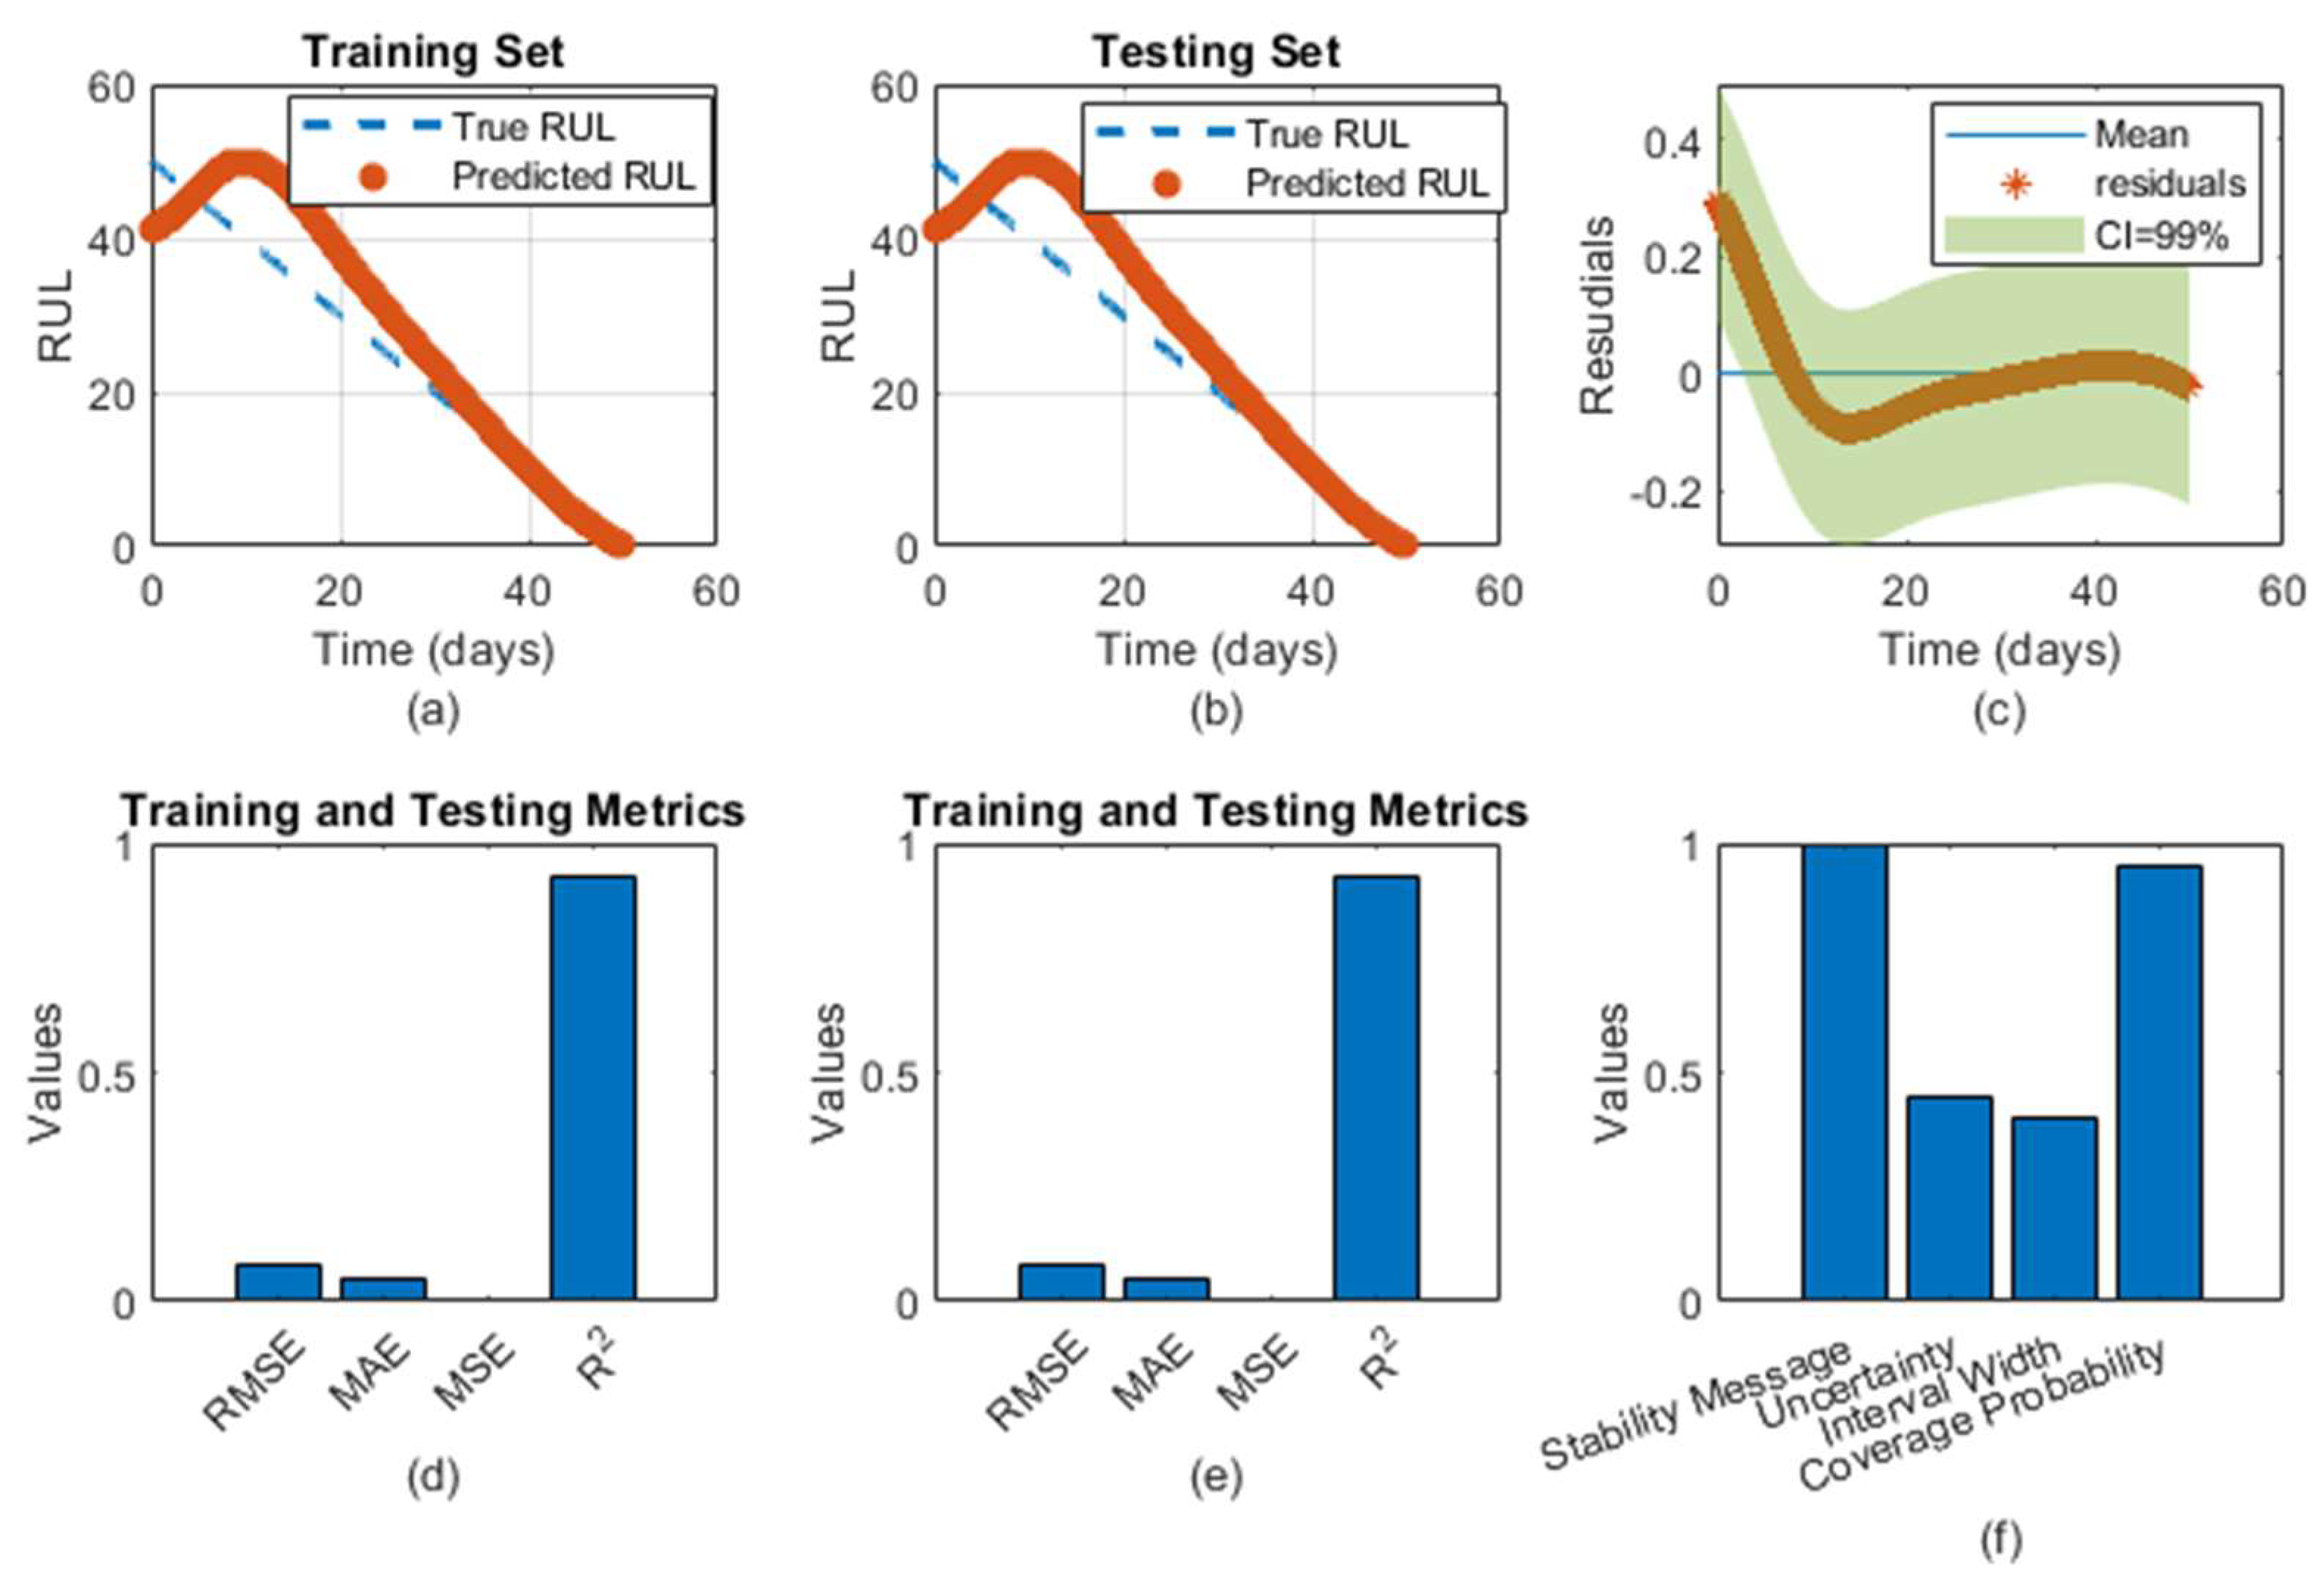
Figure 2 presents a comprehensive view of the results obtained by applying the proposed UBO-ELM approach. This figure consists of multiple subplots that highlight the model’s performance during both the training and testing phases. In Figure 2a,b, the training and testing curves are depicted, showcasing the curve-fitting of the model on the respective datasets, with an 80%–20% split ratio between training and testing. These curves demonstrate how well the UBO-ELM model learns from the training data and generalizes its performance on unseen testing data. The close alignment of the curves indicates that the model is not overfitting and can accurately predict on new data, reinforcing its generalization capabilities. Figure 2c presents the confidence interval (CI) for the testing set, constructed for a 99% confidence level. The CI provides a measure of uncertainty in the predictions, showing the range within which future predictions are expected to fall with high confidence. The fact that the CI is narrow and smooth in this figure implies that there is minimal variability in the model’s predictions. The tight CI reflects the model’s stability and reliability, suggesting that its predictions are not overly sensitive to changes in the data. Figure 2d,e illustrate the error metrics and the coefficient of determination (R2) for both the training and testing sets. Error metrics such as Mean Squared Error (MSE) or Root Mean Squared Error (RMSE) are displayed, indicating how well the model performs in minimizing the difference between predicted and actual values. The low error metrics in both the training and testing phases imply that the UBO-ELM model accurately captures the underlying patterns in the data. Additionally, the high coefficient of determination suggests that a large proportion of the variance in the data is explained by the model, which is crucial for predicting long-term trends in wind turbine behavior. The narrow confidence interval shown in Figure 2c, combined with the low error metrics and high R2 values in Figure 2d,e, demonstrate the effectiveness of the proposed UBO-ELM approach in predicting outcomes with high certainty. The smoothness and tightness of the CI indicate that the model is not only precise but also highly reliable for making predictions under uncertainty, which is critical for applications such as wind turbine prognosis. The CI’s alignment with the 99% confidence level suggests a high degree of confidence in the model’s ability to provide accurate predictions. In summary, the results from Figure 2 collectively indicate that the UBO-ELM approach excels in addressing the challenges of wind turbine prognosis. The stable training and testing curves, low error rates, high R2 values, and narrow, smooth confidence intervals all highlight the robustness and reliability of the model. This makes the UBO-ELM approach a powerful tool for maintenance planning and decision-making in wind energy systems, where accurate predictions of component degradation and remaining useful life are essential for minimizing downtime and optimizing maintenance schedules. The model’s ability to produce stable predictions with high certainty ultimately contributes to enhancing the overall efficiency and reliability of wind energy operations.

5. Conclusions

This study introduces a novel approach to wind turbine prognosis for maintenance purposes, utilizing the UBO-ELM algorithm. By leveraging realistic vibration run-to-failure data from high-speed shaft wind turbines, our methodology demonstrates simplicity and computational efficiency, offering impressive approximation and generalization results. Through uncertainty quantification and lightweight neural network algorithms, we address the challenges associated with data complexity and computational intensity in wind turbine data analysis. The presented results showcase stable performances in both training and testing datasets, with narrow and smooth confidence intervals indicating high confidence in predictions. Low error metrics and high coefficients of determination underscore the accuracy and reliability of the model. Furthermore, the CI features visualization highlights the stability and coverage probability of the predictions. Overall, the UBO-ELM approach represents a significant advancement in wind turbine prognosis, offering practical utility by maximizing the use of existing computational resources and enabling rapid validation. By providing early detection of potential faults and facilitating proactive maintenance strategies, this methodology contributes to enhancing the reliability and longevity of wind turbine systems, ultimately supporting the transition toward sustainable energy solutions.

Author Contributions

Conceptualization, T.B. and M.B.; methodology, T.B. and M.B.; software, T.B.; validation, T.B. and M.B.; formal analysis, T.B. and M.B.; investigation, T.B. and M.B.; resources, T.B.; data curation, T.B.; writing—original draft preparation, T.B.; writing—review and editing, T.B. and M.B. All authors have read and agreed to the published version of the manuscript.

Funding

This research received no external funding.

Institutional Review Board Statement

Not applicable.

Informed Consent Statement

Not applicable.

Data Availability Statement

Data used in this paper and all codes are publicly available at https://zenodo.org/doi/10.5281/zenodo.11145205.

Conflicts of Interest

The authors declare no conflicts of interest.

References

  1. Leite, G.d.N.P.; Araújo, A.M.; Rosas, P.A.C. Prognostic Techniques Applied to Maintenance of Wind Turbines: A Concise and Specific Review. Renew. Sustain. Energy Rev. 2018, 81, 1917–1925. [Google Scholar] [CrossRef]
  2. Costa, Á.M.; Orosa, J.A.; Vergara, D.; Fernández-Arias, P. New Tendencies in Wind Energy Operation and Maintenance. Appl. Sci. 2021, 11, 1386. [Google Scholar] [CrossRef]
  3. Santiago, R.A.d.F.; Barbosa, N.B.; Mergulhão, H.G.; de Carvalho, T.F.; Santos, A.A.B.; Medrado, R.C.; Filho, J.B.d.M.; Pinheiro, O.R.; Nascimento, E.G.S. Data-Driven Models Applied to Predictive and Prescriptive Maintenance of Wind Turbine: A Systematic Review of Approaches Based on Failure Detection, Diagnosis, and Prognosis. Energies 2024, 17, 1010. [Google Scholar] [CrossRef]
  4. Berghout, T.; Benbouzid, M.; Amirat, Y. Interaction between Machine Learning and Maintenance Planning for Wind Energy Systems: A Theoretical Review and Analysis. In Proceedings of the 2nd Annual IEEE Industrial Electronics Society Online Conference (ONCON) 2023, Virtual, 8–10 December 2023; pp. 1–6. [Google Scholar]
  5. Liton Hossain, M.; Abu-Siada, A.; Muyeen, S.M. Methods for Advanced Wind Turbine Condition Monitoring and Early Diagnosis: A Literature Review. Energies 2018, 11, 1309. [Google Scholar] [CrossRef]
  6. Ding, F.; Tian, Z.; Jin, T. Maintenance Modeling and Optimization for Wind Turbine Systems: A Review. In Proceedings of the 2013 International Conference on Quality, Reliability, Risk, Maintenance, and Safety Engineering (QR2MSE), Chengdu, China, 15–18 July 2013; pp. 569–575. [Google Scholar] [CrossRef]
  7. McMorland, J.; Flannigan, C.; Carroll, J.; Collu, M.; McMillan, D.; Leithead, W.; Coraddu, A. A Review of Operations and Maintenance Modelling with Considerations for Novel Wind Turbine Concepts. Renew. Sustain. Energy Rev. 2022, 165, 112581. [Google Scholar] [CrossRef]
  8. Helbing, G.; Ritter, M. Deep Learning for Fault Detection in Wind Turbines. Renew. Sustain. Energy Rev. 2018, 98, 189–198. [Google Scholar] [CrossRef]
  9. Tchakoua, P.; Wamkeue, R.; Ouhrouche, M.; Slaoui-Hasnaoui, F.; Tameghe, T.; Ekemb, G. Wind Turbine Condition Monitoring: State-of-the-Art Review, New Trends, and Future Challenges. Energies 2014, 7, 2595–2630. [Google Scholar] [CrossRef]
  10. Habibi, H.; Howard, I.; Simani, S. Reliability Improvement of Wind Turbine Power Generation Using Model-Based Fault Detection and Fault Tolerant Control: A Review. Renew. Energy 2019, 135, 877–896. [Google Scholar] [CrossRef]
  11. Lu, B.; Li, Y.; Wu, X.; Yang, Z. A Review of Recent Advances in Wind Turbine Condition Monitoring and Fault Diagnosis. In Proceedings of the 2009 IEEE Power Electronics and Machines in Wind Applications, Lincoln, NE, USA, 24–26 June 2009; pp. 1–7. [Google Scholar]
  12. Abdar, M.; Pourpanah, F.; Hussain, S.; Rezazadegan, D.; Liu, L.; Ghavamzadeh, M.; Fieguth, P.; Cao, X.; Khosravi, A.; Acharya, U.R.; et al. A Review of Uncertainty Quantification in Deep Learning: Techniques, Applications and Challenges. Inf. Fusion 2021, 76, 243–297. [Google Scholar] [CrossRef]
  13. Alves, D.S.; Daniel, G.B.; de Castro, H.F.; Machado, T.H.; Cavalca, K.L.; Gecgel, O.; Dias, J.P.; Ekwaro-Osire, S. Uncertainty Quantification in Deep Convolutional Neural Network Diagnostics of Journal Bearings with Ovalization Fault. Mech. Mach. Theory 2020, 149, 103835. [Google Scholar] [CrossRef]
  14. Elforjani, M.; Shanbr, S.; Bechhoefer, E. Detection of Faulty High Speed Wind Turbine Bearing Using Signal Intensity Estimator Technique. Wind Energy 2018, 21, 53–69. [Google Scholar] [CrossRef]
  15. Wu, J.; Chen, X.Y.; Zhang, H.; Xiong, L.D.; Lei, H.; Deng, S.H. Hyperparameter Optimization for Machine Learning Models Based on Bayesian Optimization. J. Electron. Sci. Technol. 2019, 17, 26–40. [Google Scholar] [CrossRef]
  16. Huang, G. Bin What Are Extreme Learning Machines? Filling the Gap Between Frank Rosenblatt’s Dream and John von Neumann’s Puzzle. Cognit. Comput. 2015, 7, 263–278. [Google Scholar] [CrossRef]
  17. Berghout, T.; Benbouzid, M. EL-NAHL: Exploring Labels Autoencoding in Augmented Hidden Layers of Feedforward Neural Networks for Cybersecurity in Smart Grids. Reliab. Eng. Syst. Saf. 2022, 226, 108680. [Google Scholar] [CrossRef]
  18. Poole, C. Beyond the Confidence Interval. Am. J. Public Health 1987, 77, 195. [Google Scholar] [CrossRef] [PubMed]
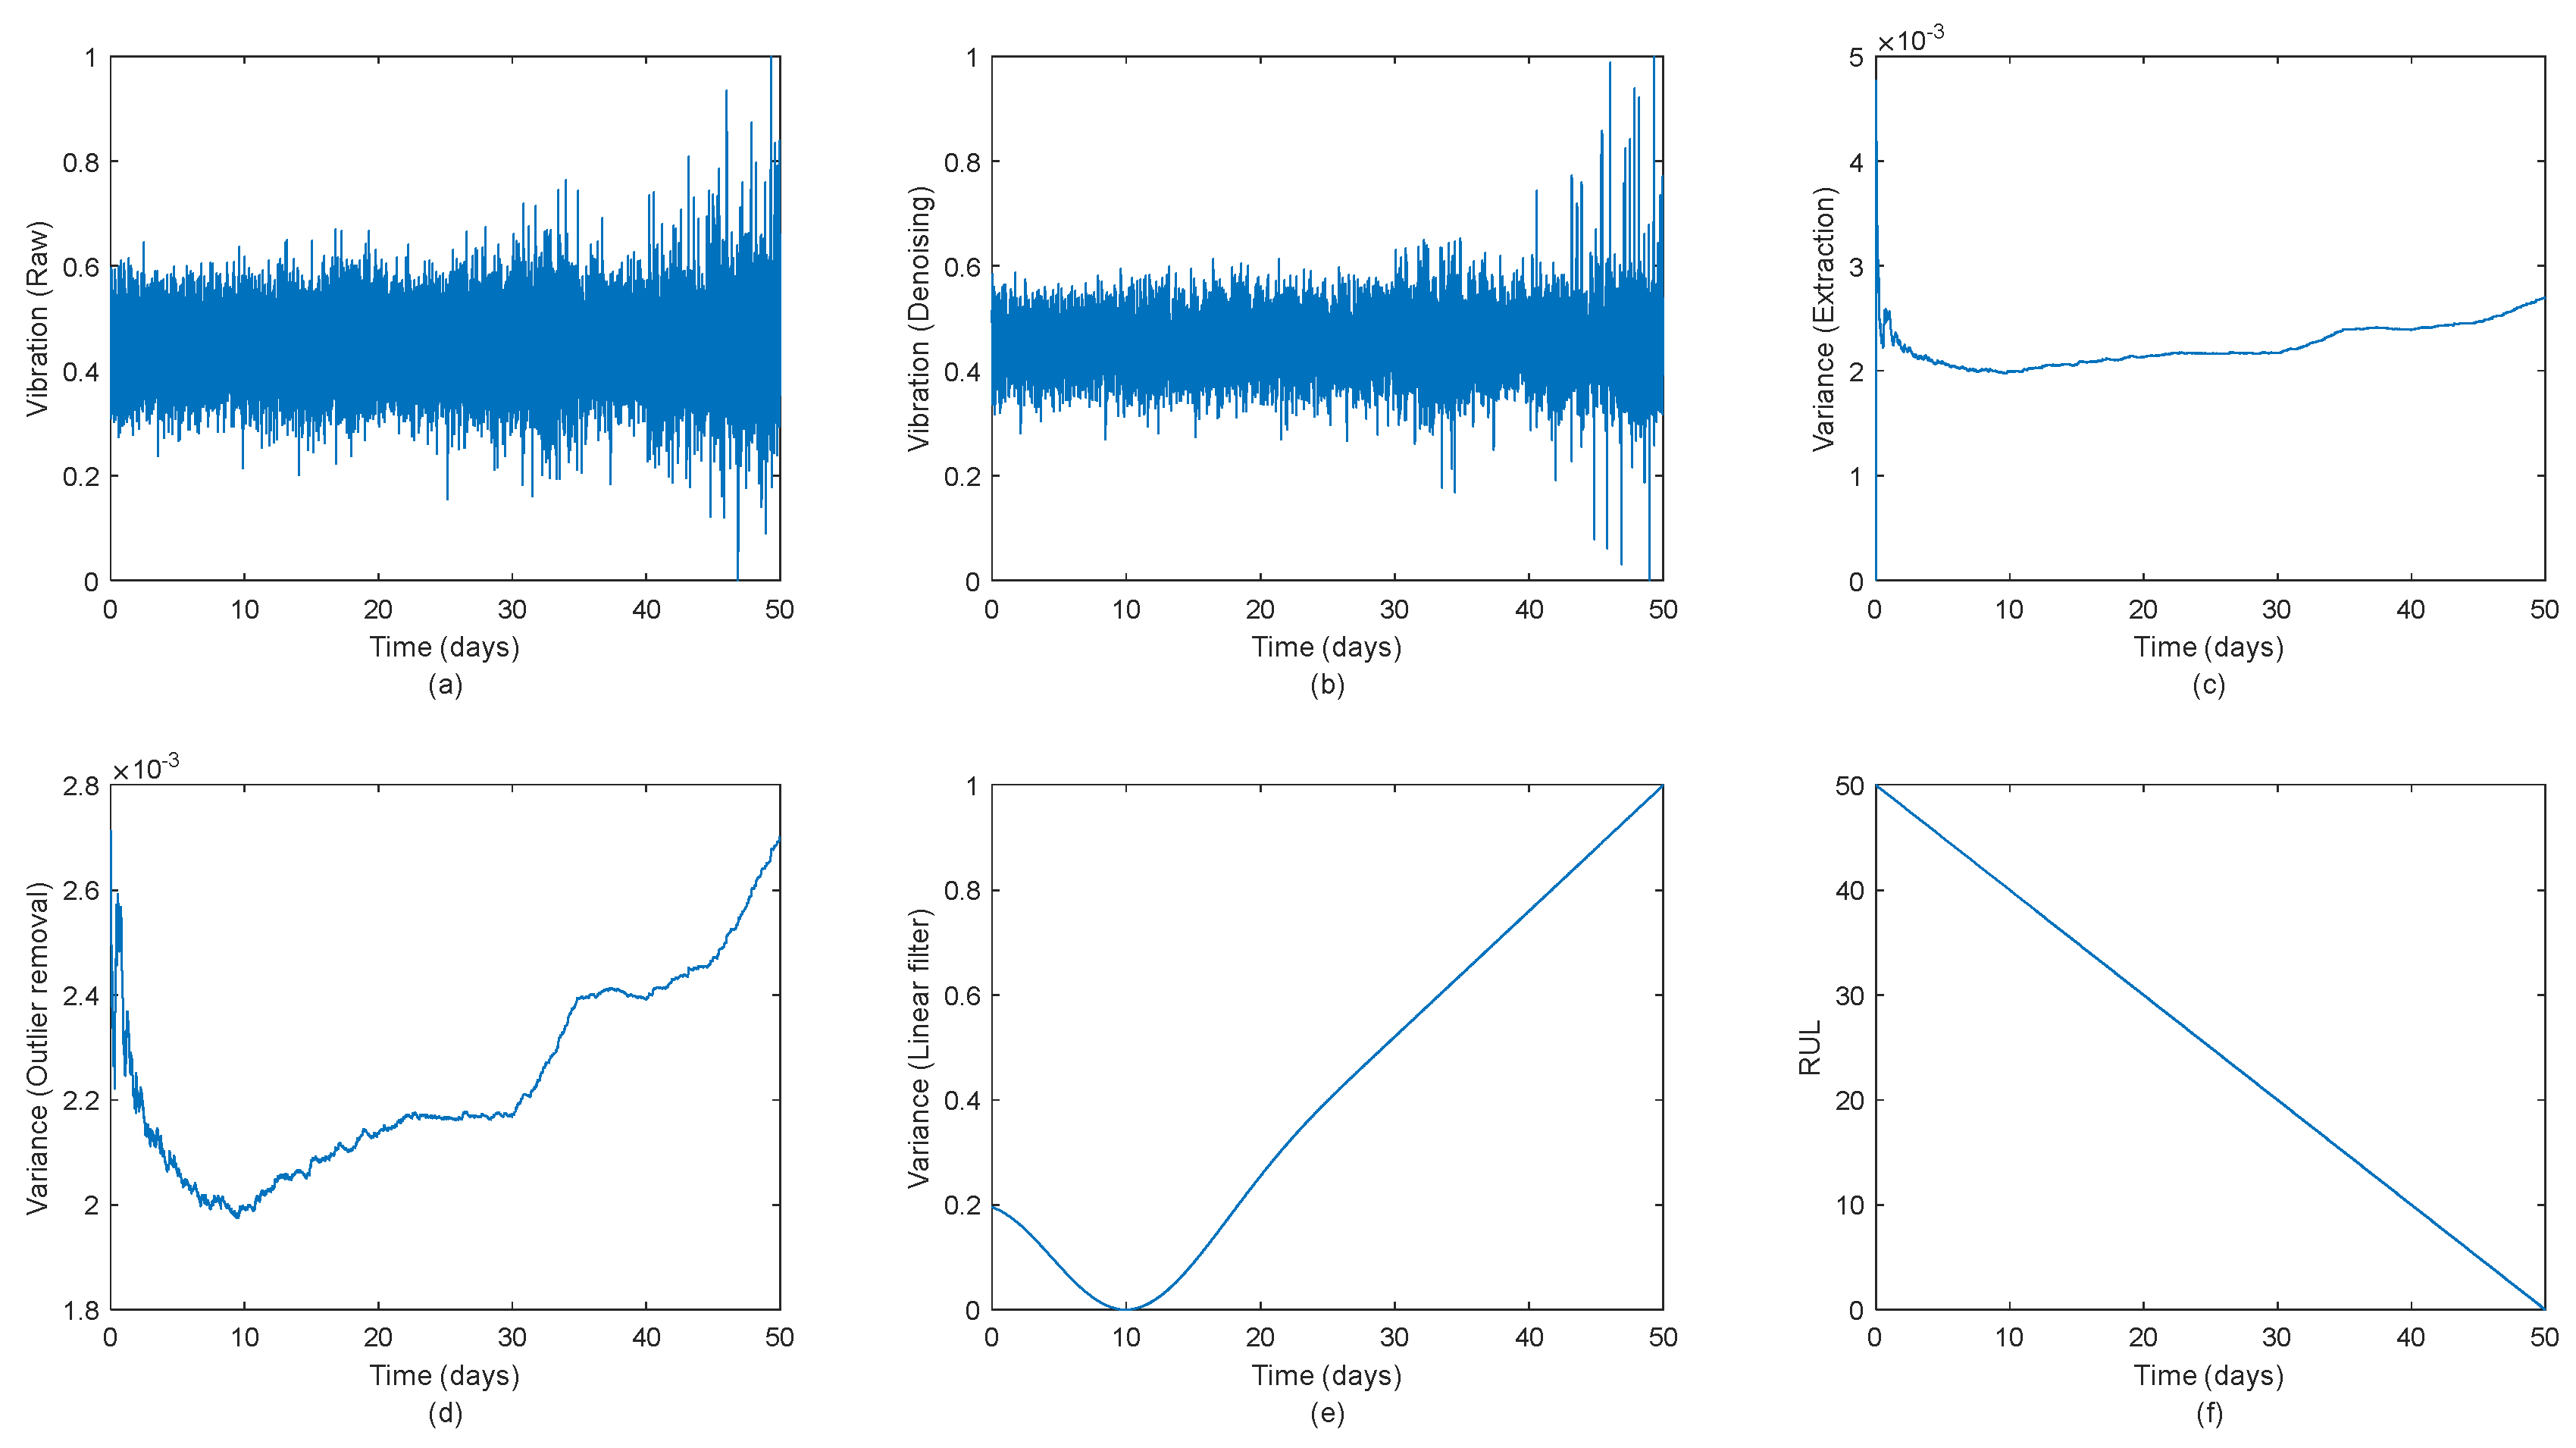
Figure 1. Wind turbine high-speed shaft dataset and processing: (a) raw dataset; (be) processing steps; (f) RUL labels.
Engproc 82 00047 g001
Figure 2. Results obtained from applying the proposed UBO-ELM approach: (a,b) Training and testing curve fit with an 80%–20% split ratio; (c) Confidence interval (CI) for a 99% confidence level for the testing set; (d,e) Error metrics results along with the coefficient of determination for training and testing, respectively; (f) CI features showcasing stability and coverage probability.
Engproc 82 00047 g002
Disclaimer/Publisher’s Note: The statements, opinions and data contained in all publications are solely those of the individual author(s) and contributor(s) and not of MDPI and/or the editor(s). MDPI and/or the editor(s) disclaim responsibility for any injury to people or property resulting from any ideas, methods, instructions or products referred to in the content.