1. Introduction
Localization of a person or object of interest is a critical problem in many applications and involves the accurate determination of an object’s position in space. Precise localization is essential for indoor autonomous systems, in-house navigation, and location-based services, where incorrect positioning can lead to safety issues or inefficiencies. The rapid increase in IoT devices has heightened the need for effective localization methods, as these devices often interact in complex environments. Radiowave sensing offers significant advantages for aided localization, as it can penetrate obstacles, perform well in low-light or harsh weather conditions, and provide real-time data, enhancing the accuracy and robustness of location-based systems. In non-active object device-free localization (DFL) [
1], it is possible to track or detect the presence and movement of a person or object without requiring them to carry or wear any electronic devices. Instead, DFL leverages radio frequency (RF) waves to monitor disruptions or changes in the signal caused by the object or person’s presence. This approach is highly relevant in scenarios where it may not be feasible or convenient to equip individuals with tracking devices, such as in healthcare, security, and smart home environments. DFL is particularly useful for enhancing privacy, reducing user dependency on devices, and enabling continuous monitoring in a non-intrusive manner.
This system typically relies on a network of static nodes strategically placed within an environment, which communicate to gather pairwise channel information, such as the signal strength or the time of flight between nodes. The accuracy of the localization system heavily depends on the degree of information available from these nodes. When more detailed channel information is accessible, such as phase or multiple signal paths, the system can employ more sophisticated models that enhance precision for localization. Conversely, with limited data, simpler models may be used, often at the expense of accuracy, but with the advantage of low-cost devices.
Different types of measurements provide varying levels of information. Ultrawideband (UWB) receivers can measure the amplitudes, time delays, and phases of multipath signals, offering detailed insights into both the static properties of the propagation environment and any changes that may signal the presence or movement of a person or object. These rich data allow for precise tracking and environment mapping. In contrast, narrowband receivers cannot distinguish individual multipaths and only provide aggregate signal magnitude and phase information, making them less capable of capturing detailed environmental changes or object movements compared to UWB systems. Received Signal Strength (RSS) information is a magnitude-only measurement that limits the ability to pinpoint a person’s location with high accuracy. However, the simplicity and low cost of RSS-based narrowband radios allow for more nodes to be deployed within a given budget, which can improve overall localization performance through higher network density. Additional signal metrics, such as polarization, can also provide further information about the environment or objects within it, enhancing localization accuracy in specific scenarios, although these metrics are less commonly used than traditional measurements like amplitude and phase [
2]. For indoor localization, RSS-aided systems have been explored in several works, such as [
1,
3], where the RSS metric at 2.4 GHz was utilized for position estimation. Sub-1 GHz bands have also been used in indoor environments, as demonstrated in [
4], where the authors adopted methods to mitigate errors caused by the multipath effect. They also implemented techniques to automatically recalibrate training data, ensuring accuracy is maintained as the environment evolves. The tests were conducted in the 433.1 MHz and 909.1 MHz bands.
Another approach leverages the noise resilience of deep learning methods, as seen in [
5], where the authors designed a sparse autoencoder network to automatically learn discriminative features from wireless signals. Although stochastic modeling continues to be a preferred approach for RSS-based localization methods, as seen in [
6], model refinement can be achieved through field measurements in various environments. In this context, the present work introduces a measurement campaign for RSS data between ZigBee devices in an indoor location (classroom). Several results are analyzed and the characteristics of the setup environment are presented.
2. Measurement Setup
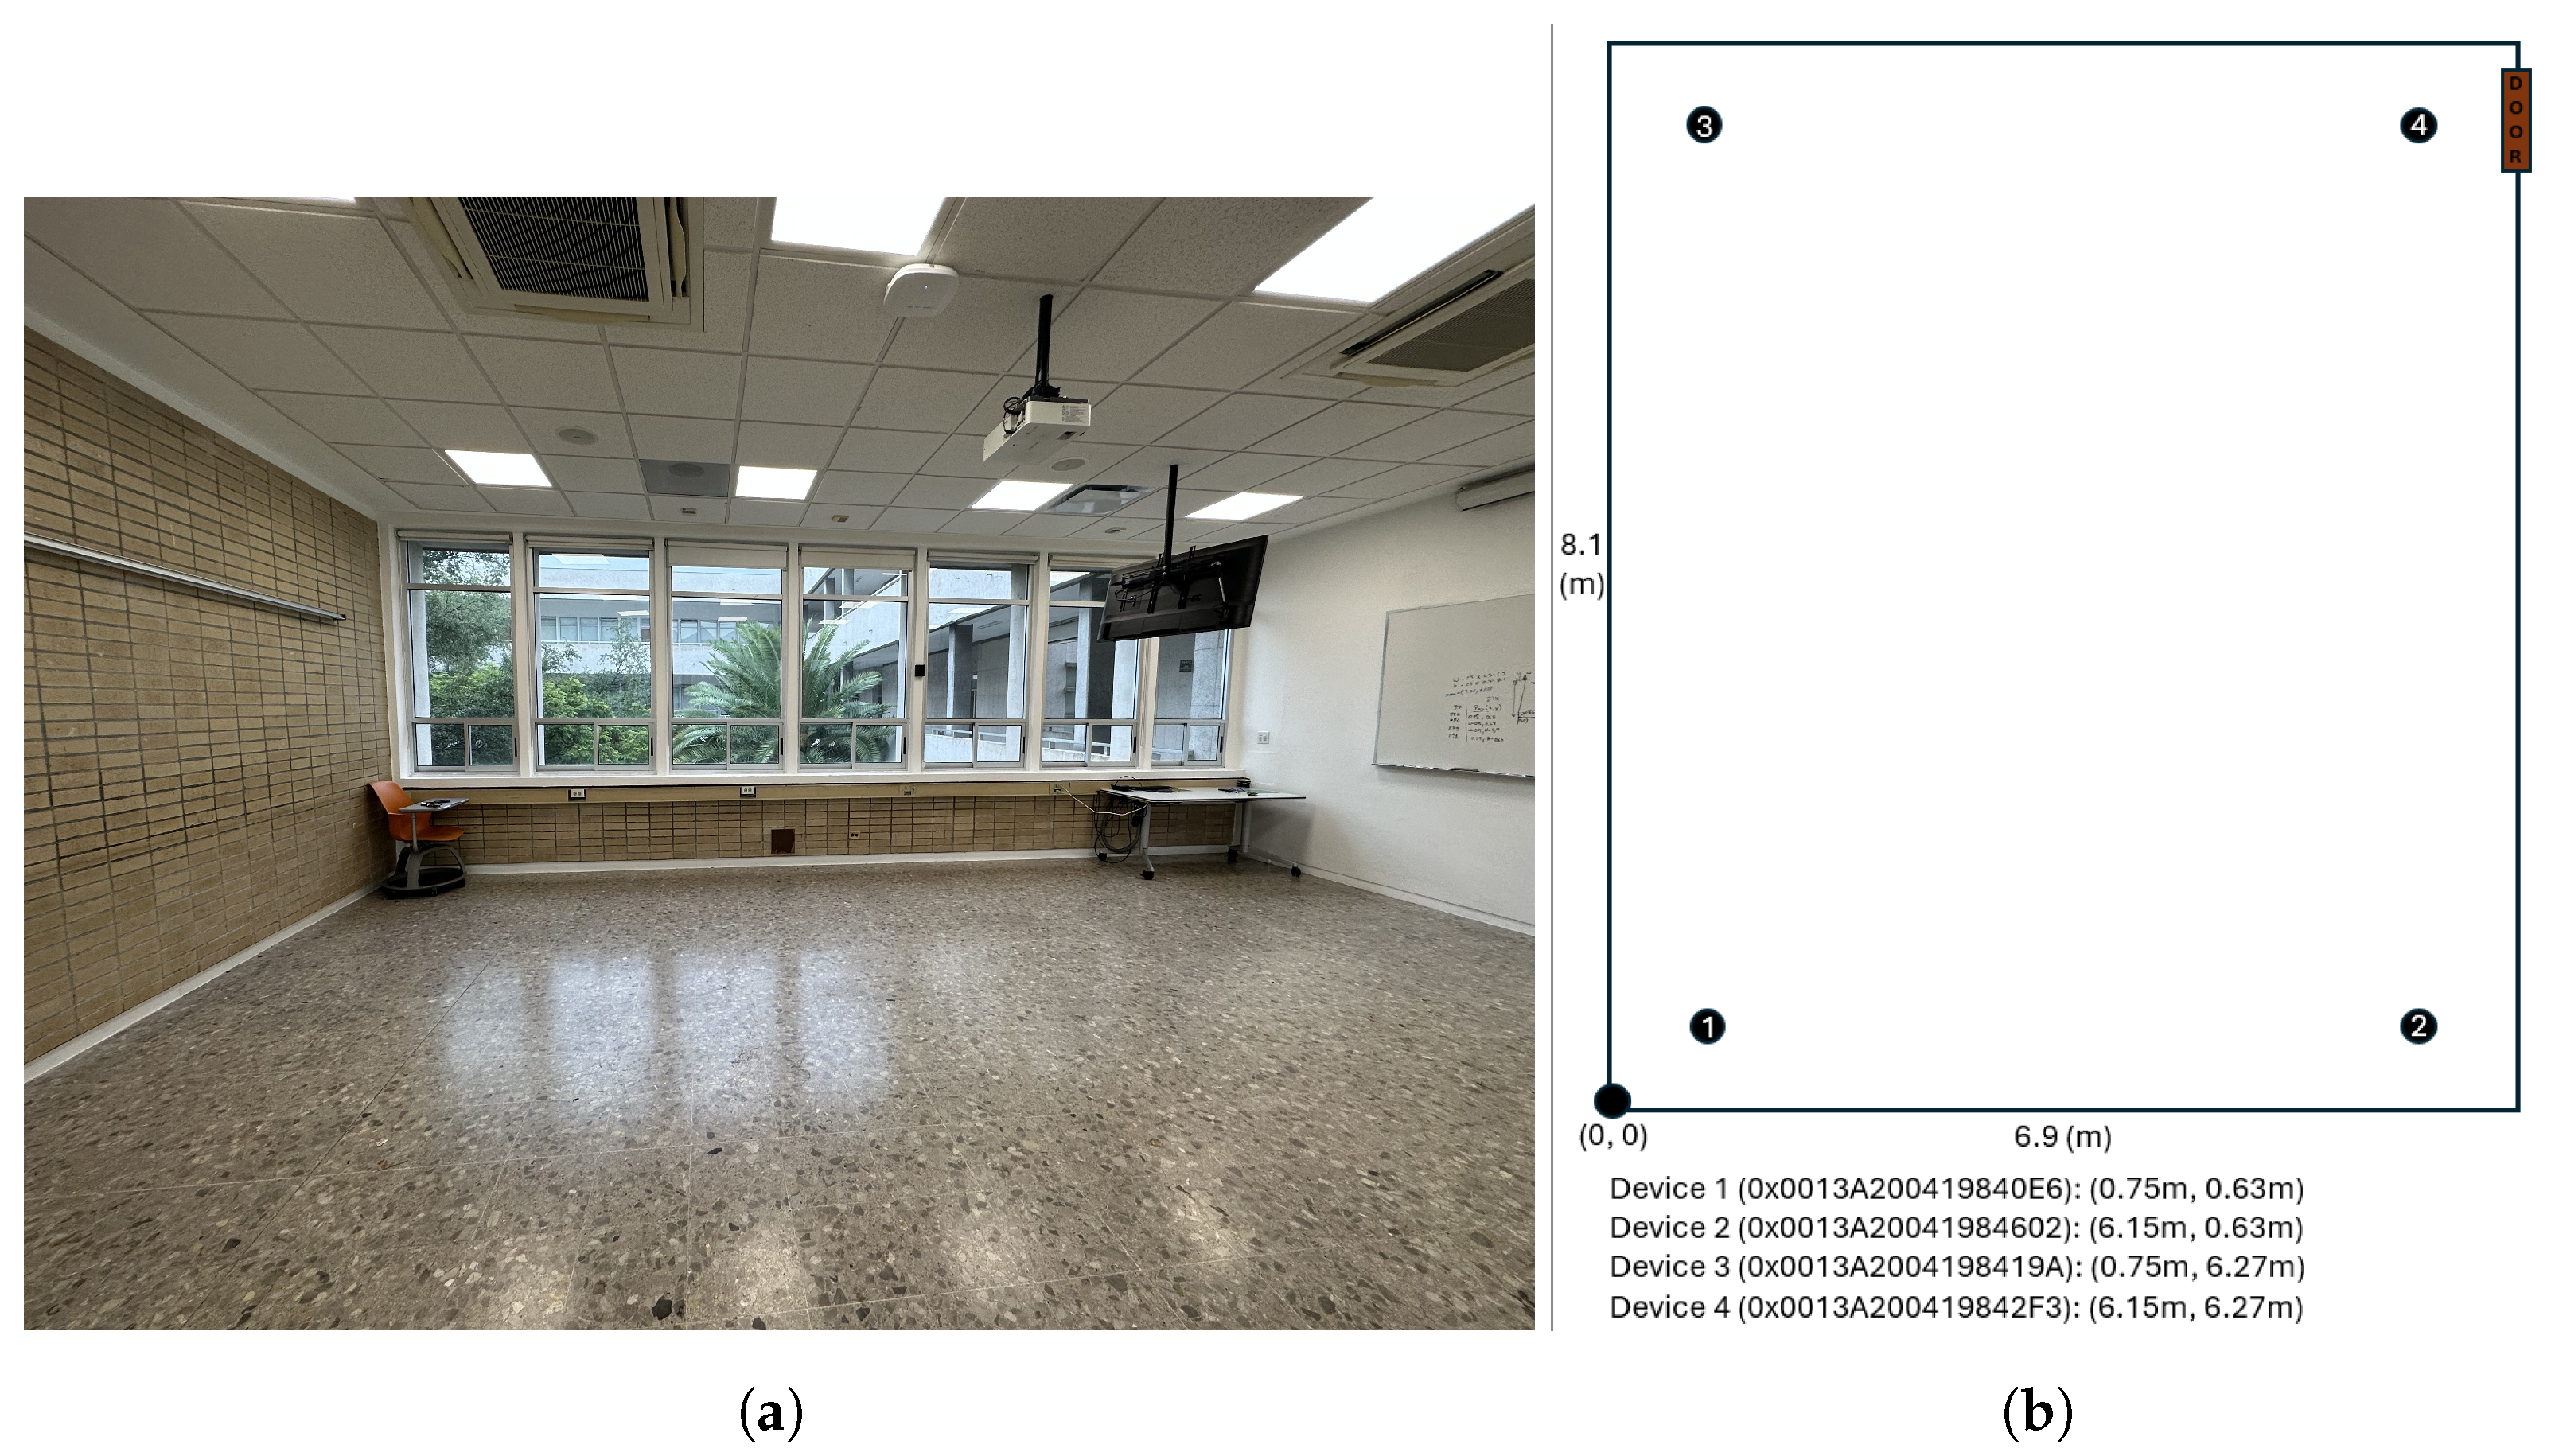
The measurement setup was conducted in an indoor environment, specifically a classroom at Tecnologico de Monterrey. The setup involved five Arduino Mega devices, each equipped with a shield and a Digi XBee 3 module. These ZigBee devices operate at a frequency of 2.4 GHz with a transmitting power of 8 dBm. The chosen classroom environment allowed for controlled experimentation of RSS-based channel information. An image of the classroom environment can be seen in
Figure 1.
The devices used for channel estimation consisted of four units, each placed on top of plastic chairs in the corners of the room. All four devices are battery-powered and connected to the same ZigBee network, operating in a router role. This setup allowed for consistent channel measurements across the room, ensuring that the devices maintained a reliable connection for data collection while eliminating the need for wired power sources. Outside the room, a fifth ZigBee device acted as the network coordinator and served as the receiver for all pairwise channel RSS information. This device was connected to a laptop, and when commanded, it initiated the collection process. Each of the four devices inside the room gathered RSS information from its peers and retransmitted it to the coordinator. The coordinator then acquired the complete vector of RSS values from all devices and timestamped the data upon receipt, ensuring accurate and synchronized measurements across the network.
3. Discussion and Results
The tests were conducted across four different scenarios. First, a baseline for the channel was established by gathering RSS information over approximately five minutes in an empty room. In the second scenario, a test was performed with five people standing still in the center of the room. Two additional tests involved walking in a circular path around the room, starting near node 4. These walks were conducted at different speeds to collect data relevant to the rate of change in RSS values as the object moved.
Figure 2 shows the RSS information for each node vs. the others as the baseline test.
The baseline measurements for all devices in
Figure 2 showed RSS values ranging from a maximum of −48 dBm to −59.15 dBm, with very low variance across all cases. The maximum observed variance was 0.25 dBm, reflecting the stability of the signal in an empty room with no moving objects.
As shown in
Figure 3, in this scenario, five people were standing still in the middle of the room. The channel between the crossing nodes was significantly affected, with a mean RSS of −73.99 dBm from node 2 to node 3 and −61.82 dBm from node 1 to node 4. The variances also increased, with a maximum observed variance of 10.63 dBm, specifically in the channel between node 3 and node 2.
In the case of one person walking, the channel was specifically affected, as shown in
Figure 4. The starting point was near node 4, and, consequently, the channel between node 4 and node 1 was the first to be impacted, with a drop in RSS to 79 dBm. As time progressed, the other channels were also affected in line with the path of the movement. Both the mean values and variances were affected along the object’s path, with the variance rising to a maximum of 53.95 dBm in the worst case.
Regarding speed estimation, this metric is highly dependent on the precision of the tracking algorithm employed. Since the information received by the coordinator outside the room was in vector form, providing the complete pairwise RSS data, a compact method for tracking the object’s speed without estimating position changes could use the p-norm characterization of the received vector as complementary information. In this context,
Figure 5 presents the p-norm of the received vector for three scenarios: the baseline, a person walking in the room, and the same walking path at a higher speed after a few seconds into the track.
As seen in
Figure 5, there was a correlation in the p-norm pattern for the same walking path, with a time compression when the object moved at a higher speed. This representation can help fine-tune algorithms for speed determination as an aggregate result. A summary of the results regarding the mean RSSI in dBm and the variance per link can be found in
Table 1.


