Abstract
The paper presents an accelerometer-based system that can be implemented in a passenger car to estimate water depths on a road surface. Tests conducted on various road surfaces at different vehicle speeds allow the determination of an appropriate location of the accelerometers and define a relevant filtering of the recorded signals. Results show that the system can relate acceleration amplitudes to water depths lower than 0.5 mm. The potential use of the system to warn drivers under adverse weather conditions, especially when skid resistance drops during and after a precipitation, is presented and discussed.
1. Introduction
Skid resistance represents the contribution of road surfaces to the tire/road friction, which allows drivers to control their vehicles. A low skid resistance can induce accidents (lane departure, collisions) [1]. Among the factors that can reduce skid resistance, water is one of the most important. Previous works showed that the coefficient of friction decreases as the water depth on the road surface increases [2,3]. In [2], it was found that, beyond a critical water depth (around 0.2 mm), the reduction in skid resistance can be rapid.
Knowledge of the water depth on a road surface is then imperative to driver safety. Many attempts have been made on the development of a reduced-cost system that can be mounted on passenger cars to estimate water depths. The starting point of these works is the vibration of a car’s wheel arch due to water spray. By disposing accelerometers [4,5] or capacitive transducers [6], on the backside of a wheel arch, it is possible to detect water depths from less than 0.5 mm [4,6] to 2 cm [5]. Riahi developed an accelerometer-based system and, from experiments conducted on a trailer equipped with a passenger car’s tire [7], proved that it is possible not only to detect the presence of water, but also to estimate its thickness.
This paper constitutes the continuity of Riahi’s work, by transposing the developed system to a real passenger car. In the following sections, experiments (sensors, test setup and test program) are first described. Results are then presented and discussed.
2. Methodology
As stated in [2], the rapid drop in skid resistance is observed for low water depths (around 0.2 mm). Therefore, the developed system is focused on the estimation of water depths lower than 1 mm. Four types of water flow result from a tire rolling on a wet road [8] (Figure 1): frontal splash, torrent spray, circumferential spray and side splash. As indicated in [9], the torrent and circumferential sprays reflect the presence of low water depths. The first step, then, is to measure vibrations caused by torrent and circumferential sprays. The second step is to develop a signal processing method to remove noise from accelerometric signals induced by car vibrations or road surface irregularities.
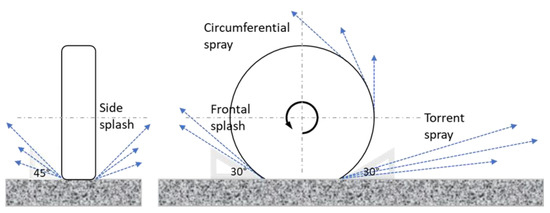
Figure 1.
Flows generated by the ejection of water from the tire–road contact area ((left) front view of the tire; (right) side view of the tire; the direction is from the right to the left).
3. Experiments
3.1. Sensors
3.1.1. Accelerometers
Brüel & Kjær piezoelectric accelerometers (type 4507) are positioned on the back side of the right front wheel arch. To define an appropriate location for the accelerometers, four positions are tested (Figure 2a): at the wheel arch’s bottom (defined as 0° position) and at 36°, 52° and 90°, respectively (it is not possible to position accelerometers A2 and A3 at 30° and 60°, respectively, due to the shape of the wheel arch). Measurements are performed with a sampling rate of 38 kHz, using a HBM data acquisition system.

Figure 2.
Sensors used for the experiments: (a) position of the accelerometers on the front wheel arch (A1 to A4 represent the accelerometers); (b) Aquasens sensor mounted on the test car.
3.1.2. Optical Sensor to Measure Water Depths
The so-called Aquasens sensor [10] produces a white light source which illuminates the road surface. The reflected light, altered by the presence of water on the road surface, is analyzed to determine the water depth. The sensor is mounted on the front of the test car (Figure 2b, red circle) at 50 cm above the ground, with an inclination angle of 45°. The measurement area is located 1.5 m in front of the axis of the wheel.
3.2. Test Tracks
Two surfaces are tested (Figure 3a): “low texture” (C1, left) and “high texture” (E1, right) surfaces with a mean texture depth (MTD) of 0.38 mm and 0.95 mm, respectively. The test track contains a rotating irrigation system to simulate a wet road (Figure 3b). Tests were performed at dry and wet conditions. Six test speeds (20, 30, 40, 50, 60 and 70 km/h) were conducted. Each test configuration was repeated three times.
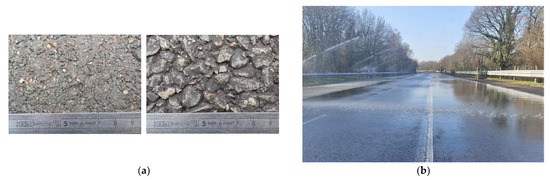
Figure 3.
Test tracks: (a) test surfaces; (b) wetting system.
4. Results
Signal Processing
Comparisons of dry and wet power spectral densities (PSDs) (Figure 4a) show that the system can detect the presence of water. The difference (wet/dry) is pronounced for frequencies between 2.6 and 6.5 kHz (grey zone in Figure 4b).
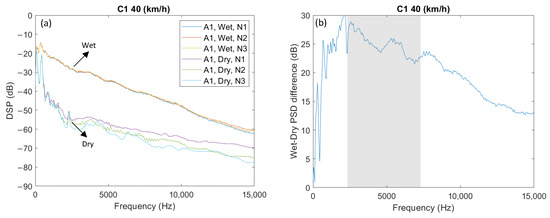
Figure 4.
Power spectral density (PSD) of the recorded signals on C1 surface at 40 km/h: (a) comparison of dry vs. wet (N1 to 3 are the repeated runs); (b) difference between PSD (wet) and PSD (dry).
A Chebyshev filter is used with a passing band of 2–7 kHz to filter the raw signals. The best relationship between acceleration amplitudes and water depths is obtained with accelerometer A1 for speeds higher than 40 km/h (Figure 5). This result is promising, because wetness detection is most needed for high speeds. The water depth, and the corresponding acceleration amplitude, decrease when the macrotexture (MTD) increases. This result would be expected, because there is less accumulated water on high-MTD surfaces and, hence, less water spray.
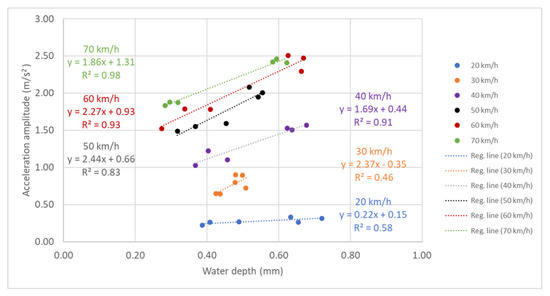
Figure 5.
Relationship of acceleration amplitude to water depth (results from accelerometer A1).
5. Conclusions
Tests conducted on a passenger car (Clio 3) show that accelerometers can be positioned on the backside of the front wheel arch to record vibrations induced by water spray, and relate the acceleration amplitude to the water depth on the pavement. This finding opens the possibility of estimating wet friction and using this information for driver assistance (or, more generally, for autonomous driving) or road maintenance (detection of local slippery areas).
Author Contributions
Conceptualization, M.-T.D. and E.R.; methodology, E.R. and S.B.; formal analysis, E.R. and W.E.; writing—original draft preparation, M.-T.D. and E.R.; writing—review and editing, M.G. and V.C. All authors have read and agreed to the published version of the manuscript.
Funding
This study was performed in the framework of the ENA project (Autonomous Shuttle Experiments) financed by the French Government as part of the Future Investments Program now integrated into France 2030, and operated by the Environment and Energy Management Agency—ADEME. Project labeled by CARA European Cluster for Mobility Solutions.
Institutional Review Board Statement
Not applicable.
Informed Consent Statement
Not applicable.
Data Availability Statement
Data presented in this study are available on request from the first author. The data are not publicly available due to a confidentiality agreement within the framework of the ENA project.
Conflicts of Interest
The authors declare no conflict of interest.
References
- McCarthy, R.; Flintsch, G.; de Leon Izeppi, E. Impact of skid resistance on dry and wet weather crashes. J. Transp. Eng. Part B Pavements 2021, 147, 04021029. [Google Scholar] [CrossRef]
- Do, M.-T.; Cerezo, V.; Beautru, Y.; Kane, M. Modeling of the connection road surface microtexture/water depth/friction. Wear 2013, 302, 1426–1435. [Google Scholar] [CrossRef]
- Yu, M.; You, Z.; Wu, G.; Kong, L.; Liu, C.; Gao, J. Measurement and modeling of skid resistance of asphalt pavement: A review. Constr. Build. Mater. 2020, 260, 119878. [Google Scholar] [CrossRef]
- Prevost, D.; Cerezo, V.; Do, M.T.; Chabanon, C. On-board estimation of water depth using low-cost sensors. In Proceedings of the SURF 2012 (7th Symposium on Pavement Surface Characteristics), Norfolk, VA, USA, 19–22 September 2012. [Google Scholar]
- Schmiedel, B.; Gauterin, F.; Unrau, H.-J. Road wetness quantification via tyre spray. Proc. Inst. Mech. Eng. Part D J. Automob. Eng. 2018, 233, 28–37. [Google Scholar] [CrossRef]
- Döring, J.; Beering, A.; Scholtyssek, J.; Krieger, K.-L. Road Surface Wetness Quantification Using a Capacitive Sensor System. IEEE Access 2021, 9, 145498–145512. [Google Scholar] [CrossRef]
- Riahi, E.; Edjeou, W.; Buisson, S.; Gennesseaux, M.; Do, M.-T. Estimation of water depth on road surfaces using accelerometric signals. Sensors 2022, 22, 8940. [Google Scholar] [CrossRef] [PubMed]
- Weir, D.H.; Strange, J.F.; Heffley, R.K. Reduction of Adverse Aerodynamic Effects of Large Trucks; Report FHWA-RD-79-84; Federal Highway Administration: Washington, DC, USA, 1978.
- Schmiedel, B.; Gauterin, F. Tire Splash and Spray Directly before and during Hydroplaning. Tire Sci. Technol. 2019, 47, 141–159. [Google Scholar] [CrossRef]
- Holzwarth, F.; Eichhorn, U. Non-contact sensors for road conditions. Sens. Actuators A Phys. 1993, 37–38, 121–127. [Google Scholar] [CrossRef]

Disclaimer/Publisher’s Note: The statements, opinions and data contained in all publications are solely those of the individual author(s) and contributor(s) and not of MDPI and/or the editor(s). MDPI and/or the editor(s) disclaim responsibility for any injury to people or property resulting from any ideas, methods, instructions or products referred to in the content. |
© 2023 by the authors. Licensee MDPI, Basel, Switzerland. This article is an open access article distributed under the terms and conditions of the Creative Commons Attribution (CC BY) license (https://creativecommons.org/licenses/by/4.0/).