Abstract
The power sector is a major contributor to anthropogenic global warming and is responsible for 38% of total energy-related carbon dioxide emissions and 66% of carbon dioxide emission growth in 2018. In OECD member countries, the residential sector consumes a significant amount of electrical energy, with household refrigerating appliances alone accounting for 30–40% of the total consumption. To analyze the energy use of each domestic appliance, researchers have developed Appliance-Level Energy Characterization (ALEC), a set of techniques that provide insights into individual energy consumption patterns. This study proposes a novel methodology that utilizes robust probability density estimation to detect refrigerators with high energy consumption and recommend tailored energy-saving measures. The methodology considers two consumption features: base energy consumption (energy usage without human interaction) and relative energy consumption (energy usage influenced by human interaction). To assess the approach’s effectiveness, the methodology was tested on a dataset of 30 different appliances from monitored homes, yielding positive results that support the robustness of the proposed method.
1. Introduction
The power sector is responsible for 38% of total energy-related carbon dioxide emissions and 66% of carbon dioxide emission growth in 2018, making it the main cause of anthropogenic global warming according to [1]. The residential sector is the largest consumer of electricity, accounting for 30–40% of total consumption in OECD member countries [2]. Thus, it is unsurprising that the United Nations’ Sustainable Development Goal 12 aims to promote sustainable consumption and production patterns to reduce humanity’s impact on the environment [3].
One of the means to pursue that objective is Appliance-Level Energy Characterization (ALEC). ALEC is the technique used for the analysis of consumers’ energy use for each domestic appliance [4]. This analysis can be used to provide feedback and energy-saving recommendations to users, which, if provided after energy consumption, can have an impact ranging from 3.8% to 8.4% of energy savings [4].
There are two main ways to provide ALEC: Intrusive Load Monitoring (ILM) and Non-Intrusive Load Monitoring (NILM). Although ILM provides highly accurate results [5], its adoption is limited due to the high cost and difficulty of installing and maintaining individual sensors for each target appliance [6]. To overcome these challenges, NILM uses intelligent techniques to disaggregate data collected from a single sensor, eliminating the need for individual sensors [7].
This paper focuses on household refrigerating appliances, which include refrigerators (fridges), freezers, or a combination of both. These appliances are responsible for an average of 13.4% of the electrical energy consumption of private households in OECD countries, according to [8].
One effective strategy for promoting energy efficiency in household refrigerating appliances is energy labeling. Typically, energy labels use a rating system that ranges from A+++ (very efficient) to G (least efficient). These labels provide essential information, such as the appliance’s energy consumption, annual energy cost, and other relevant energy-related data. As a result, consumers can easily compare the energy efficiency of different models of refrigerators and select the most efficient one that meets their needs. By choosing the most efficient model, significant energy savings can be achieved over the lifetime of the appliance. For instance, in the UK, energy labeling has resulted in a 26% reduction in consumption per refrigerator within ten years [9]. However, it is worth considering the age of the product, as research shows that 16-year-old fridges experience, on average, a 27% increase in energy consumption, with the cabinet’s thermal resistance being one of the most significant factors contributing to the degradation of efficiency [10,11].
Consumer behavior also plays a significant role in the energy consumption of household refrigerating appliances. For instance, a decrease in temperature by one degree Celsius can cause the energy consumption of a refrigerator to rise by 7.8% [12], and excessive daily openings can further increase it by 10% [13].
Consumption habits of household refrigerating appliances can be classified into two categories: Direct Using Behavior (DUB) and Indirect Using Behavior (IUB). DUB refers to the actions of consumers that directly interact with the appliances, such as opening the door, while IUB pertains to external factors that impact the appliances, such as their installation location [14].
According to a recent study, a commonly used refrigeration appliance’s DUB accounts for over 13.5% of its total energy consumption within a year. However, the study found that the IUB had a greater impact on energy consumption. Specifically, the ambient operating temperature in consumer homes was responsible for an average of approximately 18.5% of the appliance’s total energy consumption [14].
This study is a crucial component of the RC4ALL project, which aims to provide energy-saving techniques for households by closely monitoring particular appliances in a carefully selected group of homes. The insights and information gleaned from these monitored households will then be utilized to provide personalized recommendations to other households throughout Spain. This study focuses on identifying refrigerators that consume more energy than necessary and can benefit from automated energy-saving recommendations. The study proposes a new method based on robust probability density estimation to select these refrigerators. The selected refrigerators will then receive customized recommendations to reduce their energy usage. The RC4ALL project is a collaboration between Comillas University and Endesa and is being funded by the Ministry of Science and Innovation (MCI) and the State Research Agency (AEI) [15].
The rest of the paper is organized as follows: Section 2 describes the dataset, and Section 3 presents the proposed methodology for the selection of fridges to be notified about with significant recommendations in order to reduce their energy consumption. A case example is presented in Section 4, while conclusions and future work are in Section 5.
2. Fridge Dataset Analysis
We have collected historical energy consumption data from various home appliances at five-minute intervals. We aim to use this information to provide energy-saving recommendations tailored to fridges that need it. Due to clients’ installation limitations, most of the fridges’ data became fully available in November 2022. For that reason, we only include energy usage recorded between 1 November 2022, and 1 February 2023 in this study. To prepare the dataset, we filtered out those fridges that had less than 60 consumption days in that time period. Consequently, in this section, we analyze the resulting 30 fridges’ consumption history. Note that we do not have additional information about the fridges, such as the energy label, their size, or their age.
2.1. Operating Cycle Analysis
The frequency and value of a fridge’s operating cycles are among the primary metrics that characterize it [10]. Fridges operate intermittently and are only turned on when necessary, i.e., when the temperature inside rises above a threshold. The first step in analyzing fridges is to count the number of cycles each fridge has per unit of time and compare it to others. To achieve this, we counted the number of cycles for each fridge by tracking the times per day that the energy consumption increased from below average to above average. As depicted in Figure 1, the sampled fridges had an average of approximately 20 cycles per day, with a maximum of fewer than 60 cycles. The box plots also indicate that some fridges, such as Fridges 9 and 10, had a significant variation in cycle counts, while others, such as Fridge 11, remained stable; bear in mind that no data cleansing has been carried out.
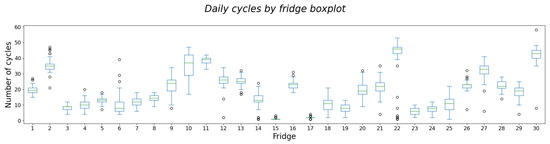
Figure 1.
Boxplot of daily cycles per fridge.
2.2. Interval Analysis
To compare fridges’ energy consumption, we created consumption profiles for each day by dividing them into 3 h intervals, as can be seen in Figure 2, which would include at least one cycle per interval for all fridges.
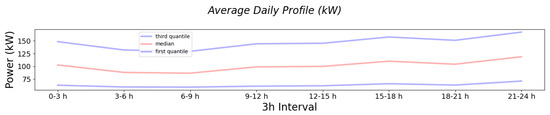
Figure 2.
Average daily profile of all fridges.
To estimate the fridge energy consumption without human interaction, we selected the interval with the lowest consumption, which we called the base consumption. This approach allows for a fair comparison of energy consumption between different fridges without considering differences in user behavior. We applied a 7-day Centered Moving Average [16] to soften the impact of possible outliers and improve the base consumption estimation. Figure 3 illustrates the benefits of applying the moving average over one of the fridges’ energy consumption time series.
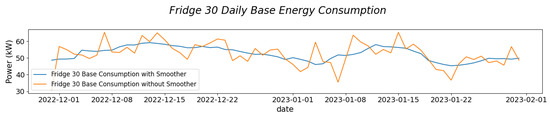
Figure 3.
Illustrative example of the daily base consumption estimation for Fridge 30, with and without the centered moving average smoother.
To normalize the total energy consumption of each fridge, we used the daily base consumption as a daily reference. This enabled us to calculate the relative consumption of each fridge as a percentage of base consumption, allowing us to study energy consumption due to human interaction. Figure 4 illustrates the first percentile, median, and third percentile consumption for all fridges in 3 h intervals in terms of relative consumption. It is evident from the relative energy consumption that, on average, most fridges have a lower energy consumption in the morning between 3 AM and 9 AM, gradually increasing as it approaches the evening. This pattern can be attributed to higher ambient temperatures and more frequent door openings during the daytime hours.
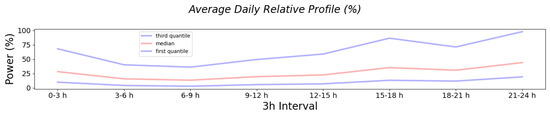
Figure 4.
Average daily relative profile of all fridges.
Figure 5 displays the consumption of all 30 fridges in terms of total consumption, base consumption, and relative consumption. There are some crucial observations to note. Firstly, the base consumption for each fridge is relatively stable, with a slightly decreasing trend due to lower temperatures in January than in December. Secondly, relative consumption provides a more realistic comparison between fridges’ daily consumption fluctuations than absolute consumption values.
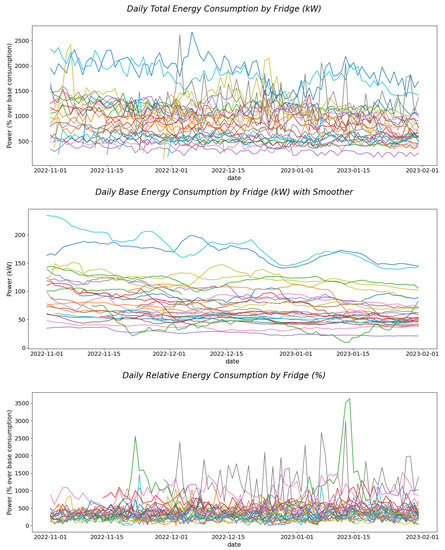
Figure 5.
Daily total, base, and relative consumption of each fridge, represented by different colors.
2.3. Variance Analysis
Analysis of Variance (ANOVA) is a widely used statistical method in research [17]. It partitions the observed variance of a variable into components that can be attributed to different groups, providing a measure of confidence in the influence of a particular factor on the resulting variable [18]. In this study, we employed one-way ANOVA with an F-test to assess the degree of influence of the hour interval, day of the week (dow), and month of the year on the resulting relative consumption of each fridge, including their interactions.
As shown in Table 1, the factors of month and interval had, on average, a statistically significant impact on the energy consumption for most fridges (p-value < 0.1), while the day of the week factor and interaction pairs did not. Based on these results, we will primarily use consumption at each three-hour interval to characterize the daily consumption of fridges, as the day of the week is not significant and we only have records for three months out of the year.

Table 1.
ANOVA p-value results.
2.4. Clustering Analysis
To gain more insights into the usage patterns of fridges, we utilized an unsupervised machine learning algorithm. Our approach involved analyzing the daily relative energy consumption profiles of individual fridges using the K-means algorithm, with Dynamic Time Warping as the distance metric [19]. To determine the optimal number of clusters, we used the maximum value of the silhouette as an automated selection approach [20]. The resulting cluster profiles, shown in Figure 6, revealed that while fridges typically exhibit lower energy consumption in the mornings that gradually increases throughout the day, there can be significant variations in usage patterns both within and between fridges.
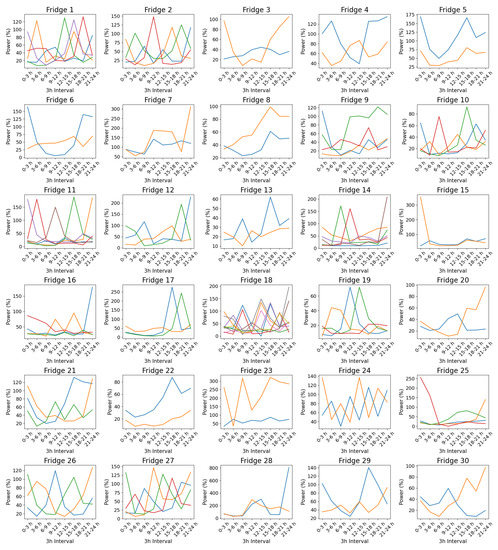
Figure 6.
Cluster profiles of relative energy consumption, represented by different colors.
3. Proposed Methodology
This section describes the proposed methodology for selecting refrigerators exhibiting anomalous or exceedingly high consumption records and the assignment of energy-saving recommendations tailored to their needs. As we can see in Figure 7, our method consists of three phases: the extraction of features, the comparison of fridges based on these features, and the elaboration of energy-saving recommendations based on the comparison.
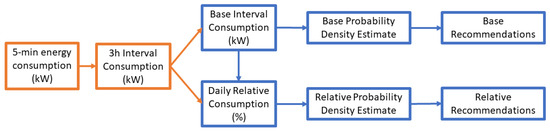
Figure 7.
Schema for the proposed methodology.
3.1. Base and Relative Consumption Features
We will use as features the daily base and relative energy consumption for each fridge. The base consumption will be calculated as the three-hour interval of least consumption, as described in the dataset analysis section. The relative consumption for each day is calculated as a proportion of the total daily consumption over the base consumption. Each fridge will then have a daily time series of base and relative consumption, as can be seen in Figure 8. The base energy consumption represents a fridge’s energy consumption without users’ interaction, while the relative consumption represents the users’ impact on energy consumption.
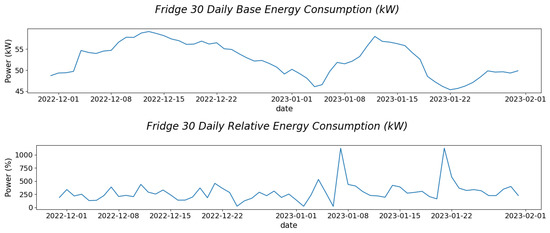
Figure 8.
Base and relative consumption history of a sample fridge.
3.2. Comparison of Fridges Based on Features
After characterizing each fridge by its base and relative consumption time series, we aim to compare it against others. To achieve this, we employ a non-parametric approach that estimates the probability density function of daily energy consumption for each fridge and compares it with that of all other fridges [21]. The probability density values for each day will then be aggregated by fridge using the median statistic and will serve as a metric for how probable each fridge’s consumption is compared to the rest on its base and relative consumption dimensions. Figure 9 presents an example of this approach, where the probability density estimation of energy consumption of Fridge 30 for each day is represented over the others’ distribution and aggregated using the median statistic. The median statistic has been chosen as a measure of central tendency as it is not distorted by outliers or skewed data [22].
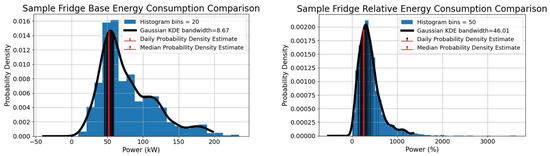
Figure 9.
Base and relative consumption for Fridge 30 over the histogram and estimated probability density function of all fridges except itself.
3.3. Fridge Recommendations Based on Comparison
Fridges will be shown recommendations according to their probability density scores. These recommendations will depend on if they have a low score on base energy consumption probability density or a low score on relative energy consumption probability density. These recommendations will also be accompanied by their percentile of consumption among other fridges and the expected savings if they follow these guidelines.
If a fridge’s median probability density estimation of base energy consumption is low and falls to the right of the distribution, this indicates that the fridge’s energy consumption without human intervention is high compared to the rest.
Alternatively, if a fridge’s median probability density estimation of relative energy consumption is low and falls to the right of the distribution, it indicates that the fridge’s energy consumption is high due to user behavior.
The methodology involves providing energy-saving recommendations tailored to address whether the high energy consumption is due to high base consumption or high relative consumption. Table 2 shows examples of these recommendations, based on established guidelines provided by the Energy Star agency [23] and research studies cited in [24] and [12].
Table 2.
Energy-saving recommendations.
4. Results
In this section, we will apply the proposed methodology to the household refrigerating appliances in our dataset.
First, we calculated the daily base and relative energy consumption for each fridge. The histograms and the probability density functions in Figure 10 show how, once consumption is normalized from total to relative, the distribution of energy consumption is much more transparent and comparable between appliances.
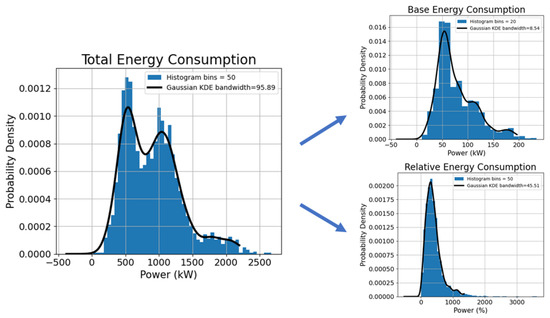
Figure 10.
Energy consumption histogram and estimated probability density function for all fridges.
Following the proposed methodology, we then conducted a comparison of the refrigerators. Firstly, we calculated their daily estimated probability density of base and relative energy consumption against the probability density function estimated from all other fridges. The resulting data were then aggregated by fridge using the median statistic. Figure 11 displays the median probability density estimation for each fridge against the probability density function of all fridges for both base and relative energy consumption.
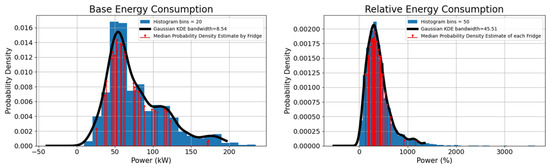
Figure 11.
Base and relative consumption histogram and estimated probability density function of all fridges.
After the application of the probability density method to compare the fridges, we identified those in our dataset that exhibited high consumption and low probability density. Figure 12 displays the fridges selected based on their base energy consumption. Notably, Fridges 1 and 10 had a significantly lower probability density and higher consumption compared to the other fridges, making them stand out. We will therefore show the users of these two fridges the recommendations based on the fridge’s performance without human interaction.
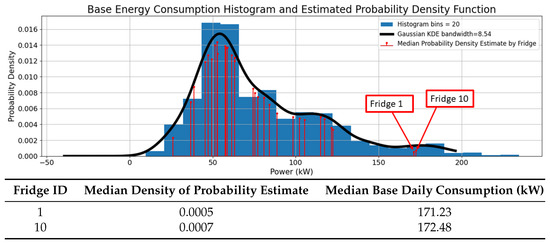
Figure 12.
Fridges selected for base consumption recommendations.
Figure 13 presents the results for relative energy consumption. The probability density estimates revealed that Fridges 7 and 28 consumed energy above the expected levels. We will recommend these fridge users adopt the consumer habits suggested by the experts to reduce their energy consumption.
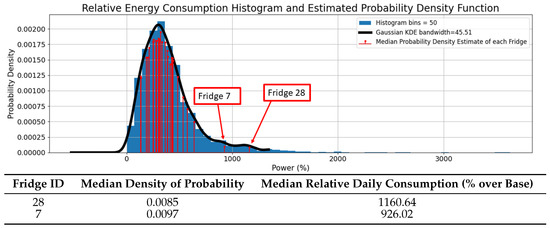
Figure 13.
Fridges selected for relative consumption recommendations.
5. Conclusions and Future Work
We collected energy usage data from 30 household refrigerating appliances between November 2022 and February 2023. Firstly, the data were analyzed to study the frequency of operating cycles. Daily energy profiles were then grouped into 3 h intervals, and the period with the minimum energy consumption was identified as the base consumption. This represents the refrigerator’s energy usage in the absence of human interaction. The relative energy consumption was then calculated as a proportion of base consumption to understand the user’s impact on energy consumption, which showed that energy consumption was on average lower in the morning and higher in the evening, coinciding with usage hours. We then used ANOVA to analyze the impact of different factors on energy consumption, finding that the month and interval had a significant impact, but not the day of the week. Lastly, a K-Means with DTW clustering analysis was performed to identify different energy consumption patterns of each fridge. It revealed that different days can produce varying energy consumption profiles within and between fridges.
We have proposed a novel methodology to identify high-energy-consuming refrigerators and provide personalized energy-saving suggestions using robust probability density estimation. The process includes three stages: feature extraction, comparison of fridges based on features, and providing tailored recommendations. We use daily base and relative energy consumption as features and compare fridges based on probability density estimates. Recommendations are then provided based on a fridge’s position in the distribution of energy consumption and offer guidelines for enhancing energy efficiency.
We tested our methodology on 30 refrigerators. The fridges were compared using their daily energy consumption against the probability density function estimated from all other fridges’ daily base and relative energy consumption. The base energy consumption analysis revealed that Fridges 1 and 10 had a high, improbable consumption while the relative energy consumption analysis did the same for Fridges 7 and 28. The proposed methodology proved to be a reliable method to identify fridges with extreme energy behavior.
In future work, we will continue recording consumption to further improve the dataset volume, as it will enable us to study the effect of seasons on fridges’ energy consumption. We would also like to track the effectiveness of these recommendations in modifying energy-consuming behavior.
Author Contributions
Conceptualization, F.R.-C. and E.F.S.-Ú.; methodology, F.R.-C. and E.F.S.-Ú.; software, F.R.-C.; validation, F.R.-C., E.F.S.-Ú. and V.G.; formal analysis, F.R.-C. and E.F.S.-Ú.; investigation, F.R.-C.; resources, V.G., A.V.S. and A.M.G.; data curation, F.R.-C. and V.G.; writing—original draft preparation, F.R.-C.; writing—review and editing, F.R.-C., E.F.S.-Ú., J.P., A.M., V.G., A.V.S. and A.M.G.; visualization, F.R.-C.; supervision, E.F.S.-Ú.; project administration, E.F.S.-Ú.; funding acquisition, E.F.S.-Ú., J.P., A.M., A.V.S. and A.M.G. All authors have read and agreed to the published version of the manuscript.
Funding
This work was supported by the RC4ALL project (Agencia Estatal de Investigación, RTC2019-007380-3), which has received funding from the Ministry of Science and Innovation (MCI) of the Government of Spain and the State Research Agency (AEI).
Institutional Review Board Statement
Not applicable.
Informed Consent Statement
Informed consent was obtained from all subjects involved in the study.
Data Availability Statement
Restrictions apply to the availability of these data. The data were obtained from households participating in the RC4ALL project (Agencia Estatal de Investigación, RTC2019-007380-3). The dataset is neither public nor available in the way that it has been used as a source in this article.
Conflicts of Interest
The authors declare no conflict of interest.
References
- Energy, G. CO2 Status Report; IEA (International Energy Agency): Paris, France, 2019. [Google Scholar]
- White, L.V.; Sintov, N.D. Health and financial impacts of demand-side response measures differ across sociodemographic groups. Nat. Energy 2020, 5, 50–60. [Google Scholar] [CrossRef]
- Messerli, P.; Murniningtyas, E.; Eloundou-Enyegue, P.; Foli, E.G.; Furman, E.; Glassman, A.; Hernández Licona, G.; Kim, E.M.; Lutz, W.; Moatti, J.P.; et al. Independent Group of Scientists appointed by the Secretary-General, Global Sustainable Development Report 2019: The Future is Now – Science for Achieving Sustainable Development; United Nations: New York, NY, USA, 2019. [Google Scholar]
- Ehrhardt-Martinez, K.; Donnelly, K.A.; Laitner, S. Advanced Metering Initiatives and Residential Feedback Programs: A Meta-Review for Household Electricity-Saving Opportunities; American Council for an Energy-Efficient Economy: Washington, DC, USA, 2010. [Google Scholar]
- Ridi, A.; Gisler, C.; Hennebert, J. A survey on intrusive load monitoring for appliance recognition. In Proceedings of the 2014 22nd international conference on pattern recognition, Stockholm, Sweden, 24–28 August 2014; pp. 3702–3707. [Google Scholar]
- Welikala, S.; Dinesh, C.; Ekanayake, M.P.B.; Godaliyadda, R.I.; Ekanayake, J. Incorporating appliance usage patterns for non-intrusive load monitoring and load forecasting. IEEE Trans. Smart Grid 2017, 10, 448–461. [Google Scholar] [CrossRef]
- Liaqat, R.; Sajjad, I.A.; Waseem, M.; Alhelou, H.H. Appliance level energy characterization of residential electricity demand: Prospects, challenges and recommendations. IEEE Access 2021, 9, 148676–148697. [Google Scholar] [CrossRef]
- Cool Appliances: Policy Strategies for Energy Efficient Homes; Organisation for Economic Co-Operation and Development, OECD: Paris, France, 2003.
- Heap, R. Refrigeration and air conditioning–the response to climate change. Bull. IIR 2001, 5, 2–16. [Google Scholar]
- Paul, A.; Baumhögger, E.; Elsner, A.; Reineke, M.; Hueppe, C.; Stamminger, R.; Hoelscher, H.; Wagner, H.; Gries, U.; Becker, W.; et al. Impact of aging on the energy efficiency of household refrigerating appliances. Appl. Therm. Eng. 2022, 205, 117992. [Google Scholar] [CrossRef]
- Cappelletti, F.; Manes, F.; Rossi, M.; Germani, M. Evaluating the environmental sustainability of durable products through life cycle assessment. The case of domestic refrigerators. Sustain. Prod. Consum. 2022, 34, 177–189. [Google Scholar] [CrossRef]
- Saidur, R.; Masjuki, H.H.; Choudhury, I. Role of ambient temperature, door opening, thermostat setting position and their combined effect on refrigerator-freezer energy consumption. Energy Convers. Manag. 2002, 43, 845–854. [Google Scholar] [CrossRef]
- Liu, D.Y.; Chang, W.R.; Lin, J.Y. Performance comparison with effect of door opening on variable and fixed frequency refrigerators/freezers. Appl. Therm. Eng. 2004, 24, 2281–2292. [Google Scholar] [CrossRef]
- Hueppe, C.; Geppert, J.; Moenninghoff-Juessen, J.; Wolff, L.; Stamminger, R.; Paul, A.; Elsner, A.; Vrabec, J.; Wagner, H.; Hoelscher, H.; et al. Investigating the real life energy consumption of refrigeration appliances in Germany: Are present policies sufficient? Energy Policy 2021, 155, 112275. [Google Scholar] [CrossRef]
- RC4ALL: Inteligencia Artificial Para un Consumo Responsable; Endesa: Madrid, Spain, 2020.
- Kendall, M.; Stuart, A.; Ord, J. Kendall’s Advanced Theory of Statistics, Volume 3: Design and Analysis, and Time Series; John Wiley & Sons: Hoboken, NJ, USA, 1987. [Google Scholar]
- Kim, T.K. Understanding one-way ANOVA using conceptual figures. Korean J. Anesthesiol. 2017, 70, 22–26. [Google Scholar] [CrossRef] [PubMed]
- Fisher, R.A. Statistical Methods for Research Workers; Springer: Berlin/Heidelberg, Germany, 1992. [Google Scholar]
- Anh, D.T.; Thanh, L.H. An efficient implementation of k-means clustering for time series data with DTW distance. Int. J. Bus. Intell. Data Min. 2015, 10, 213–232. [Google Scholar] [CrossRef]
- Rousseeuw, P.J. Silhouettes: A graphical aid to the interpretation and validation of cluster analysis. J. Comput. Appl. Math. 1987, 20, 53–65. [Google Scholar] [CrossRef]
- Pöthkow, K.; Hege, H.C. Nonparametric models for uncertainty visualization. In Computer Graphics Forum; Wiley Online Library: Hoboken, NJ, USA, 2013; Volume 32, pp. 131–140. [Google Scholar]
- Wilcox, R.R.; Keselman, H. Modern robust data analysis methods: Measures of central tendency. Psychol. Methods 2003, 8, 254. [Google Scholar] [CrossRef] [PubMed]
- Refrigerator Best Practices; Energy Star, U.S. Environment Protection Agency: Washington, DC, USA, 2023.
- Harrington, L. Prediction of Energy Consumption of Refrigerators During Use. Ph.D. Thesis, Department of Infrastructure Engineering, Melbourne School of Engineering, The University of Melbourne, Melbourne, VIC, Australia, 2018. Available online: https://minerva-access.unimelb.edu.au/handle/11343/213357 (accessed on 18 June 2023).


Disclaimer/Publisher’s Note: The statements, opinions and data contained in all publications are solely those of the individual author(s) and contributor(s) and not of MDPI and/or the editor(s). MDPI and/or the editor(s) disclaim responsibility for any injury to people or property resulting from any ideas, methods, instructions or products referred to in the content. |
© 2023 by the authors. Licensee MDPI, Basel, Switzerland. This article is an open access article distributed under the terms and conditions of the Creative Commons Attribution (CC BY) license (https://creativecommons.org/licenses/by/4.0/).