Proceeding Paper

Assessment of FABDEM on the Different Types of Topographic Regions in India Using Differential GPS Data †

by
Ashutosh Bhardwaj
Indian Institute of Remote Sensing, Dehradun 248001, India
Presented at the 9th International Electronic Conference on Sensors and Applications, 1–15 November 2022; Available online: https://ecsa-9.sciforum.net/.
Eng. Proc. 2022, 27(1), 79; https://doi.org/10.3390/ecsa-9-13368
Published: 1 November 2022

Abstract

:
The Forest and Buildings removed Copernicus DEM (FABDEM) represents a global DEM generated through the elimination of height biases arising due to buildings and trees in the Copernicus global 30 m (GLO-30) digital elevation model (DEM). Copernicus GLO-30 DEM is a digital surface model (DSM) generated from edited DEM called WorldDEM, which in itself is a product generated from SAR Interferometry (InSAR)-based TanDEM-X DEM. It has the potential to be used as a digital terrain model (DTM) for many applications, such as in engineering, environmental, and hydrological studies. The current experiment evaluates the accuracy of FABDEM using ground control points (GCPs) collected through a Differential GPS (DGPS) survey at the three experimental sites in India, namely, the Dehradun site in Uttarakhand, Jaipur site in Rajasthan, and Kendrapara site in Odisha. The selected three experimental sites represent varied topographic conditions in the Indian region. The FABDEM heights are converted into WGS84 heights using geoidal undulations (N) as per the Earth Gravitational Model-EGM2008, which is the vertical datum for FABDEM. Statistical measures such as MAE, RMSE, and LE90 are used to assess the accuracies of FABDEM. The RMSE computed for FABDEM in the sites at Dehradun, Jaipur, and Kendrapara are 5.96 m, 2.77 m, and 4.29 m, respectively. The study thus reveals that the FABDEM has relatively high accuracy in the experimental sites at Jaipur and Dehradun, considering their topography. However, the accuracy was found to be relatively low in the alluvial plains of the Kendrapara site.

1. Introduction

The digital elevation model (DEM) is an integral and important part of GIS, providing the elevation of terrain for modelling in various domains. The Forest and Buildings removed Copernicus DEM (FABDEM) is generated by the elimination of height biases in the Copernicus global 30 m (GLO-30) DEM using machine learning techniques [1]. Machine learning techniques are used for various disciplines such as DEM fusion [2,3], DEM improvement [1,2], and medical imaging [4]. Open source DEMs such as CartoDEM and TanDEM-X, as well as fused-assimilated DEMs, such as EarthEnv-DEM90, and multi-error-removed improved-terrain (MERIT) DEMs have been assessed for the Indian region by various researchers at different topographic sites [5,6,7,8,9,10,11,12]. The present study assesses the quality of FABDEM using ground control points (GCPs) collected through the DGPS surveys at the three experimental sites in India.

2. Experimental Sites

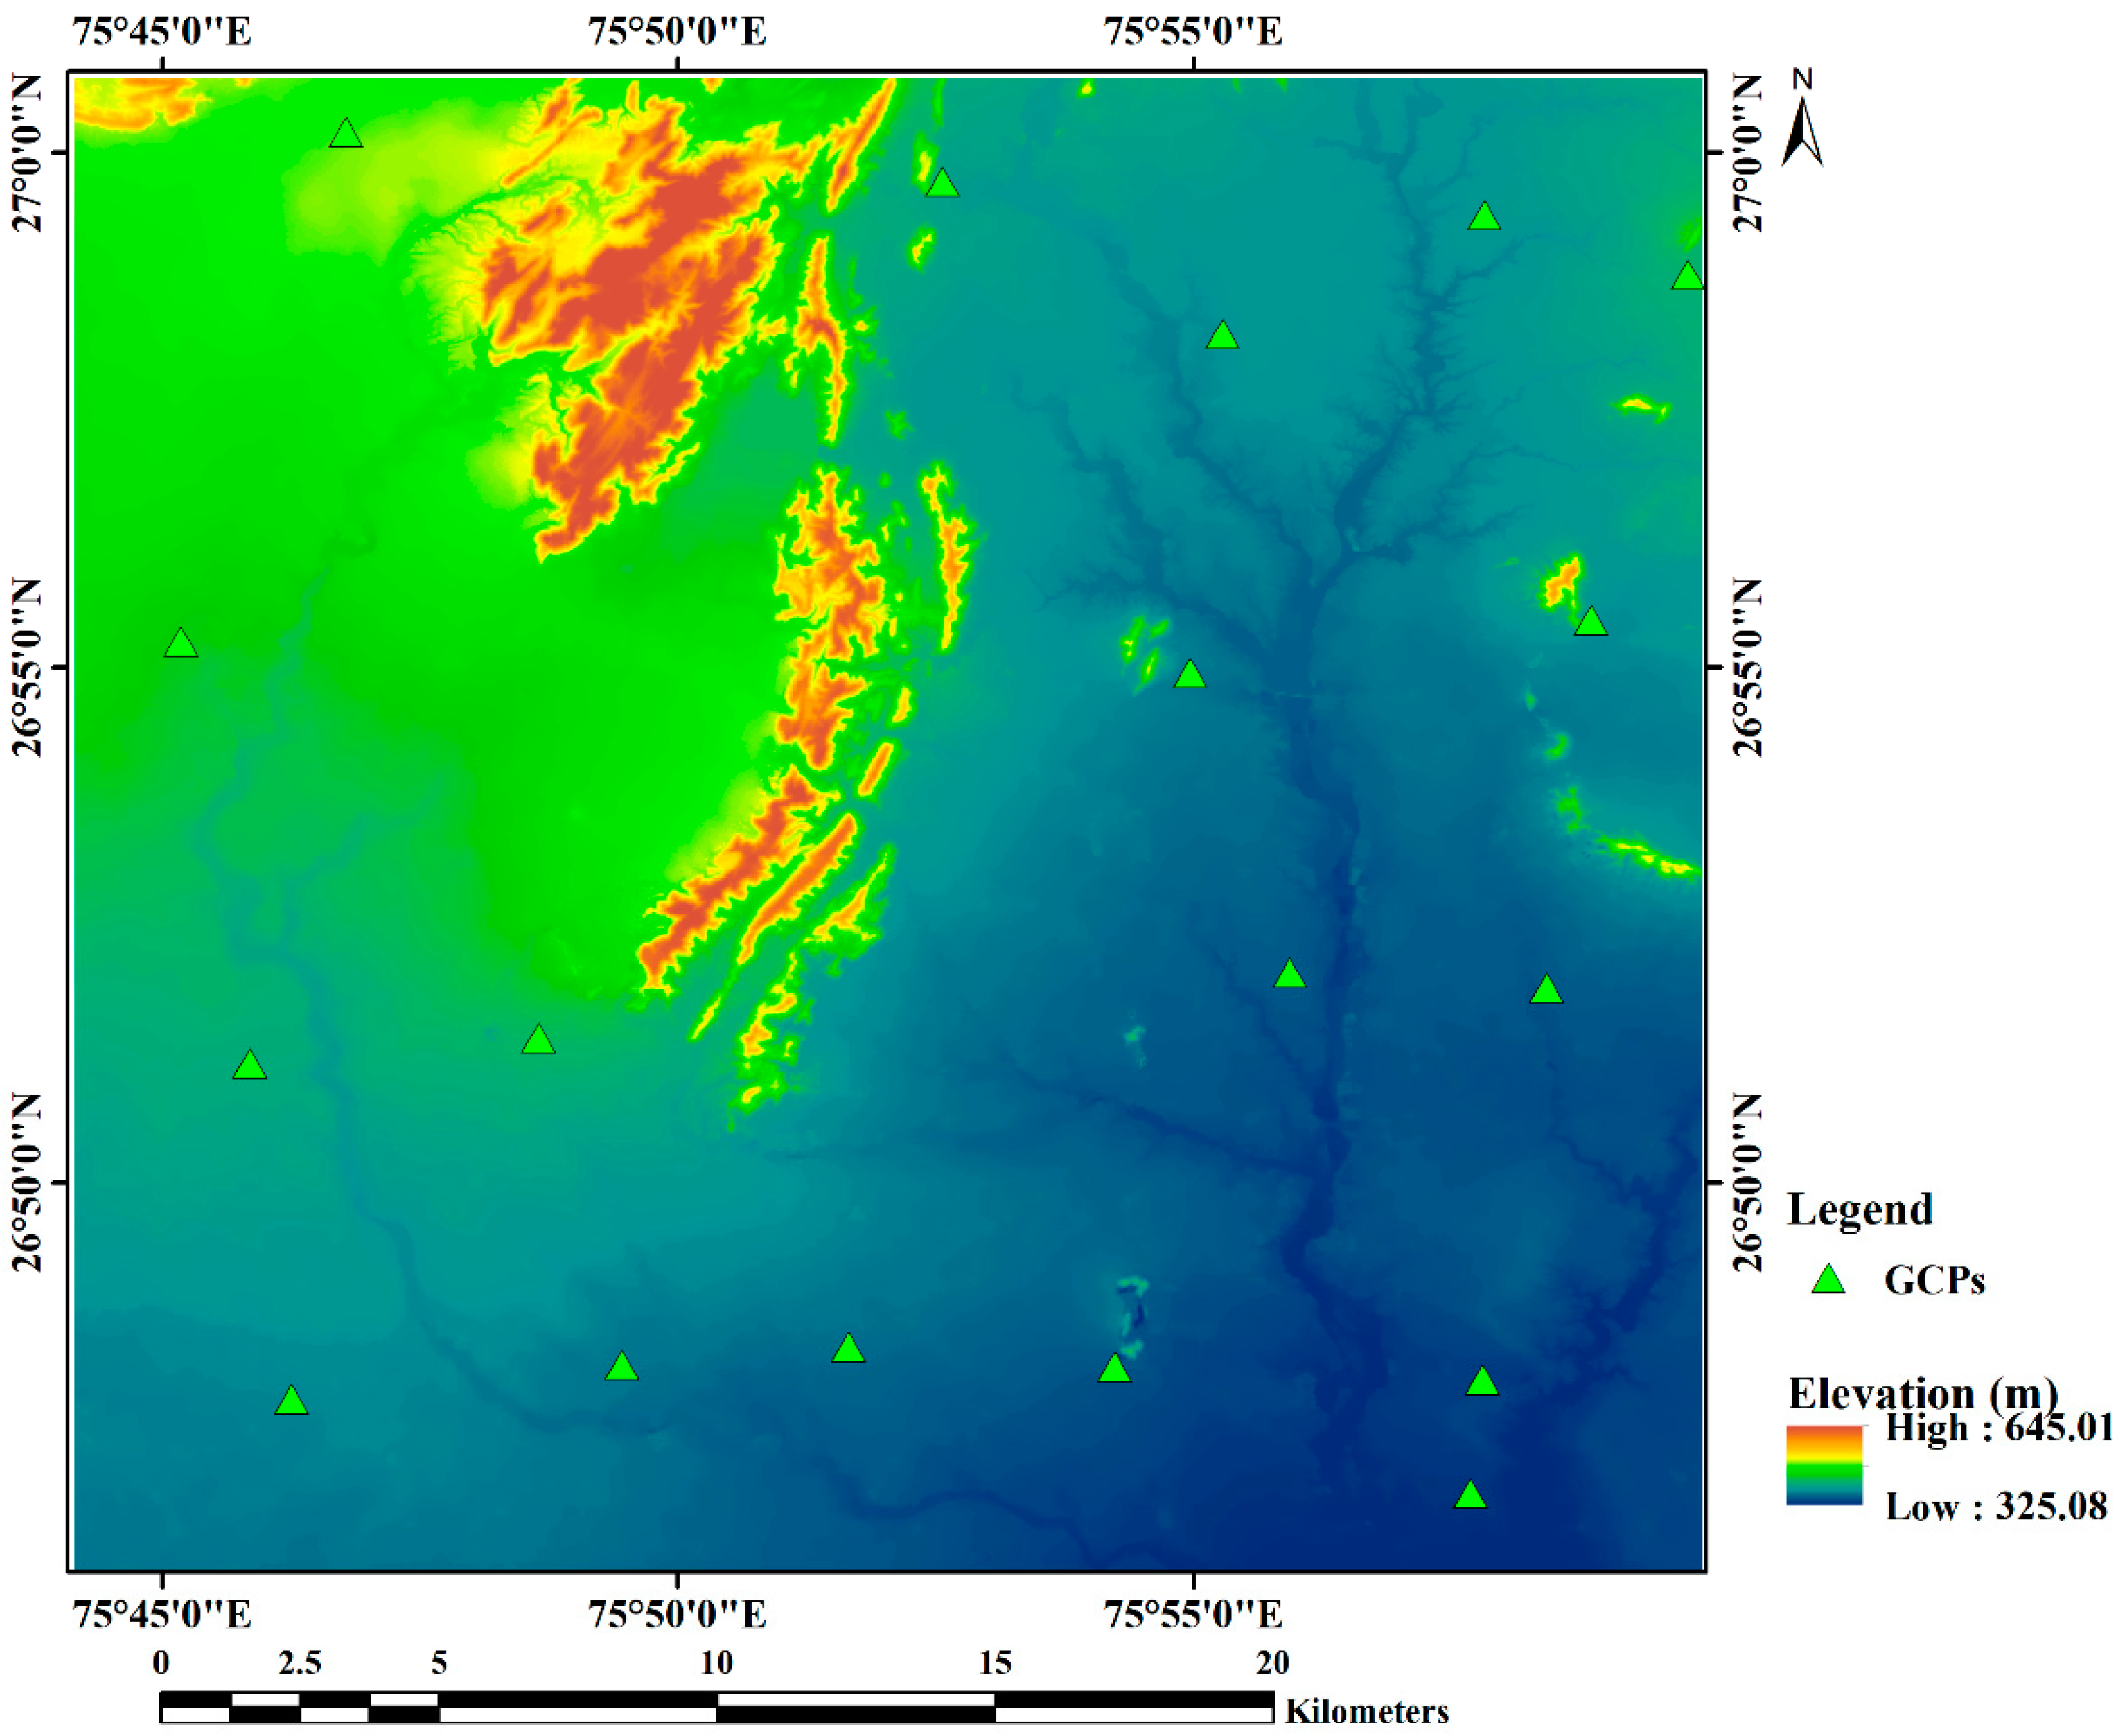
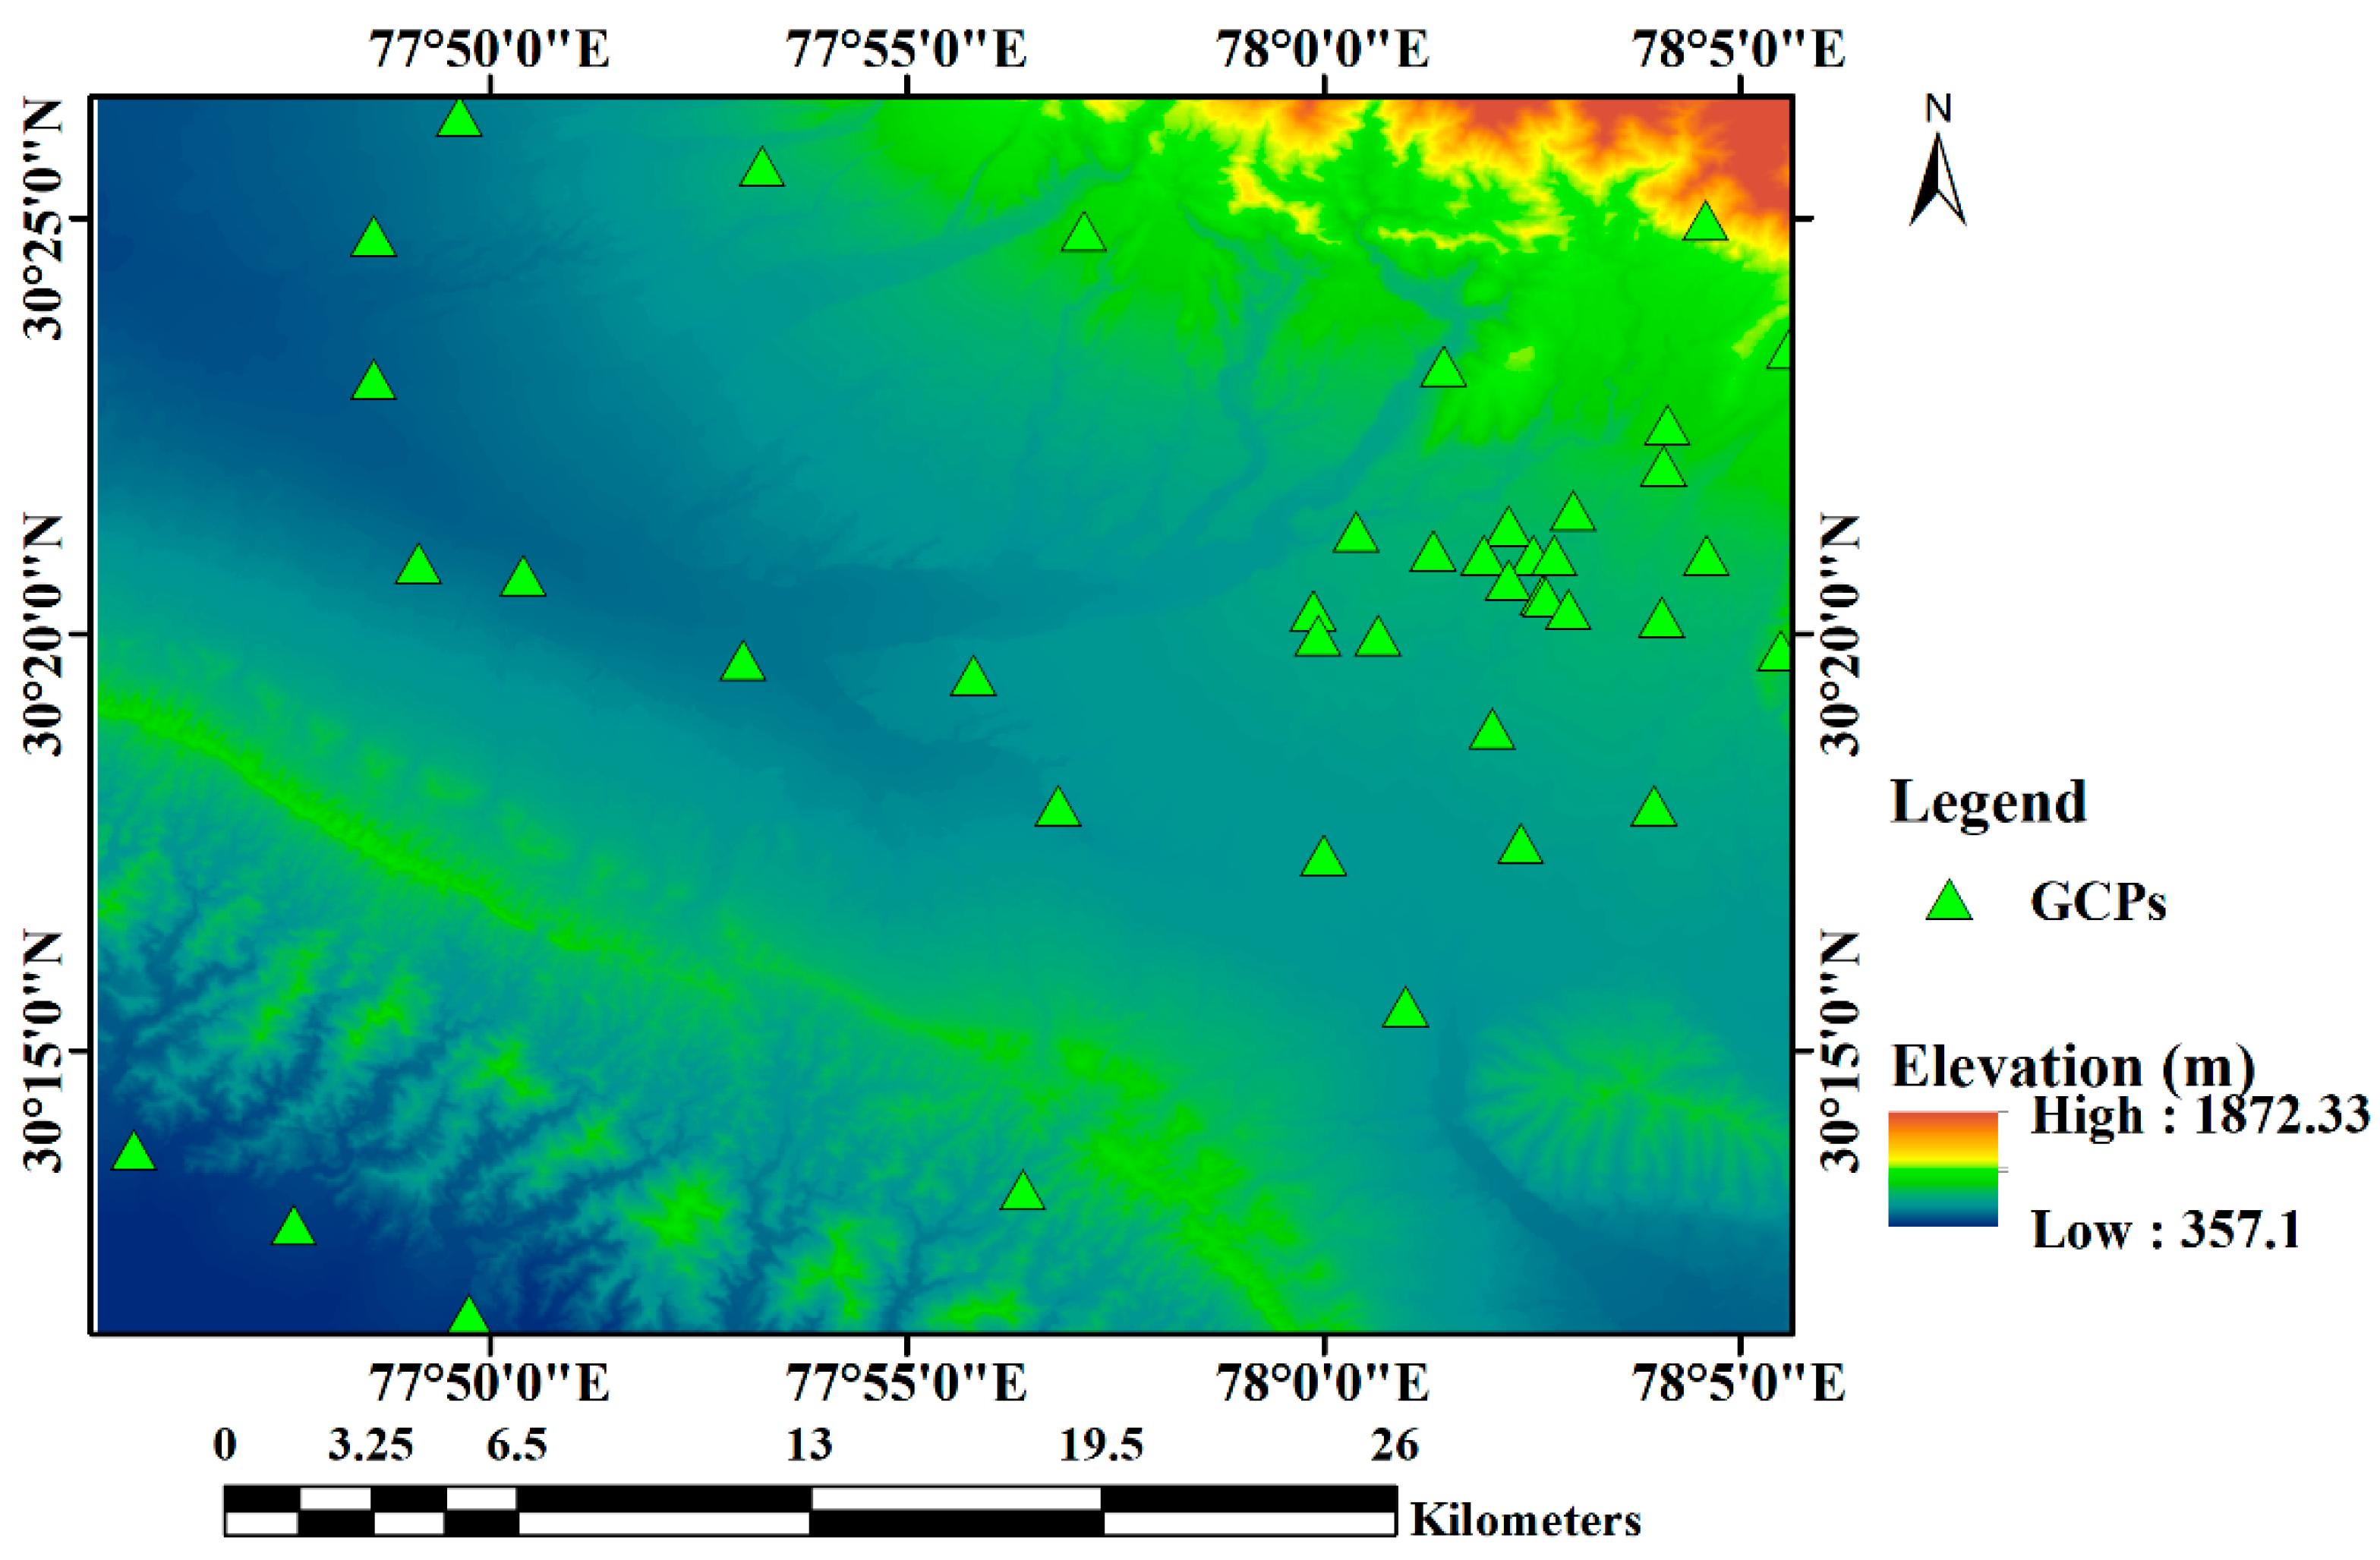
The selected three experimental sites in India represent three different topographic scenarios majorly present in regions with plain, medium, and highly rugged terrain conditions (Figure 1). The first study area includes the plains of Kendrapara region lying between 20.296 degrees N and 20.665 degrees N Latitude and 86.175 degrees E to 86.528 degrees E Longitude. It is situated in the central coastal plain zone as per the Agro-Climatic classification of Odisha, with predominant agricultural activity in the region. The site is prone to yearly floods and has a general elevation ranging from about −0.15 m to 279 m above MSL. The second experimental site includes Jaipur city (commonly referred to as the Pink City), which is the capital city of Rajasthan state, with its surrounding regions. The study area lies between 26.77 degrees N and 27.012 degrees N Latitude and 75.736 degrees E to 75.999 degrees E Longitude. The terrain ranges from the relatively flat urban area, agriculture fields, a lake, and the Aravalli Mountain range towards the NE side. The region has a semi-arid climate with elevation ranging from nearly 325 m to 645 m. The third site includes Dehradun city and its surroundings having an undulating terrain with a general elevation ranging from about 357 m to 1872 m above MSL. Dehradun is the capital city of the Uttarakhand state and has witnessed floods that have included the loss of property as well as life in the recent floods in the Doon valley during the monsoon season in 2022. The open-source FABDEM datasets are utilized in this study for the region between 30.194 degrees N and 30.443 degrees N Latitude and 77.755 degrees E to 78.096 degrees E Longitude. The Dehradun site comprises highly rugged Shivalik hills in the south and higher Himalayas in the north. Its population is blessed with the presence of the river Ganga in the east and the river Yamuna in the west.

3. Materials and Method

The study aims to assess the FABDEM at three sites in India, using the GCPs collected through DGPS surveys. The FABDEM is based on WorldDEM, for which the horizontal datum is WGS84, and the vertical datum is EGM2008 [13]. The datasets were downloaded from the publisher website, i.e., the University of Bristol platform (https://data.bris.ac.uk/data/dataset/25wfy0f9ukoge2gs7a5mqpq2j7 (accessed on: 22 August 2022) (FABDEM—Datasets—Data. Bris, 2022) [14]. Table 1 details the major specifications of FABDEM datasets. Orthoimages generated from Cartosat-1 stereo datasets are used along with information collected during the fieldwork and the Google Earth (GE) platform for the visualization of the terrain.
The vertical datum, i.e., EGM2008 for the FABDEM, is converted to elevation values in the WGS84 datum using the relation between the orthometric height, ellipsoidal height, and the geoid undulation (N) as given in Equation (1). The elevation values were extracted in ArcGIS software version 10.8.1. and were analyzed for the root mean square error (RMSE) after conversion to WGS84 datum using Equations (1) and (2). The GCPs were used to calculate the absolute height error for the accuracy assessment of the FABDEM datasets. Numbers 20, 18, and 41 of the GCPs were used for analysis at Kendrapara, Jaipur, and Dehradun sites, respectively. Statistical parameters were defined using the difference between the value of the respective height from the experimental FABDEM (Z(FABDEM)) products and the reference GCP vertical heights (Z(DGPS)) measured in the field through the DGPS survey.
O r t h o m e t r i c   H e i g h t   ( Z ( F A B D E M ) ) = E l l i p s o i d a l   H e i g h t   ( Z ( D G P S ) ) Geoid   Height   ( N )
RMSE = i = 1 n ( Z ( D G P S ) Z ( F A B D E M ) ) 2 n

4. Results and Discussion

Figure 2, Figure 3 and Figure 4 show the FABDEM overlaid with GCP locations for the evaluation of FABDEM at the three experimental sites at Kendrapara, Jaipur, and Dehradun. Table 2 shows the resulting statistical parameters, namely, ME, MAE, RMSE, and LE90 for FABDEM datasets at the three experimental sites. In general, MAE is a better estimate for the assessment of error as the RMSE has a squaring effect in its computation, which can show large deviations as blunders or outliers. Table 2 reveals that mostly in the SAR Interferometry (InSAR)-based DEMs at the three chosen sites, the elevation values were negative, i.e., an underestimation of elevation values in FABDEM. The maximum underestimation is seen in the agriculture fields with alluvial/black/saline soils at the Kendrapara site. This effect can be attributed to the penetration of the TanDEM-X InSAR datasets, which were used for the original TanDEM-X DEM datasets and further utilized for the generation of WorldDEM and COP DEM (GLO-30) using various techniques at different stages.
The variability in the quality of the openly accessible DEMs at the three experimental sites with variable topography suggests that these DEMs should be utilized prudently as per the application requirements in specific regions after the thorough testing of the datasets.

5. Conclusions

The performance of FABDEM was found to be improved at Dehradun and Jaipur sites compared to TanDEM-X DEM values analyzed in earlier studies [15]. However, the RMSE was found to be relatively more for the plain site of the Kendrapara region. These results should be utilized for the careful selection of DEM datasets available as openly accessible datasets. The FABDEM, which is corrected for the biases due to buildings and trees, can be very useful for disaster-related applications, especially flood hazard zonation, where the high accuracy of DEMs could result in better planning and saving lives.

Funding

This research received no external funding.

Institutional Review Board Statement

Not applicable.

Informed Consent Statement

Not applicable.

Data Availability Statement

The FABDEM datasets are openly accessible at the webportal published by the University of Bristol (https://data.bris.ac.uk/data/dataset/25wfy0f9ukoge2gs7a5mqpq2j7 (accessed on: 22 August 2022 )).

Acknowledgments

The author would like to thank and send words of appreciation to the Indian Space Research Organization (ISRO), Japan Aerospace Exploration Agency (JAXA), National Aeronautics and Space Administration (NASA), European Space Agency (ESA), Deutschen Zentrum für Luft- und Raumfahrt (DLR), and the University of Bristol along with their collaborators for their insights and supportive policies for research through their data sharing platforms, which are highly valuable in the presented study. The author is highly indebted to Director IIRS for support and encouragement in conducting the research activities.

Conflicts of Interest

The author declares no conflict of interest.

References

  1. Hawker, L.; Uhe, P.; Paulo, L.; Sosa, J.; Savage, J.; Sampson, C.; Neal, J. A 30 m global map of elevation with forests and buildings removed. Environ. Res. Lett. 2022, 17, 024016. [Google Scholar] [CrossRef]
  2. Girohi, P.; Bhardwaj, A. A Neural Network based Fusion Approach for Improvement of SAR Interferometry based Digital Elevation Models in Plain and hilly terrain of India. Eur. J. Environ. Earth Sci. 2022, 3, 79–89. [Google Scholar] [CrossRef]
  3. Bagheri, H.; Schmitt, M.; Zhu, X.X. Fusion of TanDEM-X and Cartosat-1 elevation data supported by neural network-predicted weight maps. ISPRS J. Photogramm. Remote Sens. 2018, 144, 285–297. [Google Scholar] [CrossRef] [Green Version]
  4. Suzuki, K. Overview of deep learning in medical imaging. Radiol. Phys. Technol. 2017, 10, 257–273. [Google Scholar] [CrossRef] [PubMed]
  5. Agarwal, R.; Sur, K.; Rajawat, A.S. Accuracy assessment of the CARTOSAT DEM using robust statistical measures. Model. Earth Syst. Environ. 2019, 6, 471–478. [Google Scholar] [CrossRef]
  6. Ahmed, N.; Mahtab, A.; Agrawal, R.; Jayaprasad, P.; Pathan, S.K.; Ajai; Singh, D.K.; Singh, A.K. Extraction and validation of cartosat-1 DEM. J. Indian Soc. Remote Sens. 2007, 35, 121–127. [Google Scholar] [CrossRef]
  7. Yadav, U.; Bhardwaj, A. Accuracy Assessment of TanDEM-X 90 and CartoDEM Using ICESat-2 Datasets for Plain Regions of Ratlam City and Surroundings. Eng. Proc. 2021, 10, 59. [Google Scholar] [CrossRef]
  8. Bhardwaj, A.; Chatterjee, R.S.; Jain, K. Evaluation of Cartosat-1 satellite triangulation & DSMs in varied terrain conditions. Sci. Res. 2013, 1, 19–24. [Google Scholar] [CrossRef]
  9. Bhardwaj, A. Quality Assessment of Openly Accessible Fused EarthEnv-DEM90 DEM and its comparison with MERIT DEM using Ground Control Points for Diverse Topographic Regions. In Proceedings of the MOL2NET’20, Conference on Molecular, Biomedical & Computational Sciences and Engineering, 6th ed., Duluth, MN, USA, 30 January 2020–30 January 2021; MDPI: Basel, Switzerland, 2020. [Google Scholar]
  10. Bhardwaj, A. Evaluation of openly Accessible MERIT DEM for vertical accuracy in different topographic regions of India. Indian Cartogr. J. Indian Natl. Cartogr. Assoc. 2021, 39, 239–245. [Google Scholar]
  11. Vaka, D.S.; Kumar, V.; Rao, Y.S.; Deo, R. Comparison of Various DEMs for Height Accuracy Assessment over Different Terrains of India. In Proceedings of the International Geoscience and Remote Sensing Symposium (IGARSS), Yokohama, Japan, 28 July–2 August 2019; pp. 1998–2001. [Google Scholar]
  12. Bhardwaj, A. Quality Assessment of merged NASADEM products for varied Topographies in India using Ground Control Points from GNSS. In Proceedings of the MOL2NET 2020, International Conference on Multidisciplinary Sciences, 6th ed.; Sciforum (MDPI): Basel, Switzerland, 2021; Available online: https://mol2net-06.sciforum.net/#section1478 (accessed on 24 August 2022).
  13. Airbus WorldDEMTM Technical Product Specification Digital Surface Model. Digital Terrain Model, Version 2.4; Airbus Defence and Space Intelligence. 2018. Available online: https://api.oneatlas.airbus.com/documents/2018-07_WorldDEM_TechnicalSpecs_Version2.4_I1.0.pdf (accessed on 23 August 2022).
  14. FABDEM. Datasets—Data.bris. Available online: https://data.bris.ac.uk/data/dataset/25wfy0f9ukoge2gs7a5mqpq2j7 (accessed on 23 August 2022).
  15. Bhardwaj, A. Assessment of Vertical Accuracy for TanDEM-X 90 m DEMs in Plain, Moderate, and Rugged Terrain. Proceedings 2019, 24, 8. [Google Scholar] [CrossRef]
Figure 1. Depicts the locations and Cartosat-1 orthoimages for the three experimental sites namely, (1) Dehradun Site, Uttarakhand; (2) Jaipur Site, Rajasthan; and (3) Kendrapara Site, Odisha.
Engproc 27 00079 g001
Figure 2. FABDEM for Kendrapara site.
Engproc 27 00079 g002
Figure 3. FABDEM for Jaipur site.
Engproc 27 00079 g003
Figure 4. FABDEM for Dehradun site.
Engproc 27 00079 g004
Table 1. Major specifications of FABDEM datasets.
Specifications of TanDEM-XFABDEM
Acquisition and Generation techniqueRADAR (TanDEM-X/WorldDEM/COPDEM) processed with ML techniques for FABDEM generation
Data formatGeoTIFF
Vertical DatumEGM2008
Spatial resolution30 m
Projection systemGeographic
Absolute horizontal accuracy (CE90)below 10 m, with further improvement over COPDEM
Absolute vertical accuracy (LE90)below 10 m, with further improvement over COPDEM
Table 2. Depicts the statistical parameters of FABDEM at the three locations.
S. No.Parameter/Study AreaMEMAERMSELE90
1.Dehradun−0.774.735.969.80
2.Jaipur−0.521.572.774.55
3.Kendrapara−3.933.934.297.05
Publisher’s Note: MDPI stays neutral with regard to jurisdictional claims in published maps and institutional affiliations.