1. Introduction
Civil aviation is estimated to account for 3% of global greenhouse gas emissions. The wealthiest countries represent most of this footprint [
1] since most citizens of the global south have never boarded an airplane. Due to their high cost and inefficiency, private and business jets aggravate this inequality even further. Until now, research on private jets has largely been missing. Major aviation flight data providers (such as FlightRadar24 and FlightAware) offer the possibilities for private jet owners to delist their airplanes, making access to this data more difficult.
Nevertheless, the source data used by these data providers, automatic dependent surveillance-broadcast (ADS-B), is open data. Almost all private jets are required to constantly transmit these data for supporting the safety of air traffic management. The data include their positions, the altitude, and the speed of the aircraft, and they can be received by low-cost receivers with a limited range of approximately 300 km. By aggregating multiple receivers from different locations, crowdsourced ADS-B networks can cover the complete trajectory for many flights at a large scale.
Unlike previously mentioned commercial data providers, non-profit networks, such as OpenSky Network and ADS-B Exchange, provide unfiltered data access thanks to contributions from thousands of researchers and aviation enthusiasts. These data form the basis for tracking and studying private jets. Recently, using this unfiltered data, social network users have revealed how wealthy individuals make use of jet travel. For example, a Twitter account focused on Elon Musk’s plane and started to automatically publish the aircraft’s movements. Other celebrities in the United States and wealthy individuals were soon tracked by other Twitter or Instagram accounts using the same source.
Since 2020, researchers associated with the OpenSky network have made a simplified dataset that aggregates the origins and destinations for all the flights that have been tracked by the network since 2019 [
2]. This dataset has been used by many research studies in aviation (e.g., [
3,
4]).
In this study, we extend upon this dataset with high-resolution flight trajectories [
5] and investigate around 250 private jet where the owner information is identified.
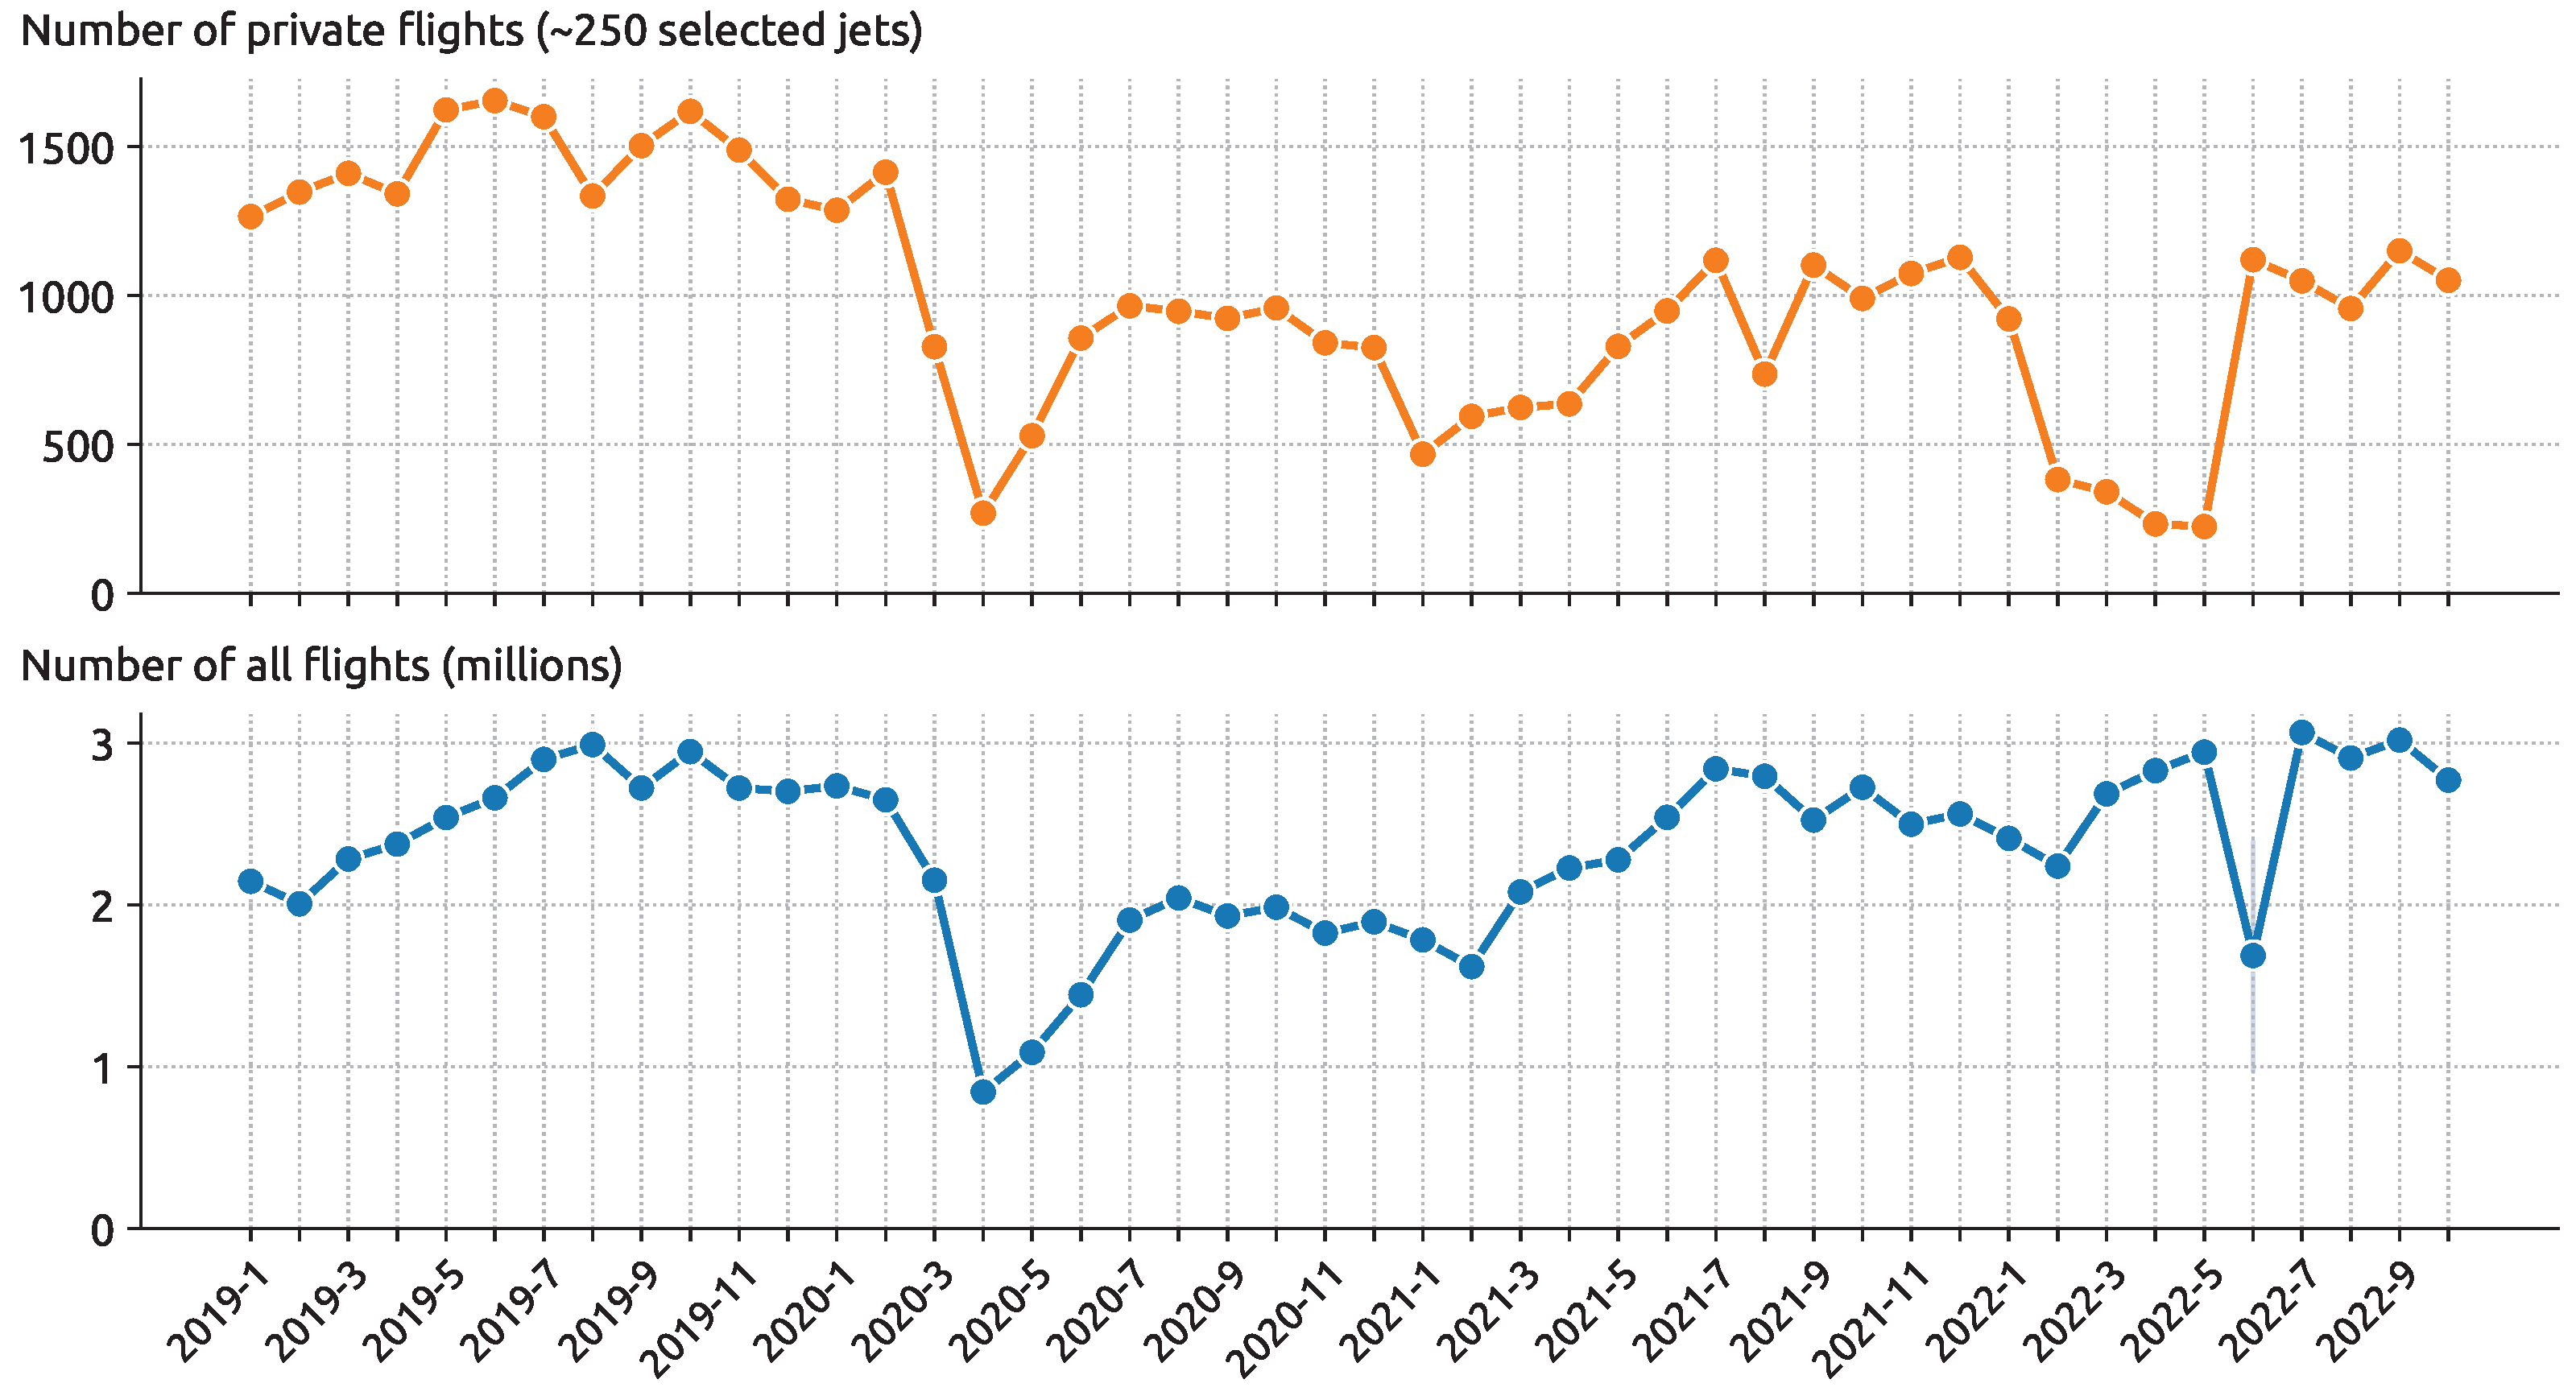
Figure 1 shows a sample of private flights compared to all flights tracked by the OpenSky Network from 2019 to 2021.
Several recent academic studies have researched the emissions caused by aviation (e.g., [
1,
3,
6]). Despite the large emission inequality among developed and developing countries, the average yearly CO
2 footprint per person is estimated to be around 4.7 tonnes in 2019 [
7]. When comparing this number to the emissions of a typical private jet, which is at the level of tens of tons per single flight with typically a few passengers, we can see the severity of emission inequality caused by this privileged mode of transport.
In our recent emission study [
1], the global impact of aviation on the environment in terms of CO
2 emissions was investigated, and the further analysis of private jets was proposed.
The struture of the paper is as follows.
Section 2 outlines the process of identifying business jets as well as extracting corresponding trajectory data.
Section 3 explains how the OpenAP model is improved with new light jet performance and emission models. We also provide more insights into our emission estimations process.
Section 4 presents our analysis of the overall emission and carbon footprints of individual jet owners. Finally,
Section 5 and
Section 6 explain the limitations and conclusions of this study.
2. Data Collection and Statistics about Private Jets
To facilitate the study of private jets over the past few years, we selected a subset of OpenSky state vector data for a sample of around 250 private and business jets from January 2019 to October 2022, which covers global flight during the time before, during, and after the COVID-19 pandemic.
Besides the querying and processing of the state vector data over several years, the main challenge is to identify the transponder codes of private jets. A transponder code is a unique identifier for all of the data transmitted over ADS-B for an aircraft, and it remains unchanged (for most counties) until the aircraft is re-registered after the transfer of ownership.
To identify an appropriate sample of planes, we first assume the jets did not re-register between 2019 and 2022. The sampled jets are identified through the crowdsourced OpenSky aircraft database (
https://opensky-network.org/aircraft-database, accessed on 1 November 2022) and verified via cross-referencing with other sources such as social network data. We take into account all flights observed for these jets by the entire network during these years.
Figure 2 shows the number of private or business jets in the sample and the countries where they are registered. We can see that besides the United States, the Isle of Man and Bermuda are two countries where a large number of jets are registered. This is likely due to the presumed anonymity of these countries and their common offerings of tax-efficient shell companies.
Based on the basic flight information available from previous studies [
2], detailed flight states related to the identified business and private jets are downloaded before performing the emission estimation. We make use of the
traffic library [
8] for the post-processing of these state vector data, including filtering, re-sampling, and re-constructing the complete flight trajectories.
3. Basic Mission Estimation Method
In this study, we employ the OpenAP [
9] model to calculate the emissions of flights. It provides the necessary aircraft performance and emission models to estimate different emission types, including CO
2, H
2O, NO
X, SO
X, CO, and HC. OpenAP currently defines aircraft performance and emission models for more than 30 of the most common aircraft type codes. It also makes use of synonyms to approximate the models for an additional set of more than 20 less common aircraft types.
The most common jet in our sample is the Gulfstream G650 (GLF6). Hence, for this study, we constructed a new performance model in OpenAP for the GLF6. This allows us to perform emission estimations with better accuracy compared to generic models. GLF6 is also used as the base model to estimate other less common private jet types.
The calculation of fuel flow and emissions relies not only on the flight trajectory data. It also requires an assumption about the aircraft mass since such information is not publicly available. To handle unknown aircraft mass values, we consider different takeoff mass assumptions and provide each flight with emission uncertainties. Similar to our previous study, these mass values are between 60% and 90% of the aircraft’s maximum take-off weight.
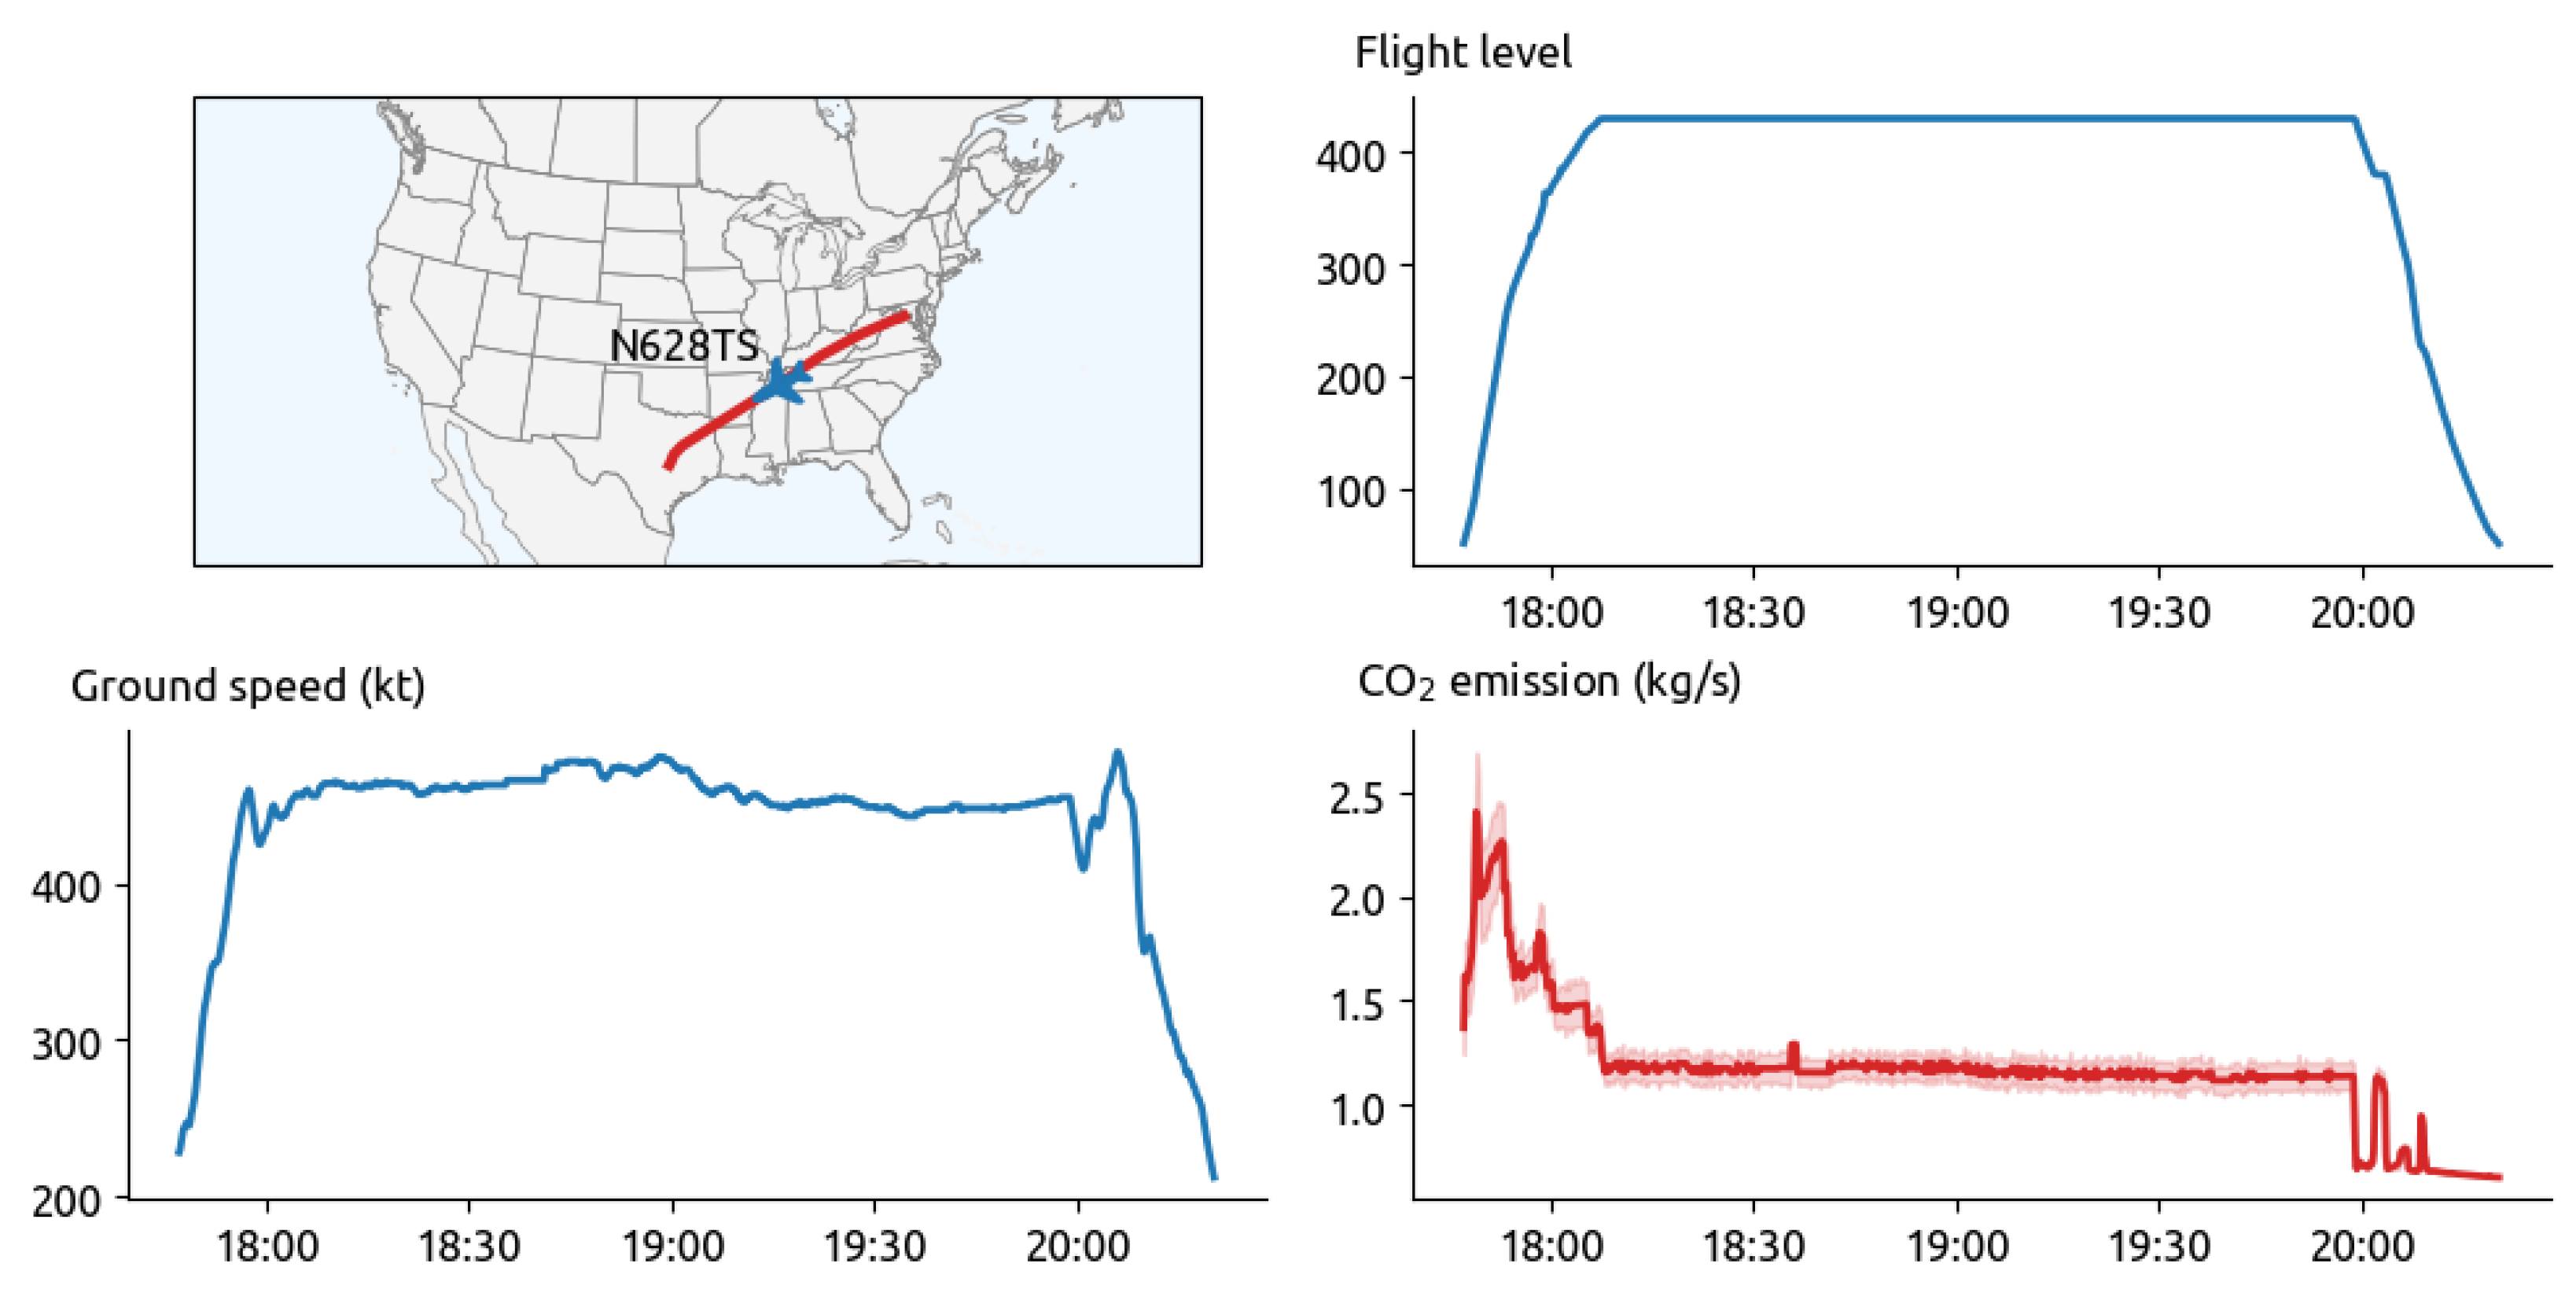
Figure 3 shows an example of such an emission estimation based on a single
GLF6 flight.
4. Analysis
Our present analysis aims to improve the understanding of emission statistics at different levels. First of all, we show the total emissions from private and business jets between January 2019 and October 2022. Secondly, we further investigate emissions caused by individual private jets.
4.1. Total Emissions
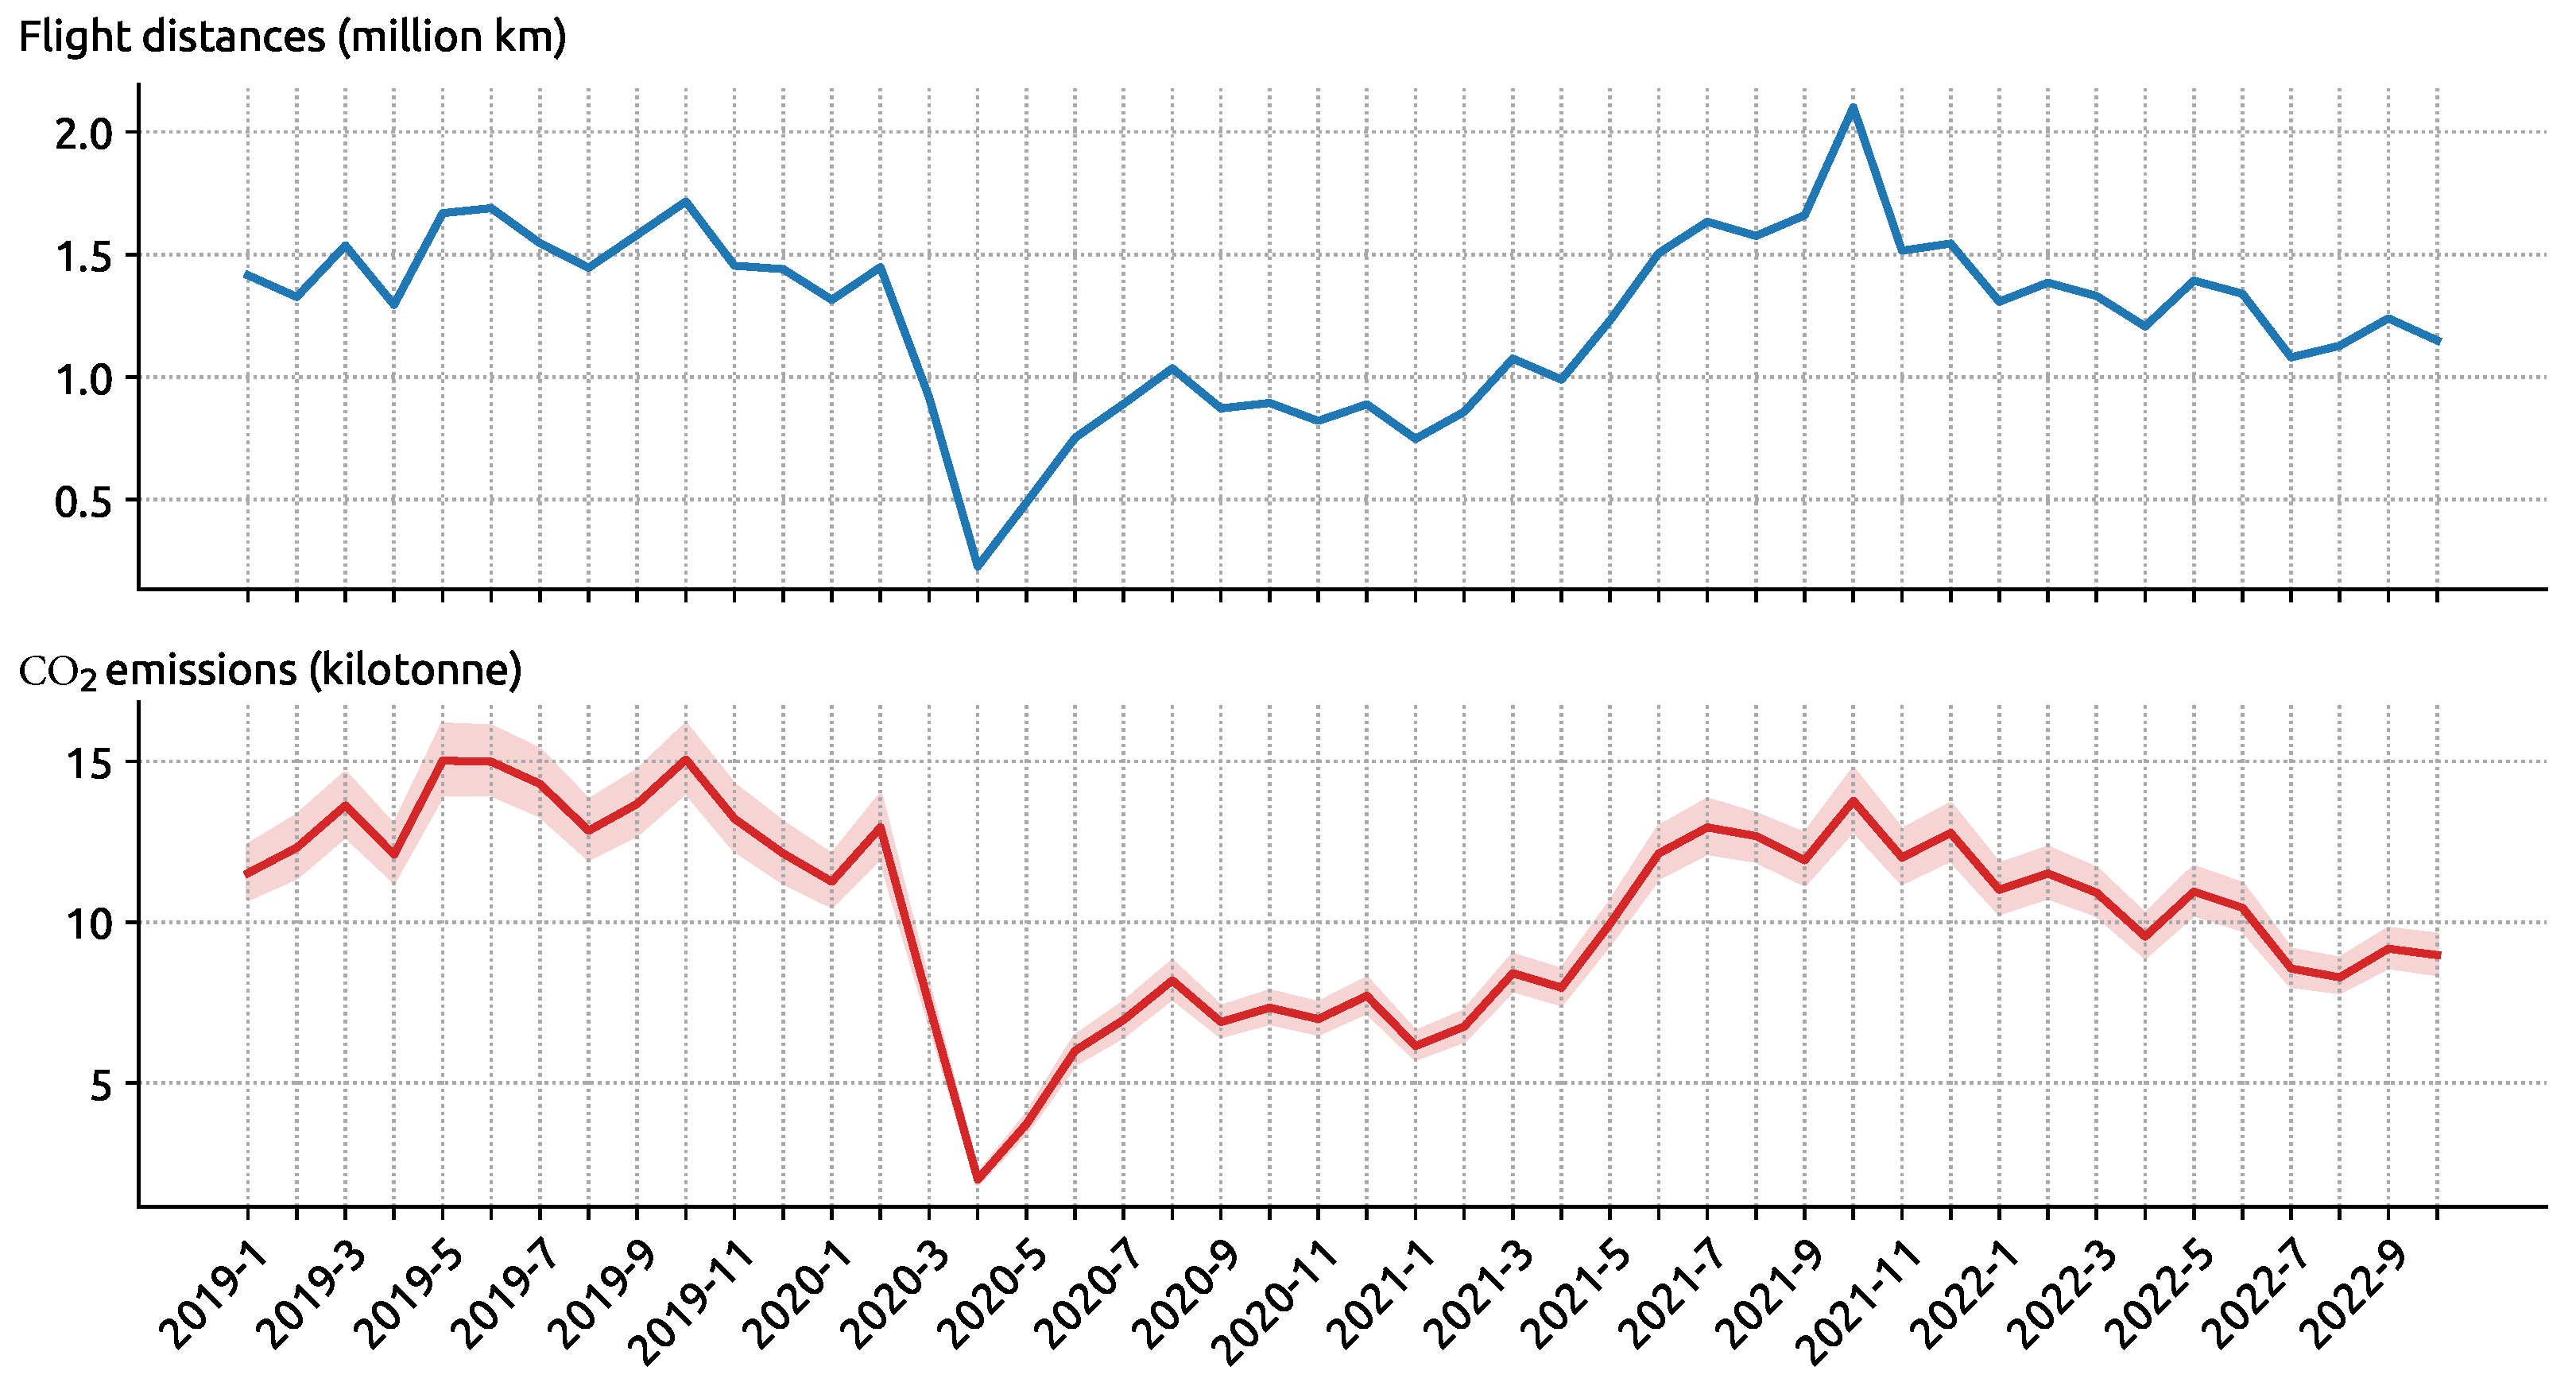
Figure 4 shows the monthly total flight distances of the approximately 250 selected private jets and their emissions over the past almost four years. It includes all of their flights that are tracked by the network. The total CO
2 emission from these selected aircraft is estimated to be between 0.45 and 0.5 megatonnes (approximately one year of emission in Greenland). The average yearly emission from these selected 250 jets is equivalent to approximate 45,000 people’s average emissions globally.
As we would expect, emissions are correlated with the distances. Before the COVID-19 pandemic, each month, all tracked private jets emitted around 15 kilotonnes (million kg) of CO2. Similar to commercial passenger flights, private flights (but not all jets) also saw a sharp decrease at the start of the pandemic and increased steadily again until the end of 2021. During the summer of 2021, the emission level reached the pre-pandemic level.
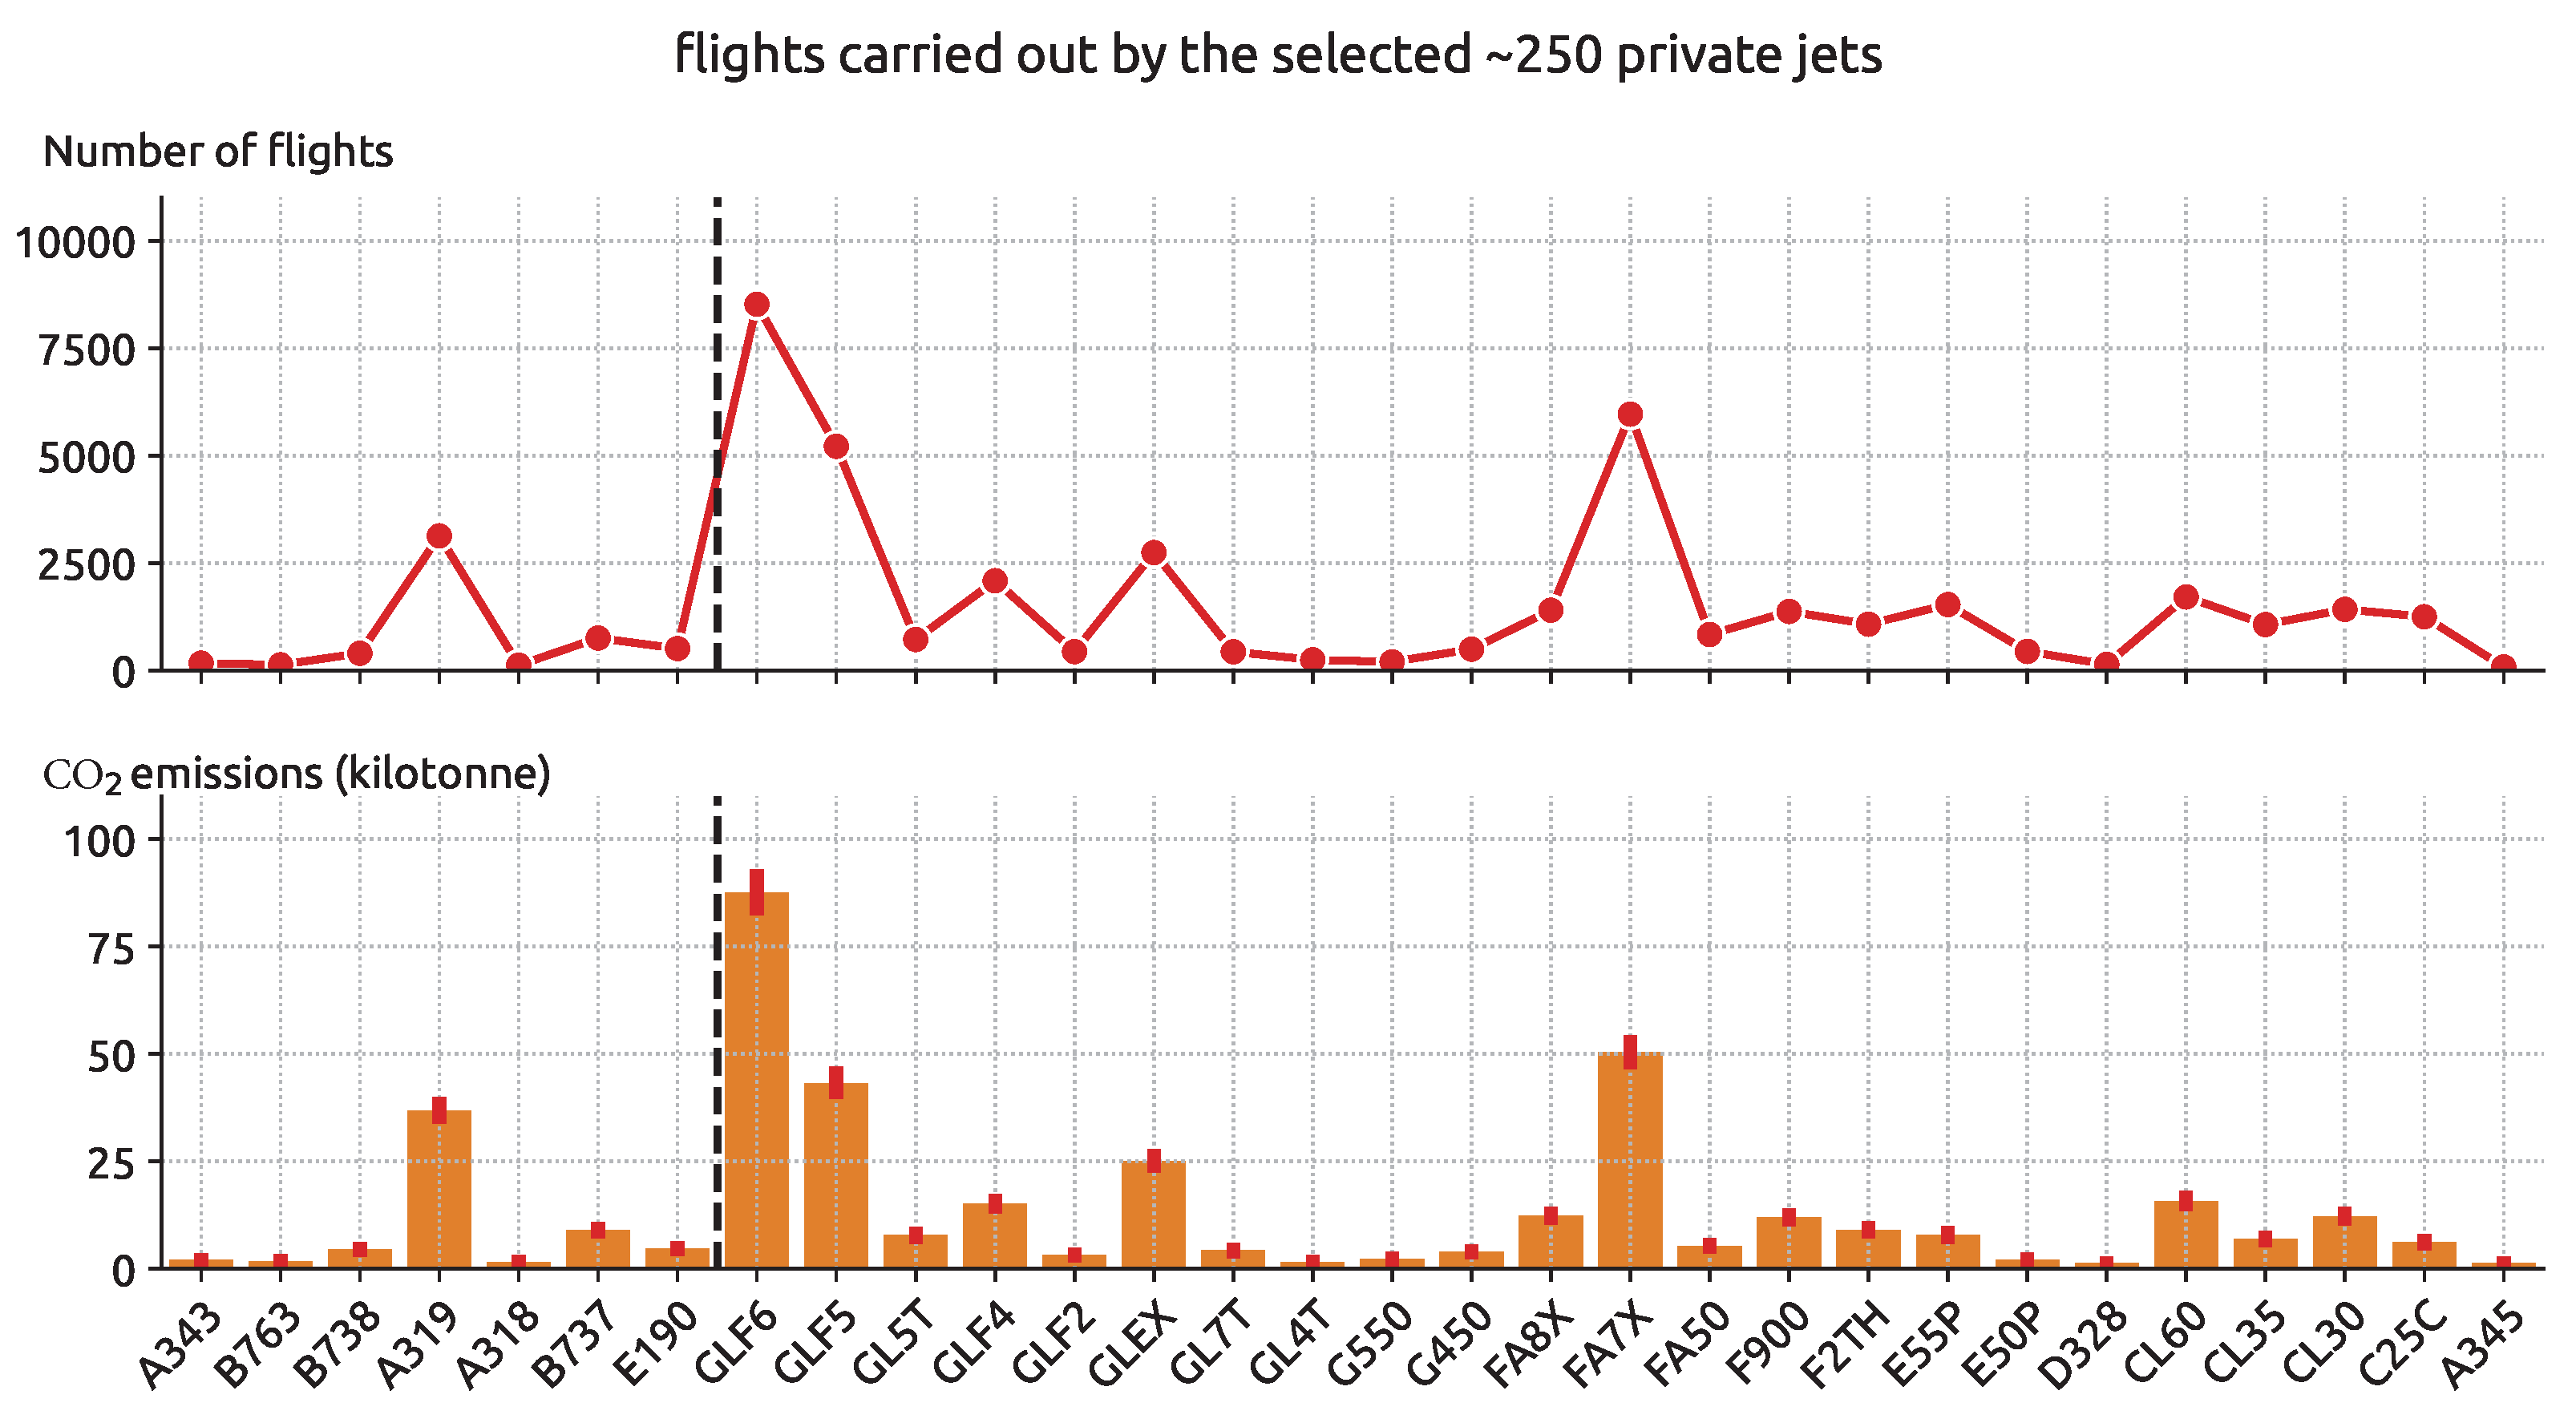
Figure 5 shows the number of flights and total emissions based on aircraft types. The most common three private jet types in our dataset are the Gulfstream G650 (
GLF6), Dassault Falcon 7X (
FA7X), and Gulfstream 5 (
GLF5). The Airbus A319 is also commonly used, often in its corporate jet version, despite being extremely emission-inefficient when carrying few passengers.
4.2. Individual Emissions
Even among private jet owners, emissions can vary greatly.
Figure 6 shows the total carbon emissions, the number of jets, and the number of flights associated with the top 60 individuals.
We can see that the total CO2 emissions range from 2 kilotonnes to nearly 25 kilotonnes between 2019 and 2022. It is worth noting that for some top emitters, there are often multiple private jets associated with the same owner, which are usually linked to companies they own. For example, Alexander Abramov owns several A319 aircraft through Evraz, and Roman Abramovich owns seven aircraft, including two Gulfstream G650, a Boeing 787, and a Boeing 767.
There are also business jets that belong to companies instead of particular individuals.
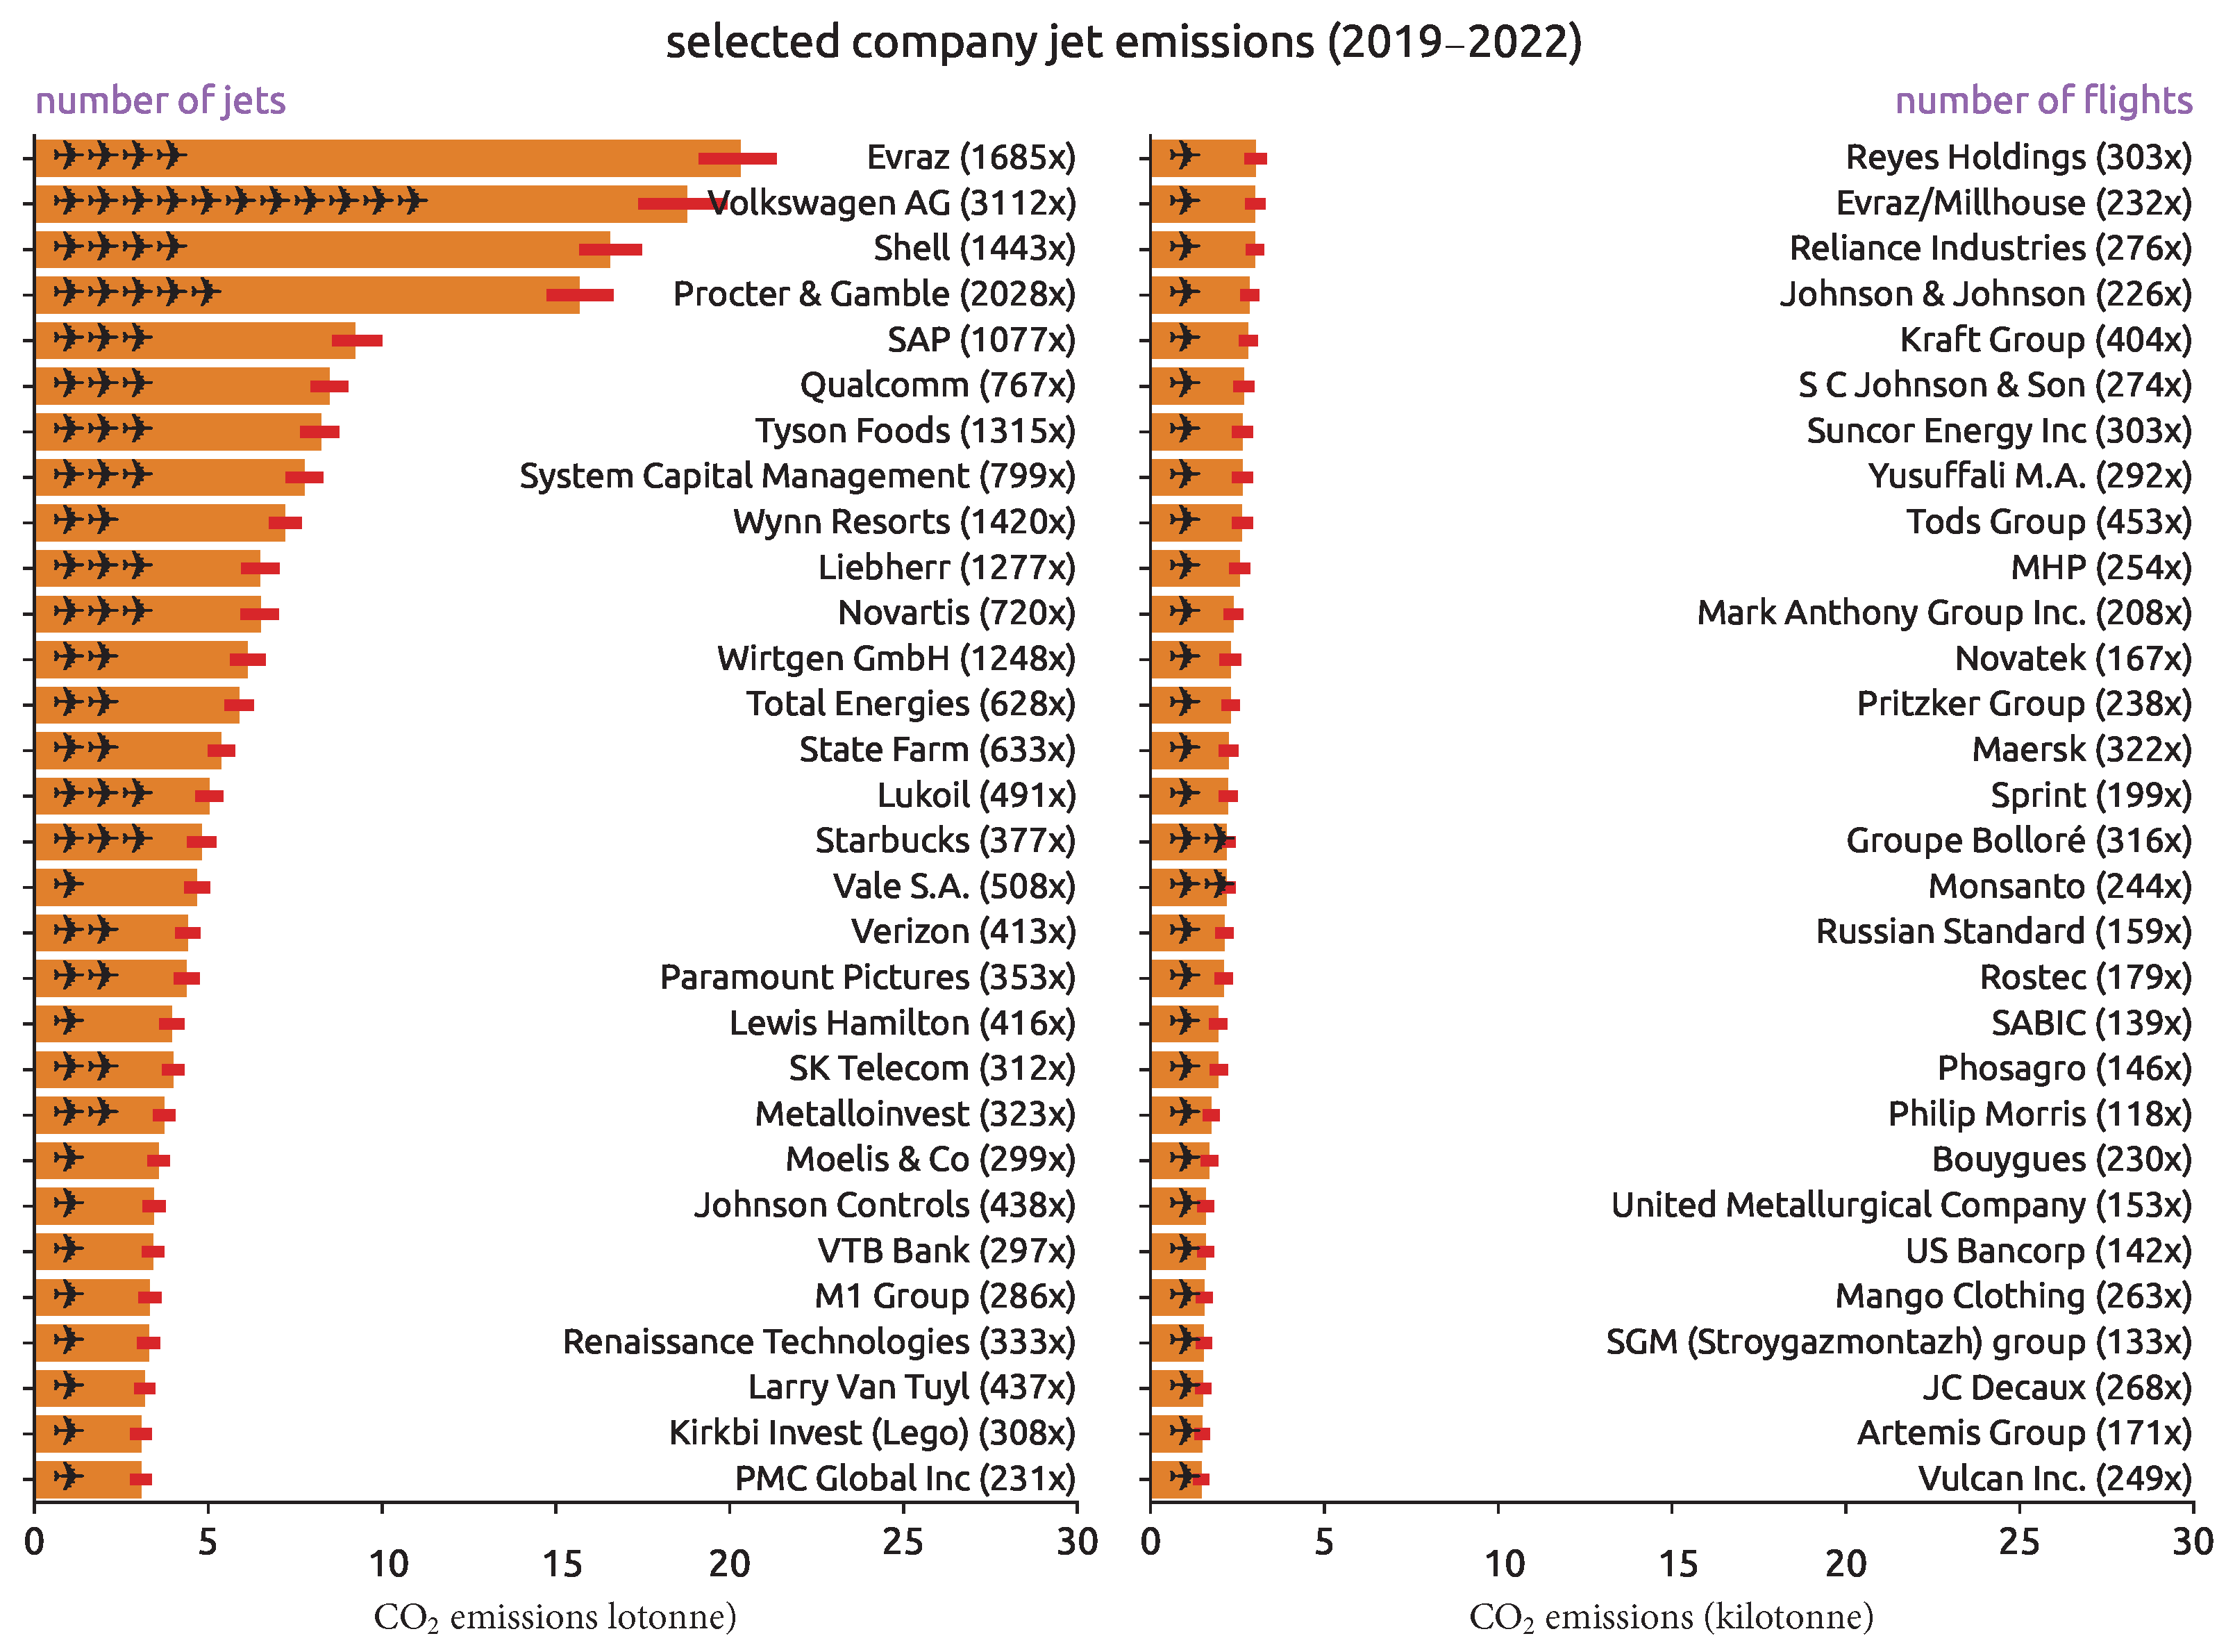
Figure 7 shows the emissions, the number of jets, and the number of flights for jets that are associated with companies. For example, several private jets belong to Volkswagen AirService, a subsidiary of Volkswagen AG, which is the second-largest CO
2 emitter for business jets after Evraz. Following Volkswagen, Shell is the third-largest emitter thanks to many flights carried out by their fleet of Falcon jets.
It is worth noting that not all flights in
Figure 6 are carried out by the owner of the aircraft. Especially for the top four emitters, it is hard to distinguish between a business or private flight, due to numerous associated aircraft. For those who own only one or two private jets (e.g., Bill Gates, Jeff Bezos, and Elon Musk), their movements are somewhat more certain. In any case, the final responsibility for the use of their jets lies with them.
4.3. Private Jet during Special Times
Based on the private jet flight data from January 2019 to October 2022, we can further analyze the impact global events had on the total emissions. The two major events we considered in this time period are the COVID-19 pandemic and the Russian invasion of Ukraine.
At the beginning of 2020, the COVID-19 pandemic caused a rapid contraction of all aviation activities globally. In
Figure 1, we can see overall decreases for both commercial and private flights during this period. However, not all private jet owners stopped flying during this period.
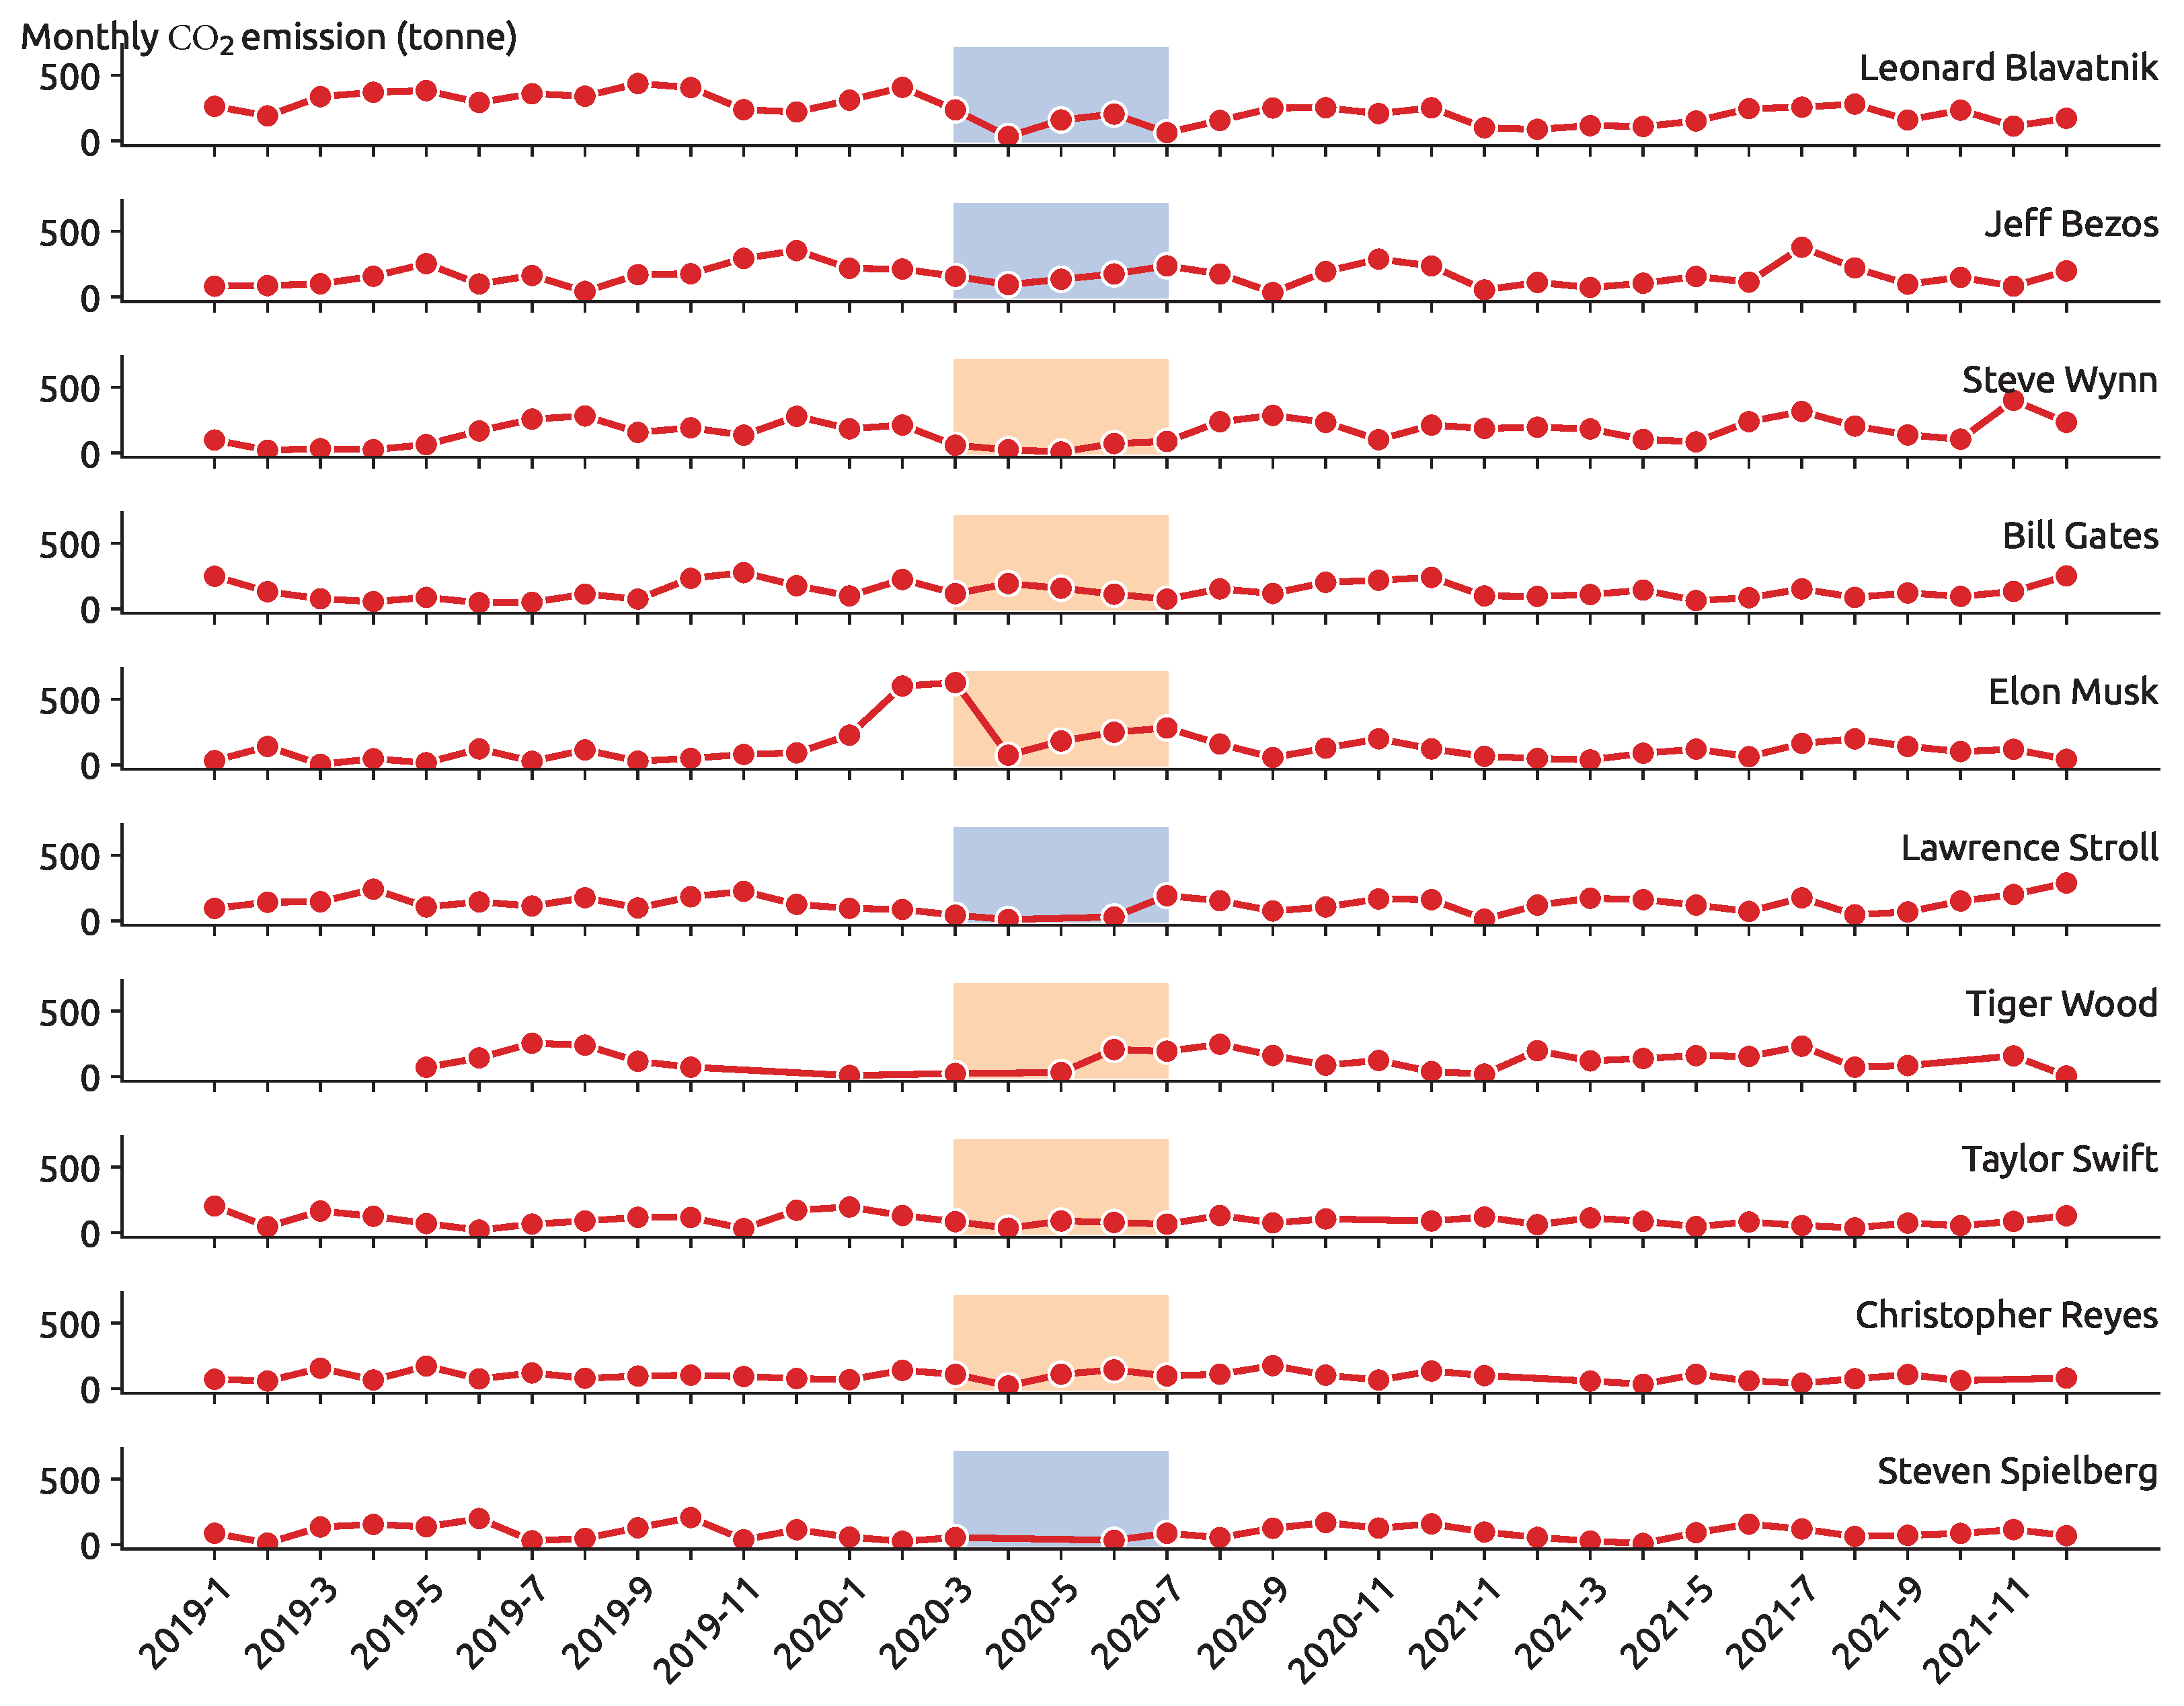
Figure 8 shows the monthly emissions from the top 10 private jet emitters in our sample from 2019 to 2021 in the United States. Between March and July 2020, while much of the rest of the world entered the lockdown, many private jets were still flying. In this figure, we marked the emissions from this period with two different colors. Blue shows a significant decrease in flight activities, while orange shows no significant change in emissions compared to other periods.
In 2022, the invasion of Ukraine triggered sanctions on Russia, which have significantly impacted the activities of Russian private jet owners. In
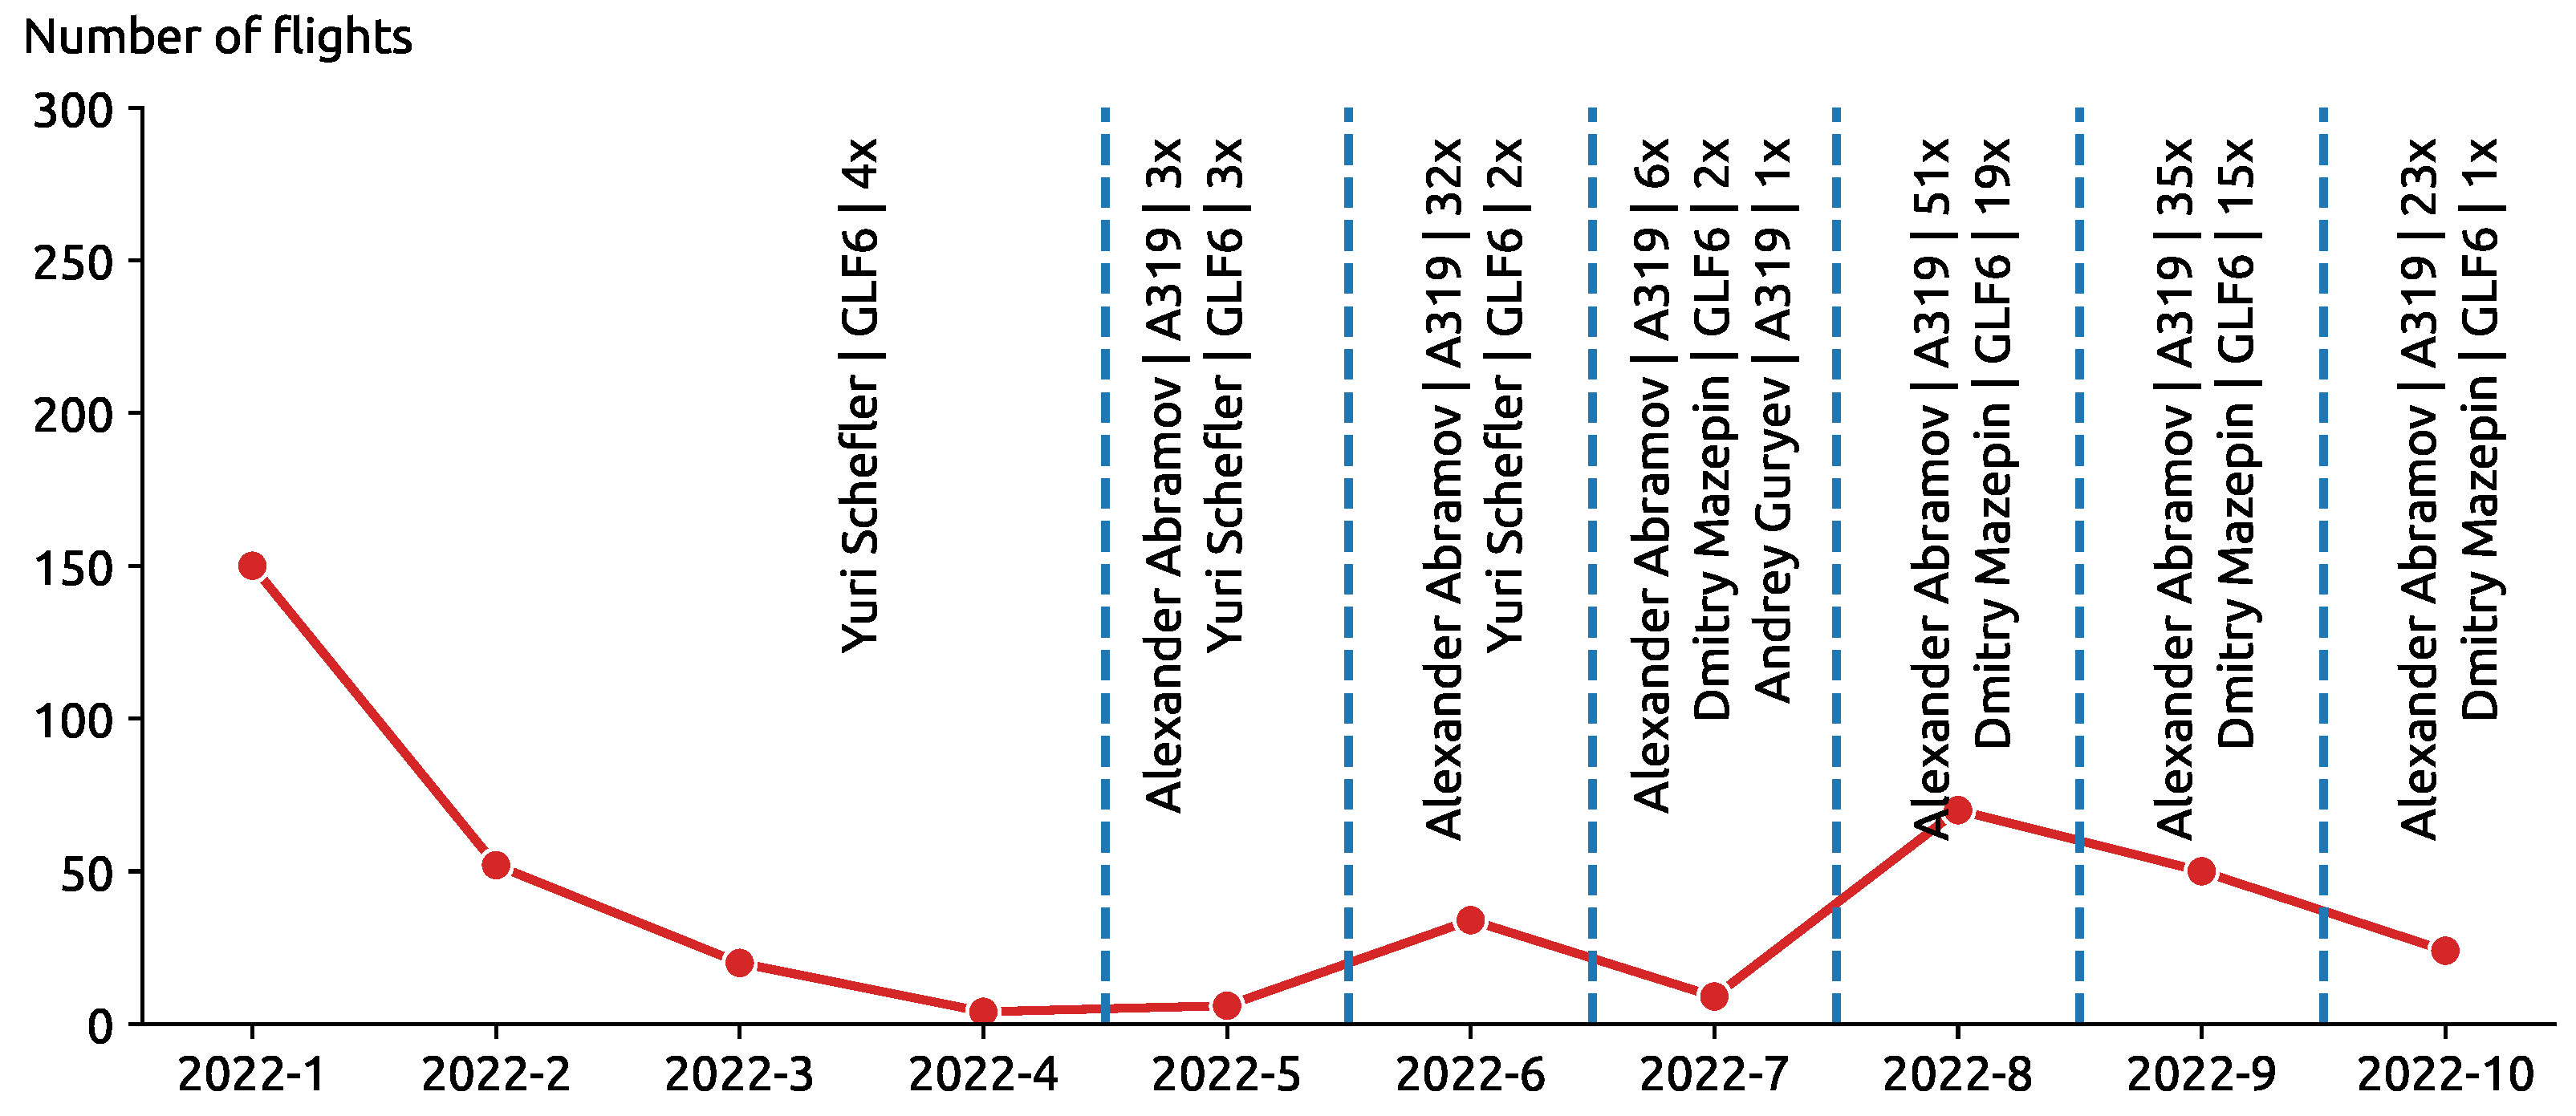
Figure 9, we illustrate the drastic decrease in private flights carried out by Russian owners.
Before March 2022, there were around 200 monthly flights carried by around 30 Russian individuals from the OpenSky dataset. After the introduction of sanctions, private jets from several individuals are still flying. Without additional sources, we cannot infer whether these individuals themselves traveled, but their private jets continued making trips from March until the time of writing (November 2022).
4.4. Spatial Analysis
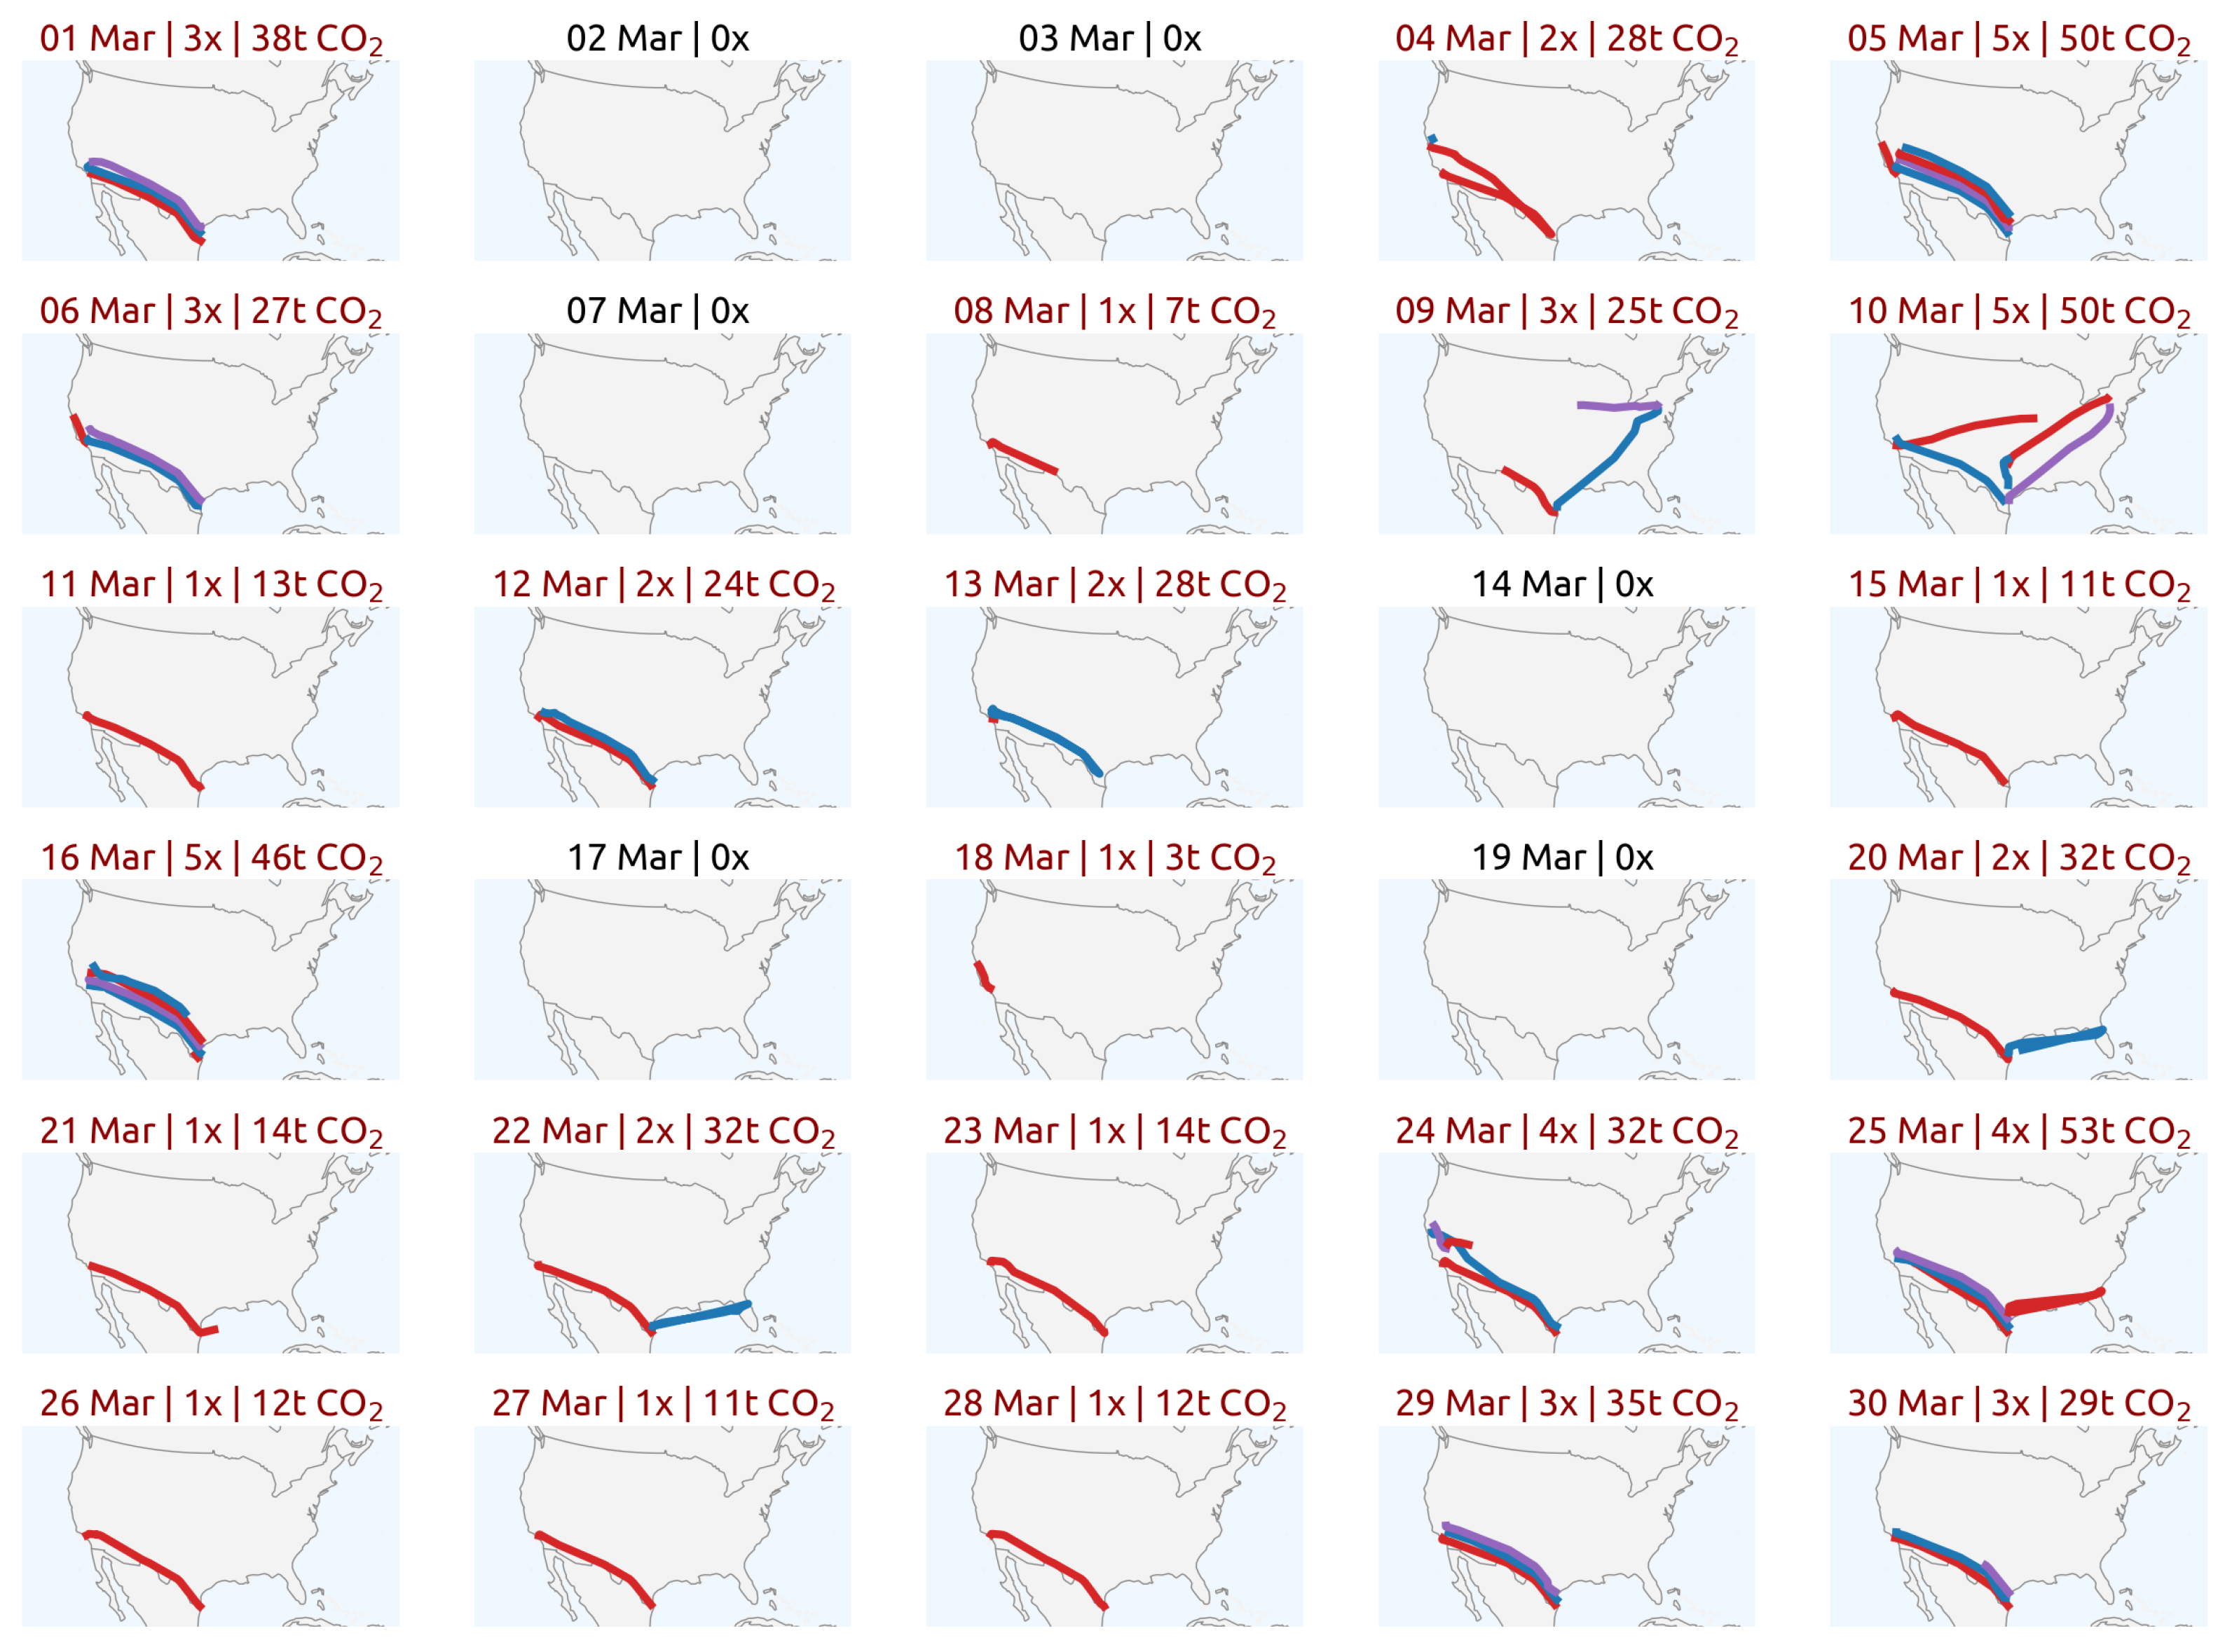
Finally, based on the detailed flight data from the OpenSky historical database, we can provide a further analysis of individual private jets and their emissions over an extended period of time. For example,
Figure 10 shows around 50 tips carried out by Elon Musk in March 2020 alone, which count for approximately 600 tons of CO
2. Notably, this represents more than 120 average global inhabitant CO
2 emissions in 2020.
5. Limitations
This study has a few limitations, mainly regarding the data quality. First, the OpenSky database is maintained by volunteering efforts from researchers and enthusiasts. The data can sometimes be subject to
astroturfing by malicious actors [
10]. Therefore, it is difficult to have a complete overview of all private jets. As many countries provide certain levels of anonymity for private jet owners, it is hard to relate the aircraft transponder code to its owners. However, with social media, such efforts have become easier.
Secondly, it is difficult to capture accurate ownership over time, for example, when the ownership of an aircraft is transferred or when the aircraft is re-registered in a different country. Some flights in the dataset could in theory be carried out by commercial airliners or small gliders that have acquired transponder codes from previous private jets. This requires better maintenance of the aircraft database.
Finally, the OpenSky Network currently only has comprehensive coverage in Europe and North America. Private flights in other regions, such as Asia and the Middle East, are missing outside of the main population centers. In addition, many private jets also fly to remote islands where there is no ADS-B coverage.
Despite these limitations on the data quality, we maintain that out results are correct. We focused on a sample of high-profile private and corporate jets where it was feasible to manually verify at least the current aircraft owners.
6. Conclusions
Over the past few years, increased concerns about the sustainability of aviation have been raised by society, researchers, and policymakers. While much research has focused on commercial aviation, private and business jets actually have a disproportionate emission footprints due to their exclusiveness, very few passengers are flying with high frequency without causing concern about their environmental impact.
In this study, we make use of the OpenSky historical data and open aircraft performance and emission models to conduct an in-depth analysis of the emissions caused by a subset of around 250 private and business jets. We make use of the flight data collected by the OpenSky Network from January 2019 to October 2022 to show the emissions caused by private and business jets known to OpenSky.
We started with the basic processing of the flight data and a discussion of the emissions-estimation process. The analyses focus on the overall emissions, the emissions from individual owners and companies, and the emissions from private jets at specific times. We also provide a simple overview of one month of 50 flights from one jet, which illustrates the extraordinary inequality of aviation emissions caused by wealthy individuals.
Future work will focus on improving the data quality regarding private jets using public information, and chartered private jets will be further included in the analysis to construct a clearer picture of the use of light jets globally. To mitigate data limitations, better coverage and space-based ADS-B are both possible future solutions.
Author Contributions
Conceptualization, J.S. and X.O.; methodology, J.S.; software, J.S. and X.O.; validation, J.S., X.O. and M.S.; formal analysis, J.S. and X.O.; investigation, J.S.; resources, J.S., X.O. and M.S.; data curation, J.S., X.O. and M.S.; writing—original draft preparation, J.S.; writing—review and editing, J.S., X.O. and M.S.; visualization, J.S. All authors have read and agreed to the published version of the manuscript.
Funding
This research received no external funding.
Institutional Review Board Statement
Not applicable.
Informed Consent Statement
Not applicable.
Data Availability Statement
Conflicts of Interest
The authors declare no conflict of interest.
References
- Sun, J.; Basora, L.; Olive, X.; Strohmeier, M.; Schafer, M.; Martinovic, I.; Lenders, V. OpenSky Report 2022: Evaluating Aviation Emissions Using Crowdsourced Open Flight Data. In Proceedings of the 41th IEEE/AIAA Digital Avionics Systems Conference (DASC), Portsmouth, VA, USA, 18–22 September 2022; p. 8. [Google Scholar]
- Strohmeier, M.; Olive, X.; Lübbe, J.; Schäfer, M.; Lenders, V. Crowdsourced air traffic data from the OpenSky Network 2019–2020. Earth Syst. Sci. Data 2021, 13, 357–366. [Google Scholar] [CrossRef]
- Doumbia, T.; Granier, C.; Elguindi, N.; Bouarar, I.; Darras, S.; Brasseur, G.; Gaubert, B.; Liu, Y.; Shi, X.; Stavrakou, T.; et al. Changes in global air pollutant emissions during the COVID-19 pandemic: A dataset for atmospheric modeling. Earth Syst. Sci. Data 2021, 13, 4191–4206. [Google Scholar] [CrossRef]
- Zhao, Y.; Huang, J.; Zhang, L.; Chen, S.; Gao, J.; Jiao, H. The global transmission of new coronavirus variants. Environ. Res. 2022, 206, 112240. [Google Scholar] [CrossRef] [PubMed]
- Schäfer, M.; Strohmeier, M.; Lenders, V.; Martinovic, I.; Wilhelm, M. Bringing up OpenSky: A large-scale ADS-B sensor network for research. In Proceedings of the 13th International Symposium on Information Processing in Sensor Networks, Berlin, Germany, 15–17 April 2014; pp. 83–94. [Google Scholar]
- Zhang, X.; Chen, X.; Zhang, L.; Wang, J. A Number-Based Inventory of Particle Emissions by Civil Aviation and the Influences on the Particle Number Concentration near Zurich Airport. In Proceedings of the 7th OpenSky Workshop, Zurich, Switzerland, 21–22 November 2019; pp. 109–116. [Google Scholar]
- Statista. Global CO2 Emissions per Capita 1960–2020. Available online: https://www.statista.com/statistics/268753 (accessed on 16 December 2022).
- Olive, X. Traffic, a toolbox for processing and analysing air traffic data. J. Open Source Softw. 2019, 4, 1518. [Google Scholar] [CrossRef]
- Sun, J.; Hoekstra, J.M.; Ellerbroek, J. OpenAP: An open-source aircraft performance model for air transportation studies and simulations. Aerospace 2020, 7, 104. [Google Scholar] [CrossRef]
- Strohmeier, M.; Olive, X.; Sun, J. Evading the Public Eye: On Astroturfing in Open Aviation Data. In Proceedings of the 10th OpenSky Symposium, Delft, The Netherlands, 10–11 November 2022. [Google Scholar]
| Disclaimer/Publisher’s Note: The statements, opinions and data contained in all publications are solely those of the individual author(s) and contributor(s) and not of MDPI and/or the editor(s). MDPI and/or the editor(s) disclaim responsibility for any injury to people or property resulting from any ideas, methods, instructions or products referred to in the content. |
© 2022 by the authors. Licensee MDPI, Basel, Switzerland. This article is an open access article distributed under the terms and conditions of the Creative Commons Attribution (CC BY) license (https://creativecommons.org/licenses/by/4.0/).
