Proceeding Paper

Modelling the Energy and Ventilation in Passenger Transportation Vehicles †

by
Margarida Conceição
1,
Maria Inês Conceição
1,
Eusébio Conceição
2,3,*,
Maria Manuela Lúcio
2,
João Gomes
4 and
Hazim Awbi
5
1
Instituto Superior Técnico, Universidade de Lisboa, 1049-001 Lisboa, Portugal
2
Faculdade de Ciências e Tecnologia, Universidade do Algarve, Campus de Gambelas, 8005-139 Faro, Portugal
3
Associação para o Desenvolvimento da Aerodinâmica Industrial, Departamento de Engenharia Mecânica, Universidade de Coimbra, Rua Luís Reis Santos, Pólo II, 3030-788 Coimbra, Portugal
4
Instituto Superior de Engenharia, Universidade do Algarve, 8005-139 Faro, Portugal
5
School of the Built Environment, University of Reading, Reading RG6 6AW, UK
*
Author to whom correspondence should be addressed.
Presented at the 1st International Online Conference on Inventions, Energy Security and Sustainable Development, Online, 25–26 June 2026; Available online: https://sciforum.net/event/IOCIV2026.
Eng. Proc. 2026, 152(1), 11; https://doi.org/10.3390/engproc2026152011
Published: 14 September 2026
(This article belongs to the Proceedings of The 1st International Online Conference on Inventions)

Abstract

This study develops a new passive ventilation system for a passenger train. This ventilation system comprises a supply air system and an exhaust air system; it improves indoor air quality and uses only the pressure field generated by the movement of the train as its energy source. Air from the supply air system enters the exterior upper front of the train and exits at the interior lower lateral of the train. Air from the extraction air system enters the interior upper ceiling of the train and exits at the rear upper exterior of the train. In the study, a train comprising five closed compartments was considered. Each compartment is equipped with 16 seats and two tables, accommodating 16 passengers. In general, a vehicle velocity above 17.75 m/s generally ensures acceptable indoor air quality for a general occupancy of 80 passengers.

1. Introduction

Integral and differential methods are used to assess indoor air quality (IAQ). The former methods evaluate IAQ in a comprehensive manner. This method takes into account the flow of contaminants entering and exiting ducts and spaces using first-order mass balance integral equations [1]. In differential methods, IAQ is evaluated in detail by discretizing the space into nodes. In this method, the flow of contaminants entering and leaving the different nodes and between the different nodes is considered using second-order balance differential equations [2]. In this study, the first scenario will be considered.
Interior spaces, such as those in public transportation vehicles or other types of spaces with high occupancy levels, require a more detailed analysis to ensure a high level of IAQ. This type of analysis, in addition to being very important under any circumstances, is now the subject of even more detailed scrutiny in the wake of the COVID-19 pandemic.
The application of passive methods in vehicle ventilation is based on a philosophy of improving air quality using natural methods that rely on the vehicle’s movement. In other words, this involves using a duct system with inlets and outlets at strategic points on the vehicle so that the supply ducts allow air to enter the occupied space, and the exhaust ducts allow air to exit the occupied space. This philosophy is ensured by calculating the pressure distribution on the vehicle’s surrounding surface, utilizing the areas of positive pressure at the inlets of the air supply ducts in the occupied space and the areas of negative pressure at the outlets of the exhaust ducts in the occupied space (Silva) [3].
To numerically evaluate IAQ, this study uses energy and mass balance integral equations applied to the supply and exhaust duct system. These second-order energy balance integral equations account for pressure, kinetic, and potential energy, as well as local and continuous energy losses. These equations are applied to each path. The mass balance integral equations account for the mass flow entering and leaving each node (Conceição et al.) [4].
In the numerical evaluation of IAQ using Computational Fluid Dynamics (CFD) techniques, several authors have published studies. Songbo et al. [5] presented a study about air quality improvement in train compartments, and Songbo et al. [6] also published a study of train compartments but in flow field patterns. Another study, developed by Zhang et al. [7], presented an optimization design of air supply uniformity in a metro vehicle, and Wu et al. [8] analyzed displacement and mixing ventilation in a high-speed train cabin. In both studies, CFD techniques were used.
In the thermal comfort level evaluation, Fanger’s model, the PMV (Predicted Mean Vote) index is used; see Fanger [9], ASHRAE 55 [10] and ISO 7730 [11]. To evaluate IAQ, the airflow rate and the concentration of contaminants, according to ASHRAE-62.1 [12], ASHRAE-62.2 [13] and Portaria 353-A/2013 [14], are used. To evaluate the thermal comfort and indoor air quality, simultaneously, the following standards were used: ISO 17772-1 [15], ISO/TR 17772-2 [16], EN 16798-1 [17] and EN 16798-2 [18].
The main objective of this study is to evaluate IAQ in vehicles using passive ventilation concepts. A numerical model will be developed using a system of second-order energy and mass balance integral equations, solved using Newton’s method. The air intake is located in the upper front section of the vehicle, with positive pressures, and the air exhaust is located in the upper rear section of the vehicle, with negative pressures. This calculation will evaluate the volumetric air flow rate and the air exchange rate for various vehicle speeds. These values will be compared with the recommended values based on existing standards.

2. Numerical Model and Methodology

This section of the paper presents the numerical model that was developed and the numerical methodology used, specifically the geometry and the simulation conditions.

2.1. Numerical Model Applied in the Simulation

The numerical model uses a system of energy and mass balance integral equations.
In passive ventilation, the second-order energy balance integral equations and the mass balance integral equations are considered for evaluating the air velocity and airflow rate in each duct. The energy balance integral equations account for kinetic, potential, and pressure energy, as well as local and continuous energy losses in each trajectory. The mass balance integral equations account for the mass flux in each node or junction; see Conceição et al. [4].
The numerical model, built using a set of energy and mass balance integral equations, calculates the air velocity in each duct. The number of equations is equal to the number of individual ducts.
The mass balance integral equations, at each node or junction, state that the sum of the incoming mass flow rates equals the sum of the outgoing mass flow rates. In this case, the nodes or junctions are located in the pipes and in each of the train compartments.
The energy balance integral equations consider, for each independent flow path, the kinetic energy, potential energy, pressure energy, and energy losses (localized and continuous). In passive ventilation, where the duct inlets and outlets are located on the exterior of the train, the energy associated with pressure, derived from the train’s speed, is used to drive the flow through the duct system: localized inflow at the upper front surfaces with positive pressure and localized outflow at the upper rear surface with negative pressure. Continuous energy losses are measured along each duct, while localized energy losses are measured at the duct inlet, inlet grilles, bends, T-joints, constrictions and expansions, outlet grilles, outlets, and other constraints that are present.
The airflow rate at the inlet, which is equal to the airflow rate at the outlet, in each train compartment, is used to calculate the airflow rate in each space. This information is used to evaluate IAQ. In the evaluation process, the calculated airflow rate was compared with the airflow rate specified by international standards, considering the number of occupants.
The airflow rate, which influences the internal carbon dioxide concentration, is considered in the IAQ evaluation. However, the airflow rate depends on the vehicle velocity. When the train velocity increases, the internal airflow rate also increases.

2.2. Numerical Methodology Applied in the Simulation

The study considers a train carriage consisting of five closed compartments. Each compartment, with sixteen people seated, has on each side (right and left) a central table and two benches, each occupied by two people on either side of each table.
Each carriage is equipped with a supply ventilation opening and an exhaust opening. The air supply system, with air entering at the upper front section of the carriage, has air outlets at the lower side of each compartment through two supply grilles located on each side of the compartment. The exhaust system, with an air outlet at the upper rear of the carriage, has air inlets at the top of each compartment through two exhaust grilles located on each side of the compartment, above the table area. In this configuration, airflow in each compartment enters at the lower side and exits at the top outlet located above each table.
Figure 1 shows a schematic diagram of the train carriage, divided into five compartments, along with the supply ventilation system (in red) and the exhaust ventilation system (in pink). In Figure 1a,b, the green and blue areas correspond to the panels and the windows, respectively.
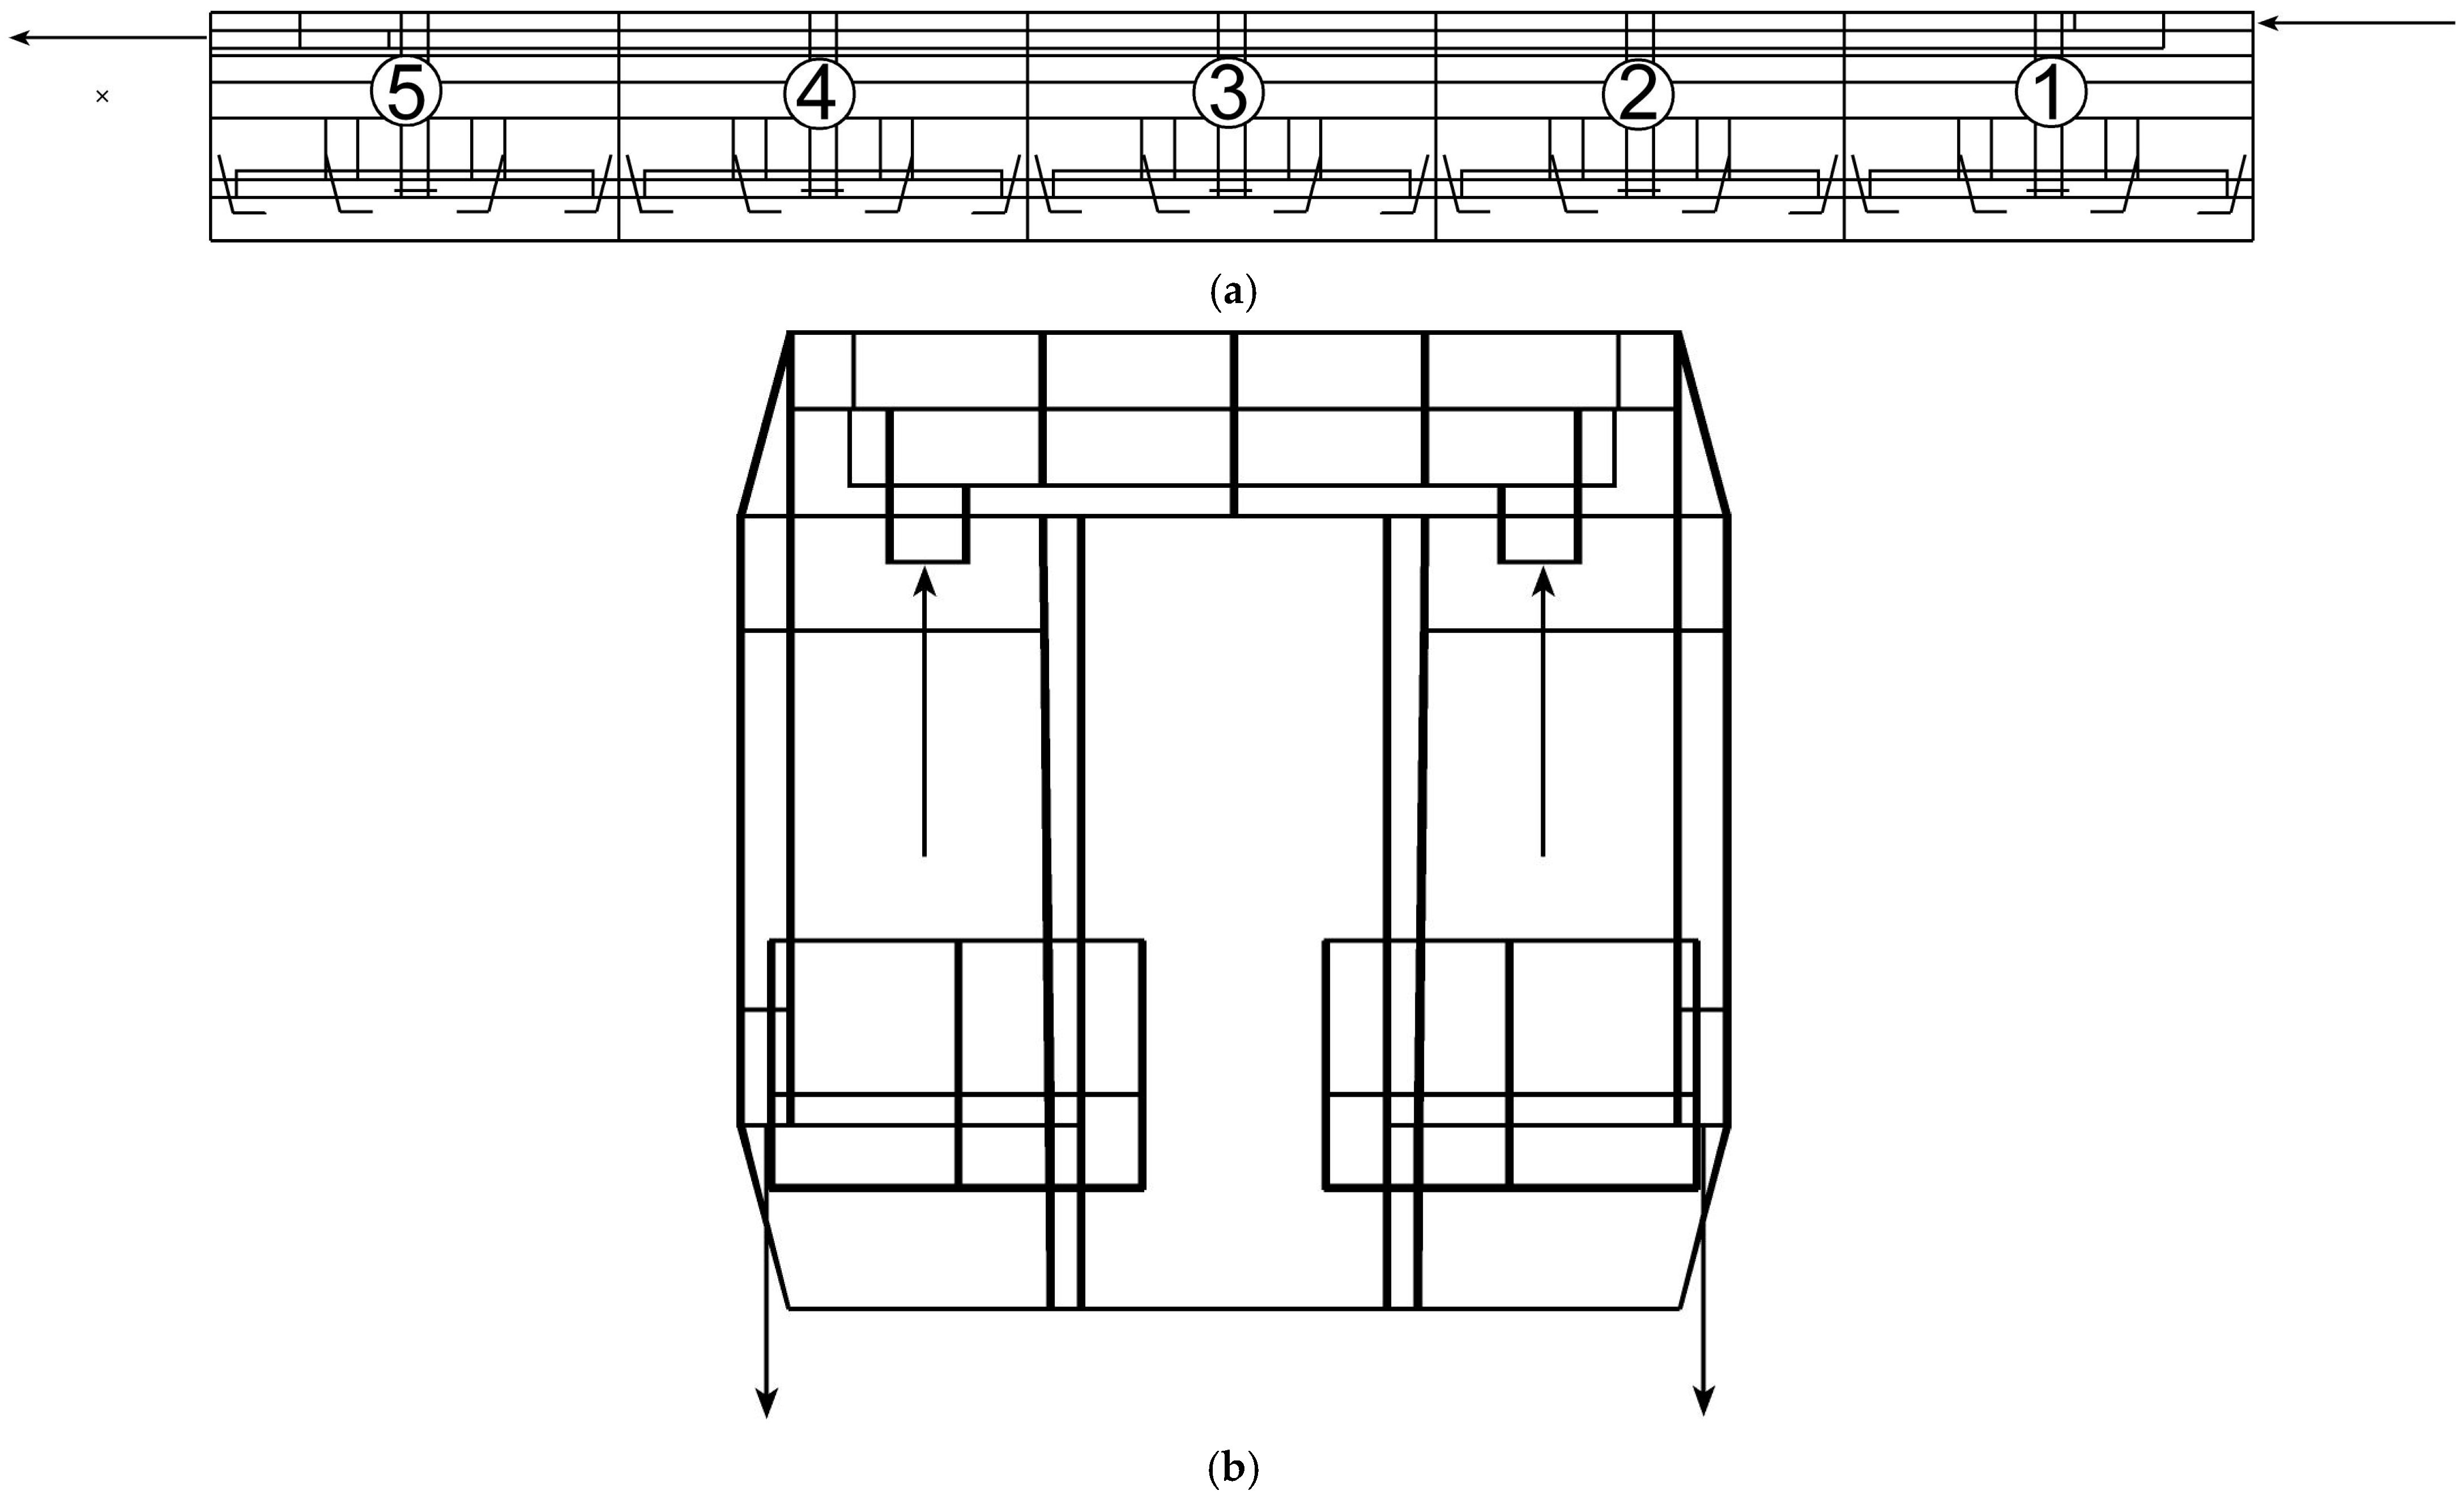
Figure 2 shows a diagram of the air inlets for the supply system and the air outlet for the exhaust system on the exterior of the train (see Figure 2a), as well as the air outlet for the supply system and the air inlets for the exhaust system inside the train compartments (see Figure 2b).
As previously mentioned, the train consists of five compartments. The compartment located at the air supply inlet is identified as number 1, and the compartment located at the air exhaust outlet is identified as number 5 (see Figure 2a).
According to Portaria 353-A/2013 [14], to ensure a good level of IAQ, an airflow rate of 24 m3/h per person is recommended. In this case, given that each compartment is occupied by 16 people, an airflow rate of 5 × 16 × 24 m3/h is recommended.
In this study, since a global perspective is used, it is assumed that there is a perfect and homogeneous mixing of contaminants within each occupied space. A detailed analysis, taking a differential perspective into account, will be conducted in future studies. In this type of study, using Computational Fluid Dynamics simulations, the actual airflow will be analyzed in detail, taking into account the airflow inlets and outlets as well as the positioning of the seats and passengers.

3. Results and Discussion

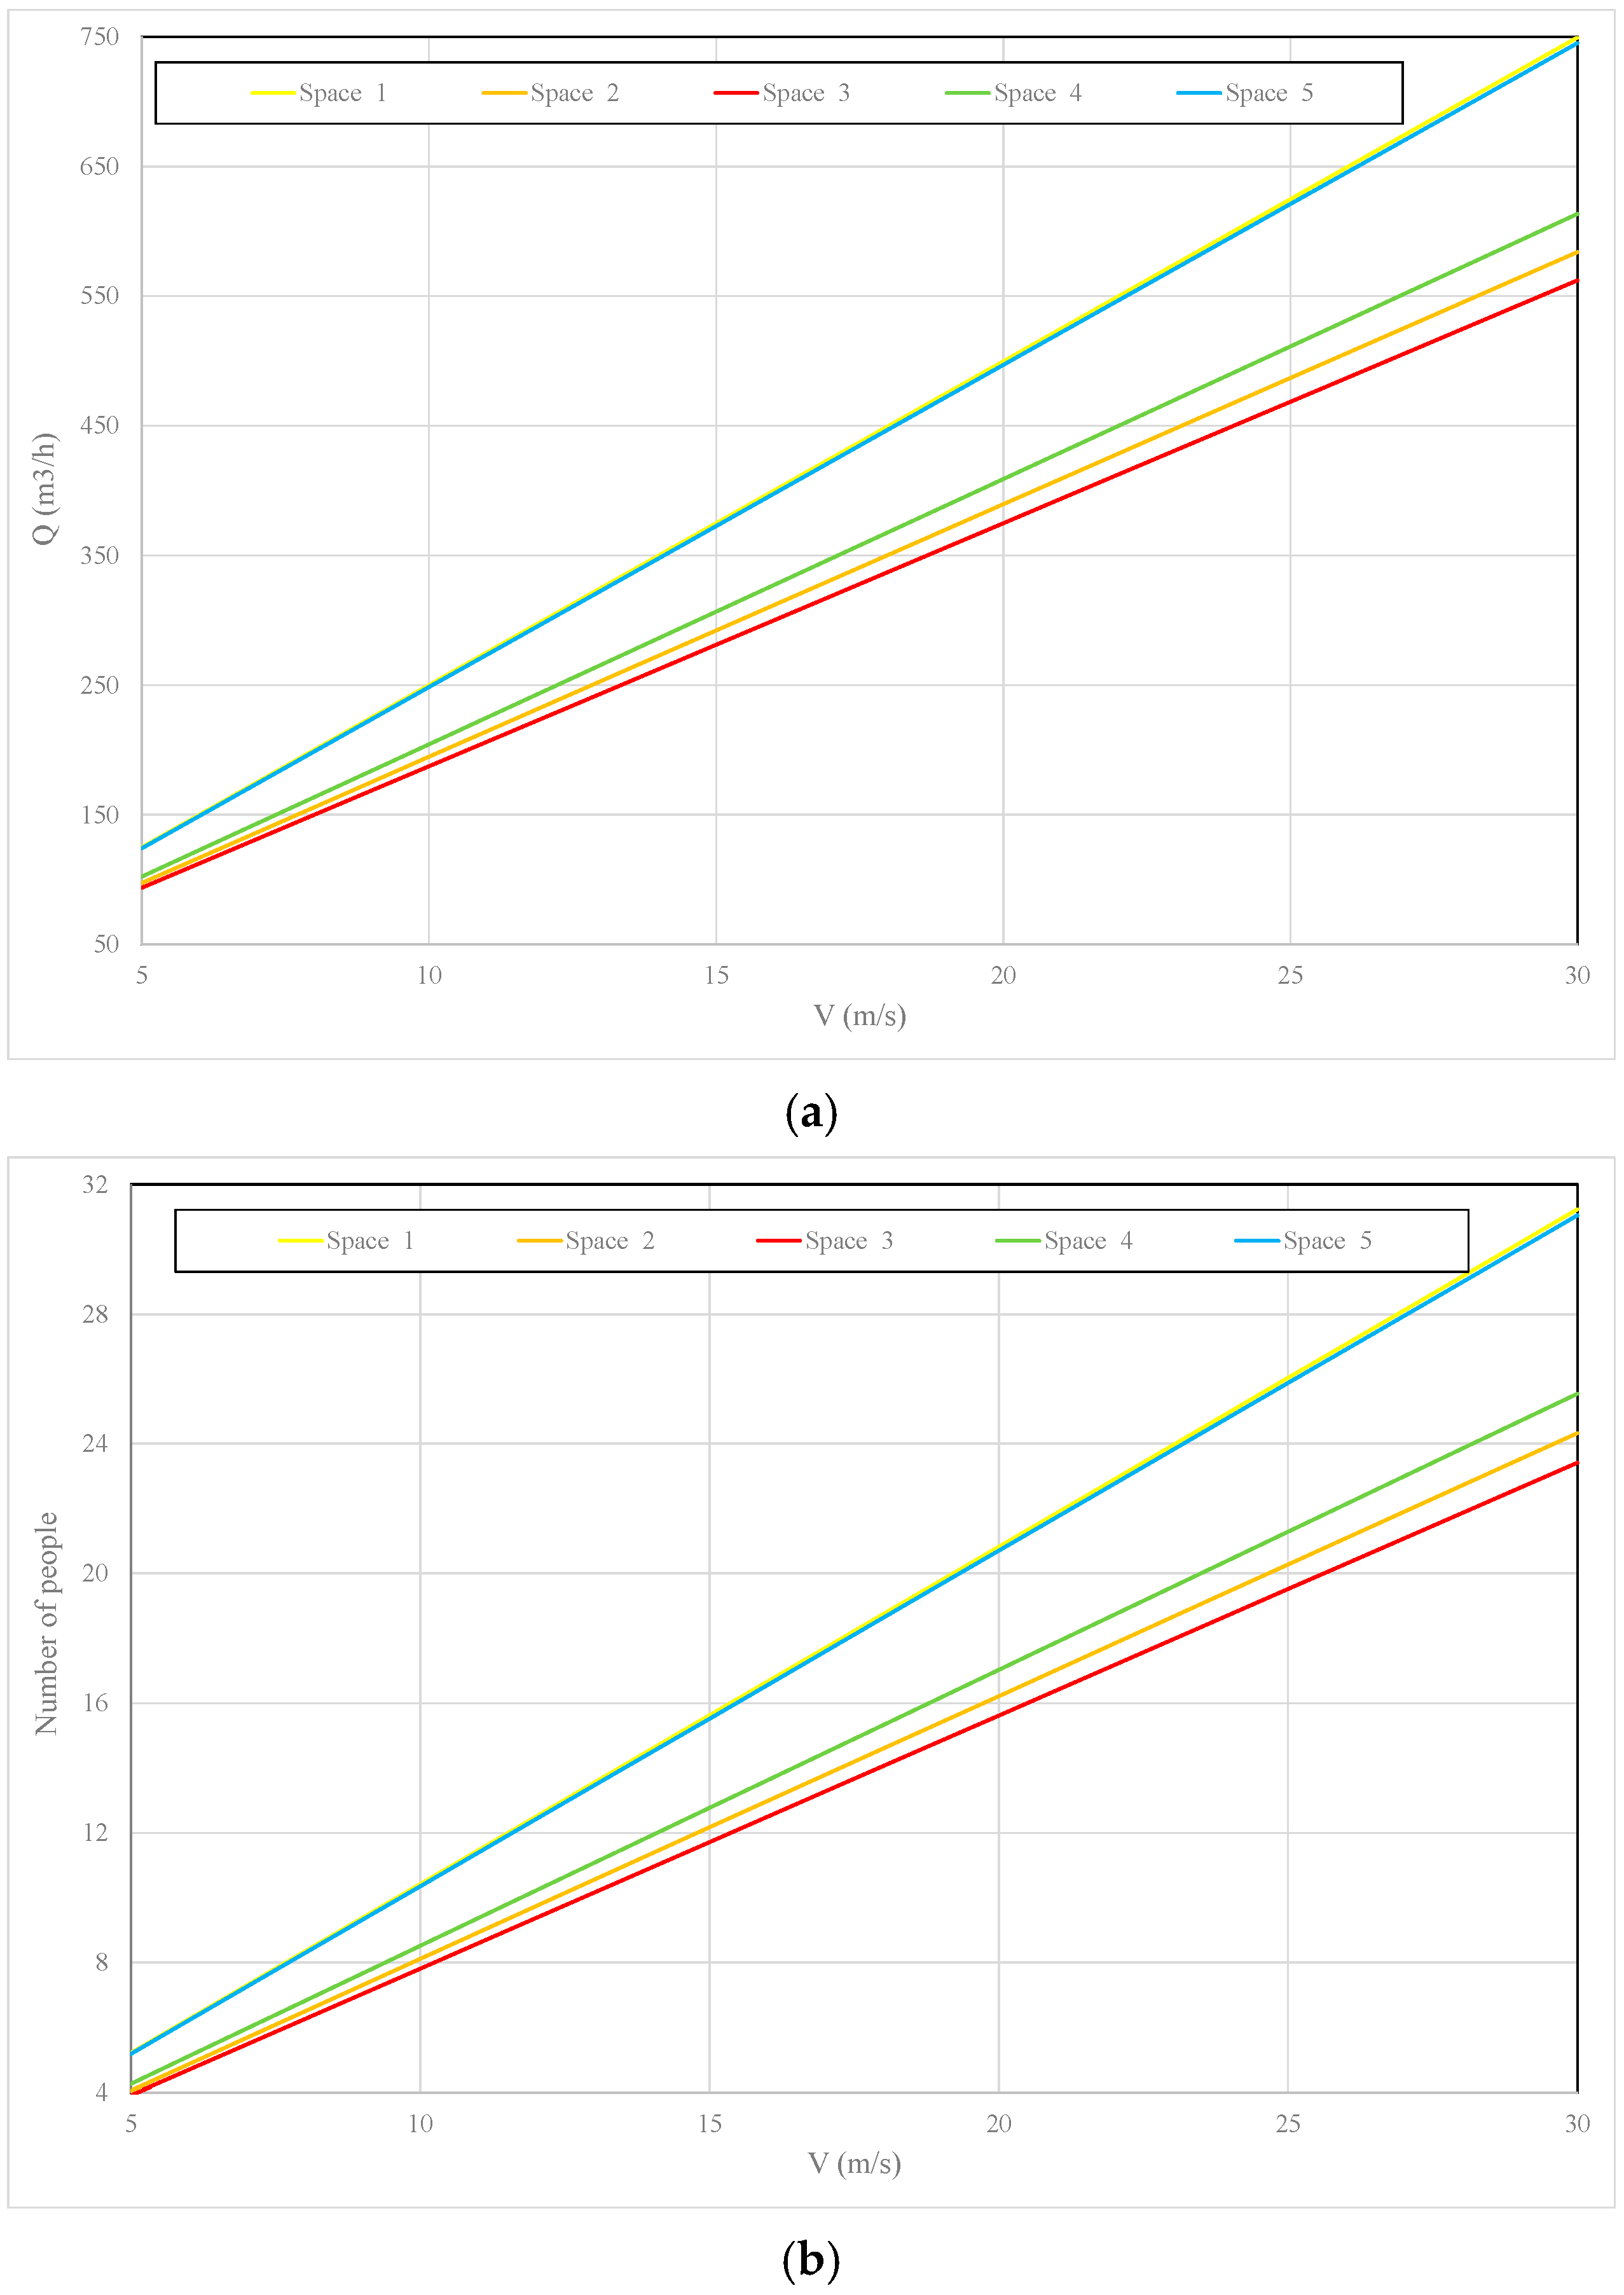
This section presents results of the air recirculation flow rate in each compartment as a function of the train carriage’s speed (see Figure 3a). This section also presents results regarding the number of people with an acceptable air recirculation flow rate (see Figure 3b).
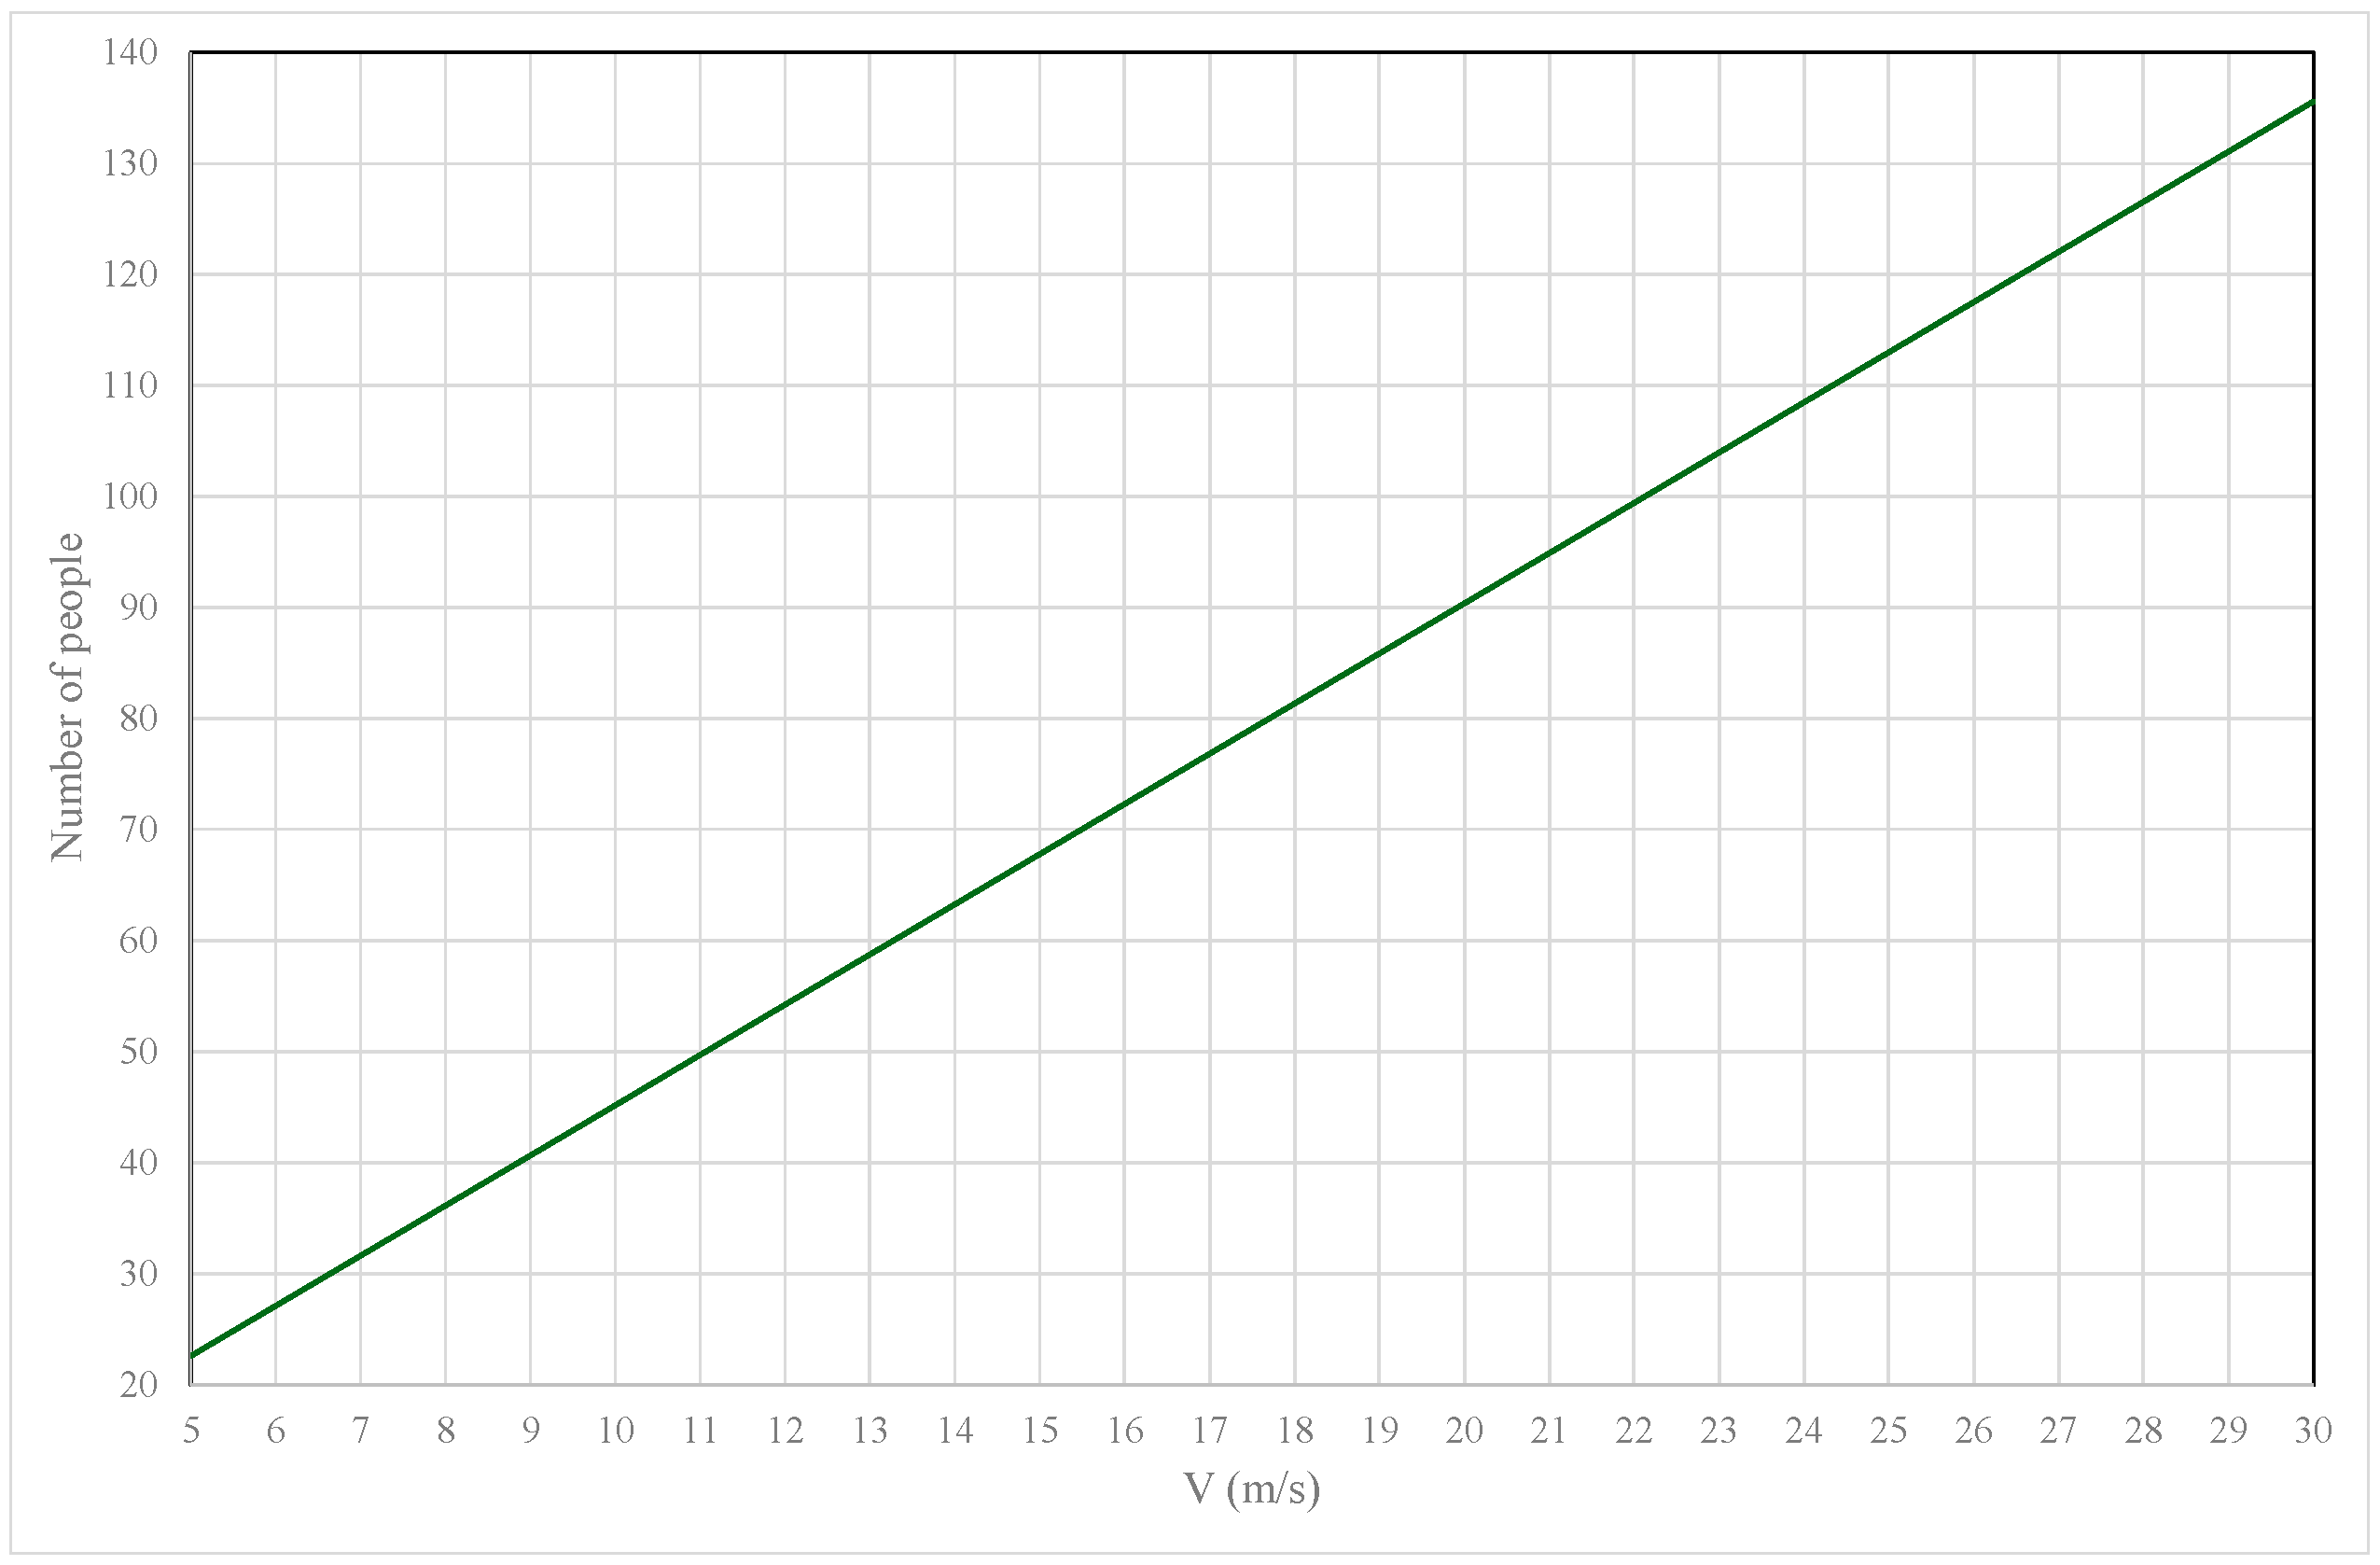
Figure 4 shows the evolution in the number of people with an acceptable air recirculation flow rate in the train carriage as a function of the train carriage speed.
According to the results presented, it appears that compartment 1 has the highest airflow rate and compartment 3, the central one, has the lowest.
According to the recommendations of the RECS [14], 24 m3/h for an occupancy of 16 people per compartment, it is found that acceptable IAQ in compartments 1 and 5 is achieved when the train carriage speed exceeds approximately 15.50 m/s. The acceptable IAQ level in compartment 4 is achieved at a train carriage speed above approximately 18.75 m/s, the acceptable IAQ level in compartment 2 is met at a train carriage speed above approximately 19.75 m/s and the acceptable IAQ level in compartment 3 is met at a train carriage speed above approximately 20.50 m/s.
In other words, generally speaking, on average, the acceptable IAQ value in the train carriage, considering a total of 80 people, is achieved at a speed above approximately 17.75 m/s.

4. Conclusions

According to the results presented, a vehicle velocity above 17.75 m/s generally ensures acceptable IAQ for an occupancy of 80 passengers.
Since the compartments at the ends of the train carriage have a higher flow rate than the central compartments, it was found that a train speed above 15.50 m/s ensures that an acceptable IAQ is obtained in compartments located at the ends. In the central compartments, IAQ is only found to be acceptable for carriage speeds above 20.50 m/s.
As future work, new passive ventilation systems for trains will be developed. These new systems will consist of air intake through the upper front of the carriage, while extracting air from its upper side. The application of Computational Fluid Dynamics simulations, taking into account the airflow inlets and outlets as well as the positioning of the seats and passengers, will also be analyzed in the future.

Author Contributions

Conceptualization, M.C., M.I.C., E.C., M.M.L., J.G. and H.A.; Methodology, M.C., M.I.C., E.C., M.M.L., J.G. and H.A.; Software, M.C., M.I.C., E.C., M.M.L., J.G. and H.A.; Writing—original draft, M.C., M.I.C., E.C., M.M.L., J.G. and H.A.; Writing—review & editing, M.C., M.I.C., E.C., M.M.L., J.G. and H.A.; Formal analysis, M.C., M.I.C., E.C., M.M.L., J.G. and H.A. All authors have read and agreed to the published version of the manuscript.

Funding

This research received no external funding.

Institutional Review Board Statement

Not applicable.

Informed Consent Statement

Not applicable.

Data Availability Statement

The original contributions presented in this study are included in the article. Further inquiries can be directed to the corresponding author.

Acknowledgments

The authors would like to acknowledge the project (UIDB/50022/2020), DOI: https://doi.org/10.54499/UIDB/50022/2020, under the National Science and Technology Foundation (FCT) and the 2025–2026 ASHRAE Undergraduate Senior Project Grant Program.

Conflicts of Interest

The authors declare no conflicts of interest.

References

  1. Conceição, E.Z.E.; Da Silva, M.C.G.; André, J.C.S.; Viegas, D.X. Thermal behaviour simulation of the passenger compartment of vehicles. Int. J. Veh. Des. 2000, 24, 372–387. [Google Scholar] [CrossRef] [Scilit]
  2. Ozeki, Y.; Takabayashi, T.; Tanabe, S.I. Numerical comfort simulator for thermal environment (Part 1) A comprehensive combined analysis method with multi-node thermoregulation model, radiation model and CFD for evaluation of thermal comfort. In SAE 2002 World Congress; SAE Technical Papers; SAE International: Warrendale, PA, USA, 2002. [Google Scholar] [CrossRef] [Scilit]
  3. da Silva, M.C.G. Aerodinâmica de Veículos: Optimização da Forma Exterior e Estudo do Escoamento no Interior do Habitáculo, de um Modelo de Autocarro. Available online: https://estudogeral.uc.pt/handle/10316/1558 (accessed on 5 August 2026).
  4. Conceicao, E.Z.; Silva, M.C.; Viegas, D.X. Air quality inside the passenger compartment of a bus. J. Expo. Anal. Environ. Epidemiol. 1997, 7, 521–534. [Google Scholar] [PubMed]
  5. Songbo, W.; Tian, L.; Jiye, Z. Study on air quality improvement in train compartments by coordinated exhaust of multiple air outlets. Railw. Eng. Sci. 2026, 34, 448–469. [Google Scholar] [CrossRef] [Scilit]
  6. Wu, S.; Li, T.; Zhang, J. Flow field patterns in train compartments based on jet ventilation under variable air volume system: Isothermal conditions. J. Zhejiang Univ.-Sci. A 2025, 26, 1258–1272. [Google Scholar] [CrossRef] [Scilit]
  7. Zhang, M.; Li, T.; Wu, S.; Zhang, J. Study on optimization design of air supply uniformity for a double-layer air duct in metro vehicle. Phys. Fluids 2025, 37, 075187. [Google Scholar] [CrossRef] [Scilit]
  8. Wu, S.; Li, T.; Zhang, J. Ventilation performance study of a high-speed train cabin based on displacement ventilation and mixed ventilation. Phys. Fluids 2024, 36, 077108. [Google Scholar] [CrossRef] [Scilit]
  9. Fanger, P.O. Thermal Comfort. Analysis and Applications in Environmental Engineering; Danish Technical Press: Copenhagen, Denmark, 1970. [Google Scholar]
  10. ANSI/ASHRAE Standard–55; Thermal Environmental Conditions for Human Occupancy. ANSI/ASHRAE Standard: Peachtree Corners, GA, USA, 2017.
  11. ISO 7730; Ergonomics of the Thermal Environment Analytical Determination and Interpretation of Thermal Comfort Using Calculation of the PMV and PPD Indices and Local Thermal Comfort Criteria. ISO: Geneva, Switzerland, 2005.
  12. ANSI/ASHRAE Standard 62-1; Ventilation for Acceptable Indoor Air Quality. American Society of Heating, Refrigerating and Air-Conditioning Engineers. ANSI/ASHRAE Standard: Atlanta, GA, USA, 2022.
  13. ANSI/ASHRAE Standard 62.2; Ventilation and Acceptable Indoor Air Quality in Residential Buildings, American Society of Heating, Refrigerating and Air-Conditioning Engineers. ANSI/ASHRAE Standard: Atlanta, GA, USA, 2016.
  14. Portaria 353-A/2013; Regulamento de Desempenho Energético dos Edifícios de Comércio e Serviços (RECS)—Requisitos de Ventilação e Qualidade do Ar Interior—Portaria no 353-A/2013 de 4 de Dezembro. 2013. 1ª série 245. 6644-(2)–6644-(9). Diário República: Lisboa, Portugal, 2013. (In Portuguese)
  15. ISO 17772-1; Energy Performance of Buildings—Indoor Environmental Quality—Part 1: Indoor Environmental Input Parameters for the Design and Assessment of Energy Performance of Buildings. ISO: Geneva, Switzerland, 2017.
  16. ISO/TR 17772-2; Energy Performance of Buildings—Overall Energy Performance Assessment Procedures—Part 2: Guideline for Using Indoor Environmental Input Parameters for the Design and Assessment of Energy Performance of Buildings (Technical Report). ISO: Geneva, Switzerland, 2018.
  17. EN 16798-1; Part 1: Indoor Environmental Input Parameters for Design and Assessment of Energy Performance of Buildings Addressing Indoor Air Quality, Thermal Environment, Lighting and Acoustics. CEN-CENELEC Management Centre: Brussels, Belgium, 2019.
  18. CEN/TR 16798-2; Part 2: Guideline for Using Indoor Environmental Input Parameters for the Design and Assessment of Energy Performance of Buildings, Draft for Working Group Red. CEN-CENELEC Management Centre: Brussels, Belgium, 2019.
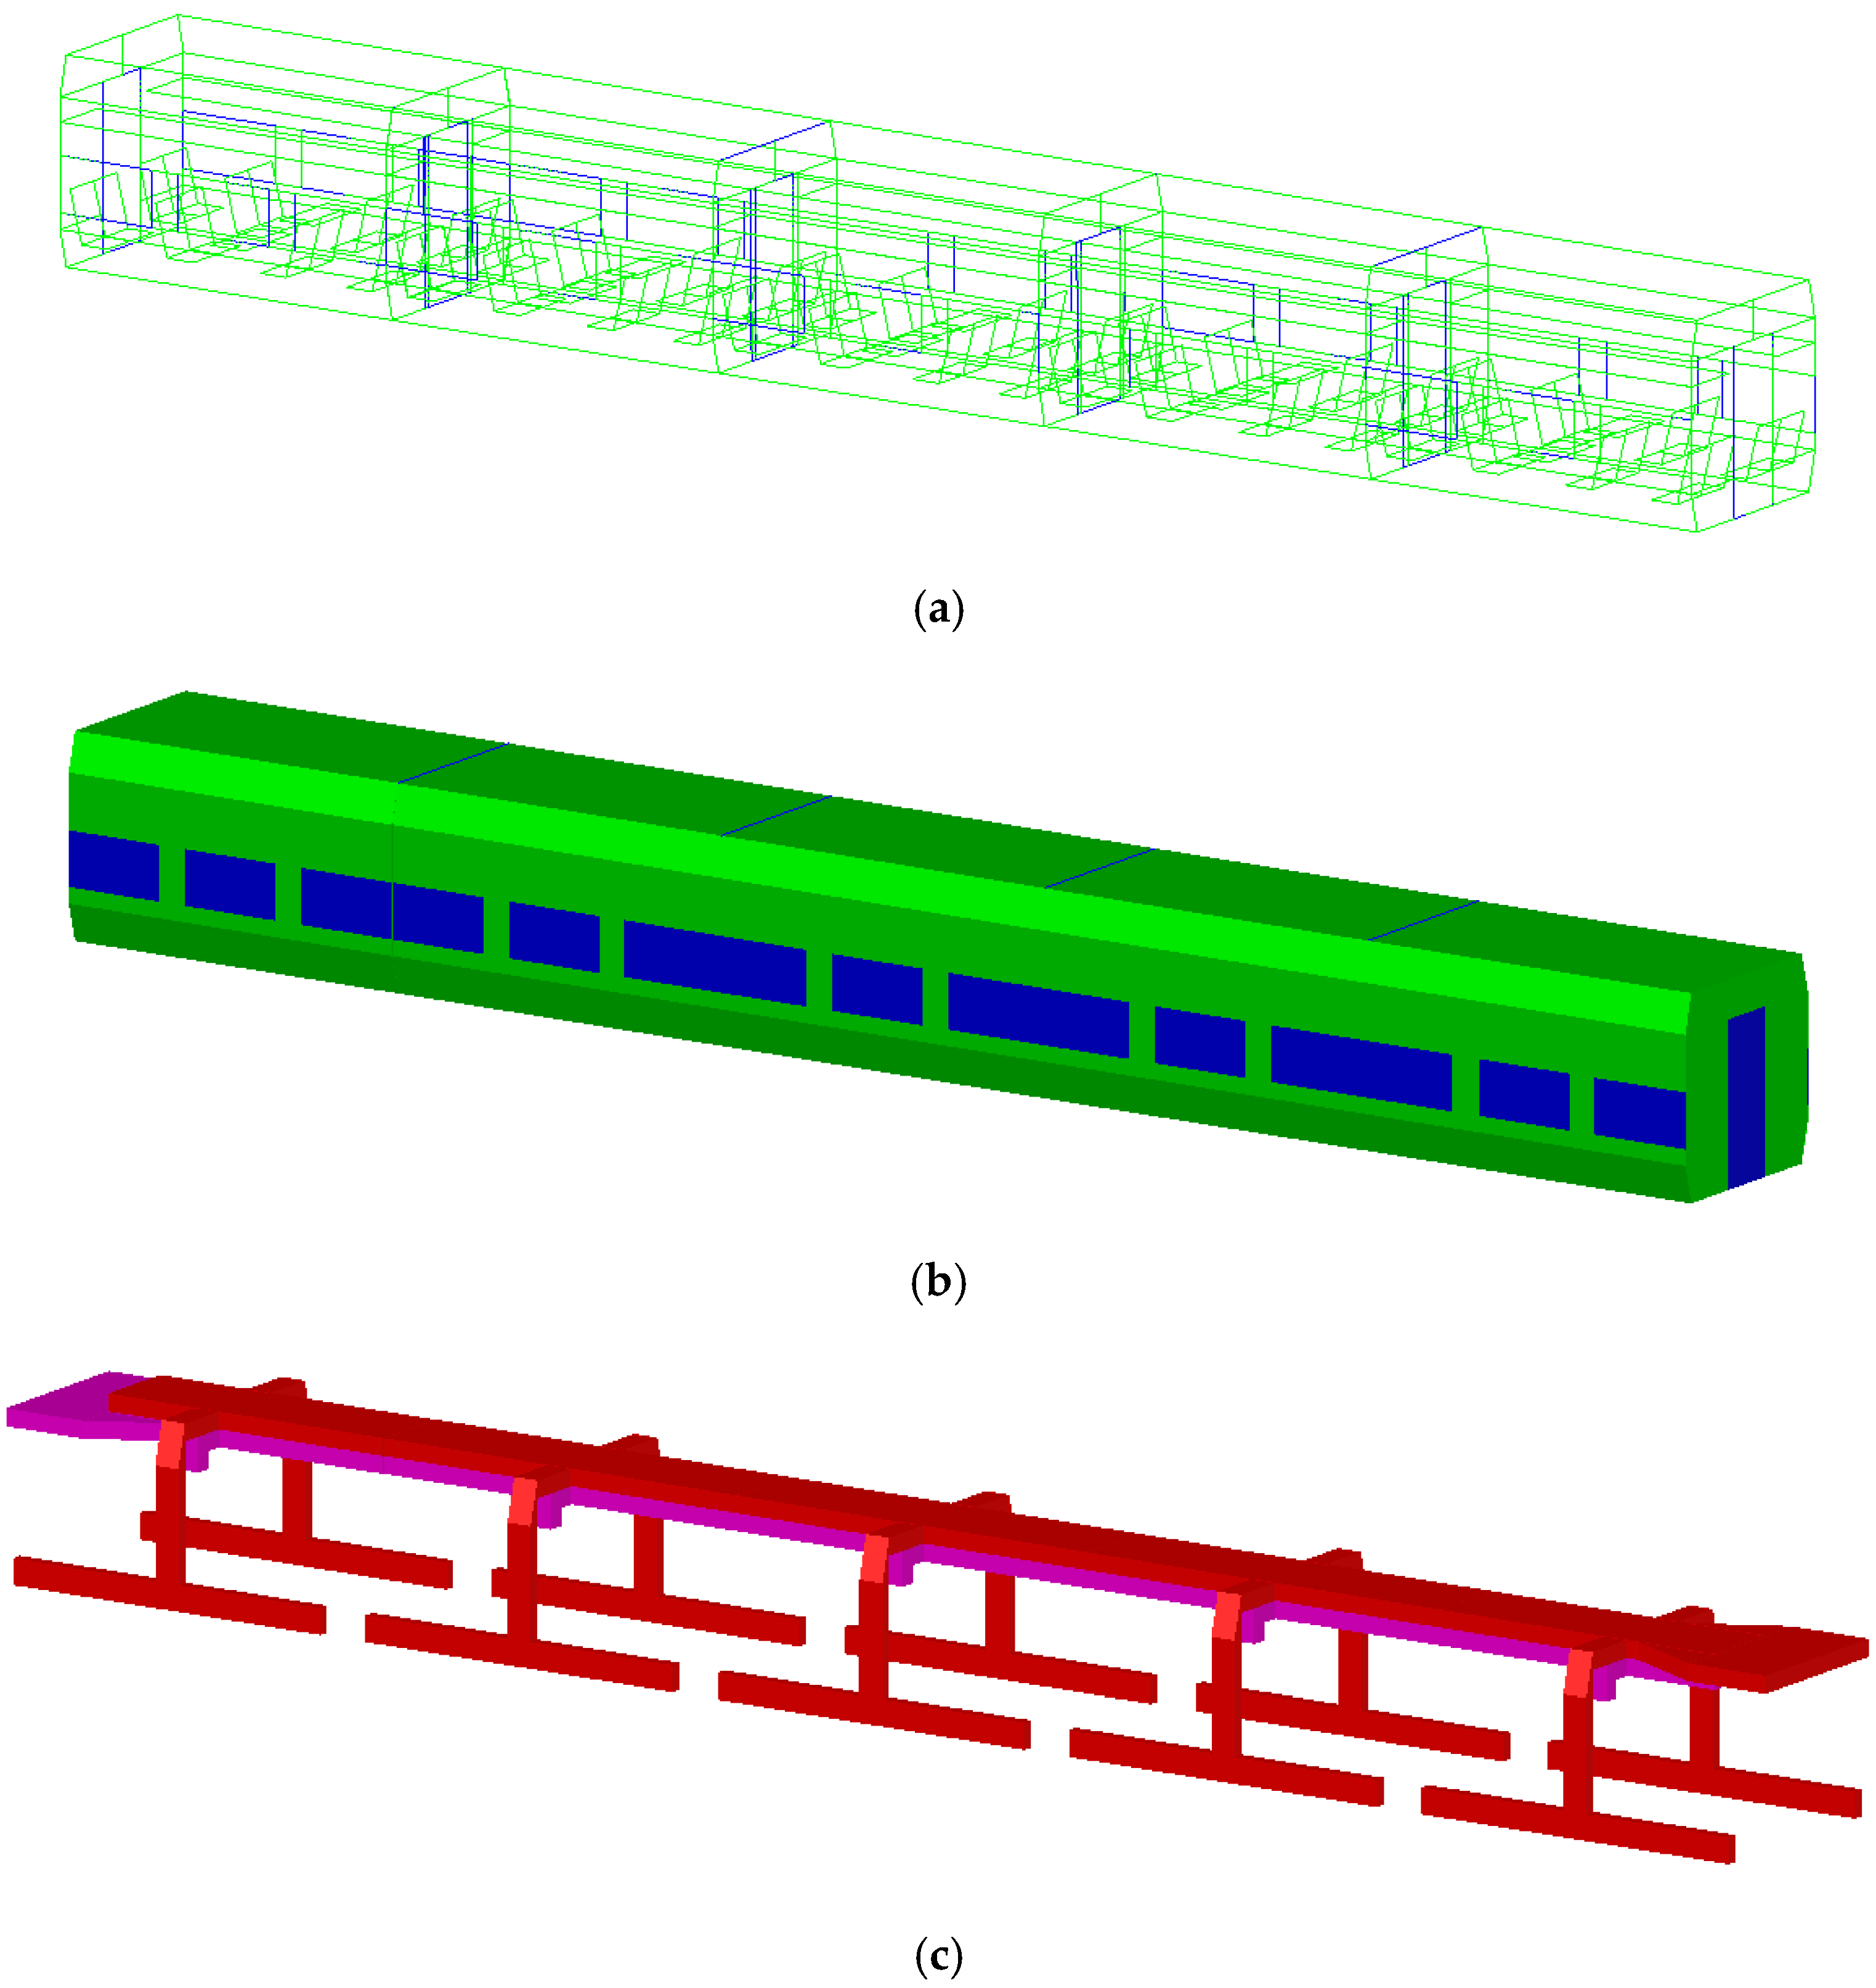
Figure 1. Scheme of the train carriage, divided into five compartments (a,b), in which the green and blue areas correspond to the panels and the windows, respectively, and the supply ventilation system (in red) and the exhaust ventilation system (in pink) (c).
Engproc 152 00011 g001
Figure 2. Scheme of the air inlets for the pressurization system and the air outlets for the exhaust system on the exterior of the train carriage (a), and the air outlets for the pressurization system and the air inlets for the exhaust system inside the train carriage compartments (b). The numbers represent each of the train carriage’s sections.
Engproc 152 00011 g002
Figure 3. Evolution of the air recirculation flow rate, Q, in each compartment (a) and the number of people with an acceptable air recirculation flow rate (b) as a function of the train carriage’s speed.
Engproc 152 00011 g003
Figure 4. Evolution of the number of people with acceptable airflow rate in the carriage, as a function of the train carriage’s speed.
Engproc 152 00011 g004
Disclaimer/Publisher’s Note: The statements, opinions and data contained in all publications are solely those of the individual author(s) and contributor(s) and not of MDPI and/or the editor(s). MDPI and/or the editor(s) disclaim responsibility for any injury to people or property resulting from any ideas, methods, instructions or products referred to in the content.