Proceeding Paper

Customer Behavior Analysis and Service Enhancement in Telecom Company Using Machine Learning Methods †

by
Hussein Ibrahim
1,* and
Vladimir Dimitrov
2
1
Department of Computer Science, Varna Free University, 9007 Varna, Bulgaria
2
Department of Computer Science, Faculty of Mathematics and Informatics, Sofia University “St. Kliment Ohridski”, 1164 Sofia, Bulgaria
*
Author to whom correspondence should be addressed.
Presented at the 15th International Scientific Conference TechSys 2026—Engineering, Technologies and Systems, Plovdiv, Bulgaria, 14–16 May 2026.
Eng. Proc. 2026, 150(1), 63; https://doi.org/10.3390/engproc2026150063
Published: 23 July 2026

Abstract

Customer complaints are considered one of the key indicators of customer discontentment with a service. In organizations, such as telecommunications companies, not all customers raise their complaints, which raises concerns about their potential churn or retention. As firms usually rely on the complaints raised to customer services, there exists an important portion of customers who claim their complaints through other platforms, such as social media, even though another portion does not complain at all. This places the company’s image in jeopardy and might affect its productivity and profits. To address this challenge, it is important to address possible customer problems before they turn into effective complaints. To do so, the current study aims to predict the complaints of customers in a telecommunication company and their potential churn through the usage of supervised machine learning models to test the correlation between churn and complaints. Through a thorough data analysis, it becomes evident that a good portion of clients who encounter service issues decide not to present any complaints to the company. In addition, among complainers, some do not complain directly to the company, while others who contact the company have their problems postponed. Among those, there is a proportion, considered as having unresolved concerns, turned into churn. Using a dataset of 1000 clients, recruited over a period of six months, the results showed that a considerable portion of customers using the services during the day were non-churners and continued using it over the overall period of 6 months. Whereas, day churn and evening churn both showed much lower frequencies compared to non-churn customers, with fewer calls across all durations. Additionally, the findings showed that there exists a correlation between customer complaints and customer churn, where churn events frequently coincide with complaints, indicating that customers without churn are generally content with their service, while those having complaints are more likely to quit. This study presents important insights into telecommunications companies to improve their service offerings, enhance customer satisfaction, and reduce churn rates, leading to a more stable and profitable customer base.

1. Introduction

Customer complaints offer significant insights into a customer’s discontentment with a product or service, in a way that when a customer expresses a complaint, it typically signifies their wish for an enhancement, demonstrating their involvement and concern for the quality of their purchase [1]. For various companies, including, but not limited to, telecommunication firms, such complaints present a chance to resolve any problems and even transform an unsatisfied consumer into a devoted advocate. This can be crucial for preserving a favorable reputation and attaining sustained success [2].
On the other hand, businesses must prioritize the importance of addressing consumer concerns promptly and efficiently. Engaging in this practice not only aids in maintaining client loyalty but also acts as a crucial means of obtaining feedback to enhance products and services [3]. In his study, Ajibola (2021) argues that the way a company deals with complaints is a crucial indicator of its level of responsiveness towards its customers [4]. Therefore, efficiently resolving complaints, even though they may be initially disturbing, can help a company maintain its positive reputation, increase its productivity and improve customer relationships in the long run [5]. Nonetheless, customer complaints are an essential measure for evaluating business performance. These concerns bring attention to fundamental problems in essential business operations that need to be addressed promptly in order to avoid losing customers. This, in return, makes it crucial for organizations, such as telecommunication companies, to acknowledge that losing consumers can lead to a decrease in earnings and unfavorable word-of-mouth, therefore making the handling of customer complaints a strategic imperative [6].
From what is known, not all customers who experience service issues choose to lodge complaints directly with the company. Some opt to express their grievances through alternative channels such as social media platforms, while a significant portion does not voice their concerns at all [7]. This presents a challenge for organizations to proactively identify these “non-complainers” to address potential issues before they escalate. By predicting and mitigating problems in advance, companies can enhance customer service and responsiveness. Furthermore, such proactive measures lead to improvements in management and profitability, and foster a more customer-centered approach [8]. Therefore, addressing these concerns is crucial for organizations aiming to maintain a high customer retention rate, high standards of customer satisfaction and operational efficiency.
By doing so, early detection systems are considered essential to this process because they enable firms to foresee changes in patterns and quickly handle new concerns as they arise [9]. Machine learning algorithms were shown to be extensively used in different fields to address the issue of customer complaints through predicting and addressing client attrition [10].

2. Related Work and Research Contributions

The definition of customer complaints is based on a number of earlier research findings. These studies have shaped the understanding of consumer complaints in a chronological manner [11]. Dickey and Talerzyk (1977) noted that “internal factors and personal traits are important contributors to consumer complaints” [12]. Expanding on this, Jaccard and Jacoby (1980) described customer complaints as “any unfavorable correspondence a customer sends to a business, manufacturer, or other third party about a product of a service” [13]. They further expanded this definition arguing that complaints are typically the result of unhappy customers, and complaint behavior is influenced by a variety of elements including the customer’s personality, attitudes, motives, perceived value of time, information level, and sociodemographic traits [13].
Furthermore, Singh, in 1996, divided consumer reactions into three groups: contacting the business directly to voice concerns, abstaining from the product and alerting others, and pursuing legal action or government complaints [11]. Kelly (2023) asserts that a number of variables, such as demographics, consumer experiences, sociocultural values, and psychological, emotional, and personality attributes, affect customer complaints [14].
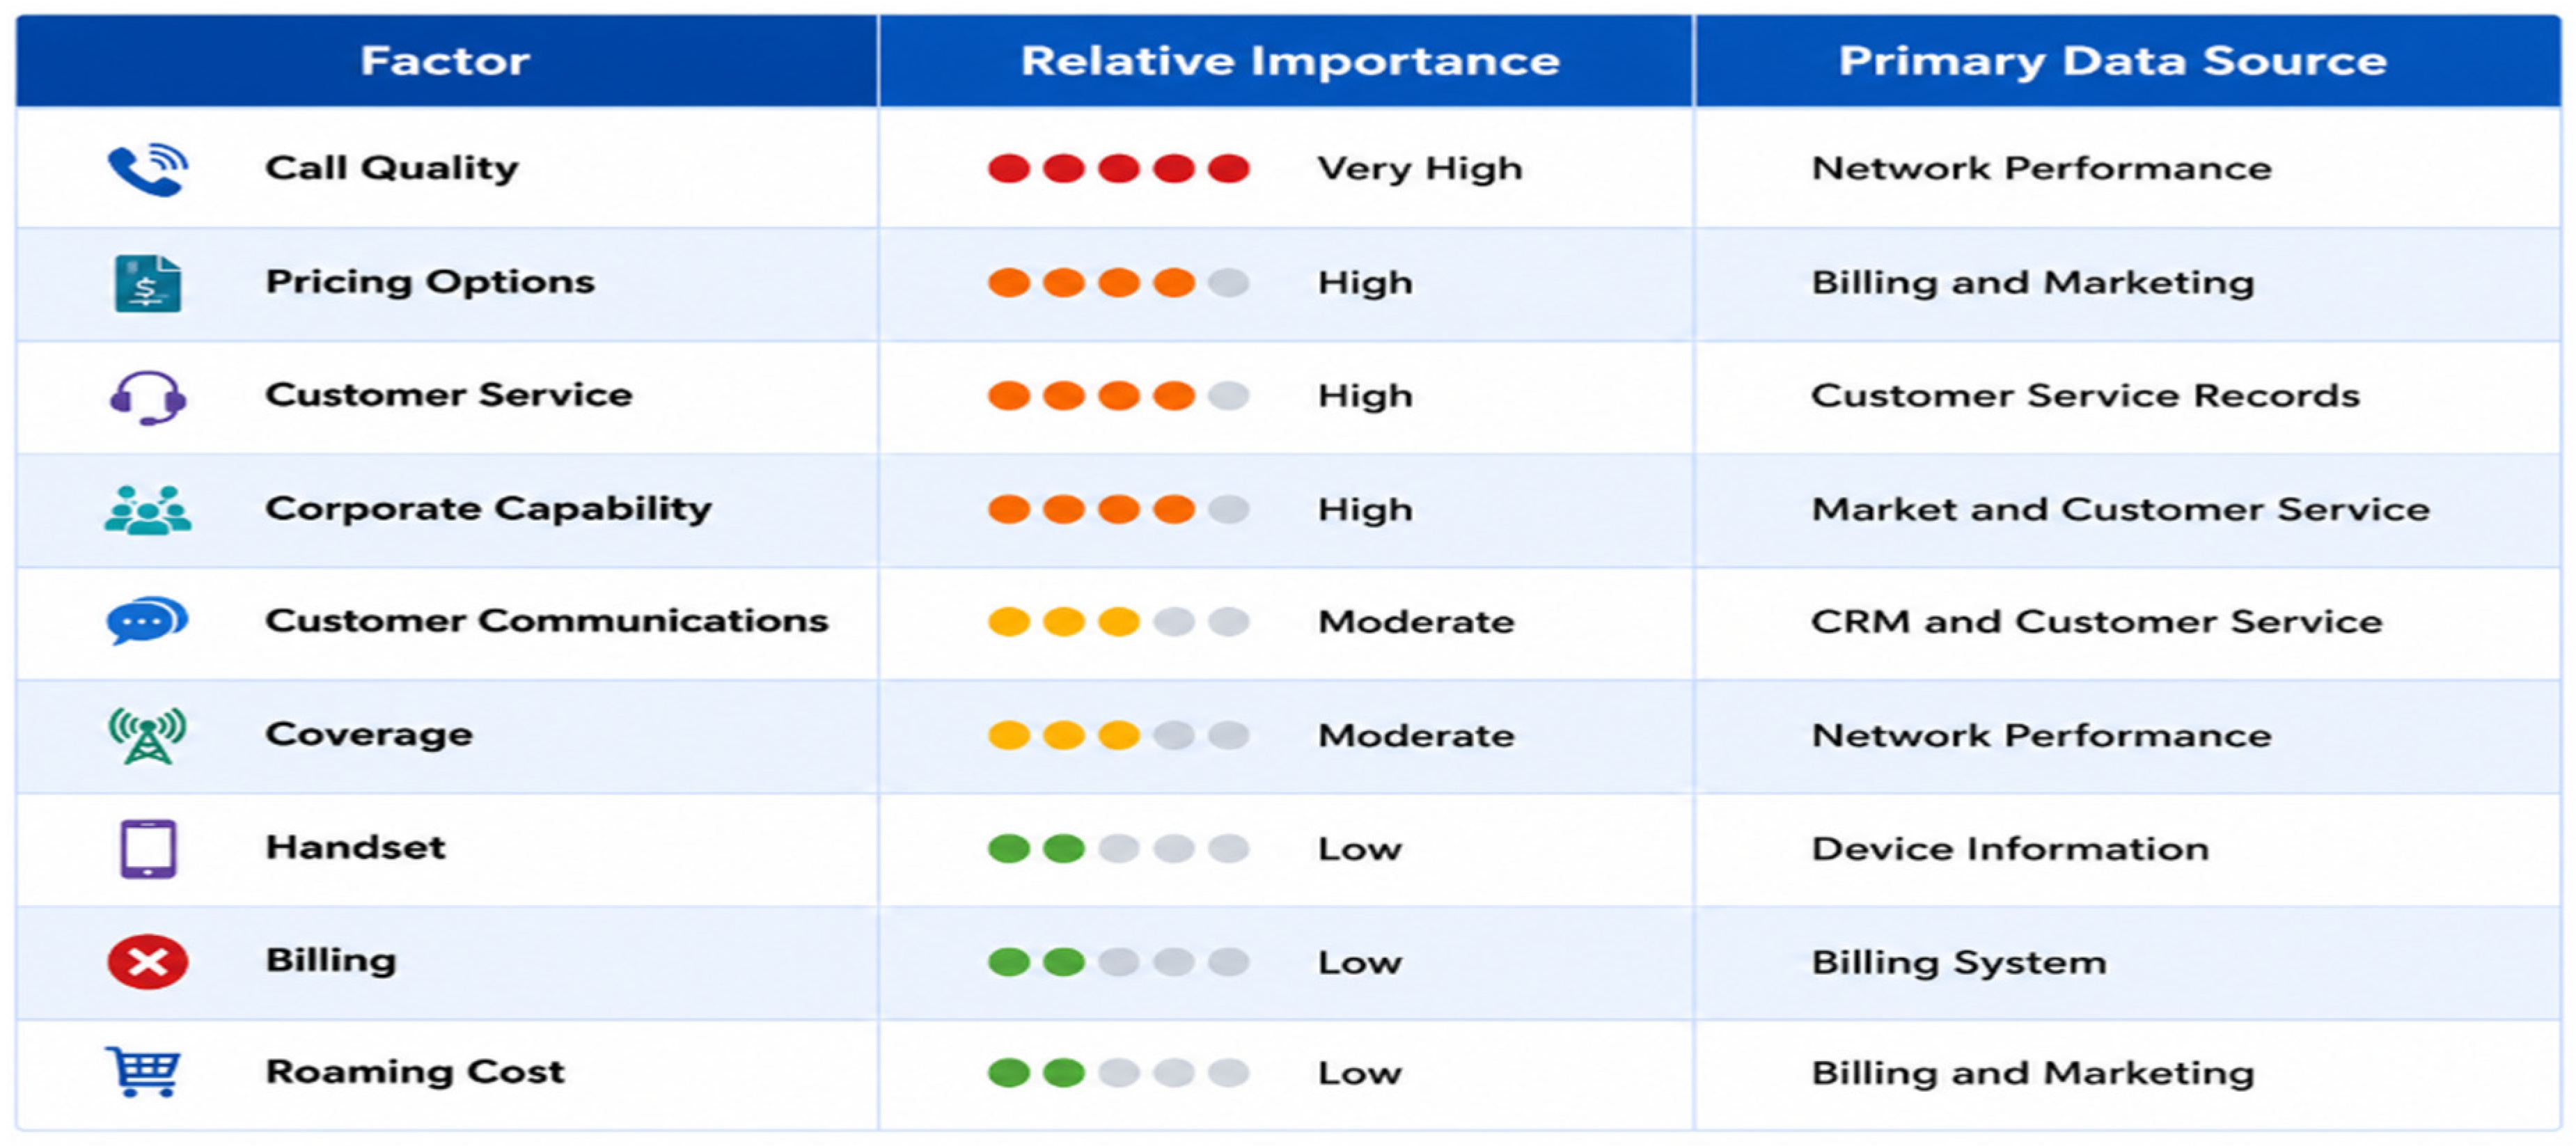
Using machine learning techniques, several studies in the mobile telecommunications sector have explored the prediction of churn. Churn is very important for mobile operators because it directly affects their profitability. The growth of a service’s clientele is frequently correlated with its profitability. Using statistical machine learning approaches to estimate churn and determine suitable incentives to improve customer retention and maximize carrier profitability was the main emphasis of Mozer et al.’s (2000) [15] study and Figure 1. Notably, Mozer et al.’s research highlighted how crucial call quality is in determining subscriber satisfaction [15].
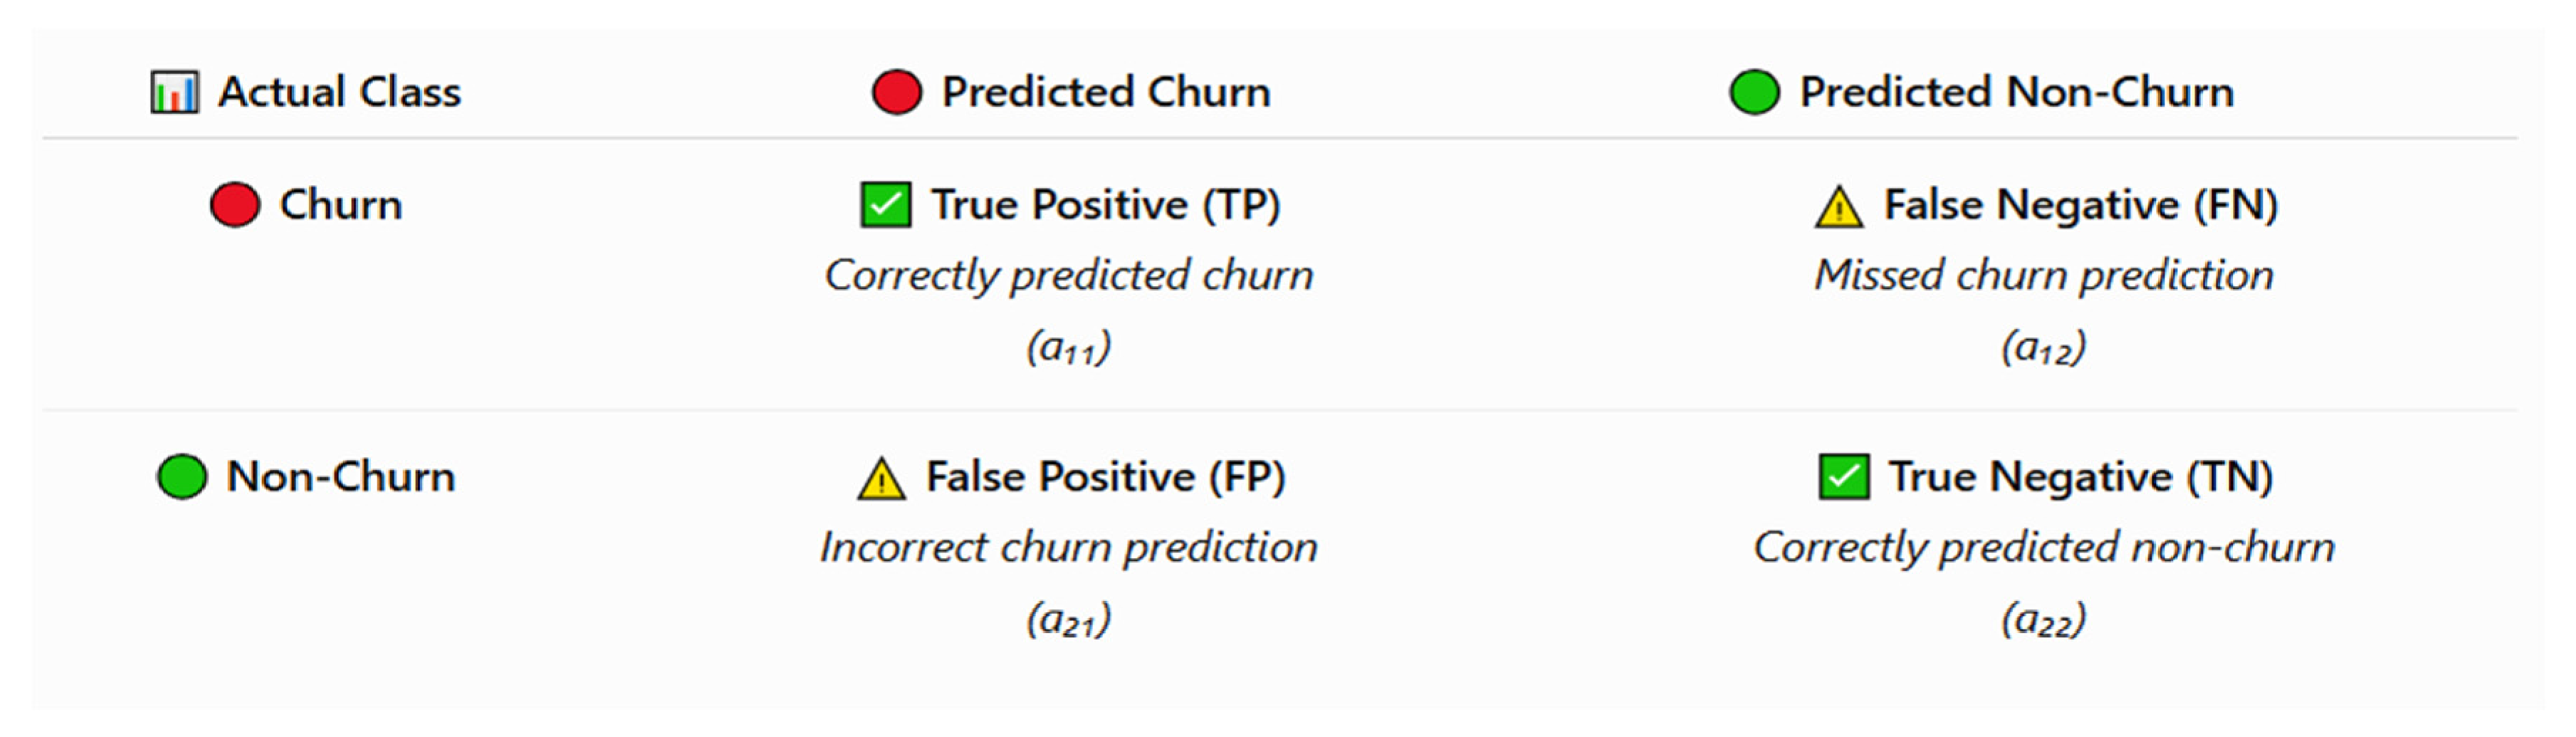
In 2012, Huang et al. conducted a study that proposed seven methods for predicting customer churn: “Support Vector Machines” (SVM), “Naïve Bayes” (NB), “Decision Trees” (DT), “Multi-Layer Perceptron” (MLP), “Logistic Regression” (LR), “Linear Classification” (LC), and “Naïve Bayes” (NB). A confusion matrix (Figure 2) was used to assess the performance of the churn rate prediction; a high “true positive” (TP) rate and a low “false positive” (FP) rate denote strong performance [16].
The percentage of churn cases that are accurately classified as “True Positive Rate” (TPR):
T P R = T P T P + F N
The fraction of non-churn cases that are mistakenly labeled as churn is known as “False Positive Rate” (FPR):
F P R = F P F P + T N
A churn prediction model by Kim & Yoon (2004) [17] examines subscriber communication patterns while taking into account the interaction between churners and non-churners. Their research shows that community interactions, in addition to individual consumer qualities, can have an impact on customer attrition [17]. This model’s prediction ability is compared in the study of MLP and LR. While churn prediction using ML algorithms has been the subject of many studies in the mobile communication industry, there has been a noticeable shift in focus towards customer complaints due to the gradual decline in churn rates amidst shifting competition dynamics in the mobile telecom market. Research on forecasting consumer complaints is still scarce, though [17].

3. Research Questions and Objectives

In order to mitigate the problem of customer complaints, proactive actions are therefore necessary to spot possible problems within a telecommunication company and address them before they become actual complaints.
In the present article, we are looking to answer the following main questions: How can machine learning models be utilized to predict customer complaints and their correlation with customer churn in a telecommunication company setting?
The current study aims to predict the complaints of customers in a telecommunication company and their potential churn through the usage of supervised machine learning models to test the correlation between churn and complaints.

4. Modeling

4.1. Definition of Random Forest Classifier

The Random Forest algorithm is a popular machine learning method created by Leo Breiman and Adele Cutler [18]. It combines the results of several decision trees to generate a single outcome. Due to its simplicity and adaptability, it is widely used for addressing both classification and regression problems. In this article, we will delve into how the Random Forest algorithm operates, its benefits, regression methods, how it distinguishes itself from other algorithms, and how to utilize it effectively.
  • Using train_test_split () Function for Splitting Python (python 3.7 tensorflow 2.1.0 keras 2.3.1) Data.

Engproc 150 00063 i001
The ‘train_test_split’ function from the ‘sklearn.model_selection’ module is frequently utilized in machine learning to divide datasets into two subsets. One subset is used for training a model, while the other is used for testing its performance. This function takes input data and their corresponding labels, shuffles them randomly, and then divides them into training and testing sets based on a specified test size or train size.
  • Using StandardScaler() Function to Standardize Python Data.
Engproc 150 00063 i002
Scaling is an essential step in modeling algorithms with datasets. The data used for modeling is derived through various means:
  • Questionnaire;
  • Surveys;
  • Research.
Therefore, the statistics obtained include features of diverse dimensions and scales. Distinctive scales of the records capabilities affect the modeling of a dataset adversely. It leads to a biased outcome of predictions in terms of misclassification mistakes and accuracy quotes. Thus, it is vital to scale the records previous to modeling. In line with the above syntax, we start by creating an item of the StandardScaler() feature. Similarly, we use fit_transform() together with the assigned object to convert the statistics and standardize them.
Explanation:
  • Import the necessary libraries. We imported the sklearn library to use the StandardScaler feature.
  • Load the dataset. Right here we have used the Churn dataset from sklearn.datasets library.
  • Set an object to the StandardScaler() feature.
  • Follow the feature into the dataset using the fit_transform() feature as proven below: StandardScalar.fit_transform (<Dataset>).

4.2. Use Case Study

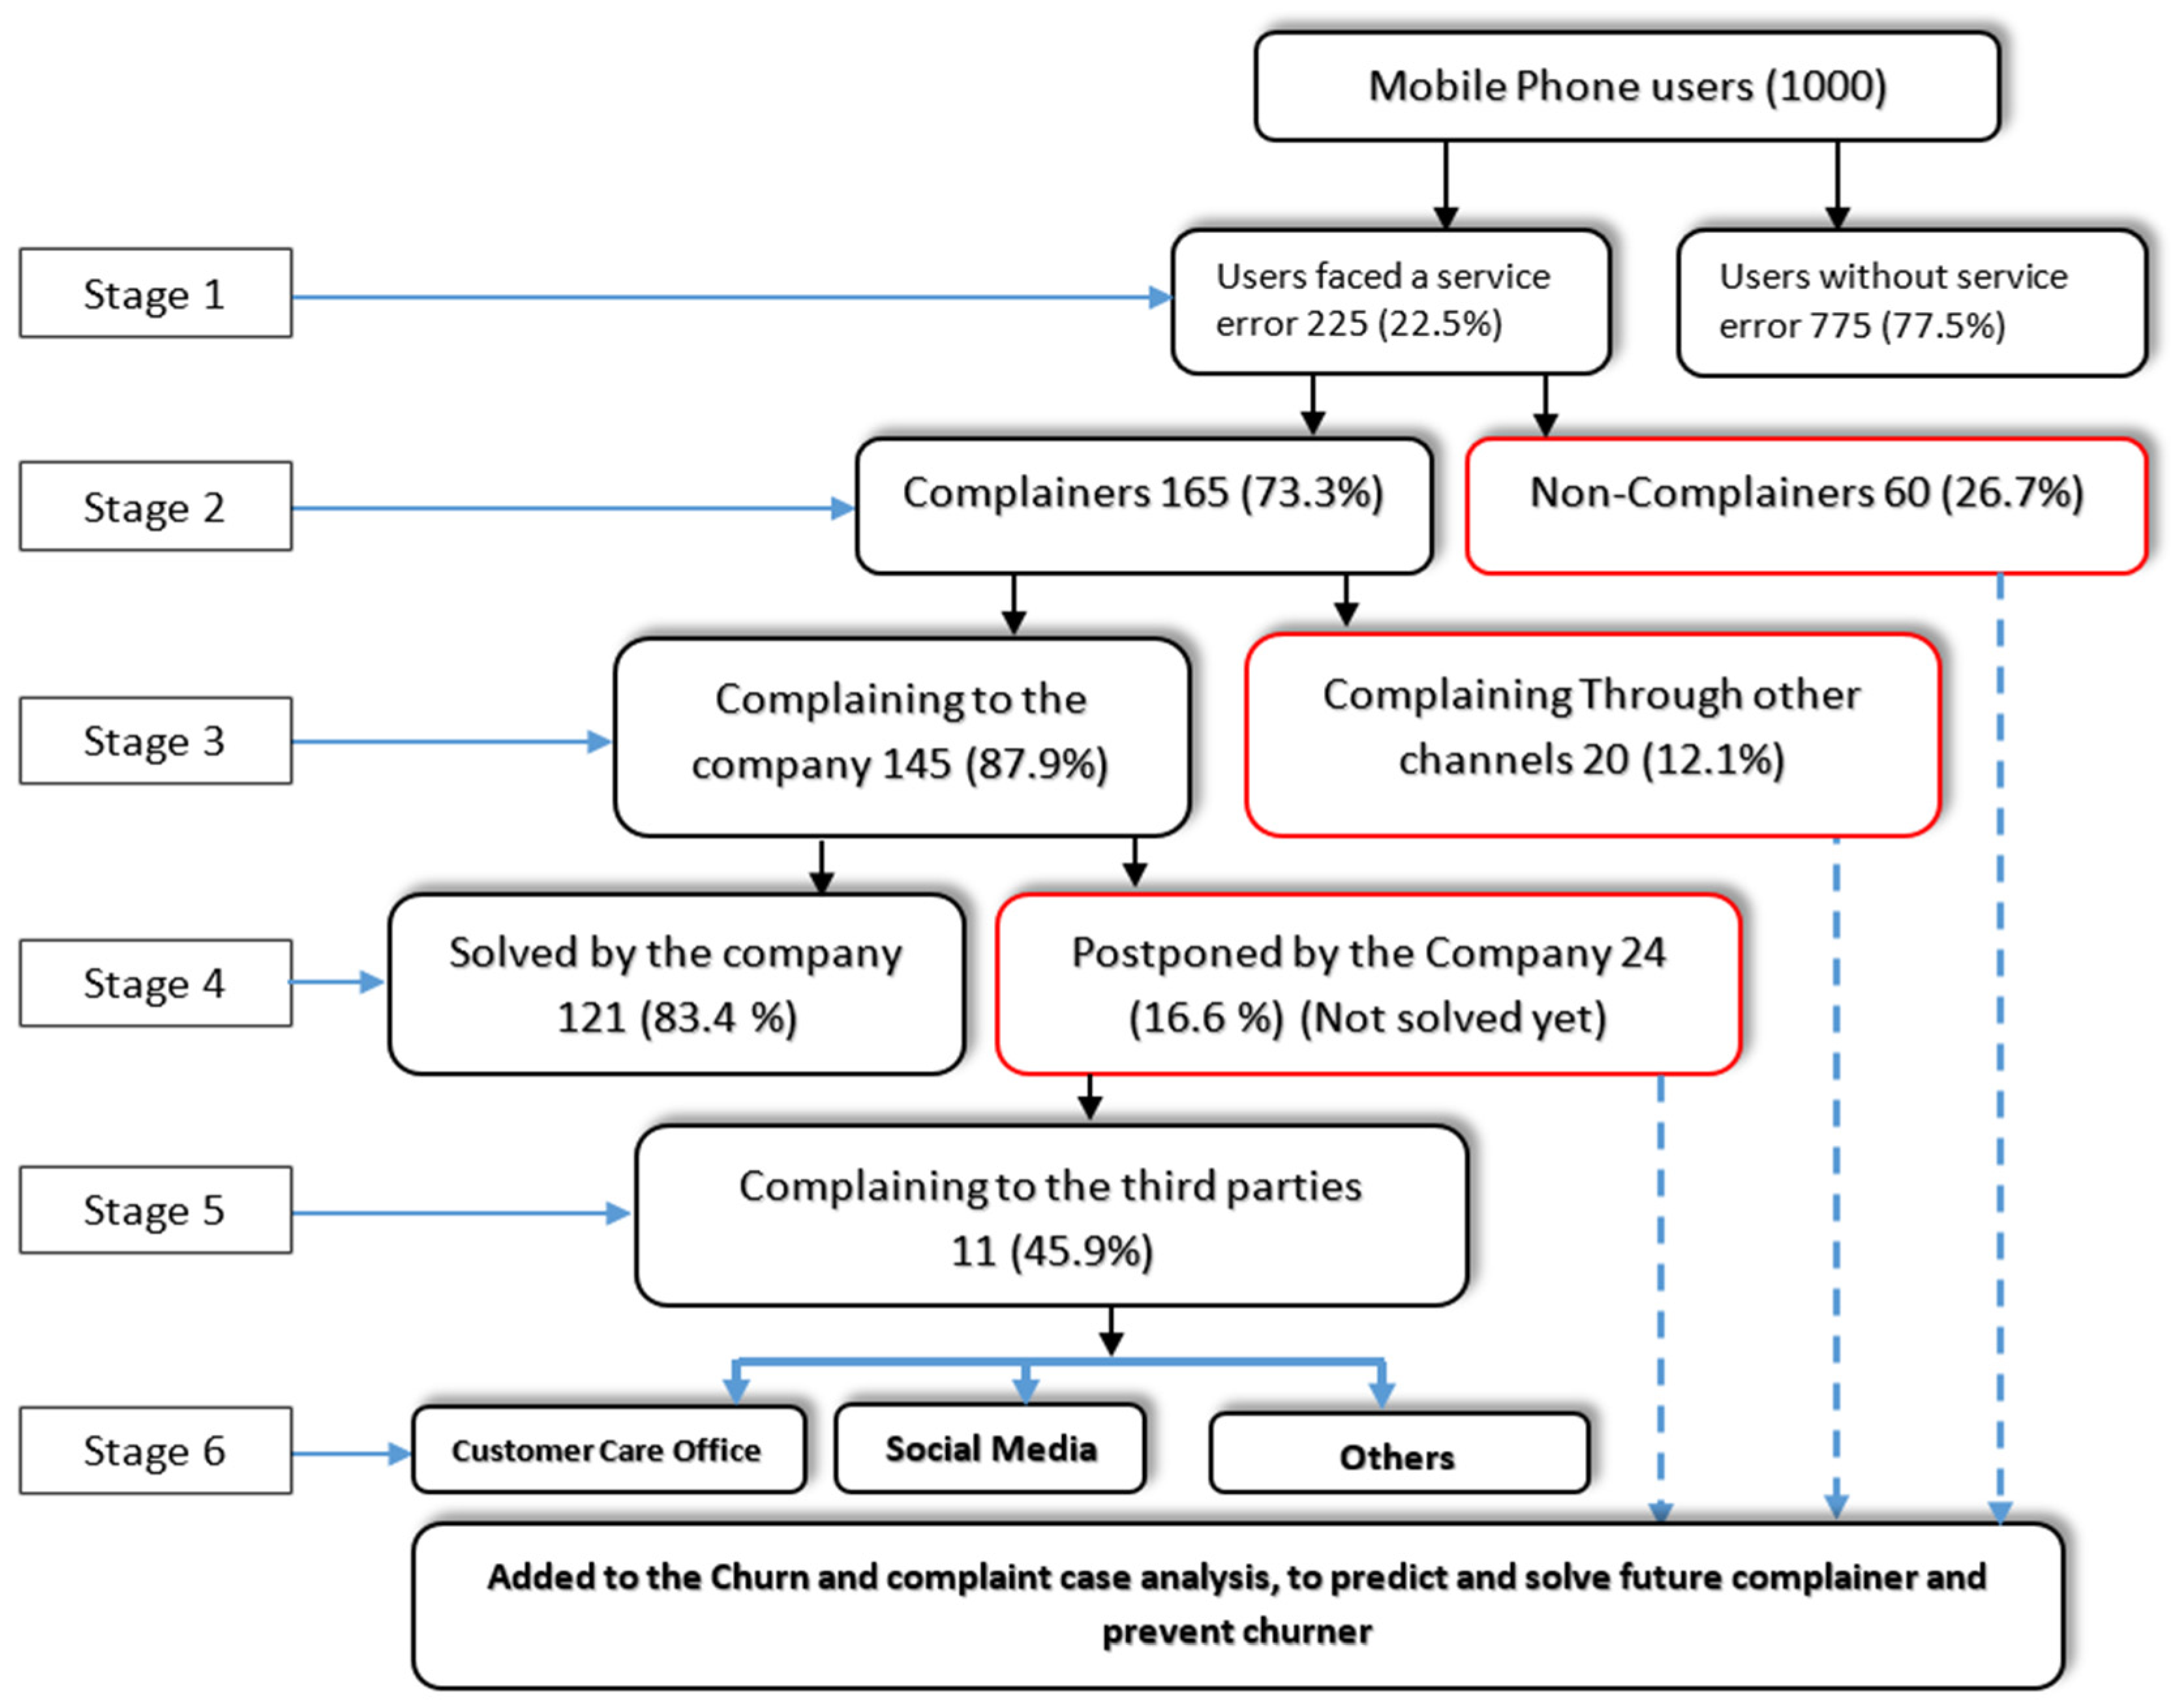
Within the chosen mobile telecommunication company, a total of 1000 mobile users were recruited over a period of 6 months. Among these, customer complaint behavior was assessed. As shown in the following diagram (Figure 3), Stage 1 highlights that out of 1000 mobile phone users, 22.5% encountered a service error, while the remaining 77.5% users did not experience any issues. In stage 2, of the 225 (22.5%) users who faced a service error, 73.3% decided to lodge a complaint, indicating their dissatisfaction with the service. The other 26.7% chose not to complain. As per stage 3, among the complainers, 87.9% opted to complain directly to the company, while 12.1% used other channels to express their complaints, such as social media, consumer forums, etc. In stage 4, out of those who complained directly to the company, 83.4% had their issues resolved satisfactorily, while 16.6% were postponed, implying a delay in resolution or an unsatisfactory initial response.
Therefore, this helped in developing a proactive approach, using Artificial Intelligence (AI) methods to predict potential non-complainers and other users who might later have issues. The goal here was to prevent any delay in addressing complaints by taking necessary actions in a timely manner based on AI predictions.
Through a simple calculation, it becomes evident that 26.7% of clients who encounter service issues decide not to present any complaints to the company. In addition, among complainers, 12.1% do not complain directly to the company, while 16.6% of those who contact the company have their problems postponed. Among those, there is a proportion that turned into churn.
Thus, this raises concerns about mitigating this issue using prediction models, especially Machine Learning algorithms, to predict and comprehend customer complaints through experimentation and comparison.

5. Methodology

5.1. Dataset Sample

The data were collected over a period of time equal to 6 months, where information regarding clients was assessed, as shown in Table 1. This dataset was further utilized for training data in machine learning models.

5.2. Analysis of Call Durations Patterns

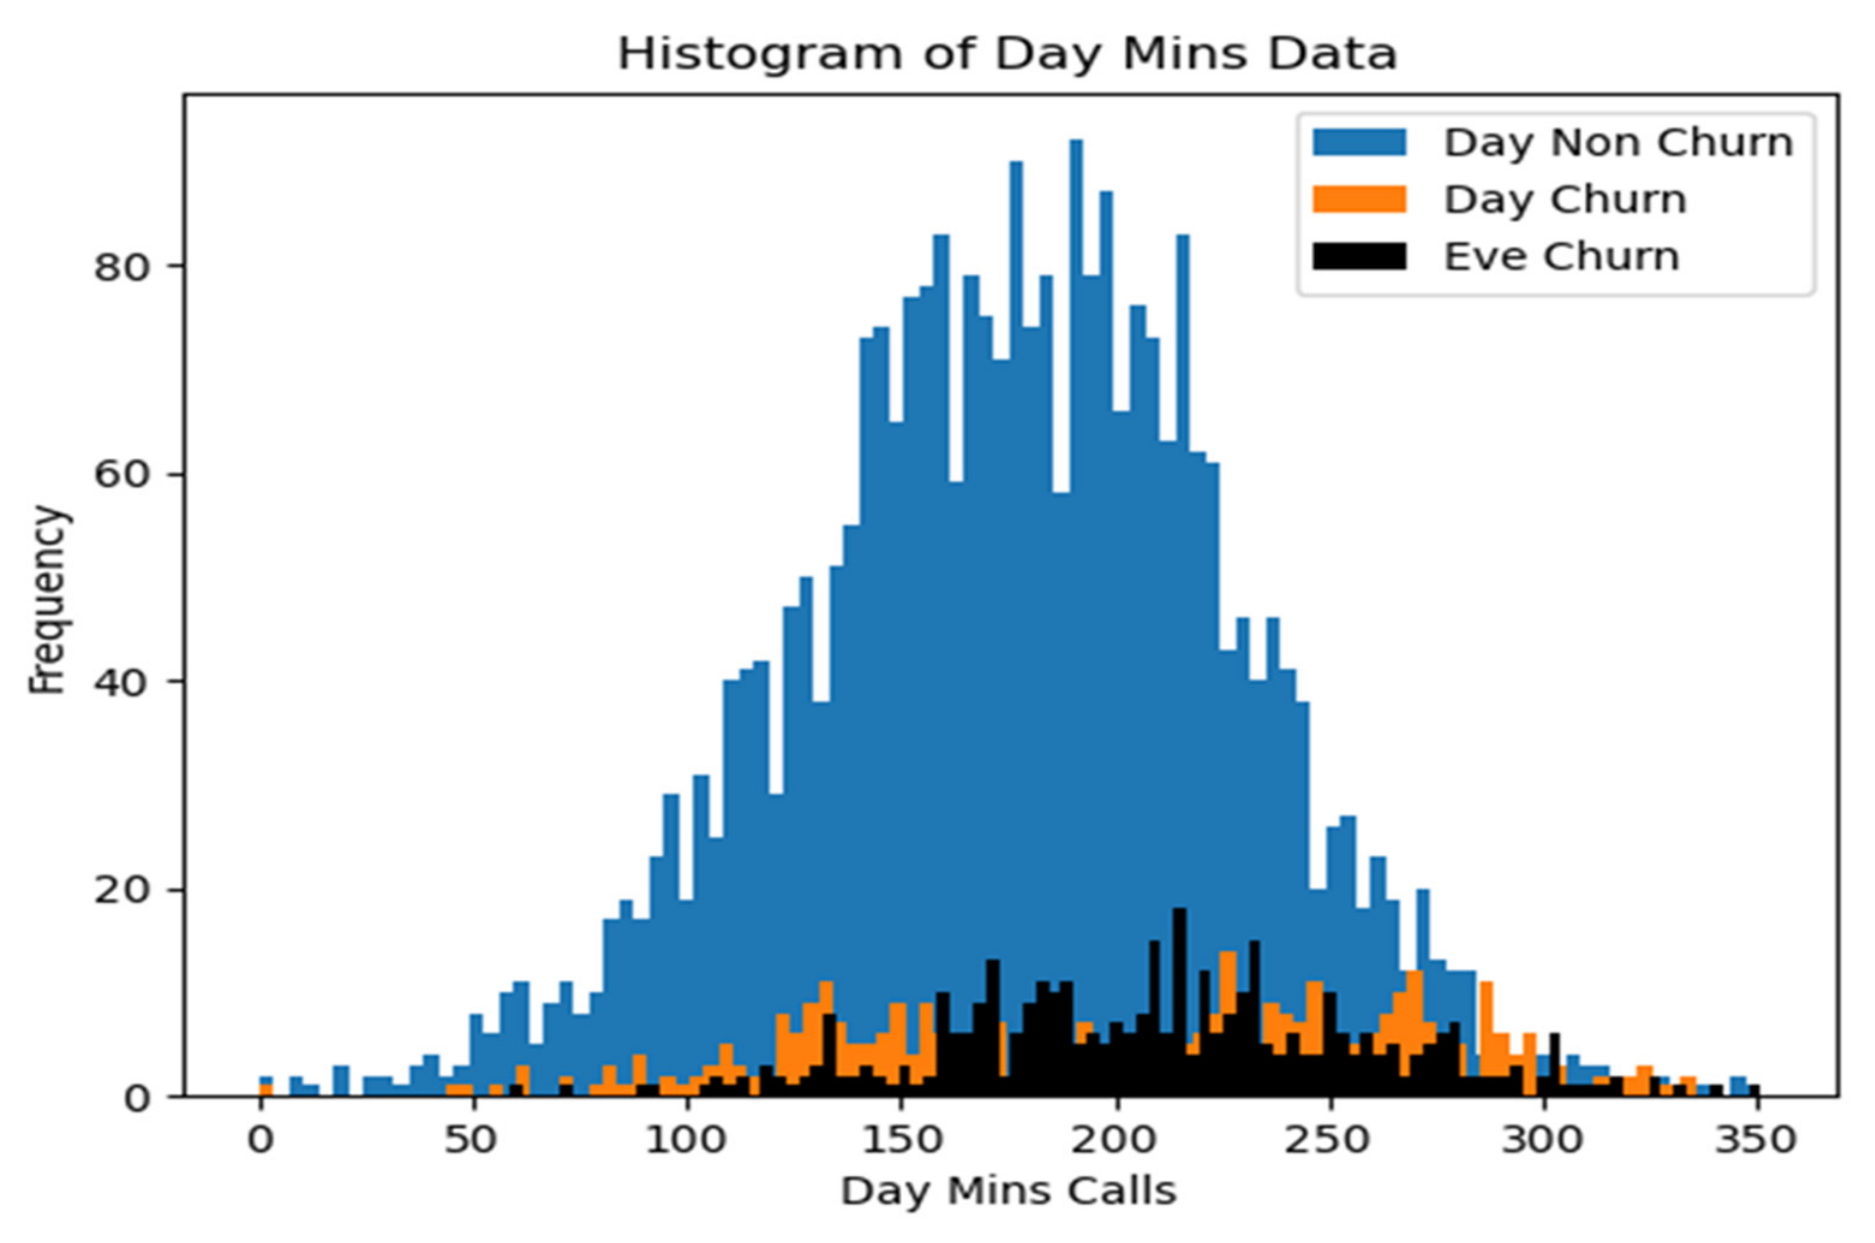
On the basis of the data collected, the distribution of daily call durations over a six-month period for customers of the telecommunications company was conducted. The durations were differentiated by whether customers eventually churned or not.
The results of the analysis showed that a considerable portion of customers using the services during the day were non-churners and continued using it over the overall period of 6 months. This is evident through the high frequency of calls across varying durations, peaking around 175 to 200 min. The wide distribution and high frequency suggest that these customers are generally satisfied with the overall company services, including, but not limited to, bundle subscriptions, as they engage in substantial call activity throughout the day.
On the other hand, day churn and evening churn both show much lower frequencies compared to non-churn customers, with fewer calls across all durations. Notably, the peaks for churned customers are lower and spread across the duration spectrum, but they are particularly sparse at higher minute ranges. This indicates that churned customers were less engaged with the service, possibly due to dissatisfaction or better alternatives.
Remarkably, as shown in the Figure 4, the high call durations and frequencies for non-churning customers imply higher engagement and possibly higher satisfaction with the service offerings. In contrast, lower engagement from churn customers could highlight issues such as poor service quality, pricing, or inadequate features. Therefore, these insights might be used to review and enhance service subscriptions for segments showing signs of potential churn. By analyzing the call patterns, especially during peak hours or specific days, the company can offer targeted promotions or campaigns during holidays or other significant periods to improve customer retention.
Additionally, given the distinct patterns in call durations between churned and non-churned customers, promotions or loyalty campaigns could be significantly designed to increase engagement among users showing similar call patterns to those who have churned.

5.3. Correlation Between Customer Churn and Complaints

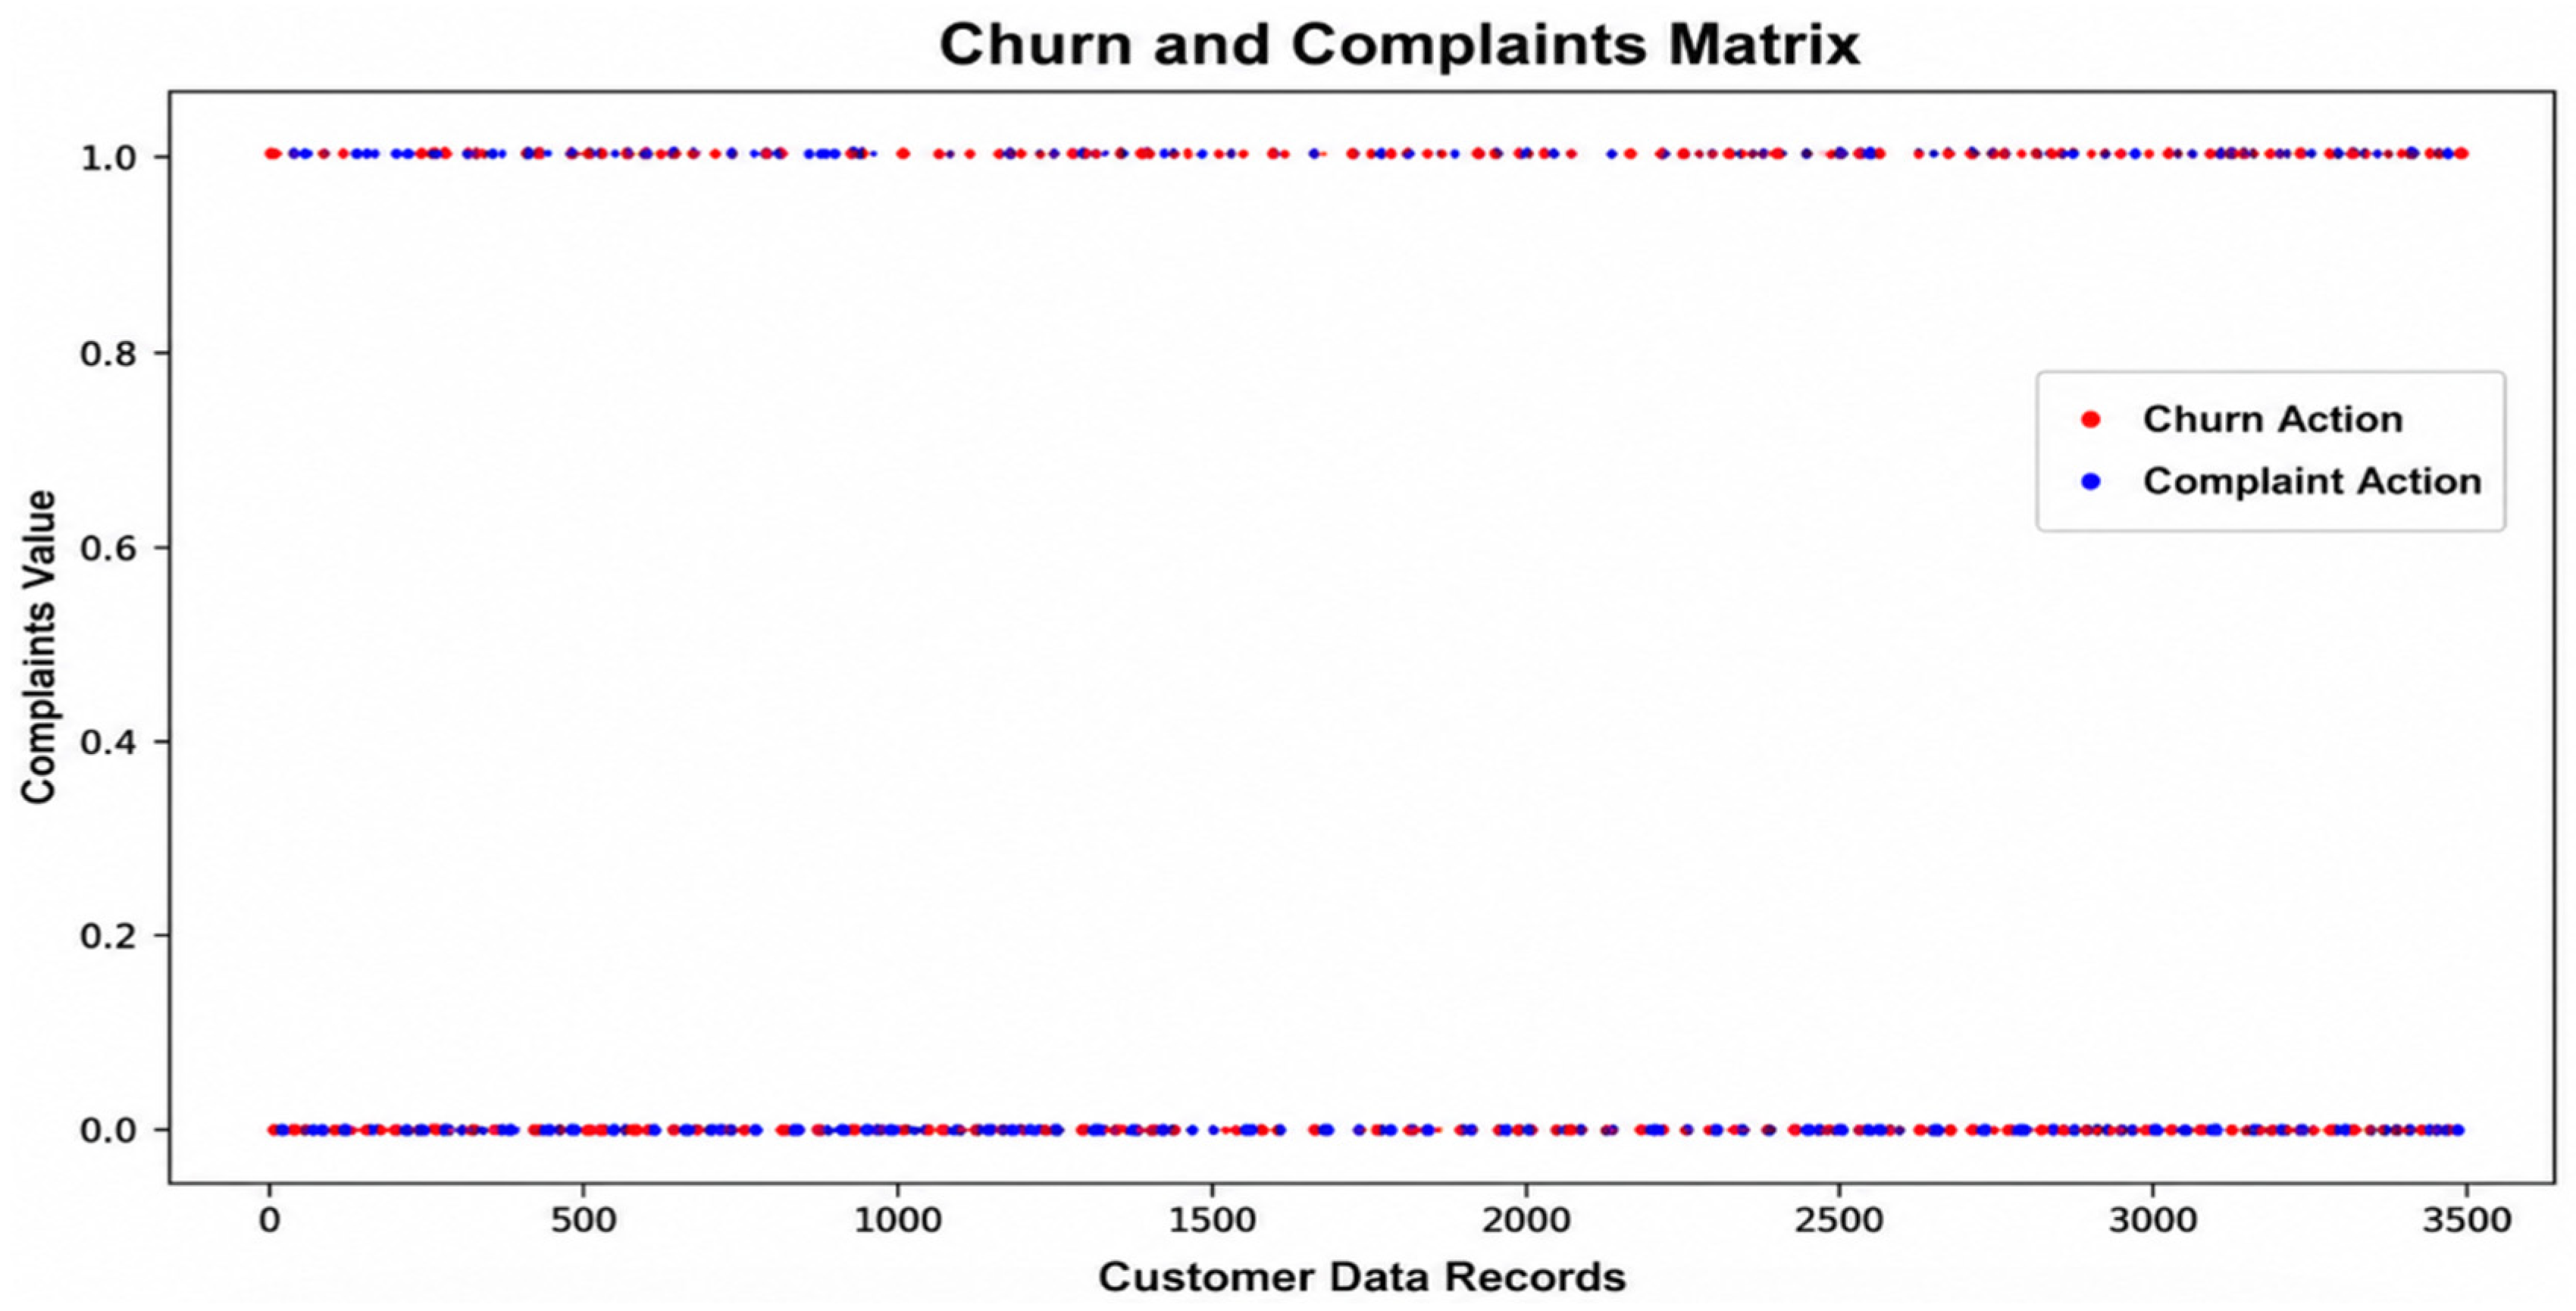
Based on the abovementioned dataset, the relationship between customer churn and complaints was assessed. As shown in Figure 5, the red line indicates instances of customer churn, where “1” represents a churn event and “0” indicates no churn. Correspondingly, the blue line represents customer complaints, where “1” signifies a recorded complaint and “0” denotes the absence of complaints.
It is evident that churn events frequently coincide with complaints, as shown by the overlap of red and blue markers at the top of the graph. Conversely, the continuous line of zeros at the bottom of both churn and complaints suggests high levels of customer satisfaction, indicating that customers without churn are generally content with their service and less likely to file complaints. These patterns highlight the importance of addressing customer complaints proactively to reduce churn and enhance customer retention.
As a result, it is obvious that there exists a correlation between churn events and customer complaints. This is visually represented by the peaks at “1” on both the churn and complaint lines (red and blue, respectively). This correlation suggests that customers who end up leaving the service are more likely to have expressed dissatisfaction through complaints prior to their departure.
On the other hand, the large segment of continuous zeros for both churn and complaints indicates a broad customer base that does not engage in either activity. This is an indicator of customer satisfaction, as those who do not churn or complain are likely pleased with their service. This could be due to effective service delivery, satisfactory customer support, or the perceived value of the service matching or exceeding the cost.
Interestingly, there are also patterns where customers might have complaints, but these complaints did not turn into churn, accounting for almost 15% of the cases.
Moreover, the pattern observed in the graph should prompt strategic considerations within the company. Since there is a noticeable overlap between churn and complaints, addressing complaints efficiently could serve as a critical lever for reducing churn. It suggests that proactive complaint management, timely resolution of issues, and perhaps even preemptive service adjustments based on common complaint themes could help in retaining customers.
Nonetheless, the evidence from the findings also supports the need for a proactive approach to customer service. Companies might benefit from deploying predictive analytics to identify potential complainants and churn risks based on customer usage patterns, service interruptions, and other predictive indicators.

6. Conclusions

In conclusion, the goal of analyzing data related to customer complaints and customer churn is to increase customer retention, which in turn enhances the company’s image, its productivity, and its profits. Every customer complaint serves as an opportunity to improve service and prevent potential churn.
Through this predictive analysis, we were able to highlight the presence of a correlation between the duration, the time and the frequency of calls, and their impact on customer churn and complaints. Additionally, the findings also revealed a correlation between churners and complainers as those who have fewer complaints were more likely to be satisfied with the service, which in turn reduces their churn and increases their retention. Thus, ensuring that customer complaints are addressed with urgency and effectiveness can transform potentially negative experiences into positive ones, fostering customer loyalty.

Author Contributions

Conceptualization, H.I. and V.D.; methodology, H.I.; software, H.I.; validation, H.I. and V.D.; formal analysis, H.I.; investigation, H.I.; resources, H.I.; data curation, H.I.; writing—original draft preparation, H.I.; writing—review and editing, H.I. and V.D.; visualization, H.I.; supervision, V.D.; project administration, V.D.; funding acquisition, none. All authors have read and agreed to the published version of the manuscript.

Funding

This research received no external funding.

Institutional Review Board Statement

Not applicable.

Informed Consent Statement

Not applicable.

Data Availability Statement

The data supporting the findings of this study are not publicly available due to privacy and confidentiality restrictions imposed by the telecommunications company from which the data were obtained. Data may be available from the corresponding author upon reasonable request and with permission from the data owner.

Conflicts of Interest

The authors declare no conflict of interest.

References

  1. Morgeson, F.V.; Hult, G.T.M.; Mithas, S.; Keiningham, T.; Fornell, C. Turning Complaining Customers into Loyal Customers: Moderators of the Complaint Handling–Customer Loyalty Relationship. J. Mark. 2020, 84, 79–99. [Google Scholar] [CrossRef] [Scilit]
  2. Garín-Muñoz, T.; Pérez-Amaral, T.; Gijón, C.; López, R. Consumer complaint behaviour in telecommunications: The case of mobile phone users in Spain. Telecommun. Policy 2016, 40, 804–820. [Google Scholar] [CrossRef] [Scilit]
  3. Lockett, A.R. Online Marketing Strategies for Increasing Sales Revenues of Small Retail Businesses. Ph.D. Thesis, Walden University, Minneapolis, MN, USA, 2018. Available online: https://scholarworks.waldenu.edu/dissertations (accessed on 11 May 2024).
  4. Ajibola, A. Cornerstone: A Collection of Scholarly Cornerstone: A Collection of Scholarly and Creative Works for Minnesota and Creative Works for Minnesota the Relationship Between Organizations’ Response to Customer the Relationship Between Organizations’ Response to Customer Complaints, Customer Trust, and Loyalty Complaints, Customer Trust, and Loyalty. Cornerstone. 2021. Available online: https://cornerstone.lib.mnsu.edu/etds (accessed on 11 May 2024).
  5. Berceanu, D.C.-A.; Pânișoară, G.; Popovici, A.-F.; Ghiță, C.M. Quality of Life and the Digital Service Landscape: The Moderating Role of Customer Complaining Effort. Behav. Sci. 2023, 13, 375. [Google Scholar] [CrossRef] [Scilit] [PubMed]
  6. Filip, A. Complaint Management: A Customer Satisfaction Learning Process. Procedia. Soc. Behav. Sci. 2013, 93, 271–275. [Google Scholar] [CrossRef] [Scilit]
  7. Choi, C. Predicting Customer Complaints in Mobile Telecom Industry Using Machine Learning Algorithms. Master’s Thesis, Purdue University, West Lafayette, IN, USA, 2018. Available online: https://docs.lib.purdue.edu/open_access_theses (accessed on 23 February 2024).
  8. Allioui, H.; Mourdi, Y.; Allioui, H.; Mourdi, Y. Exploring the Full Potentials of IoT for Better Financial Growth and Stability: A Comprehensive Survey. Sensors 2023, 23, 8015. [Google Scholar] [CrossRef] [Scilit] [PubMed]
  9. Hudspeth, S. Linkedin. The Power of Customer Complaints: Turning Challenges into Opportunities. 2024. Available online: https://www.linkedin.com/pulse/power-customer-complaints-turning-challenges-ceo-of-tmo-turbo-olfac (accessed on 10 April 2024).
  10. Chambers, J.; Mullick, S.; Smith, D. Harvard Business Review. How to Choose the Right Forecasting Technique. 1971. Available online: https://hbr.org/1971/07/how-to-choose-the-right-forecasting-technique (accessed on 10 April 2024).
  11. Singh, J.; Wilkes, R.E. When consumers complain: A path analysis of the key antecedents of consumer complaint response estimates. J. Acad. Mark. Sci. 1996, 24, 350–365. [Google Scholar] [CrossRef] [Scilit]
  12. Berry, R.; Tanford, S.; Montgomery, R.; Green, A.J. How We Complain: The Effect of Personality on Consumer Complaint Channels. J. Hosp. Tour. Res. 2014, 42, 74–101. [Google Scholar] [CrossRef] [Scilit]
  13. Jaccard, J.; Jacoby, J. The sources, meaning, and validity of consumer complaint behavior: A psychological analysis. J. Retail. 1981, 57, 4–24. [Google Scholar]
  14. Kelley, K. Pennstate Extension. Understanding Your Customers: How Demographics and Psychographics Can Help. 2023. Available online: https://extension.psu.edu/understanding-your-customers-how-demographics-and-psychographics-can-help (accessed on 10 April 2024).
  15. Mozer, M.C.; Wolniewicz, R.; Grimes, D.B.; Johnson, E.; Kaushansky, H. Predicting subscriber dissatisfaction and improving retention in the wireless telecommunications industry. IEEE Trans. Neural Netw. 2000, 11, 690–696. [Google Scholar] [CrossRef] [Scilit] [PubMed]
  16. Huang, B.; Kechadi, M.T.; Buckley, B. Customer churn prediction in telecommunications. Expert Syst. Appl. 2012, 39, 1414–1425. [Google Scholar] [CrossRef] [Scilit]
  17. Kim, H.S.; Yoon, C.H. Determinants of subscriber churn and customer loyalty in the Korean mobile telephony market. Telecomm Policy 2004, 28, 751–765. [Google Scholar] [CrossRef] [Scilit]
  18. Available online: https://en.wikipedia.org/wiki/Random_forest (accessed on 10 April 2024).
Figure 1. Summary of the principal factors influencing subscriber dissatisfaction and the corresponding data sources for prediction created by the authors based on the findings reported in Mozer et al. [15].
Engproc 150 00063 g001
Figure 2. Confusion matrix for evaluating binary customer churn classification. Source: Created by the authors based on standard machine learning evaluation metrics [16].
Engproc 150 00063 g002
Figure 3. Customer complaint handling process.
Engproc 150 00063 g003
Figure 4. Histogram showing customer activity.
Engproc 150 00063 g004
Figure 5. Major correlation between customer churn and complaints records.
Engproc 150 00063 g005
Table 1. Dataset sample.
StateAccount LengthArea CodeInt PlanVMail PlanVMail MessageDay MinsDay CallsDay ChargeEve MinsEve CallsEve ChargeNight MinsNight CallsNight ChargeIntl MinsIntl CallsIntl ChargeCustServ CallsCustServ CallsChurnComplaint
zone017128415382–4657noyes25265.111045.07197.49916.78244.79111.011032.71False.0
zone034107415371–7191noyes26161.612327.47195.510316.62254.410311.4513.733.71False.0
zone030137415358–1921nono0243.411441.38121.211010.3162.61047.3212.253.290False.0
zone03484408375–9999yesno0299.47150.961.9885.26196.9898.866.671.782False.0
zone03575415330–6626yesno0166.711328.34148.312212.61186.91218.4110.132.733False.1
zone002118510391–8027yesno0223.49837.98220.610118.75203.91189.186.361.70False.0
zone020121510355–9993noyes24218.28837.09348.510829.62212.61189.577.572.033False.0
zone024147415329–9001yesno01577926.69103.1948.76211.8969.537.161.920False.1
zone019117408335–4719nono0184.59731.37351.68029.89215.8909.718.742.351False.0
zone033141415330–8173yesyes37258.68443.9622211118.87326.49714.6911.253.020False.0
zone01665415329–6603nono0129.113721.95228.58319.42208.81119.412.763.434True.1
zone03874415344–9403nono0187.712731.91163.414813.89196948.829.152.460False.0
zone013168408363–1107nono0128.89621.9104.9718.92141.11286.3511.223.021False.0
zone02695510394–8006nono0156.68826.62247.67521.05192.31158.6512.353.323False.0
zone01362415366–9238nono0120.77020.52307.27626.11203999.1413.163.544False.0
zone033161415351–7269nono0332.96756.59317.89727.01160.61287.235.491.464True.0
zone01485408350–8884noyes27196.413933.39280.99023.8889.3754.0213.843.731False.0
zone03593510386–2923nono0190.711432.42218.211118.55129.61215.838.132.193False.0
zone03576510356–2992noyes33189.76632.25212.86518.09165.71087.461052.71False.0
zone03873415373–2782nono0224.49038.15159.58813.56192.8748.681323.511False.0
zone010147415396–5800nono0155.111726.37239.79320.37208.81339.410.642.860False.0
Disclaimer/Publisher’s Note: The statements, opinions and data contained in all publications are solely those of the individual author(s) and contributor(s) and not of MDPI and/or the editor(s). MDPI and/or the editor(s) disclaim responsibility for any injury to people or property resulting from any ideas, methods, instructions or products referred to in the content.