3. Numerical Simulations and Results
This section presents the numerical simulation results obtained from the proposed modal-based harmonic analysis of the four-bus Zeta DC–DC converter. The objective of the simulations is to investigate the resonance behavior, voltage amplification, and harmonic vulnerability of the system over a wide frequency range, extending up to 200 MHz.
Table 1 summarizes the electrical parameters of the four-bus Zeta DC–DC converter used in the harmonic and modal analysis. The model includes parasitic resistances and inductances of the switching device and inductive elements, as well as the coupling and output capacitors, in order to accurately capture high-frequency dynamics. The inclusion of the diode parasitic capacitance and load resistance allows the representation of realistic operating conditions and resonance behavior beyond the low-frequency range. All parameters correspond to typical values used in medium-power DC–DC converter applications and are assumed to be constant over the analyzed frequency range.
Table 2 presents the main simulation settings and frequency sweep conditions adopted in this study. A two-stage frequency domain analysis is employed, consisting of a coarse sweep over a wide frequency range up to 200 MHz, followed by localized fine sweeps around the detected resonance peaks. This approach significantly reduces computational cost while preserving high resolution in the vicinity of critical resonances. Sequential current injection at each bus is applied to evaluate spatial sensitivity and worst-case voltage amplification. The dominant resonance modes, participation factors, and voltage responses are extracted at each frequency point to enable comprehensive resonance characterization.
The analysis combines nodal impedance modeling, eigenvalue-based modal decomposition, participation factor evaluation, and multi-point current injection. This integrated approach enables a systematic comparison of resonance characteristics as a function of frequency and injection location, providing both global and localized insight into the dynamic behavior of the converter.
The results are illustrated through a set of complementary plots, including dominant modal impedance trends, bus voltage responses, worst-case voltage envelopes, injection severity maps, and Bode-like representations. Together, these figures reveal the relationship between modal dominance, spatial voltage distribution, and resonance sensitivity, forming a comprehensive basis for discussion and design-oriented interpretation.
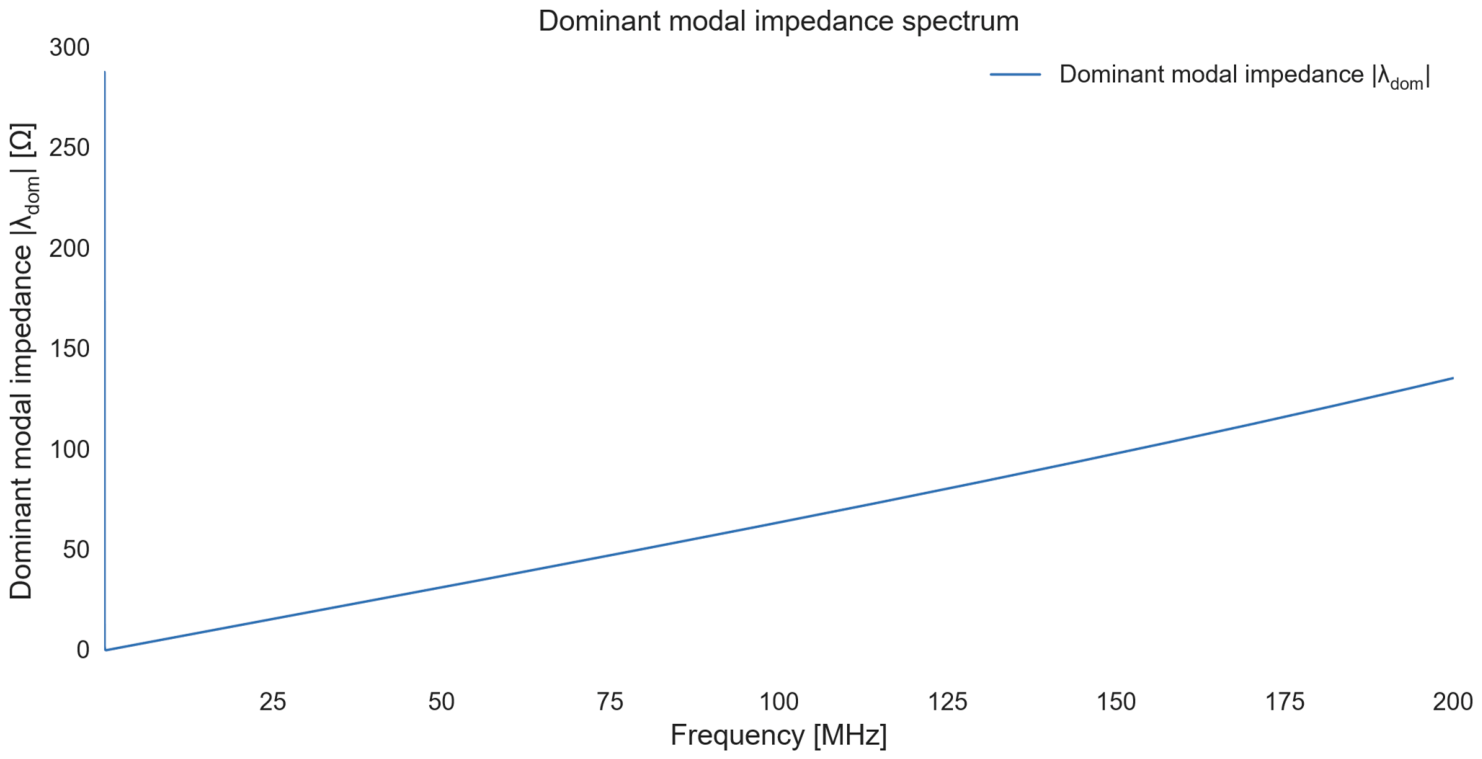
Figure 1 shows the dependence of the dominant modal impedance ∣
λ∣ on frequency in the range up to 200 MHz. A monotonic increase of ∣
λ∣ with increasing frequency is observed, which indicates that the equivalent impedance of the dominant mode becomes larger in the high-frequency range (influence of reactive elements).
At the very beginning of the range, a strongly pronounced peak is visible at very low frequencies, which is “compressed” towards zero due to the scale of the frequency axis. This behavior is usually an indicator of quasi-resonance/near-singularity of Z(ω) in the low-frequency region (or a numerical singularity near DC), therefore, for a clearer interpretation of low frequencies, a logarithmic (Bode-like) scale and a separate zoom in the initial range are appropriate.
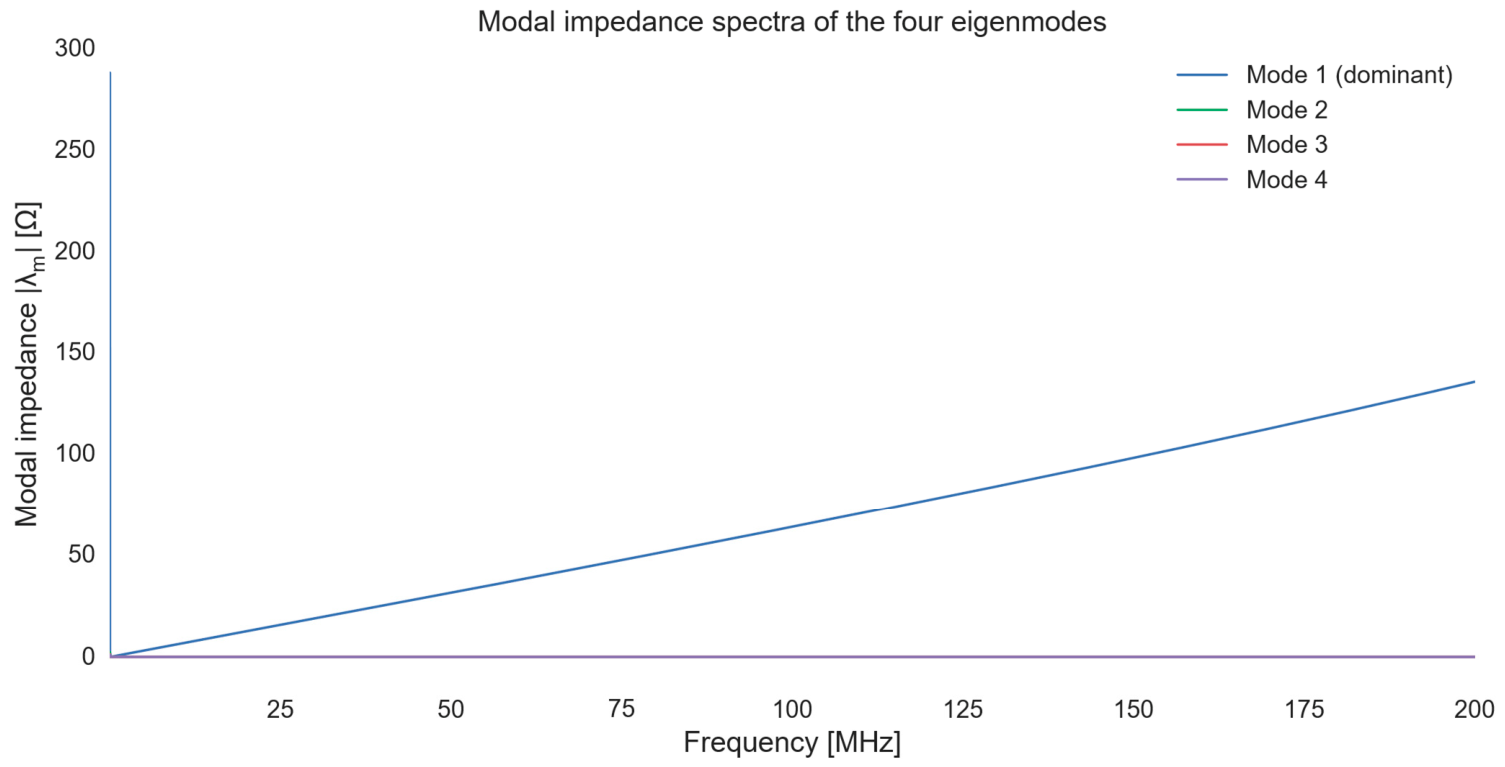
Figure 2 shows the modal impedances ∣λm∣ of the matrix
Z(
ω) =
Y(
ω) − 1 for the four eigenmodes of the 4-node Zeta model. It is clearly seen that Mode 1 dominates the entire frequency range considered, with its modal impedance increasing almost linearly with frequency. This indicates that the dynamics of the system are mainly determined by this mode and that the remaining modes have a significantly smaller contribution to the total impedance. Modes 2–4 remain practically negligible compared to Mode 1 and are visually “fused” to the axis, meaning that they do not significantly participate in the resonant behavior in this frequency range. This strong separation of the modal impedances confirms that the system can be effectively analyzed by a dominant modal approach, which simplifies the interpretation of the resonances and the participation of individual nodes.
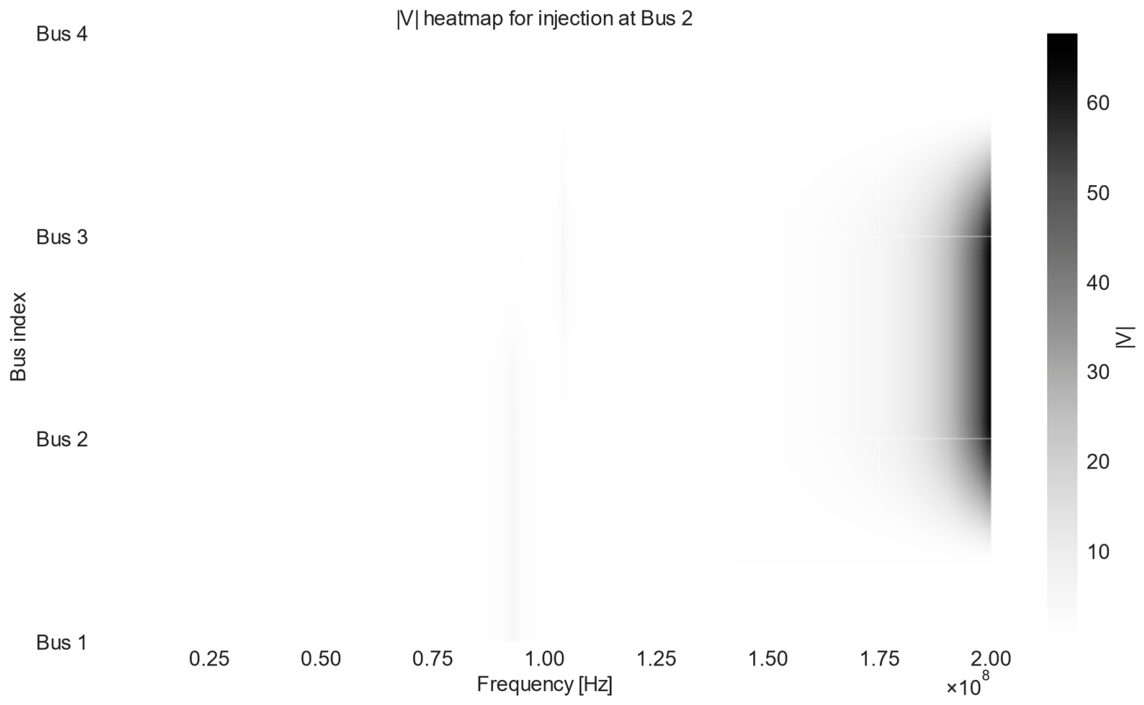
Figure 3 illustrates the magnitude of the bus voltage responses ∣
V∣ as a function of frequency when a unit current is injected at Bus 2.
It can be observed that the voltage response remains negligible over most of the frequency range, indicating a well-damped behavior at low and mid frequencies. However, a pronounced high-frequency resonance emerges close to the upper end of the analyzed spectrum (around the hundreds of MHz range), where significant voltage amplification is observed.
The resonance is not uniformly distributed across all buses. Instead, Bus 3 and Bus 4 exhibit the highest voltage magnitudes, revealing a strong coupling between the injection point (Bus 2) and the downstream nodes of the Zeta converter. This behavior highlights the dominant role of the output-side reactive elements in shaping the high-frequency resonance and identifies the most vulnerable buses under harmonic current excitation.
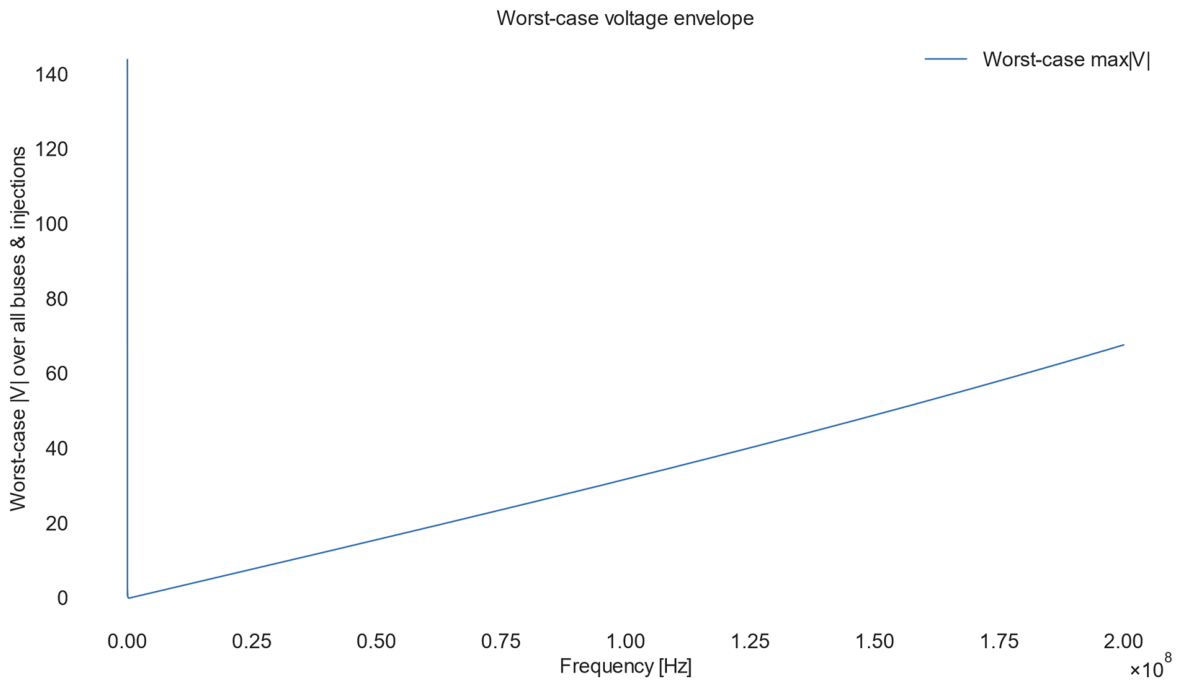
Figure 4 presents the worst-case voltage envelope, defined as the maximum voltage magnitude observed across all buses and all injection locations as a function of frequency.
It can be seen that the worst-case response increases almost monotonically with frequency, indicating a progressive loss of harmonic robustness in the high-frequency range.
Similar to the behavior observed in the dominant modal impedance (
Figure 1), a sharp peak appears at very low frequencies, which is compressed near the origin due to the linear frequency scale. Beyond this region, the envelope grows steadily, revealing that high-frequency excitation leads to increasingly severe voltage amplification regardless of the injection location.
Importantly, this figure provides a conservative upper bound on the expected voltage magnitudes in the system. It therefore serves as a practical indicator for identifying critical frequency ranges where the Zeta converter is most vulnerable to harmonic disturbances.
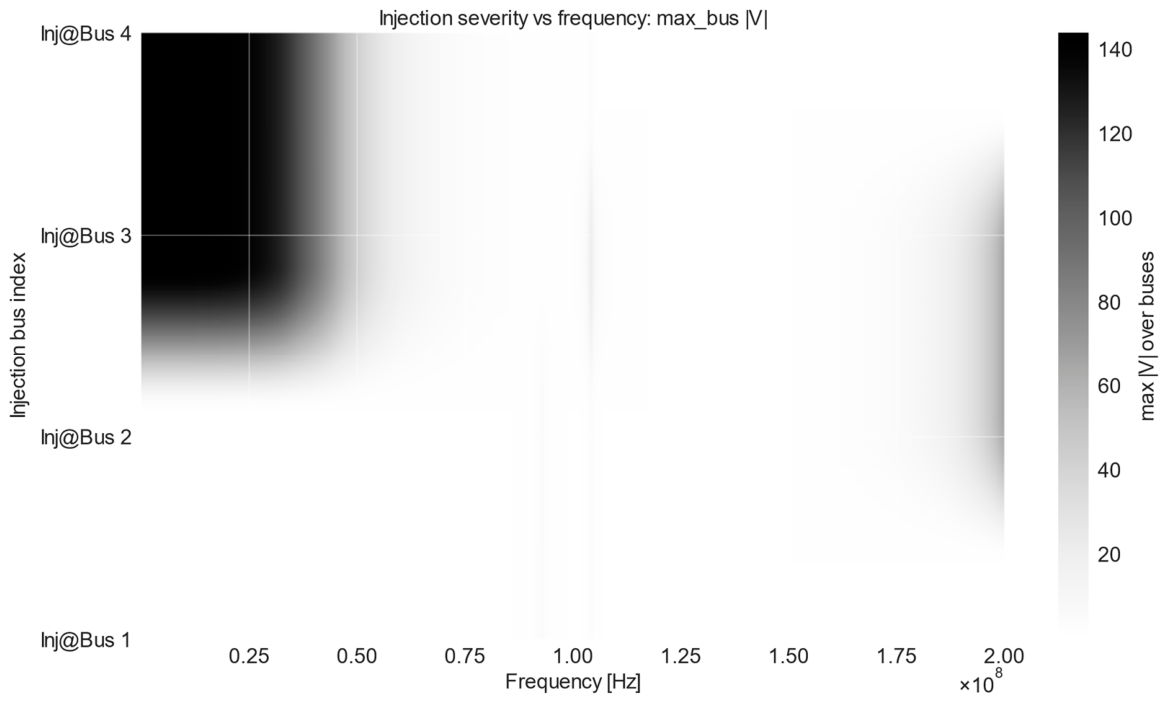
Figure 5 illustrates the injection severity as a function of frequency, expressed as the maximum voltage magnitude observed across all buses for a given injection location.
Each row corresponds to a different injection bus, while the color intensity represents the worst-case voltage response in the network.
The results clearly indicate that the severity of harmonic excitation strongly depends on the injection location. In particular, injections at Bus 3 and Bus 4 lead to significantly higher voltage amplification in the low-frequency region, as evidenced by the dark regions in the heatmap. This behavior suggests a strong coupling between these buses and the dominant resonant modes of the system.
In contrast, injections at Bus 1 and Bus 2 exhibit considerably lower impact over most of the frequency range, indicating a more benign interaction with the network dynamics. At higher frequencies, a gradual increase in severity is observed for all injection locations, consistent with the trends identified in the dominant modal impedance and worst-case envelope.
Overall, this figure highlights that both frequency and injection location are critical factors in determining the harmonic vulnerability of the Zeta converter.
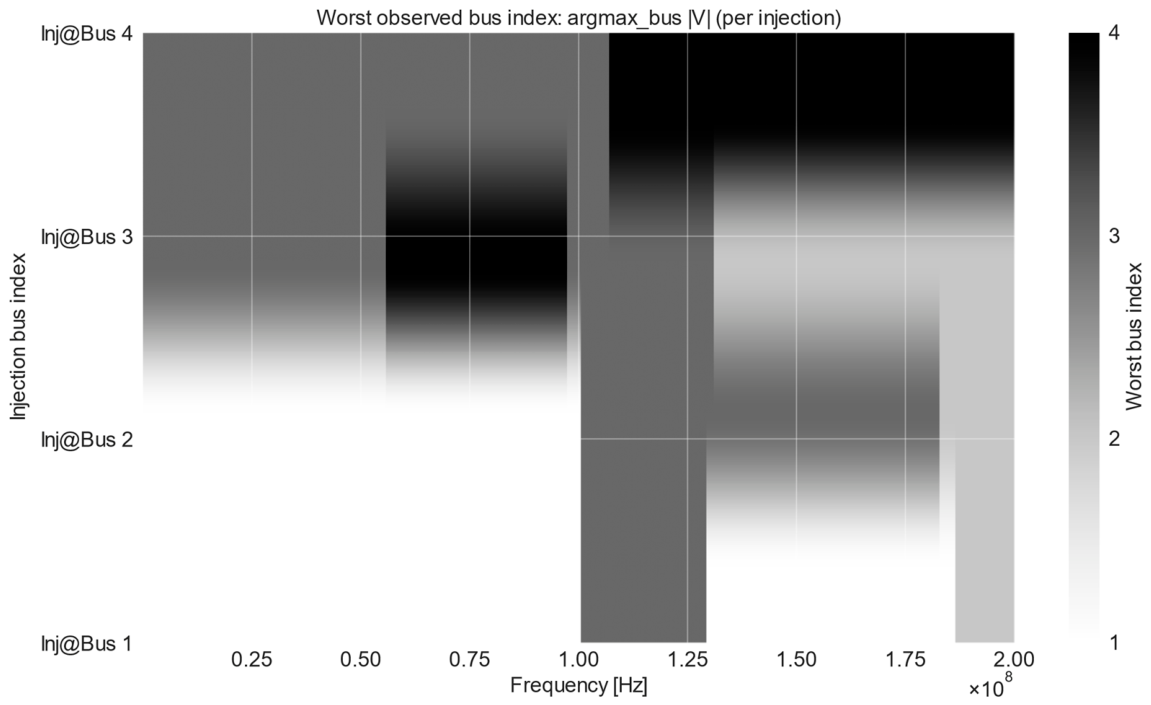
Figure 6 shows the index of the most affected bus as a function of frequency and injection location, defined as the bus at which the maximum voltage magnitude occurs for a given injection.
Each row corresponds to an injection bus, while the color encodes the index of the bus experiencing the highest voltage response.
The figure reveals a clear frequency-dependent migration of the worst observed bus, indicating that resonant energy is redistributed across the network depending on both excitation frequency and injection location. In the low-frequency range, the worst response is primarily localized near the injection point, whereas at higher frequencies the maximum voltage shifts toward downstream buses, most notably Bus 4.
This behavior highlights the presence of frequency-dependent mode shapes, where different buses dominate the system response at different resonance bands. As a result, the most vulnerable bus cannot be identified solely based on topology or proximity to the excitation source, but must be determined through frequency domain analysis.
Overall, this figure complements the injection severity map (
Figure 5) by indicating where the most critical voltages appear in the system for each excitation scenario.
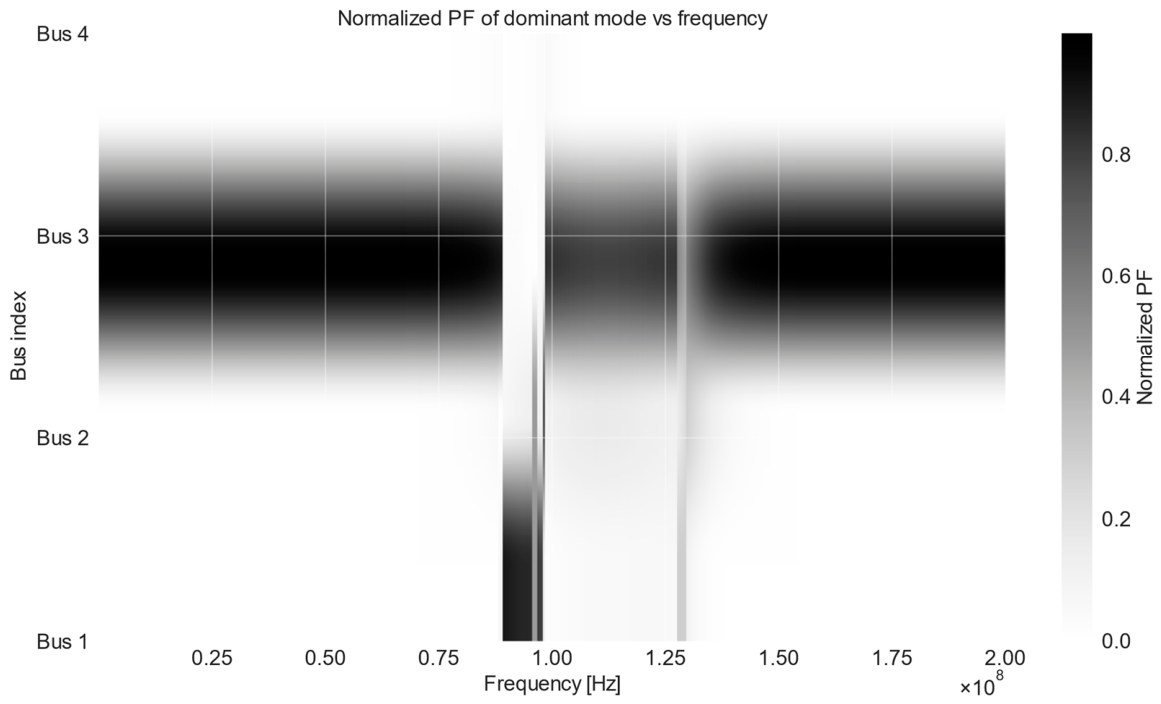
Figure 7 presents the normalized PF of the dominant mode as a function of frequency for each bus.
The color intensity represents the relative contribution of each bus to the dominant resonant mode, normalized such that the sum of PFs equals unity at each frequency.
The results reveal a clear frequency-dependent redistribution of modal participation among the buses. In the low-frequency range, the dominant mode is primarily associated with Bus 3, indicating that this node plays a leading role in shaping the system’s resonant behavior. Around the transition region near 100 MHz, a sharp change in participation is observed, corresponding to a modal crossover.
At higher frequencies, the dominant participation gradually shifts toward Bus 4, explaining the increased voltage amplification and vulnerability observed at this node in
Figure 5 and
Figure 6. This confirms that the spatial distribution of resonance effects is governed by the underlying modal structure rather than by the injection location alone.
Overall, this figure provides the modal explanation for the injection severity and worst-bus maps, demonstrating a strong correlation between dominant-mode participation factors and observed voltage amplification patterns.
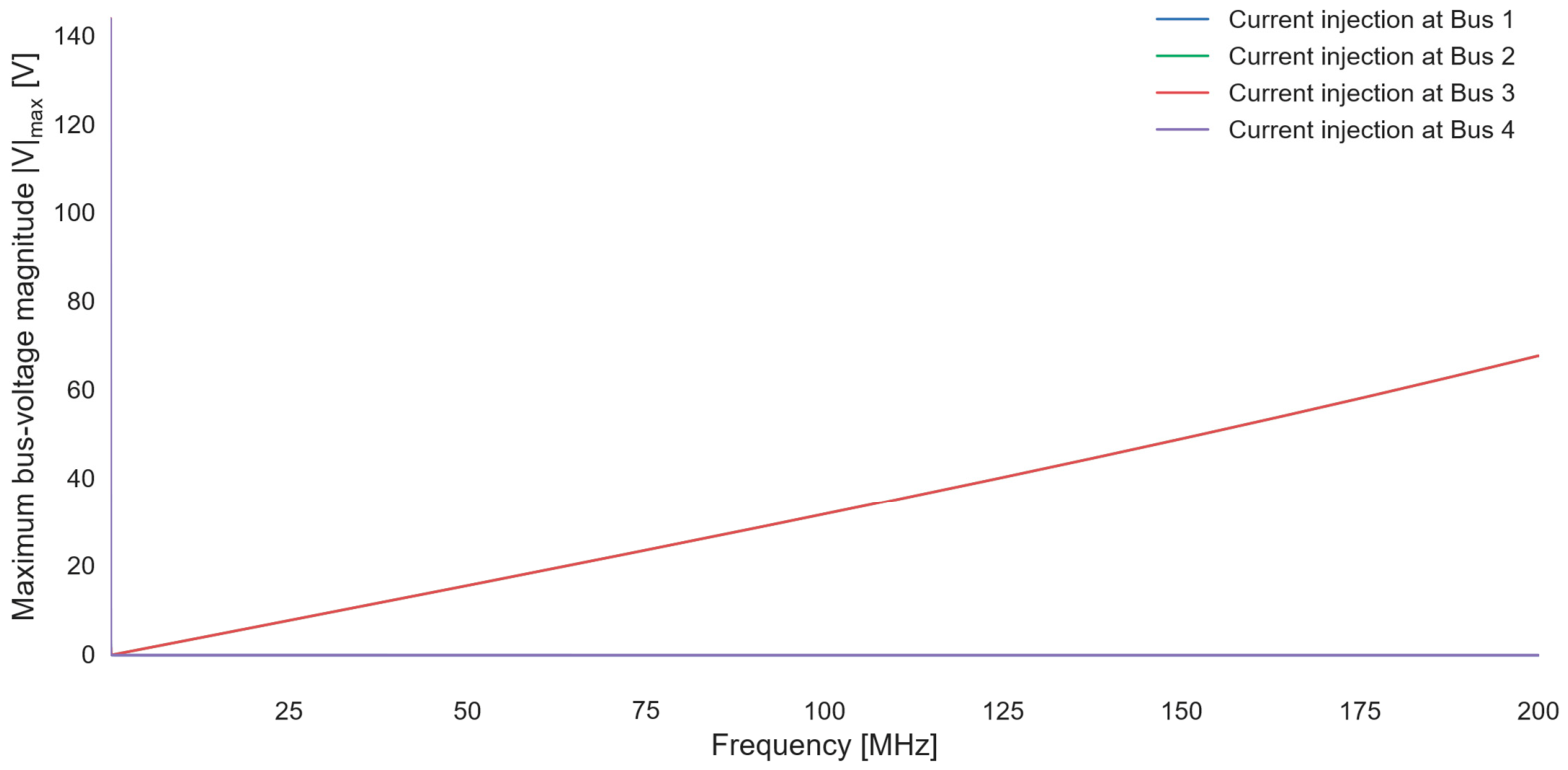
Figure 8 compares the resonance response for different injection locations, expressed as the maximum voltage magnitude observed across all buses for each injection as a function of frequency.
Each curve corresponds to a single injection bus, allowing a direct comparison of how strongly each excitation location couples to the resonant dynamics of the system.
The results demonstrate a pronounced disparity between injection locations. Injections at Bus 3 and Bus 4 produce significantly higher voltage amplification over a wide frequency range, with the response increasing steadily toward higher frequencies. This indicates strong coupling of these buses to the dominant resonant modes identified in
Figure 1 and
Figure 7.
In contrast, injections at Bus 1 and Bus 2 result in negligible voltage amplification across most of the spectrum, suggesting a weak interaction with the system’s resonant structure. The sharp low-frequency spike visible for some injections corresponds to the low-frequency resonance compressed near the origin on the linear frequency scale.
Overall, this figure confirms that the resonance behavior of the Zeta converter is highly injection-location-dependent, and that certain buses act as critical excitation points capable of triggering severe system-wide voltage amplification.
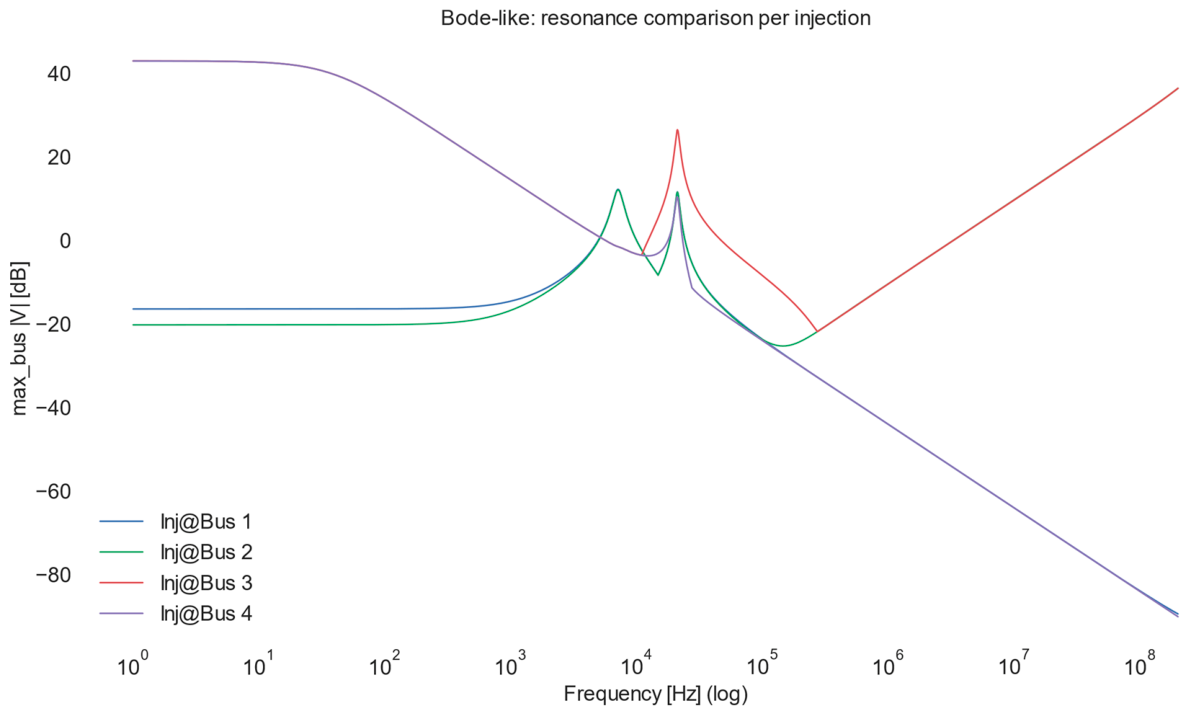
Figure 9 presents a Bode-like representation of the resonance behavior for different injection locations, expressed as the maximum bus voltage magnitude in decibels as a function of frequency.
Each curve corresponds to a single injection bus, enabling a clear comparison of resonance strength and bandwidth on a logarithmic frequency scale.
The logarithmic representation reveals several important features that are less evident in linear plots. First, multiple resonance peaks become clearly distinguishable in the mid-frequency range, particularly for injections at Bus 3 and Bus 4, confirming their strong coupling to the dominant system modes. These peaks correspond to the modal transitions and participation factor shifts identified in
Figure 1,
Figure 7 and
Figure 8.
Second, the magnitude and slope of the curves differ substantially between injection locations. Injections at Bus 1 and Bus 2 remain well below 0 dB over most of the frequency range, indicating limited voltage amplification. In contrast, injections at Bus 3 exhibit pronounced resonant amplification, while Bus 4 shows broadband sensitivity, especially at lower frequencies.
Finally, the Bode-like plot highlights the wide frequency span over which resonance effects can be significant, emphasizing that harmonic vulnerability in the Zeta converter is not confined to narrow frequency bands but can extend over several decades.
The peaks in
Figure 9 are due to the dominant mode. They are strongest when the current injection is applied to a bus with a high participation factor for that mode. Therefore, Bus 3 and Bus 4 provide the strongest amplification, while Bus 1 and Bus 2 have a weaker effect.
4. Discussion
The results clearly demonstrate that the harmonic behavior of the four-bus Zeta converter is dominated by a single modal impedance over the majority of the investigated frequency range. As shown in
Figure 1 and
Figure 2, the dominant eigenvalue of the nodal impedance matrix increases monotonically with frequency, while the remaining modes remain comparatively suppressed. This indicates a strong modal decoupling, where one mode governs the high-frequency response of the system.
The absence of multiple competing dominant modes simplifies the resonance interpretation but simultaneously highlights the risk of pronounced voltage amplification when the dominant mode aligns with external excitation. In particular, the sharp increase in the dominant modal impedance at very low frequencies and its steady growth toward the high-frequency range suggest that both low-frequency dynamics and parasitic high-frequency effects must be considered in the converter design.
The voltage heatmap in
Figure 3 reveals a highly non-uniform spatial distribution of voltage magnitudes under current injection at Bus 2. While lower frequencies exhibit relatively low and evenly distributed voltage levels, a pronounced amplification emerges close to the upper end of the frequency range. This behavior indicates that the resonance is not only frequency-selective but also spatially localized.
Figure 4 further confirms this observation by presenting the worst-case voltage envelope across all buses and injection points. The envelope follows a similar trend to the dominant modal impedance, reinforcing the strong correlation between modal dominance and voltage amplification. This validates the use of modal impedance magnitude as a reliable indicator for identifying critical resonance regions.
A key contribution of this work lies in the systematic comparison of resonance severity under sequential current injection at each bus.
Figure 5 demonstrates that the resonance strength is strongly dependent on the injection location, with injections at Buses 3 and 4 producing significantly higher voltage amplification compared to Buses 1 and 2.
This observation is further clarified in
Figure 6, which maps the worst observed bus index for each injection and frequency. The results show that certain buses consistently act as “victims” of resonance, regardless of where the disturbance is applied. Such behavior reflects the intrinsic topology and energy storage distribution of the Zeta converter, rather than a purely local effect.
The normalized PF map in
Figure 7 provides crucial insight into the physical origin of the observed resonances. Across wide frequency regions, a single bus exhibits dominant participation in the governing mode, indicating that the resonance energy is primarily associated with specific reactive elements connected to that node.
The abrupt changes in participation around certain frequencies coincide with transitions in the dominant mode index and resonance peaks, confirming that modal interaction plays a decisive role in shaping the system’s harmonic response. This behavior supports the interpretation that high-frequency resonances are driven by parasitic capacitances and inductive branches, while lower-frequency behavior is governed by bulk energy storage elements.
Figure 8 and
Figure 9 summarize the resonance behavior from an injection-centric perspective. The linear-scale comparison (
Figure 8) highlights the absolute severity differences between injection points, whereas the Bode-like representation (
Figure 9) emphasizes relative amplification in decibel scale over several decades of frequency.
The Bode-like plots clearly show that different injection locations excite the dominant mode with varying efficiency, leading to distinct resonance peaks and slopes. This result underscores that resonance risk assessment based on a single excitation point may be misleading, and that multi-injection analysis is essential for robust converter evaluation.
From a design perspective, the presented results indicate that resonance mitigation strategies should prioritize buses with high modal participation and high vulnerability, rather than focusing solely on the injection source. Damping networks, layout optimization, or targeted component tuning at these critical nodes are expected to be more effective than uniform mitigation approaches.
Moreover, the proposed two-stage frequency sweep combined with modal metrics provides an efficient and scalable framework for identifying critical resonance regions in complex power electronic systems.
5. Conclusions
This paper presented a comprehensive modal-based harmonic analysis framework for a four-bus Zeta DC–DC converter, combining nodal impedance modeling, eigenvalue decomposition, participation factor evaluation, and multi-point current injection. The proposed methodology enables systematic identification and interpretation of resonance phenomena over a wide frequency range extending up to 200 MHz.
The numerical results demonstrated that the harmonic behavior of the Zeta converter is predominantly governed by a single dominant mode across most of the analyzed spectrum. This dominant modal impedance shows a strong correlation with voltage amplification and worst-case envelope trends, confirming its suitability as a compact and physically meaningful resonance indicator.
By introducing sequential current injection at each bus, the study revealed that resonance severity is highly dependent on the excitation location. In particular, injections at intermediate and output-side buses were shown to induce significantly higher voltage amplification compared to input-side excitations. This finding highlights the importance of considering spatial excitation diversity when assessing harmonic vulnerability in multi-node power electronic systems.
The participation factor analysis provided additional insight into the physical origin of the resonances, linking dominant modes to specific nodes and associated reactive elements. Abrupt changes in participation around resonance frequencies indicate modal transitions and underline the role of parasitic components in shaping high-frequency behavior.
Furthermore, the two-stage frequency sweep strategy proved effective in efficiently capturing both global resonance trends and localized high-Q peaks, while maintaining computational tractability. The resulting Bode-like representations and heatmap visualizations offer intuitive tools for resonance comparison, vulnerability assessment, and design-oriented interpretation.
Overall, the proposed framework extends conventional impedance-based analysis by incorporating modal dominance, spatial sensitivity, and multi-injection perspectives. The approach is general and can be readily applied to other DC–DC converter topologies and multi-node power electronic systems, supporting more robust resonance-aware design and mitigation strategies.