1. Introduction
Diabetic Retinopathy (DR) is a major cause of vision loss among diabetic patients, making early detection essential for effective treatment and prevention of vision loss [
1]. In recent years, both classical machine learning-based approaches, as well as deep learning models, have reported high diagnostic performance on public diabetic retinopathy datasets. Several studies have shown that these methods can successfully detect retinal lesions when evaluated under controlled experimental conditions [
2]. However, most existing approaches are validated on a limited number of datasets, often sharing similar acquisition characteristics [
3]. A key challenge that remains insufficiently addressed is the generalization of automated screening systems across heterogeneous datasets. Retinal image datasets differ substantially in terms of camera type, illumination, resolution, field of view, and annotation availability. Consequently, methods that rely on specific preprocessing assumptions or dataset-dependent characteristics may not perform consistently when applied to images acquired under different conditions [
4,
5]. In this work, we build upon classical image processing and machine learning-based retinal lesion detection and analyze its behavior across multiple public diabetic retinopathy datasets. The focus is placed on identifying practical limitations related to dataset variability and preprocessing assumptions.
The main contributions of the paper are: (1) proposing a robust image preprocessing pipeline for diabetic retinopathy detection; (2) a hybrid local-global strategy for region segmentation; (3) a simple, yet effective classification model, rather than complex neural models; (4) cross-dataset evaluation of this model on several diabetic retinopathy datasets.
2. Related Work
2.1. Classical Image Processing and Machine Learning Approaches
Early solutions for retina image analysis are based on image processing techniques, such as illumination correction, contrast enhancement, segmentation of relevant structures, and handcrafted feature extraction [
6], combined with machine learning classifiers [
7]. For example, in [
8], a hybrid framework was proposed that integrates Voronoi diagrams. The method includes vessels, exudate, and microaneurysm segmentation, followed by handcrafted feature extraction. Five classifiers were evaluated: Support Vector Machines (SVM), logistic regression, Naive Bayes, k-Nearest Neighbor (kNN), and decision trees (DT) with 800 retinal images from the MESSIDOR dataset [
9]. The DT’s performance reached an area under curve (AUC) of 0.96 and an accuracy of 0.90. The logistic regression also showed an AUC of 0.74, while kNN had an AUC of 0.69. However, the SVM classifier exhibited limited performance, with an AUC of only 0.54. This suggests that margin-based classifiers such as SVM may be sensitive to feature-space transformations introduced by spatial modeling techniques. Also, the evaluation was performed only on the MESSIDOR dataset, without cross-dataset validation, raising concerns regarding generalization.
2.2. Deep Learning-Based and Hybrid Approaches
With the development of deep neural networks (DNN) [
10], recent studies have proposed solutions to enable learning of relevant features directly from data. Some works combine classical image processing with deep learning models, resulting in hybrid approaches. EfficientNetV2S CNNs [
11] have been trained on approximately 70,000 fundus images collected from EyePACS and MESSIDOR datasets, and the system achieved a sensitivity of 0.95 and a specificity of 0.92. However, the reference standard relied on a single experienced ophthalmologist, and the study did not include a true cross-dataset evaluation scenario, leaving the issue of domain generalization only partially addressed.
2.3. Generalization and Cross-Dataset Evaluation
In fact, the issue of generalization remains insufficiently investigated in many studies. Public diabetic retinopathy datasets differ significantly in camera type, image resolution, illumination conditions, field of view, and availability of ground truth annotations, which may substantially affect model robustness. A concrete example of performance degradation under domain shift is reported in [
12], where a DeepLabV3+ network with a ResNet-50 backbone was trained on the IDRiD dataset [
13] and evaluated in both intra and cross-dataset settings. Under intra-dataset evaluation on IDRiD, the model achieved a mean AUC-PR of 0.77, a mean IoU of 0.66, and a mean F1-score of 0.79. However, when trained on IDRiD and tested on DDR without fine-tuning, performance decreased significantly to a mean AUC-PR of 0.25, a mean intersection over union (IoU) of 0.20, and a mean F1-score of 0.34, indicating a substantial loss of robustness under domain shift.
3. Methodological Approach
In this study, a baseline approach is used for retina lesion detection comprising an image processing and machine learning pipeline. This pipeline includes image preprocessing, anatomical structure removal, candidate lesion extraction, feature computation, and classification. The baseline method was developed and validated on retinal fundus images acquired under specific conditions and on the IDRiD dataset.
3.1. Image Preprocessing
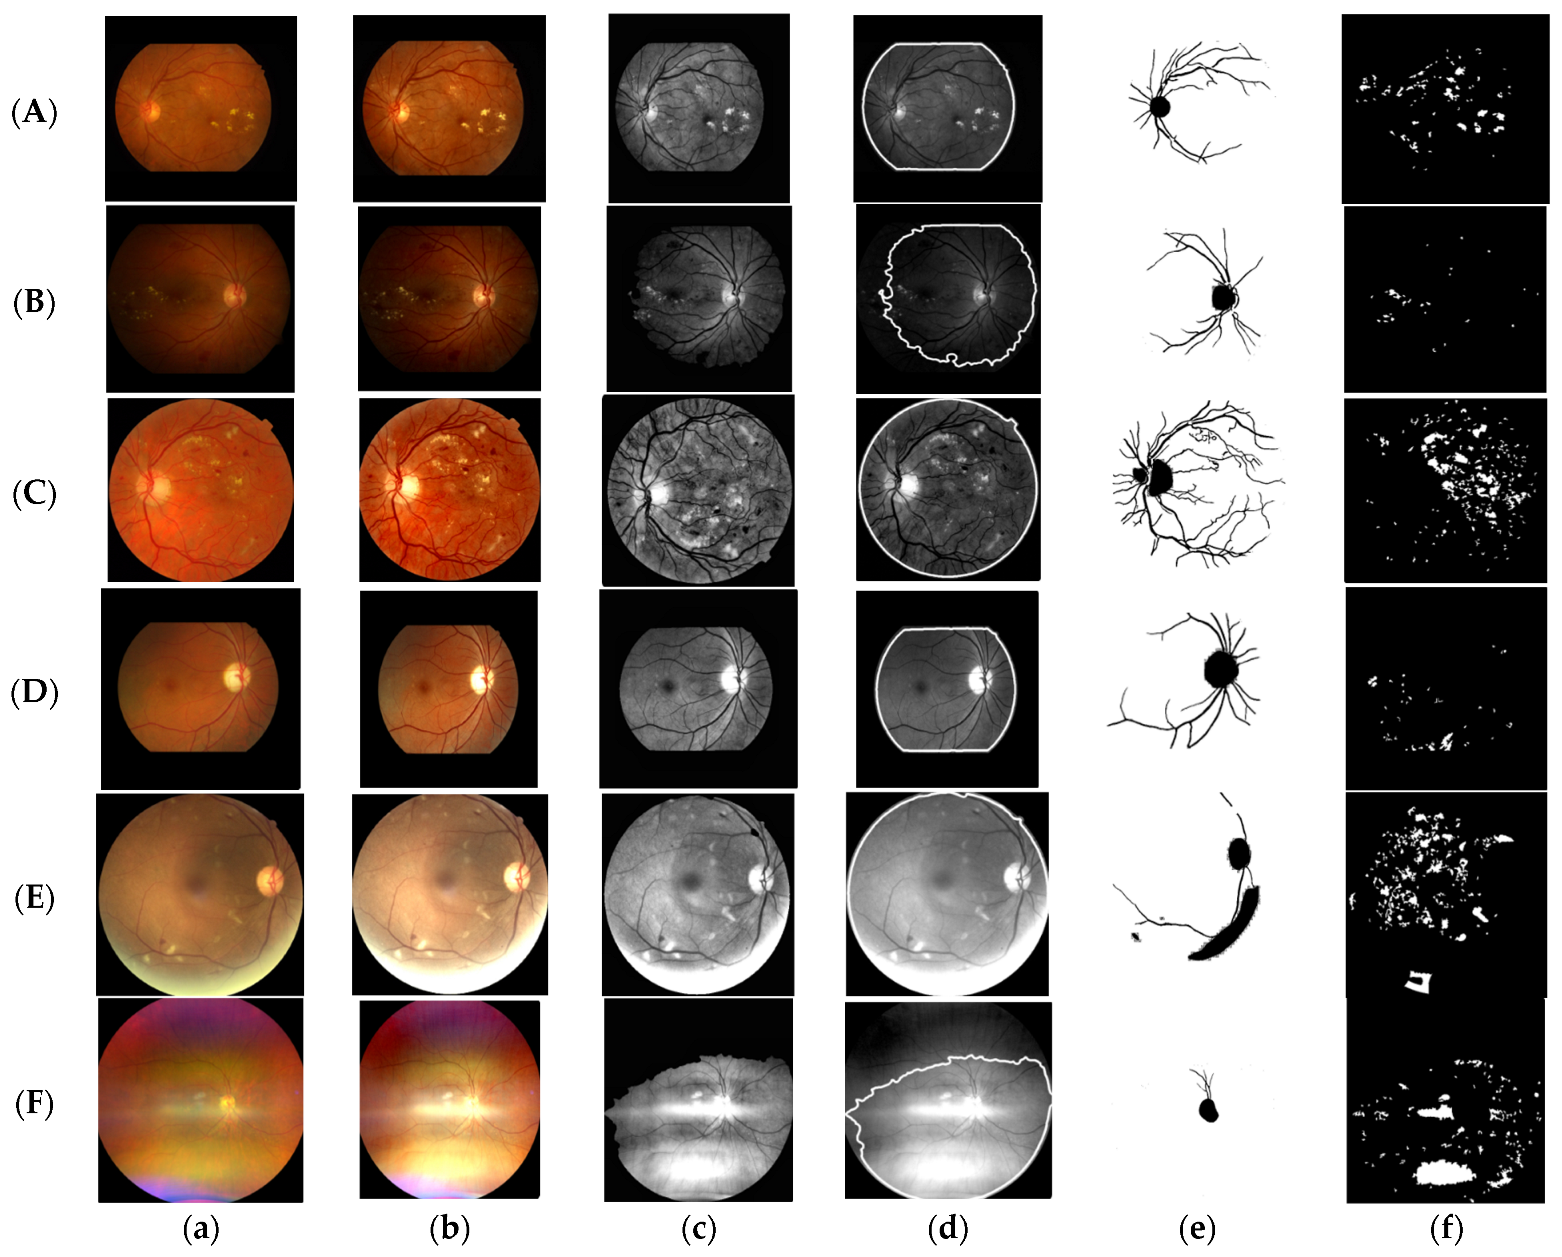
The goal of preprocessing is to enhance the visual appearance of exudates, reduce illumination variations and background noise, in 512 × 512 pixels resized images, as in
Figure 1A–F(a). The input RGB (Red-Green-Blue) images are first normalized through a color space transformation to YIQ (
Figure 1b), which separates luminance information (Y) from chromatic components (I and Q), using the transformations: Y = 0.299 × R + 0.587 × G + 0.115 × B, I = 0.596 × R − 0.274 × G − 0.322 × B, Q = 0.212 × r − 0.523 × G + 0.311 × B. By adjusting luminance channel, lesion contrast is improved [
12].
Local contrast is further enhanced using Contrast Limited Adaptive Histogram Equalization (CLAHE) [
13,
14], which improves the visibility of fine structures while preventing excessive noise amplification, as in
Figure 1c. To ensure that only relevant retinal regions are analyzed, an automatic field-of-view mask is generated to exclude the black background and artifacts [
15]. The preprocessing stage concludes with a series of morphological operations designed to reduce residual noise (
Figure 1d).
3.2. Removal of Anatomical Structures
Certain anatomical structures present in retinal images, such as the optic disc and blood vessels, exhibit visual properties similar to hard exudates and can significantly increase the number of false positive detections. To mitigate this effect, these structures are explicitly identified using a U-Net DNN architecture and then excluded from further processing [
10]. This deep learning-based solution was adopted after classical methods proved sensitive to illumination and contrast variations. Blood vessels are detected using the Frangi vesselness filter [
18]. The resulting vessel map is binarized and refined through connected component analysis to remove small artifacts (
Figure 1e).
3.3. Candidate Region Segmentation
This step aims to identify bright areas that may correspond to exudates using an adaptive Fuzzy C-Means (FCM) segmentation strategy [
19]. It partitions the image pixels into C clusters by minimizing the objective function:
where x
i represents the intensity of pixel i, c
j denotes the centroid of cluster j,
is the membership degree of pixel i to cluster j, and m > 1 is the fuzziness parameter. The membership values are iteratively updated, based on overlapping image windows. For each local window, the mean of the cluster centroids is used as an adaptive threshold, allowing the segmentation process to account for local intensity variations. In parallel, a global FCM-based threshold is computed over the entire image, by combining local and global information T = α × T
local + (1 − α) × T
local, where α ∈ [0, 1] controls the balance between local adaptability and global consistency. This hybrid local–global strategy produces a binary mask highlighting the candidate region.
3.4. Feature Extraction and Classification
For each candidate pixel identified by the segmentation stage, a vector is extracted in a small neighborhood to describe local intensity, color, texture, and edge information. The resulting feature vectors are used to train an SVM classifier with a radial basis function (RBF) kernel and decision function: f(x) =
x
iy
iK(x
i,x) + b, where x
i are the support vectors, y
i are the class labels, α
i are the learned coefficients, and b is the bias term. The RBF kernel is given by: K(x
i,x
j) = exp(−γ‖x
i − x
j‖
2), where γ controls the kernel width. Feature normalization is applied to ensure balanced influence across dimensions, and class imbalance is handled through weighted learning. Model hyperparameters are optimized using grid search combined with group-based cross-validation. Post-processing operations are then applied to refine the final detection mask by removing small or elongated regions and enforcing spatial consistency [
20,
21]. The final exudate detection result obtained after SVM classification is illustrated in
Figure 1f.
3.5. Datasets Used for Cross-Corpus Evaluation
To evaluate how well the developed method generalizes, experiments were conducted on several public retinopathy datasets. These datasets differ in image acquisition conditions, resolution, illumination, camera type, and annotation availability. The baseline method was originally developed on the IDRiD dataset, which provides ground truth images for exudates. To assess the behavior of the method outside its development domain, the pipeline was applied without any modification to additional public datasets, highlighting possible generalization limitations. As shown in
Table 1, the selected datasets exhibit significant variability in terms of image resolution, illumination, and annotation format. These structural differences directly impact the evaluation protocol and allow the analysis of cross-dataset generalization behavior.
4. Results and Discussions
4.1. Experimental Results and Discussions on Datasets Preprocessing
On the IDRiD dataset, all stages of the pipeline have operated under conditions similar to those used during baseline development.
Figure 1A(a–f) illustrates the main processing steps of the proposed method on the IDRiD dataset, highlighting the progression from the original fundus image to the final exudate detection mask and its performance.
Figure 1B(a–f) reflects the behavior of the pipeline on the DIARETDB1 dataset. Compared to IDRiD, the main weakness appears at the field-of-view (FOV) detection stage (d) [
21]. In DIARETDB1, the retinal borders are less uniform, and the peripheral illumination is more variable. This is because the FOV mask is generated automatically, and it leads to an imprecise contour. Some retinal areas may be incorrectly excluded, while small background regions may remain inside the mask. This is problematic because all subsequent steps operate strictly inside the detected FOV. Consequently, even though normalization and contrast enhancement behave reasonably well, the final detection becomes less accurate. The degradation is therefore not caused mainly by the classifier, but by the sensitivity of the FOV detection stage to variations in image acquisition conditions.
Unlike DIARETDB1, where illumination variability affected the FOV detection, the MESSIDOR dataset provides images with relatively uniform illumination and good global contrast (
Figure 1C(a–f)). As a result, the preprocessing stages behave more consistently, and the overall pipeline remains stable. The FOV mask is more regular, the vessels map is cleaner, and the final exudate detection is spatially consistent with the visible lesions.
Also, for the e-Ophtha dataset, the pipeline functions well, as seen in
Figure 1D(a–f). The images have good quality and sufficient contrast, allowing most preprocessing steps to behave consistently. FOV detection and anatomical masking are correctly applied, and the classifier is able to identify the main bright lesion regions. Due to slight variations in illumination, a small number of false positives may still appear in the final mask.
For the DDR dataset,
Figure 1E(a–f), the pipeline starts to degrade mainly in the early preprocessing and anatomical masking stages. First, the illumination is slightly washed out, so even after YIQ normalization and CLAHE, the contrast is not as clean as in IDRiD. The retina appears brighter in some regions and less defined in others. Consequently, the FOV contour is not perfectly regular and slightly leaks toward the bright peripheral regions. As a result, parts of the background may be included, or the retinal boundary may be inaccurately traced. The second issue appears in the anatomical structure masking, as vessel detection is incomplete and noisy. Also, the optic disc masking is affected by brightness variations, which reduces the precision of anatomical suppression.
The behavior on the TJDR dataset further highlights the sensitivity to image acquisition conditions, as in
Figure 1F(a–f), in particular for color and illumination variations. The YIQ normalization and CLAHE amplify certain bright regions. Consequently, the FOV mask is less precise, leading to irregular borders and partial exclusion of relevant retinal areas. Although anatomical structure masking still removes most vessels and the optic disc, the initial variability propagates to the final detection stage, resulting in an increased number of false positives and less spatially consistent exudate regions.
4.2. Training Protocol for SVM Baseline
The SVM model was trained exclusively on the IDRiD dataset, which provides pixel-level ground truth annotations for exudates. Pixels overlapping annotated exudate regions were assigned as positive samples, while background and vessel pixels were used as negative samples.
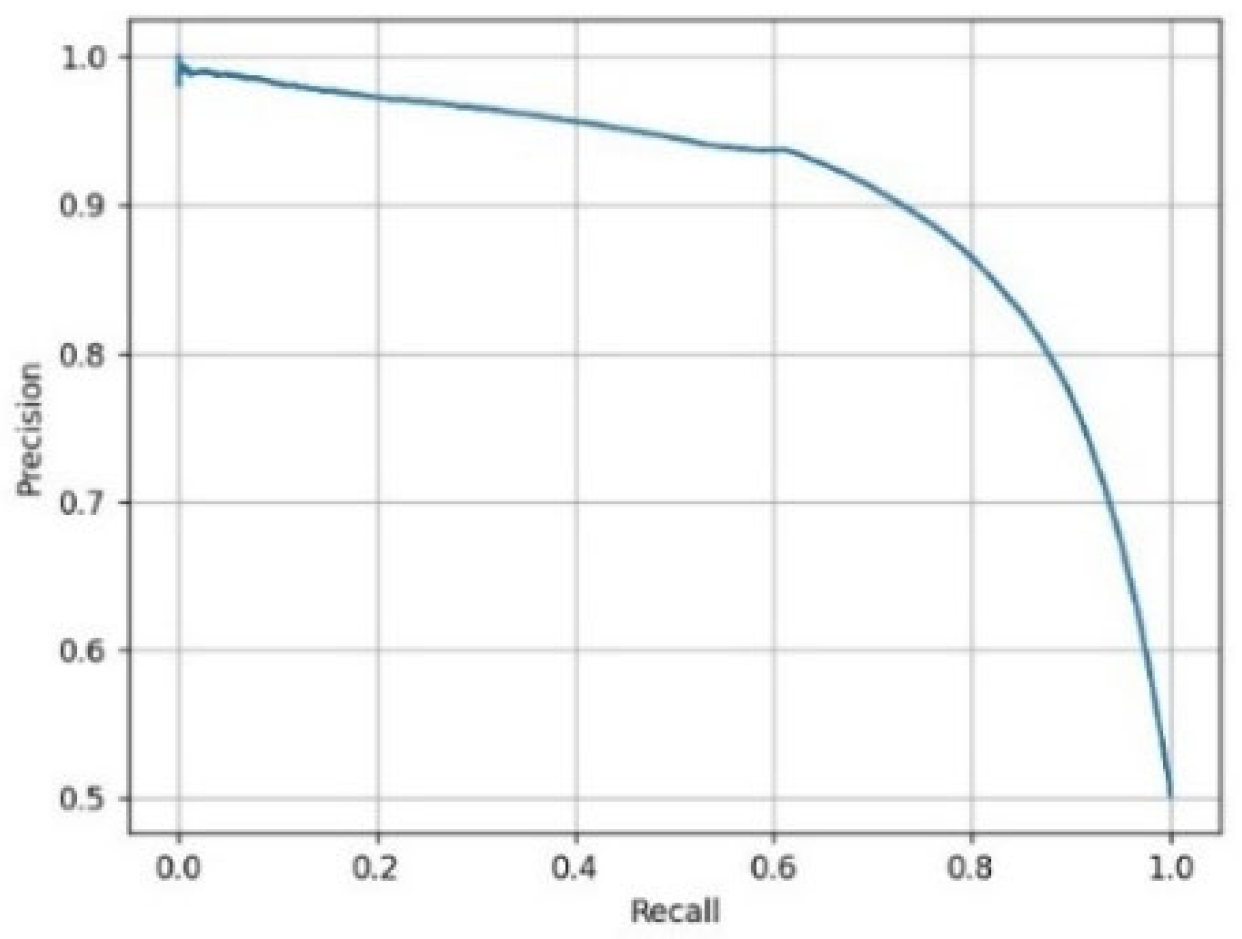
Figure 2 presents the “Precision–Recall” curve on the IDRiD set, illustrating the balance between sensitivity and precision and confirming the stable performance of the trained model on the development dataset. No fine-tuning was performed when evaluating the method on external datasets, enabling a controlled cross-dataset generalization analysis.
4.3. Cross-Dataset Evaluation Strategy
To assess how well the proposed method generalizes, a strict cross-dataset evaluation strategy was adopted. The model trained on the IDRiD was evaluated on other public datasets: DIARETDB1, MESSIDOR, e-ophtha EX, DDR, and TJDR. No retraining, fine-tuning, or parameter adjustment was performed when switching datasets. All preprocessing steps, segmentation parameters, SVM hyperparameters, and decision thresholds were kept unchanged. In this way, any variation in performance can be attributed solely to differences in image characteristics, such as illumination, resolution, field-of-view shape, or annotation format. This setup reflects a realistic screening scenario, where a model developed on one dataset is expected to operate on images acquired under different clinical and technical conditions. The observed performance degradation therefore highlights the impact of dataset variability and the sensitivity of classical processing stages to domain shift. Although the final detection result represents the overall performance of the system, the robustness of the pipeline strongly depends on several intermediate stages that are particularly sensitive to dataset characteristics. In fact, preprocessing, FOV masking, and anatomical structure removal often have a greater impact on generalization, rather than the classifier itself.
4.4. Cross-Dataset Evaluation Metrics
As the selected datasets provide different types of annotations (e.g., pixel-level and image-level), the evaluation protocol was adapted accordingly for each dataset. The predicted binary exudate mask was compared directly with the corresponding ground truth mask. Standard classification metrics were computed, including Accuracy, Precision, Recall/Sensitivity, and F1-score. These metrics were calculated using the confusion matrix elements, ensuring that only valid retinal pixels were considered. For datasets with image-level labels only, the task was reformulated as image-level classification. An image was labeled as positive if the detected exudate area exceeded a threshold. The results in
Table 2 clearly show that the model performs best on IDRiD, the dataset used for training. With 0.96 accuracy and an F1-score of 0.75, the pipeline works very well when the images have similar characteristics to the training data. This is expected, since all preprocessing and classification parameters were tuned on this dataset.
On MESSIDOR and e-Ophtha, the performance remains relatively good. Accuracy stays about 90%, and the F1-scores around 0.50 indicate that the model can generalize reasonably well when image quality, contrast, and illumination are similar to IDRiD. On DIARETDB1 and DDR, the performance decreases. Sensitivity and precision are lower, which means the model both misses some lesions and produces more false positives. This suggests that variations in illumination and field-of-view shape affect the earlier preprocessing stages. The weakest results are observed on TJDR, where sensitivity and precision drop significantly. This indicates poor generalization to images with different acquisition conditions and a stronger domain shift. Overall, the model performs well in familiar conditions but struggles when image characteristics change, highlighting the limitations of a classical pipeline under cross-dataset evaluation.
5. Conclusions
This paper analyzed the cross-dataset generalization ability of an image processing and SVM-based pipeline for exudates detection in retinal fundus images. The model was trained exclusively on the IDRiD dataset and then directly applied to several external datasets without retraining or parameter adjustments. The results show that the method performs very well on IDRiD, where all preprocessing steps, segmentation stages, and classification boundaries were originally calibrated.
However, when evaluated on heterogeneous datasets such as DIARETDB1, DDR, or TJDR, a clear performance degradation is observed. The experiments indicate that the main limitations do not originate primarily from the SVM classifier itself, but from earlier stages of the pipeline. Preprocessing operations, field-of-view detection, and anatomical structure masking are particularly sensitive to changes in illumination, contrast, and image acquisition conditions. When these stages become unstable, errors propagate to the final detection result, leading to increased false positives or missed lesions.
Datasets with more uniform image characteristics, such as MESSIDOR and e-Ophtha EX, show more stable behavior, confirming that classical pipelines can still achieve good performance when data conditions are similar to the development domain. Overall, this study highlights that generalization remains a major challenge for classical machine learning approaches in diabetic retinopathy screening.
Future work focuses on improving robustness through domain adaptation techniques, data augmentation strategies, or hybrid models that combine classical interpretability with the representation learning capabilities.
Author Contributions
Conceptualization, M.G.; methodology and software, I.-D.T.; validation, M.G.; formal analysis, I.-D.T. and M.G.; investigation, I.-D.T.; writing—original draft preparation, I.-D.T. and M.G.; writing—review and editing, M.G.; supervision, M.G. All authors have read and agreed to the published version of the manuscript.
Funding
This work is funded by the Romanian Government and co-financed by the European Union in the project with the title “Romanian Hub for Artificial Intelligence-HRIA”, Programme: “Smart Growth, Digitization and Financial Instruments Program”, Number MySMIS: 351416.
Institutional Review Board Statement
Not applicable.
Informed Consent Statement
Not applicable.
Data Availability Statement
The datasets used in experiments: IDRiD, DIARETDB1, MESSIDOR, e-ophtha EX, DDR, and TJDR are publicly available on their corresponding repositories.
Conflicts of Interest
The authors declare no conflict of interests.
References
- Wang, Z.; Li, S.; Li, M. Performance of Artificial Intelligence in Diabetic Retinopathy Screening: A Systematic Review and Meta-Analysis of Prospective Studies. Front. Endocrinol. 2023, 14, 1197783. [Google Scholar] [CrossRef] [Scilit]
- Joshi, S. A Review on Exudates Detection Methods for Diabetic Retinopathy. Biomed. Pharmacother. 2018, 97, 1454–1460. [Google Scholar] [CrossRef] [Scilit] [PubMed]
- Doğan, M.E.; Bilgin, A.B.; Sari, R.; Bulut, M. Head-to-Head Comparison of Diagnostic Performance of Three Non-Mydriatic Cameras for Diabetic Retinopathy Screening with Artificial Intelligence. Eye 2024, 38, 1694–1701. [Google Scholar] [PubMed]
- Chankhachon, S. Deep Learning Network with Illuminant Augmentation for Diabetic Retinopathy Segmentation using Comprehensive Anatomical Context Integration. Diagnostics 2025, 15, 2762. [Google Scholar] [CrossRef] [Scilit] [PubMed]
- Macedo, J.V.; Castro, H.; Andrade, D.C. Evaluation of the Diagnostic Performance of Artificial Intelligence in Diabetic Retinopathy Screening at a Primary Healthcare Center. ARVO J. 2025, 66, 4198. [Google Scholar]
- Cortes, C.; Vapnik, V. Support-Vector Networks. Mach. Learn. 1995, 20, 273–297. [Google Scholar] [CrossRef] [Scilit]
- Long, S.; Huang, X.; Chen, Z.; Pardhan, S.; Zheng, D. Automatic Detection of Hard Exudates in Color Retinal Images Using Dynamic Threshold and SVM Classification. BioMed Res. Int. 2019, 2019, 3926930. [Google Scholar] [CrossRef] [Scilit] [PubMed]
- Silva Castro, M.G.; Fechine, F.V.; Moraes, M.O.; Leitão, P.R.; Dornelas, A.C. Enhanced Performance in Automated Diabetic Retinopathy Diagnosis Achieved Through Voronoi Diagrams and Artificial Intelligence. Sci. Rep. 2025, 15, 35763. [Google Scholar] [CrossRef] [Scilit]
- Decencière, E.; Zhang, X.; Cazuguel, G.; Lay, B.; Cochener, B.; Trone, C.; Gain, P.; Ordonez, R.; Massin, P.; Erginay, A.; et al. Feedback on a Publicly Distributed Database: The Messidor Database. Image Anal. Stereol. 2014, 33, 231–234. [Google Scholar] [CrossRef] [Scilit]
- Goodfellow, I.; Bengio, J.; Courville, A. Deep Learning; MIT Press: Cambridge, MA, USA, 2016. [Google Scholar]
- Vinuja, S.; Sameera, K.A.; Kumar, K.T. Performance Analysis of Diabetic Retinopathy Classification using CNN. In Proceedings of the 3rd ICICV Conference, Coimbatore, India, 4–6 February 2021; pp. 823–828. [Google Scholar]
- Li, R.; Gu, Y.; Wang, X.; Pan, J. A Cross-Domain Weakly Supervised Diabetic Retinopathy. Bioengineering 2023, 10, 1100. [Google Scholar] [CrossRef] [Scilit] [PubMed]
- Porwal, P. IDRiD: Diabetic Retinopathy–Segmentation and Grading Challenge. Med. Image Anal. 2020, 59, 101561. [Google Scholar] [PubMed]
- Kauppi, T.; Kalesnykiene, V.; Kamarainen, J.-K.; Lensu, L.; Sorri, I.; Raninen, A.; Voutilainen, R.; Uusitalo, H.; Kälviäinen, H.; Pietilä, J. DIARETDB Diabetic Retinopathy Database and Evaluation Protocol. In Proceedings of the British Machine Vision Conference 2007, Coventry, UK, 10–13 September 2007; pp. 15.1–15.10. [Google Scholar]
- Decencière, E.; Cazuguel, G.; Zhang, X.; Thibault, G.; Klein, J.-C.; Meyer, F.; Marcotegui, B.; Quellec, G.; Lamard, M.; Danno, R.; et al. TeleOphta: Machine Learning and Image Processing Methods for Teleophthalmology. IRBM 2013, 34, 196–203. [Google Scholar] [CrossRef] [Scilit]
- Li, T.; Gao, Y.; Wang, K.; Guo, S.; Liu, H.; Kang, H. Diagnostic Assessment of Deep Learning Algorithms for Diabetic Retinopathy Screening. Inf. Sci. 2019, 501, 511–522. [Google Scholar] [CrossRef] [Scilit]
- Mao, J.; Ma, X.; Bi, Y.; Zhang, R. TJDR: A High-Quality Diabetic Retinopathy Pixel-Level Annotation Dataset. arXiv 2023, arXiv:2312.15389. [Google Scholar]
- Gonzales, R.C.; Woods, R.E. Morphological Image Processing. In Digital Image Processing, 3rd ed.; Prentice Hall: Hoboken, NJ, USA, 2018; pp. 638–648. [Google Scholar]
- Bezdek, J. Pattern Recognition with Fuzzy Objective Function Algorithms; Springer: New York, NY, USA, 1981. [Google Scholar]
- Verma, S.; Yadav, K. Detection of Hard Exudates in Retinopathy Images. Adv. Distrib. Comput. Artif. Intell. J. 2019, 8, 41–48. [Google Scholar] [CrossRef] [Scilit]
- Jyoti, P.M.; Samarendra, D. An Effective FOV Detection and Automatic Assessment of Diabetic Retinopathy. Comput. Biol. Med. 2016, 74, 30–34. [Google Scholar]
| Disclaimer/Publisher’s Note: The statements, opinions and data contained in all publications are solely those of the individual author(s) and contributor(s) and not of MDPI and/or the editor(s). MDPI and/or the editor(s) disclaim responsibility for any injury to people or property resulting from any ideas, methods, instructions or products referred to in the content. |