1. Background
As vital hubs for train docking and passenger transfer in urban rail systems, metro stations are a focal point for fire safety. Statistics show metro fires constitute about 32% of daily global fire incidents [
1], highlighting the urgency of evacuation research. To address urban challenges like congestion and land scarcity, construction of deep-buried metro stations (typically those with a track depth exceeding 30 m [
2]) has increased. These stations feature multi-level layouts, complex networks, and long, low-visibility evacuation routes, posing greater challenges during emergencies. In such environments, evacuee turnback behavior can cause disorientation, path conflicts, and congestion at critical points, significantly increasing risk and making it a key variable affecting evacuation efficiency.
Evacuation research addresses efficiency, safety, and management, with studies progressing from macroscopic to microscopic perspectives. Macroscopic research, as exemplified by Togawa’s speed–density relationship [
3] and Khaliunaa’s use of neural networks for exit planning, quantifies collective crowd movement to provide key simulation parameters [
4]. Microscopic studies focus on individual psychology and behavior, revealing that emotions like panic often cause irrational turnback behavior [
5]. For instance, Yang analyzed behavioral traits like herd mentality [
6], while Huang et al. found that in deep-buried stations, initial turnback can trigger widespread following behavior, severely worsening congestion at bottlenecks like fare gates [
7,
8]. Building on these insights, scholars apply simulations to optimize strategies: Mahdi Safari identified key factors in schools [
9], Zhang clarified staff priorities in hospitals [
10], and Lu integrated fire dynamics to propose metro station designs [
11]. This evolution from theory to application provides a foundation for specialized building safety.
While existing studies acknowledge the impact of psychology and behavior on evacuation, they predominantly address general scenarios, lacking a systematic quantitative analysis of turnback behavior in high-risk deep-buried metro stations. The triggers, quantified impact, and key constraints of this behavior remain unclear. To bridge this gap, this study employs field research and simulation to quantitatively analyze turnback behavior in deep-buried stations, focusing on triggers like uneven exit distribution. It examines how different turnback ratios and locations affect efficiency to identify key bottlenecks, providing a theoretical basis for emergency planning and safety management in such environments.
2. Method
To examine the impact of occupant turnback behavior on evacuation in deep-buried metro stations, this study combined field research and simulation. Field research first collected key parameters, including the station’s structure and passenger flow data. These parameters were used to develop a three-dimensional evacuation model, which simulated various turnback scenarios. The results were then analyzed to quantify the impact of turnback behavior.
2.1. Field Research
To understand the passenger flow characteristics of metro stations and obtain baseline data on the recent maximum evacuation occupancy for a specific station, video recording was conducted to capture passenger movements. The recent maximum evacuation number was calculated based on the cross-sectional passenger flow at key entry/exit points identified in the recordings.
The survey focused on the weekday morning peak hour (8:00–9:00), a period of high passenger volume. Video cameras were positioned at key locations including transfer corridors, security checkpoints, and exit fare gate arrays to record movement. A total of 60 data samples were collected at each of three critical points: security checkpoints, exit fare gates, and escalator landings. Each sample recorded the number of persons passing through the point within a one-minute interval.
The short-term maximum evacuation occupancy for the metro station was calculated to be 1067 persons, while the long-term maximum reached 2273 persons.
2.2. Simulation
Using Pathfinder v24.2 software, evacuation in a deep-buried metro station was simulated. The uneven distribution of emergency exits leads evacuees to initially choose the nearest exit, often causing congestion at isolated ones and triggering turnback behavior. To model this, specific locations (e.g., near fare gates or exits) were set as turnback-triggering zones in Steering mode. Agents with longer travel times to these zones were assigned as the turnback group. They first moved toward the trigger zone; upon arrival, they were redirected to an alternative exit, simulating a turnback path.
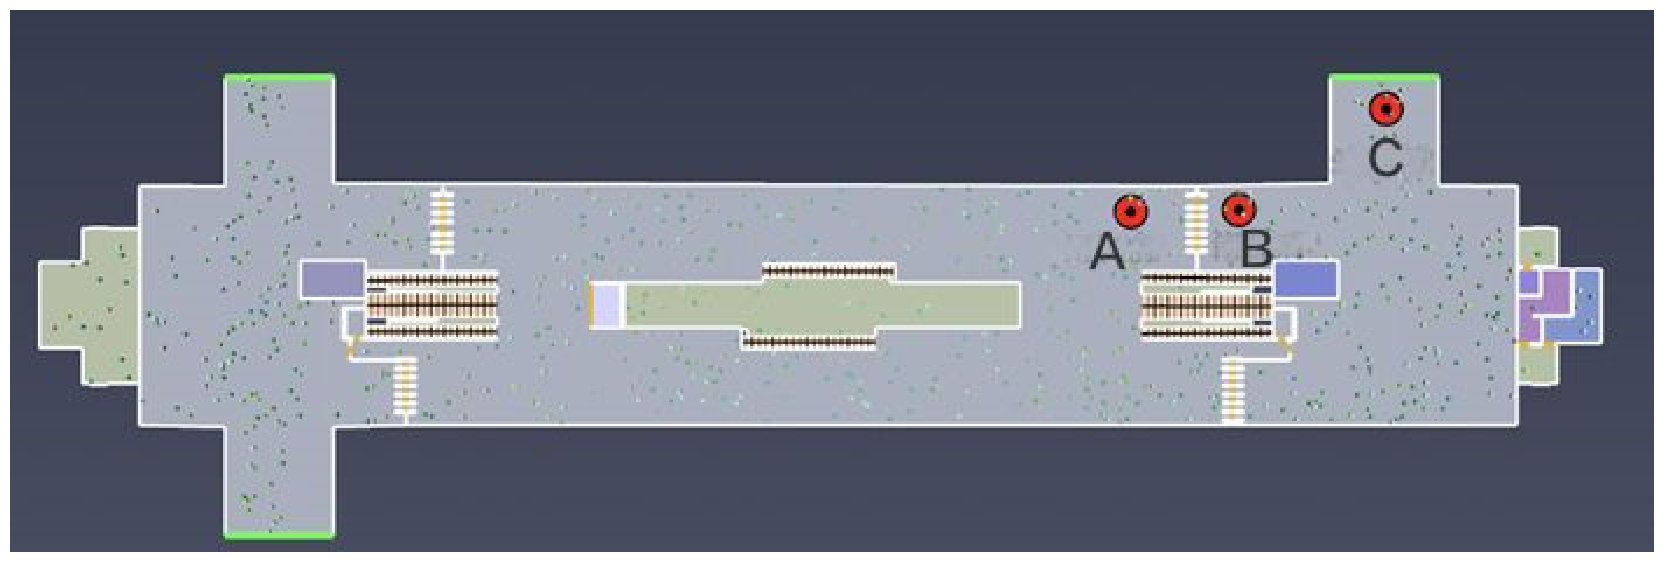
To investigate the impact of turnback behavior near exits, three specific locations were selected for analysis: in front of the fare gate (A), behind the fare gate (B), and in front of the emergency exit (C). These locations were chosen because video observations revealed that fare gate areas are most prone to crowd congestion. The layout of these turnback locations is illustrated in
Figure 1.
To more clearly observe the impact of turnback behavior on evacuation movement time, simulations were conducted with turnback ratios set at 10%, 20%, 30%, 40%, and 50%. These scenarios were modeled for both short-term and long-term passenger flow levels. While actual turnback ratios in real evacuations may not reach 50%, employing these higher values allows for a more pronounced observation of the effect on horizontal evacuation movement time.
3. Results
3.1. Impact of Turnback Behavior on Evacuation
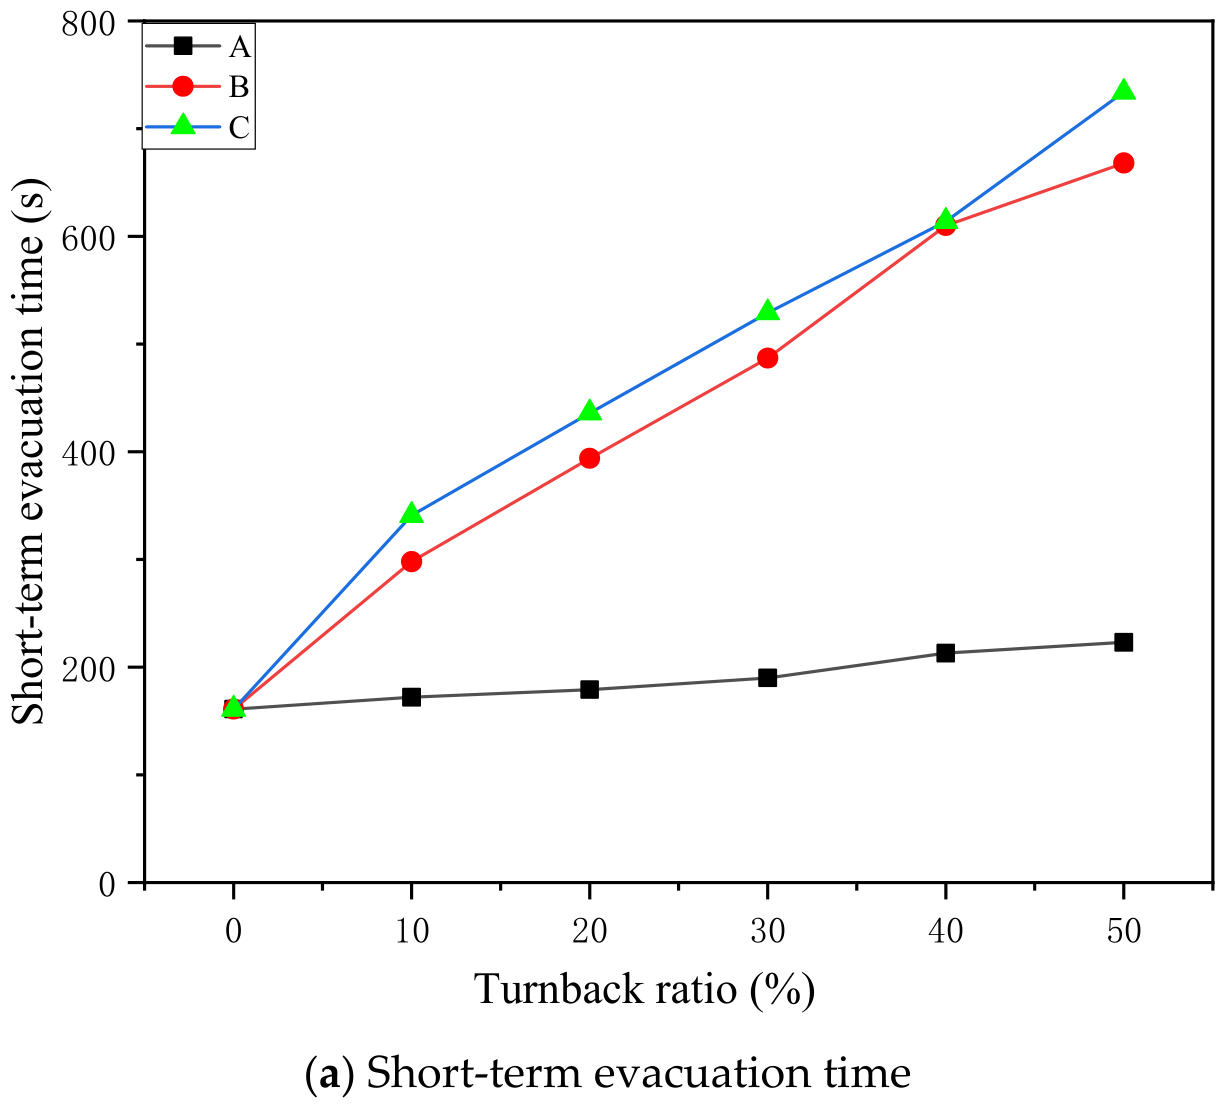
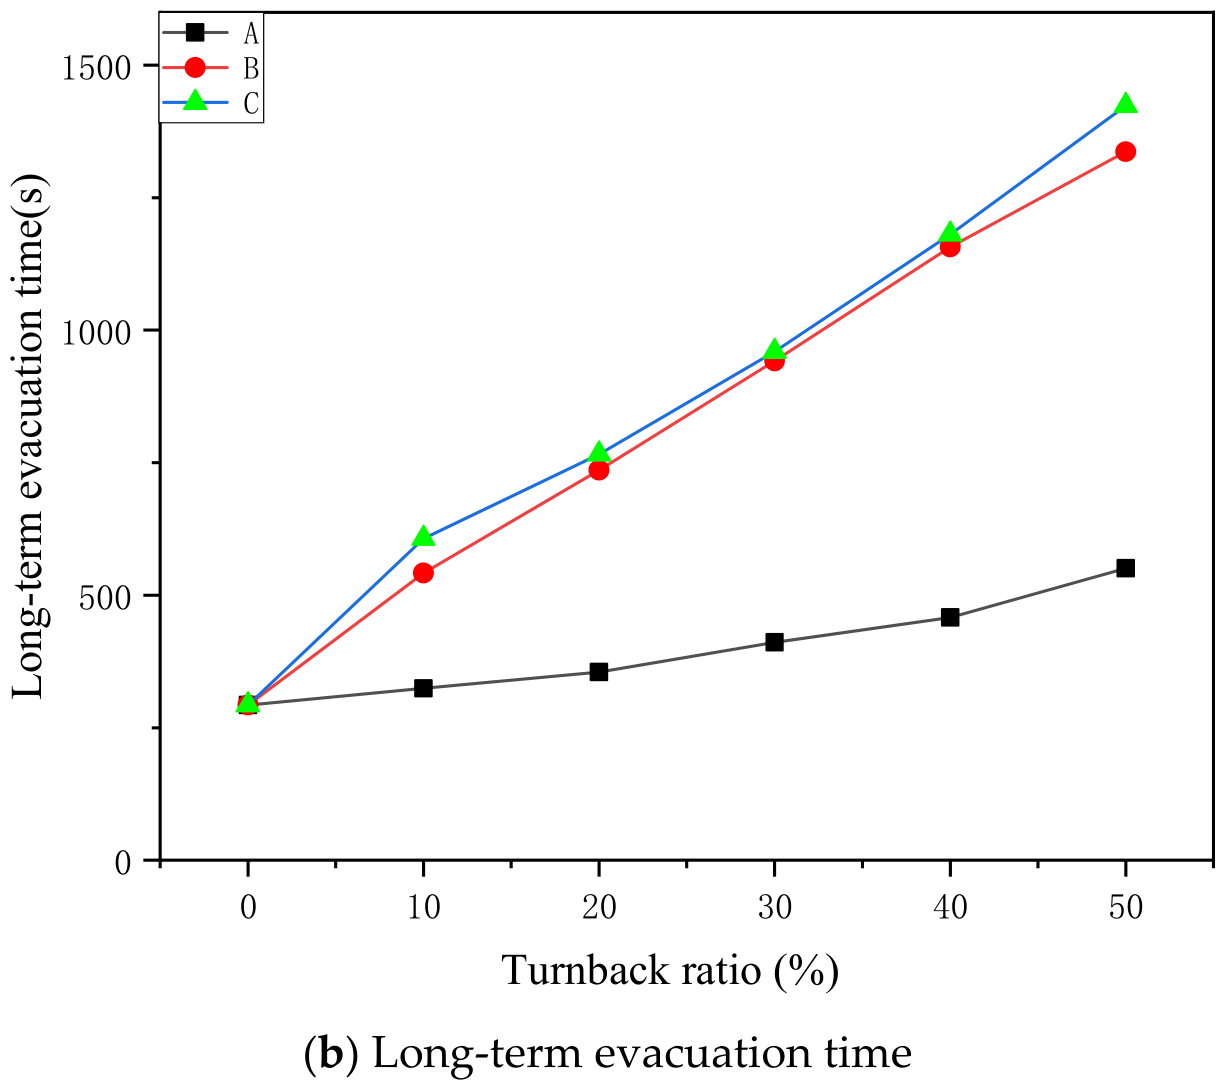
The horizontal evacuation movement times for different simulated scenarios are shown in
Figure 2. The simulation results indicate that an increased turnback ratio prolonged the total evacuation time. Among turnback behavior at different locations, those occurring in front of the emergency exit resulted in the longest evacuation time, followed closely by those behind the fare gate. The behavior in front of the fare gate had the least impact on time. This trend remained consistent across different passenger flow levels.
Simulation results showed that turnback behavior affected congestion differently depending on location at the narrow bottleneck of fare gates. Turnback upstream of the fare gate occurred before entering the congestion, thus not worsening it and resulting in a shorter evacuation time. In contrast, turnback downstream of the fare gate or in front of the emergency exit caused intersecting flows, significantly worsening congestion and prolonging evacuation time. The additional travel distance made turnback in front of the emergency exit particularly time-consuming.
3.2. Impact of Turnback Behavior on Evacuation Safety
(1) Average Evacuation Distance per Person
The average evacuation distance per person is a key safety indicator, reflecting the level of physical exertion required. To investigate the impact of turnback behavior on safety, changes in this distance under different turnback ratios and locations were analyzed. As shown in
Table 1, the average distance increased significantly as the turnback ratio rose from 0% to 50%. Under short-term passenger flow, the distances for turnback in front of the fare gate, behind the fare gate, and in front of the emergency exit increased by 97%, 124%, and 152%, respectively. Under long-term flow, the corresponding increases were 48%, 66%, and 90%. Consequently, the closer the turnback location is to the exit, the longer the evacuation path and the greater the average distance per person.
Table 1 and
Figure 2 show that while the average evacuation distance for turnback behind the fare gate was intermediate, its evacuation time was as high as for turnback in front of the emergency exit, both being much longer than for turnback in front of the fare gate. With walking speed constant, this indicates more stopping and waiting time for turnbacks behind the fare gate and in front of the exit, reducing efficiency. The study then analyzed the average congestion delay time per person.
(2) Average Max Sustained Congestion Time per Person
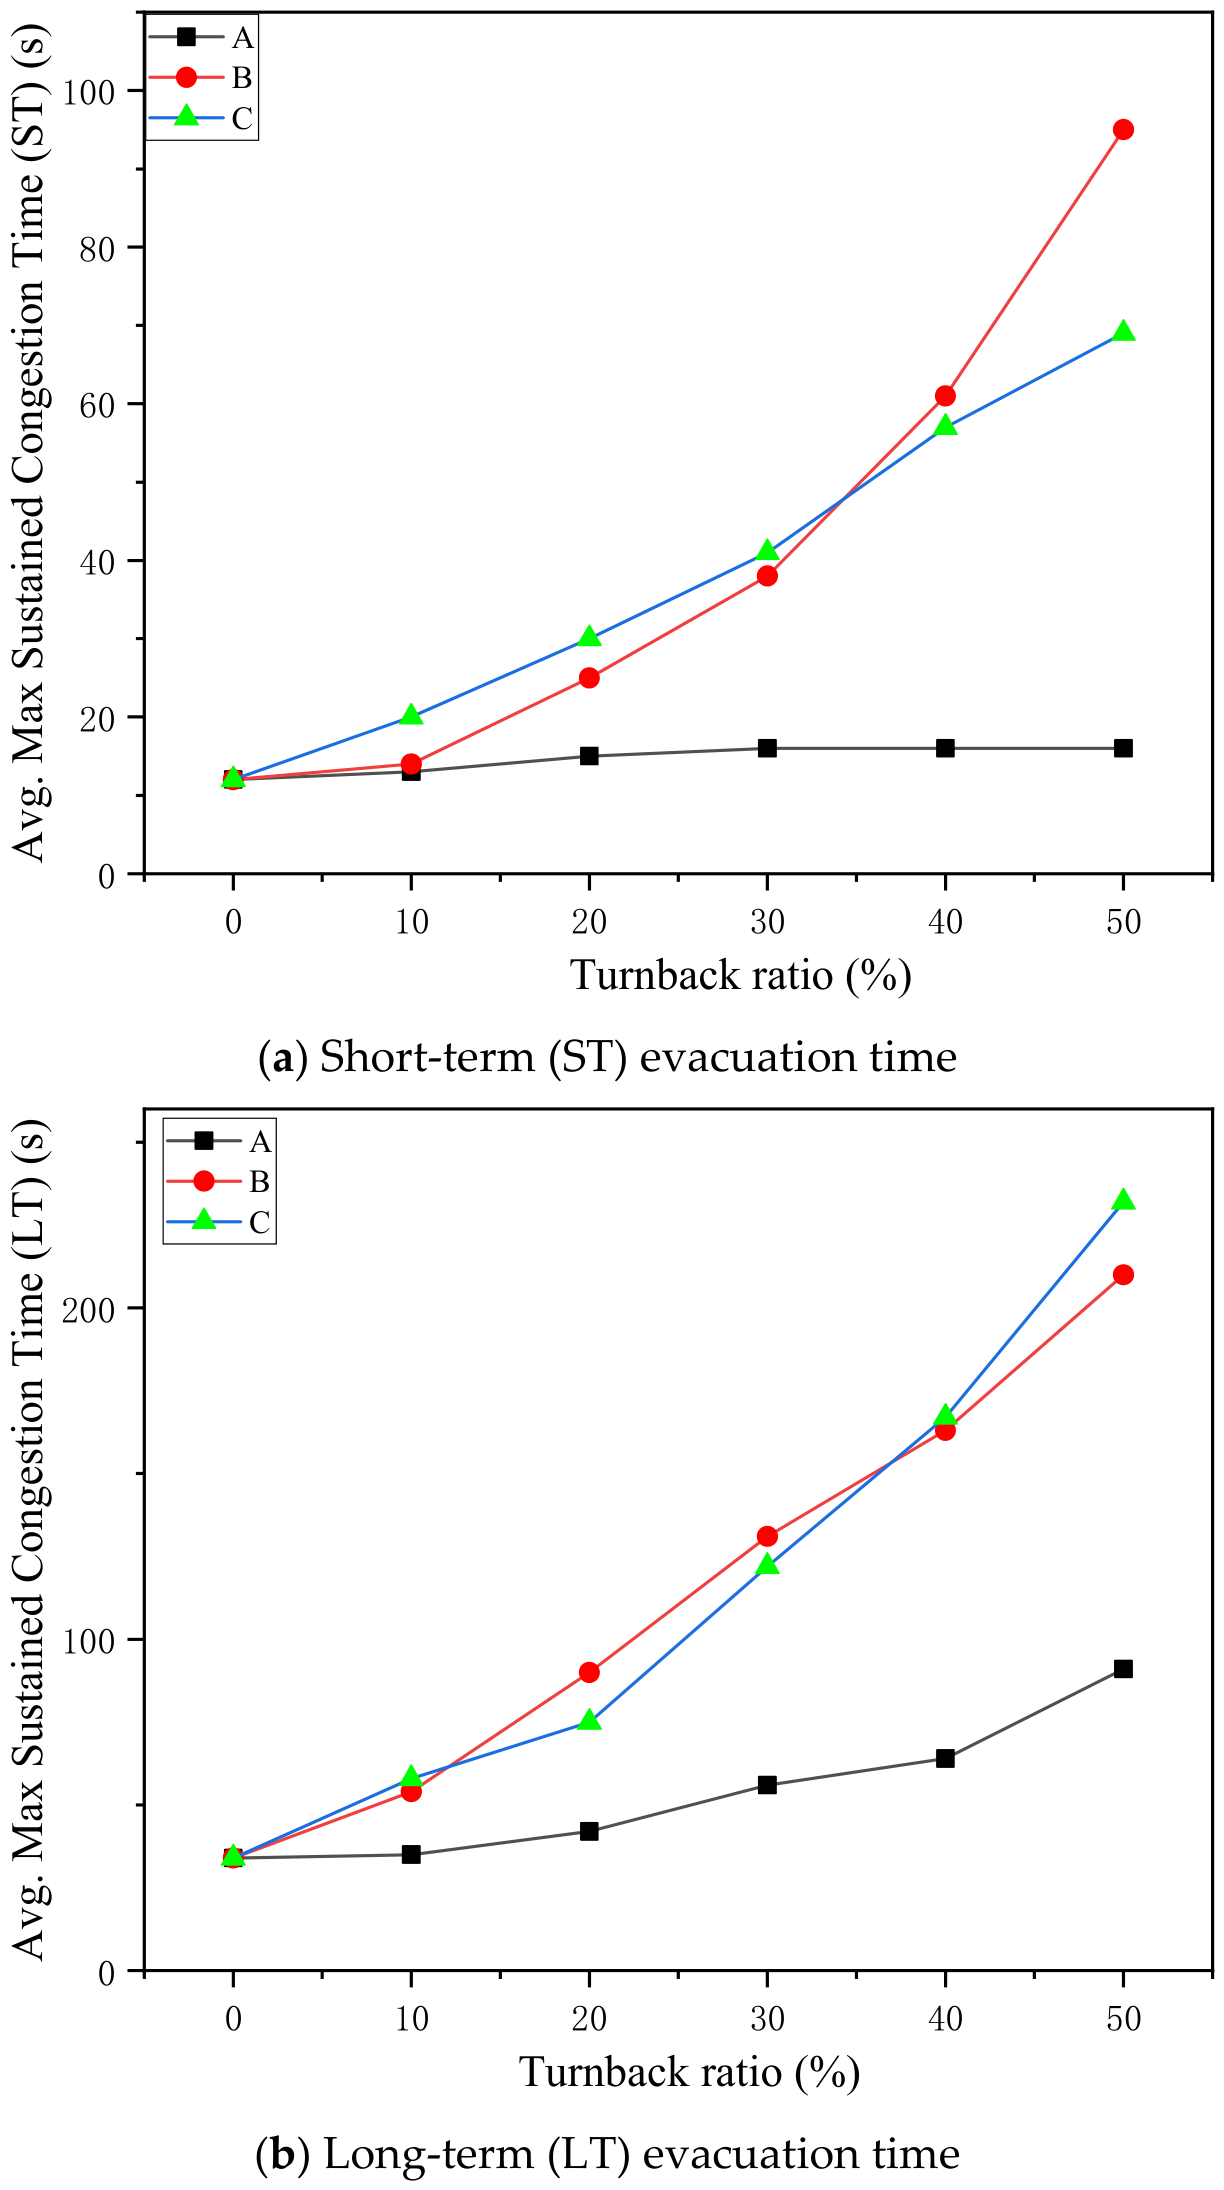
The average max sustained congestion time per person helps identify bottlenecks and potential safety hazards during evacuation. As shown in
Figure 3, the data indicated that for turnback behind the fare gate, this time exceeded that for turnback in front of the emergency exit under specific conditions: when the short-term turnback ratio reached 40% and 50%, and when the long-term ratio reached 20% and 30%. The primary reason is that sustained congestion predominantly occurred at the fare gate location. When the turnback point coincided directly with the congestion point (i.e., behind the fare gate), it had a more pronounced effect on worsening congestion duration compared to when there was a distance between the two points (i.e., in front of the emergency exit).
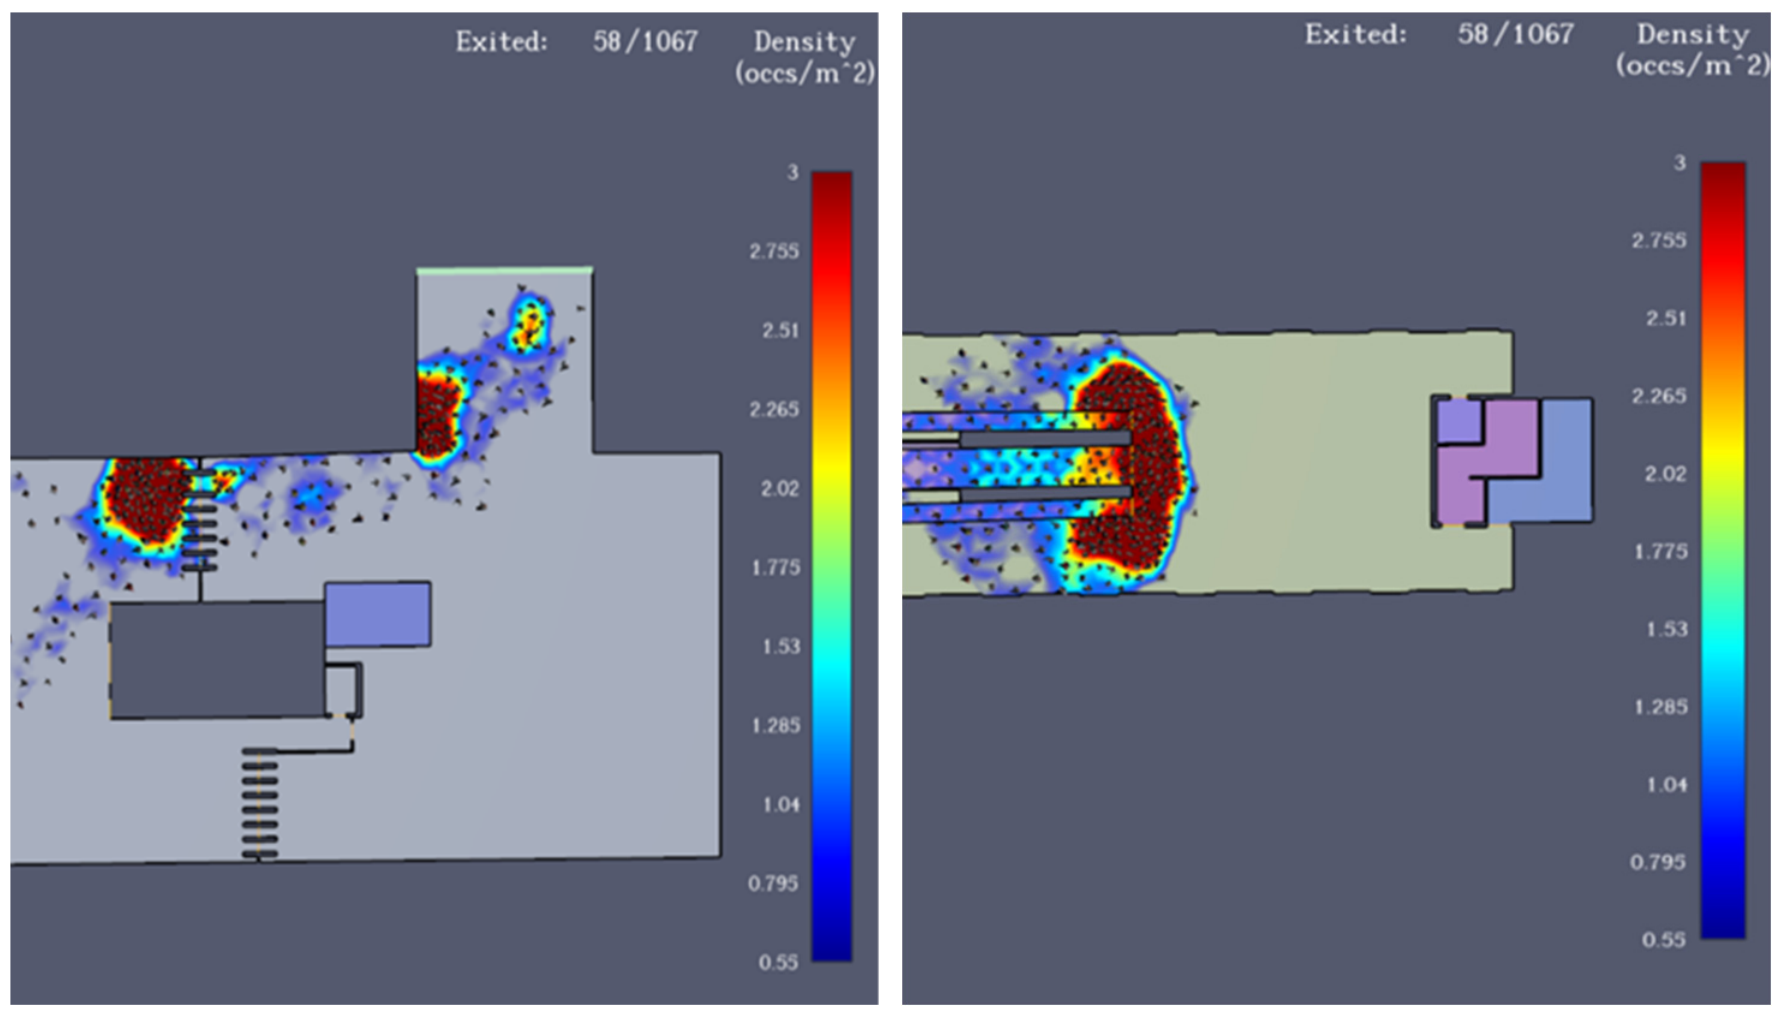
As shown in
Figure 4, observations of the real-time evacuation density revealed key bottlenecks: upstream of the fare gates and at the corner in front of the emergency exit within the concourse level, and in front of the staircase entrance on the platform level. The congestion locations identified in the simulation aligned with those observed in video recordings, indicating that the simulation model closely approximated real-world conditions.
4. Conclusions
The study employed Pathfinder simulations to investigate the impact of different turnback locations and turnback ratios on evacuation efficiency within a specific deep-buried metro station. The results demonstrate that the location where turnback occurs has a more significant influence on evacuation efficiency than the proportion of occupants turning back. Specifically, turnback behavior downstream of the fare gate and in front of the emergency exit substantially reduces evacuation efficiency.
Building on this conclusion, optimizing evacuation strategies necessitates a focus on refined management of turnback-prone zones and an optimized crowd diversion system. Specifically, upon fire alarm activation, fare gates should remain open, accompanied by clear audio and visual warnings (e.g., “Do Not Turn Back”) to prevent inefficient reverse flow at these critical nodes. Furthermore, leveraging real-time monitoring and simulation, dynamic diversion routes should be displayed on electronic signage to guide evacuees proactively, preventing turnback decisions made only after encountering congestion.
The findings also offer insights for station design. Future projects should utilize simulation during the design phase to assess potential turnback risks associated with different spatial layouts, aiming to avoid configurations that inherently induce such behavior. These integrated measures can systematically enhance evacuation resilience and safety performance in deep-buried underground spaces.
Author Contributions
Conceptualization, X.L.; methodology, X.L.; software, X.L.; validation, M.W. (Miaocheng Weng); formal analysis, X.L.; investigation, X.L.; resources, F.L.; data curation, M.W. (Mengyang Wang); writing—original draft preparation, X.L.; writing—review and editing, M.W. (Miaocheng Weng); visualization, X.L.; supervision, F.L. and M.W. (Miaocheng Weng); project administration, F.L.; funding acquisition, F.L. and M.W. (Miaocheng Weng). All authors have read and agreed to the published version of the manuscript.
Funding
This research was funded by the National Natural Science Foundation of China (Grant No. 52178064), Chongqing Science and Technology Commission (Grant No. CSTB2022TIAD-KPX0101), and Chongqing Construction Science and Technology Planning Project (Grant No. 2021(5-8)).
Institutional Review Board Statement
Not applicable.
Informed Consent Statement
Not applicable.
Data Availability Statement
No new data were created
Acknowledgments
This work was supported by the National Natural Science Foundation of China (Grant No. 52178064), Chongqing Science and Technology Commission (Grant No. CSTB2022TIAD-KPX0101), and Chongqing Construction Science and Technology Planning Project (Grant No. 2021(5-8)).
Conflicts of Interest
The authors declare no conflict of interest.
References
- Lu, Y. Fault Tree Analysis of Fire Disaster in Subway. Urban Mass Transit 2011, 14, 95–97+102. [Google Scholar] [CrossRef]
- Liang, Z.; Huang, Y.; Zhou, T. Study on Fire Safety Evacuation Design of Deep Buried Rail Transit Station. China Munic. Eng. 2022, 93–96+127–128. [Google Scholar] [CrossRef]
- Kurioka, H.; Oka, Y.; Satoh, H.; Sugawa, O. Fire properties in near field of square fire source with longitudinal ventilation in tunnels. Fire Saf. J. 2003, 38, 319–340. [Google Scholar] [CrossRef]
- Darkhanbat, K.; Heo, I.; Choi, S.H.; Jeong, H.; Kim, J.H.; Kim, K.S. Optimal egress model considering bottlenecks in large multiplex buildings. Saf. Sci. 2025, 189, 106887. [Google Scholar] [CrossRef]
- Miyoshi, T.; Nakayasu, H.; Ueno, Y.; Patterson, P. An emergency aircraft evacuation simulation considering passenger emotions. Comput. Ind. Eng. 2012, 62, 746–754. [Google Scholar] [CrossRef]
- Yang, L. Movement Patterns of People Inside Buildings and Evacuation Dynamics; Science Press: Beijing, China, 2012; Available online: https://lib.cqu.edu.cn/articlesearch/web_searchingDetail?id=1011115033236 (accessed on 20 July 2012).
- Huang, J. Study on Psychological Behavior and Organizational Plan Optimization of Evacuation Passengers in Deep Buried Station and Yard Fire Emergency--Taking Qixinggang Station in Chongqing as an Example. Master’s Thesis, Chongqing Jiaotong University, Chongqing, China, 2024. [Google Scholar]
- Huang, L.; Li, W.; Gong, J. Simulation of the emergency evacuation about social groups in a complex subway station. Phys. A Stat. Mech. Its Appl. 2024, 637, 129535. [Google Scholar] [CrossRef]
- Safari, M.; Afkhami, R.; Amerzadeh, M.; Zaroushani, V. Simulation of Fire Emergency Evacuation in a Primary School Based on Pathfinder Software. Buildings 2024, 15, 90. [Google Scholar] [CrossRef]
- Zhang, H.; Long, H.-c. Simulation of Evacuation in Crowded Places Based on BIM and Pathfinder. J. Phys. Conf. Ser. 2021, 1880, 012010. [Google Scholar] [CrossRef]
- Lu, Y.; Deng, Y.; Sun, S. Design for safety in metro station evacuation: A study of fire emergency evacuation behavior and simulation. Eng. Constr. Archit. Manag. 2024, 31, 3479–3507. [Google Scholar] [CrossRef]
| Disclaimer/Publisher’s Note: The statements, opinions and data contained in all publications are solely those of the individual author(s) and contributor(s) and not of MDPI and/or the editor(s). MDPI and/or the editor(s) disclaim responsibility for any injury to people or property resulting from any ideas, methods, instructions or products referred to in the content. |