1. Introduction
Low-frequency oscillations (LFOs) in the 0.1–2 Hz range remain a limiting factor in large interconnected power systems, particularly when weak AC tie lines operate in parallel with High-Voltage Direct Current (HVDC) links [
1,
2,
3,
4]. Conventional Power System Stabilizers (PSSs) enhance generator damping through excitation control, while HVDC Modulation Supplementary Damping Controllers (MSDCs) provide rapid damping by modulating converter active-power order [
5,
6]. When both controllers operate simultaneously, their overlapping bandwidths may cause control interaction, manifesting as phase opposition or reinforcement of adverse torque components [
7,
8].
Most previous studies analyzed these controllers independently or relied on linearized eigenvalue models that obscure frequency-dependent coupling effects. Electromagnetic transient (EMT) simulations can capture detailed dynamics but are computationally intensive and offer limited interpretability for controller coordination [
8]. Participation-factor and eigenvalue sensitivity analyses indicate which modes are affected by controllers, but they do not directly reveal how one control loop perturbs the gain–phase robustness of another across frequencies. To address these limitations, this paper proposes a Nyquist-based interaction framework that quantifies both loop robustness and cross-channel perturbation effects between the PSS and HVDC MSDC directly in the frequency domain.
In the proposed method, each controller loop is perturbed sequentially while the other remains active, and the resulting closed-loop frequency response is computed. The Nyquist locus of the perturbed loop not only reveals the stability margin of the active controller but also shows how disturbances in one control path distort the Nyquist contour of the other, thereby indicating the degree of dynamic coupling between them. The Nyquist spectral-radius margin, defined as the minimum Euclidean distance between the Nyquist curve and the critical point (−1 + j0), is employed as a quantitative measure of gain–phase sensitivity and interaction strength. A shrinking margin or a contour deformation following perturbation directly indicates increased cross-channel interference and potential loss of damping robustness.
Reduced-order transfer functions used in this analysis are identified from transient-stability simulations via the Matrix Pencil Method (MPM), ensuring that both simulated and measured data can be embedded in the frequency-domain study [
9,
10]. Application to Kundur’s two-area benchmark system with an embedded LCC–HVDC link demonstrates that a speed-input or speed-emulated PSS interacts constructively with the HVDC MSDC, while a conventional power-input PSS introduces stronger contour deformation and possible instability. The analysis also reveals a dynamic transition of damping authority, where the PSS initially dominates the transient response and the HVDC MSDC progressively assumes control as oscillations decay. The analysis is restricted to small-signal electromechanical dynamics in the 0.1–2 Hz band and employs reduced-order models identified from RMS-type transient-stability simulations. Detailed EMT-level converter switching dynamics, nonlinear saturation effects, and operating-point variations are not explicitly represented. Only one PSS location and one HVDC modulation channel are considered; interactions among multiple damping controllers are outside the scope of this study.
Overall, the proposed Nyquist-based framework provides a data-driven and visually interpretable tool for diagnosing and coordinating PSS–HVDC damping interactions. By linking perturbation response, Nyquist contour shifts, and stability margins, it bridges analytical frequency-domain reasoning with practical measurement-based tuning. The remainder of this paper details the analytical formulation, system modeling, case validation on Kundur’s benchmark, and comparative damping results.
Notation and Definitions
denotes the identified SISO transfer function from controller input
to measured output
.
denotes the 2 × 2 open-loop frequency-response matrix.
represents the diagonal loop (PSS or HVDC MSDC), and
represent cross-coupling terms.
and
denote normalized gain perturbations applied to the PSS and HVDC MSDC channels, respectively. For completeness, the individual loop transfer functions
,
,
, and
are defined in
Section 2. The Nyquist spectral-radius margin is defined as
where
denotes the eigenvalues of the loop matrix and
Hz.
2. Proposed Method
2.1. Interaction Analysis Framework for PSS and HVDC MSDC
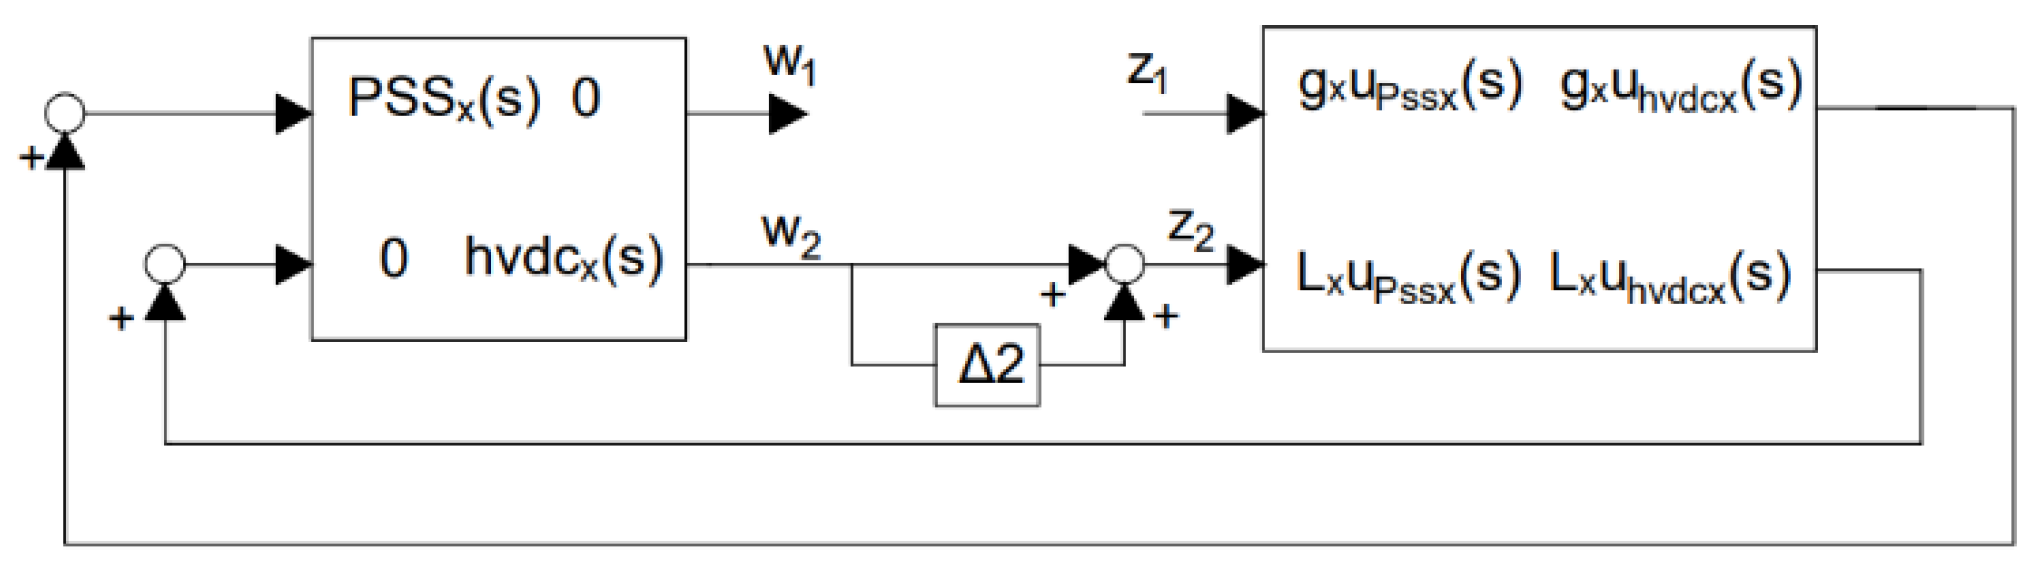
To evaluate the concurrent use of a PSS and an HVDC MSDC in damping intertie low-frequency oscillations (LFOs), a multi-input multi-output (MIMO) control framework is developed. The nominal system configuration, illustrated in
Figure 1, includes transfer functions that represent dynamic relationships between control inputs and summing junctions across both PSS and HVDC MSDC paths.
Let denote the transfer function from the generator exciter’s summing point to the PSS input and let denote the transfer function from the HVDC current controller’s summing point to the HVDC MSDC input. The Laplace variable, s, represents the complex frequency. In this configuration, the PSS is implemented at the generator excitation summing point, while the HVDC MSDC is connected at the summing point of the HVDC current control loop.
2.2. Single-Loop Perturbation and Interaction Evaluation
To assess control interaction, small perturbations are introduced at the input of one controller while observing the loop’s response in the presence of the other active controller. As shown in
Figure 1, the PSS loop is opened and subjected to disturbances originating from the HVDC MSDC channel. The resulting transfer function from the perturbation input,
, to the measured output,
, incorporates the interaction effect, enabling accurate estimation of gain and phase margins.
Nyquist plots of this perturbed system are used to visualize the loop’s robustness. Of particular interest is the Nyquist spectral radius, defined as the minimum distance between the Nyquist curve and the critical point , which quantifies the sensitivity of the loop to gain and phase variations due to cross-channel interactions. This metric reveals the extent to which each control channel can tolerate loop-at-a-time gain variations before violating stability conditions. The analysis therefore offers a systematic approach to determining interaction-induced limitations on decentralized controller performance.
Internal system stability is also assessed by evaluating the eigenvalues of the perturbed closed-loop system. Movement of these eigenvalues further into the left-half complex plane (LHP) indicates improved damping and robustness, while clustering near the imaginary axis may suggest reduced stability margins due to control interaction.
This framework, adapted from MIMO control robustness principles, as discussed in [
11,
12,
13,
14], provides a systematic approach for analyzing controller performance degradation arising from loop interactions in hybrid HVAC-HVDC systems.
2.3. System Transfer Function Identification
The accurate reduced-order system transfer functions described in the nominal system representation above are obtained by analysis of system transients by a transfer function identification method based on complex exponential signal analysis. These methods provide an optimal fit of the observed signals,
, from transient stability simulations to a fitting function given in a discrete domain:
where
is independent of time, while
is time-dependent. The main purpose of the complex exponential method is to find
and
in (1), which represents the initial amplitude in the same units as the observed signal and phase in radians, respectively, and
, where
is a damping factor in
and denotes frequency
in
for
.
Several methods for identifying fitting functions from observed signals have been discussed in the literature. However, for the purposes of this study, four classical methods are briefly reviewed: the Prony method [
10,
15], the Least Squares (LS) method [
16], the Total Least Squares (TLS) method [
17], and the Matrix Pencil Method (MPM) [
9,
18]. These methods are considered to facilitate comparison and to address challenges related to matrix ill conditioning encountered during the identification of certain classes of observed and time-delayed signals obtained from experimental simulations. In some cases, certain methods failed to accurately identify the observed signal characteristics. The MPM was used in this study because of its robustness.
2.4. Transfer Function Realization Method
The signal identification methods discussed above will not directly identify the system transfer function. However, with the assistance of a certain class of input,
, the transfer functions of the system can be realized [
19,
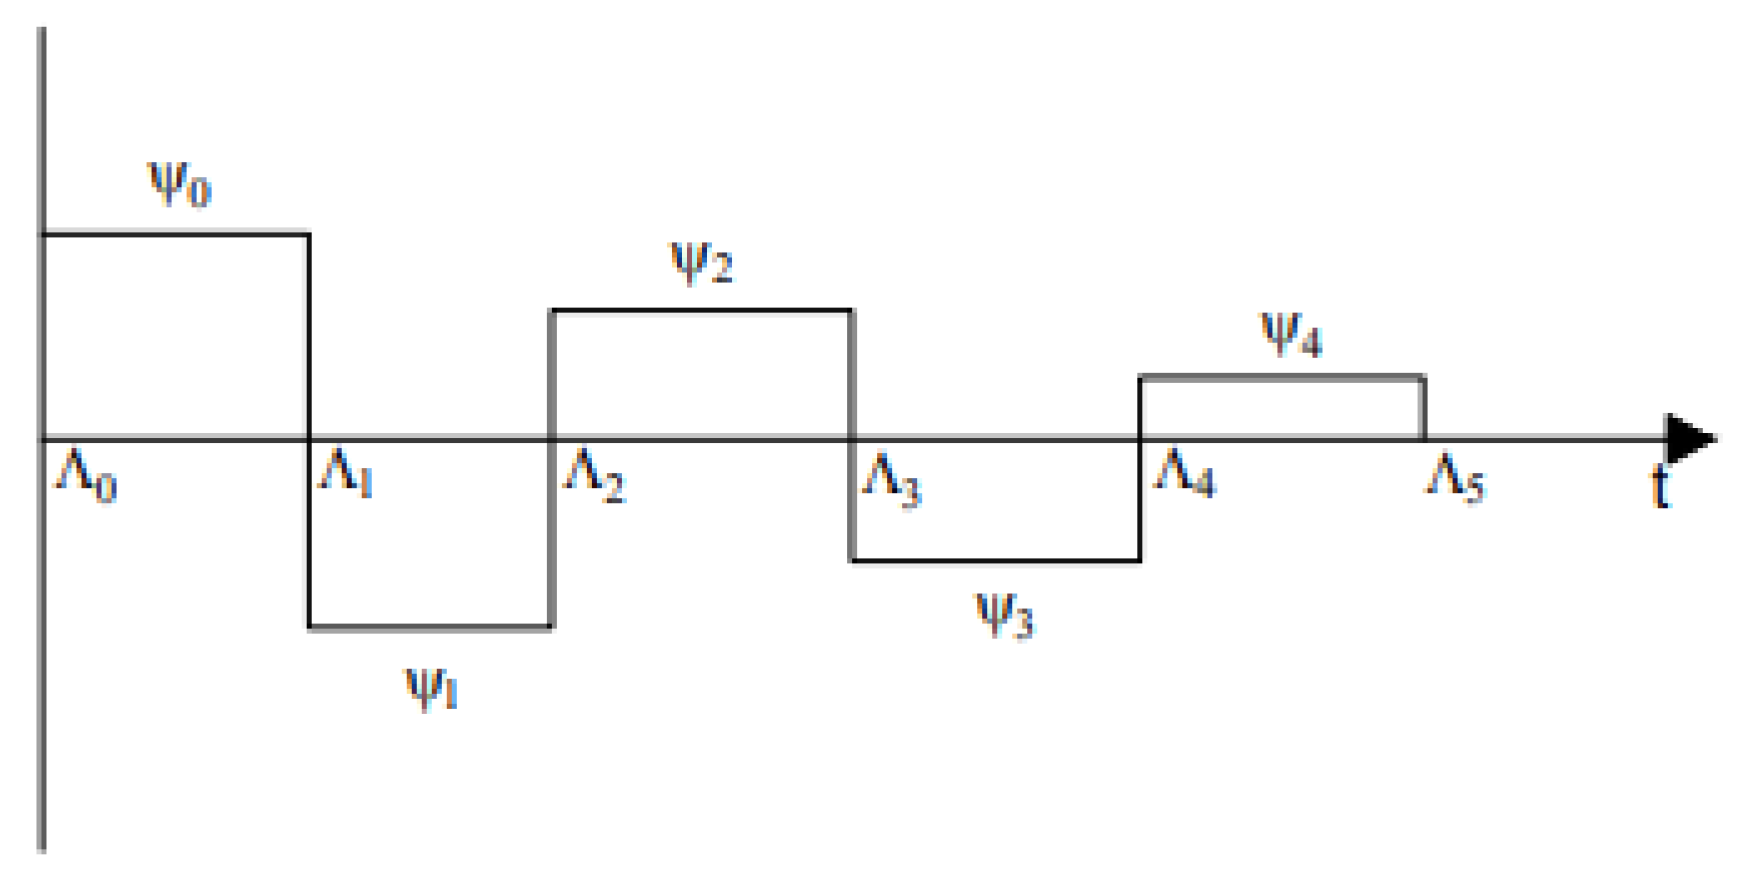
20]. The general form of this input is as indicated in
Figure 2. This signal is given by a finite summation of delayed signals with the same characteristic eigenvalues expressed as rational functions as in [
19]:
where
and
,
and
are taken to be zero in most applications. The system is as given in
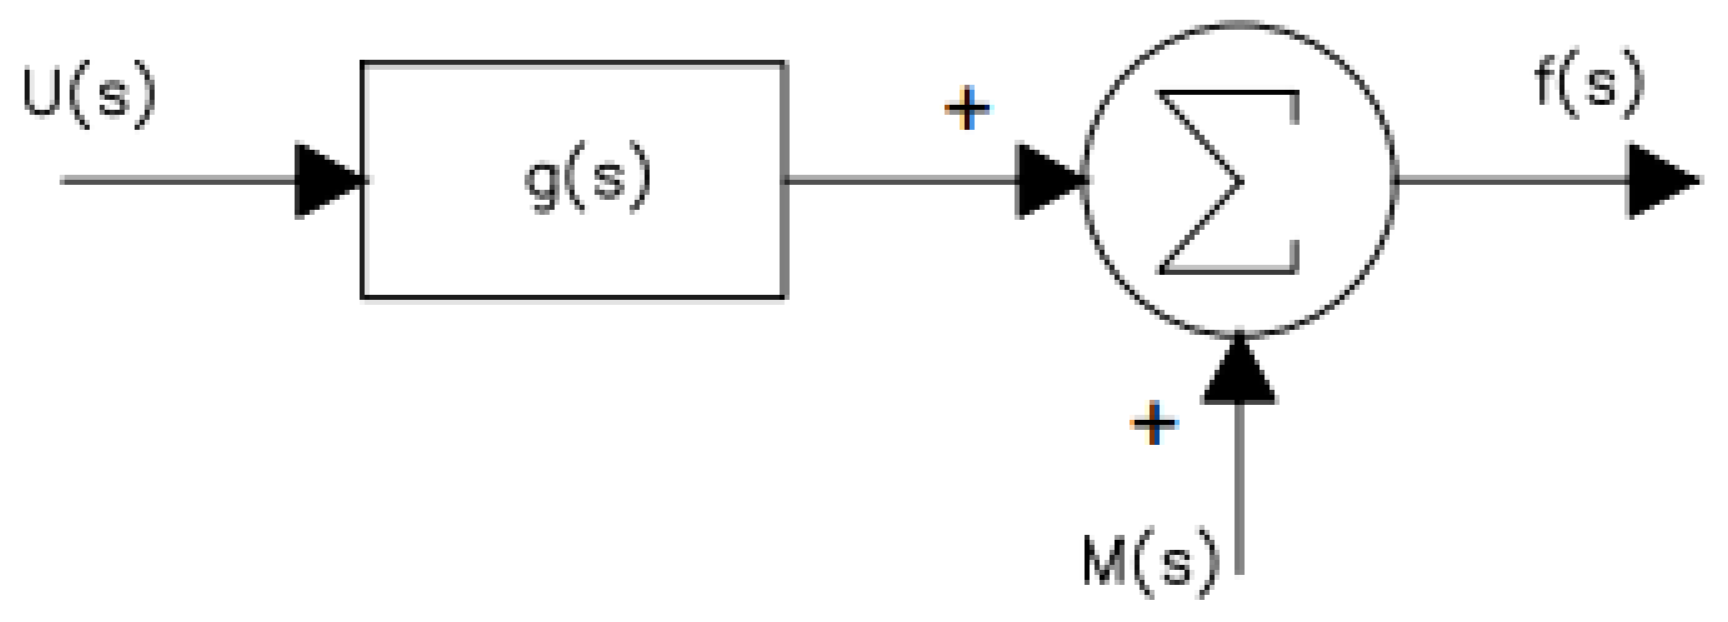
Figure 3, below.
in
Figure 3 represents the system initial conditions obtained by considering an input signal found by expanding (5) as done in [
20]:
where
in (5) are function residues and
are distinct eigenvalues. The initial conditions,
, are usually ignored in many instances to simplify the analysis. Let
The transfer function residues can be found from
as follows:
In this formulation, m and p denote two distinct time intervals corresponding to delayed input pulses applied at
and
, respectively, with
. Each interval yields a Prony-identified set of exponential coefficients,
and
. By comparing these two responses, the initial-condition residues,
, and transfer function residues,
, can be uniquely determined, leading to the complete reduced-order model, G(s). The uniform discrete sampled output signals used in this transfer identification method were obtained from a modified transient stability simulation in ETAP version 16. The ETAP test system is described in detail in Figure 4 of [
20].
2.5. Transfer Function Realization Procedure
In order to obtain the transfer functions
and
as discussed in
Section 3 and illustrated in Figure 4 of [
20], a series of multi-step input pulses illustrated in
Figure 2 was applied at the summing junction of the Automatic Voltage Regulator (AVR) installed at the generator
. The system exhibited oscillatory and unstable behavior when no damping controller was active. To ensure the presence of a decaying envelope in the system response, a small amount of damping was introduced by enabling the HVDC MSDC, with its gain carefully tuned prior to input excitation. The input had the following parameters:
A three-phase fault lasting 12 cycles (0.2 s in a 60 Hz system) was applied 1.1 s before the first test pulse, introduced at bus 11. Key system variables commonly used as Power System Stabilizer (PSS) inputs, specifically generator speed deviation (Δω) and generator active power output (Pgen), were monitored to estimate
. In addition, the active power flow on the transmission line between buses 5 and 6, hereafter referred to as L7, was observed to compute
. These output signals were analyzed using signal identification techniques outlined in
Section 2 in MATLAB R2023b. Prony analysis was applied to the responses with
and
, and the results are as shown in
Table A1 for the speed-input PSS. The transfer functions were built in accordance with
Figure 1. The same methodology was used to derive the transfer functions
and
, with a minor modification: the test input pulses were instead applied to the summing point of the HVDC current controller using an input parameter set given as
The same output variables, generator speed and line L7 active power flow, were recorded. As before, a pre-disturbance fault was introduced to shift the system from its steady-state operating point. The resulting responses were again subjected to Prony analysis at
and
, yielding the results shown in
Table A1 in
Appendix A. Control interactions between the Power System Stabilizer and the generator
was motivated by its electrical proximity to the rectifier station, making it a critical location for observing local interactions. The simulation results of this procedure are as shown in
Table A1.
and
are recalculated values for mathematical validation of the calculations.
3. Results and Discussion
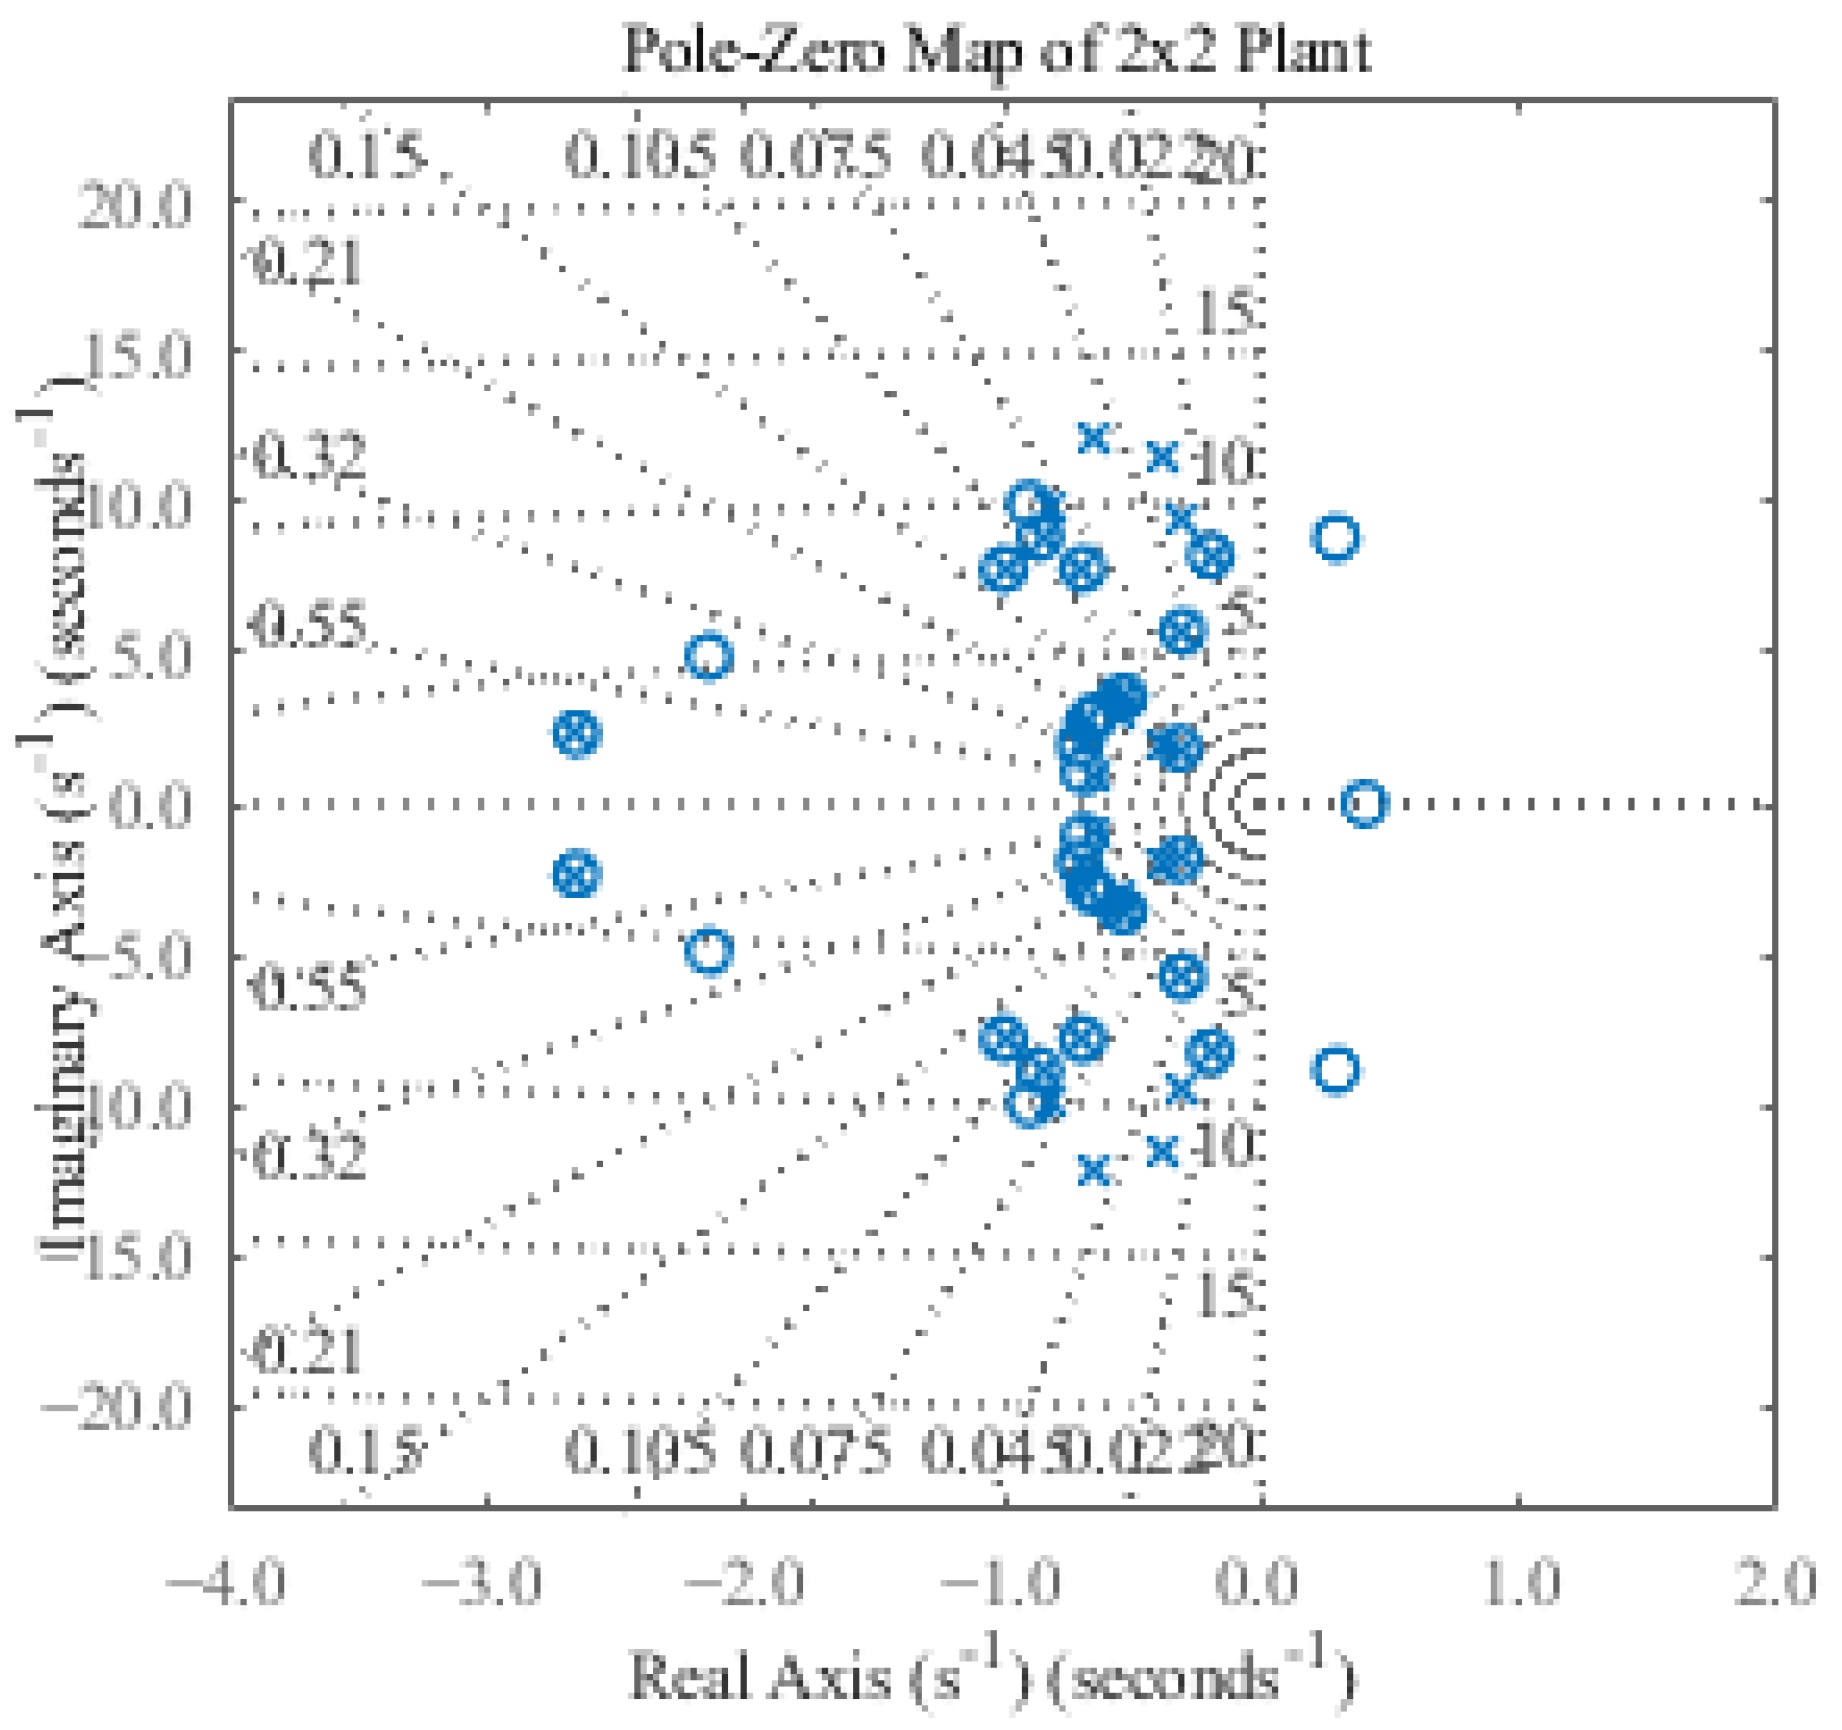
Figure 4 presents the pole–zero map of the identified 2 × 2 plant, illustrating the dominant electromechanical and control-related dynamics captured in the model. The poles (
) and zeros (
) are distributed primarily in the left half of the complex plane, confirming the overall stability of the identified system. The cluster of lightly damped poles near the imaginary axis, between 0.3 Hz and 0.5 Hz, corresponds to the inter-area oscillatory mode characteristic of the Kundur two-area system. This mode exhibits relatively small real parts and low damping ratios (ζ ≈ 0.04–0.08), consistent with weak tie-line coupling and the need for supplementary damping control. The higher-frequency pole pairs, located around 7–11 rad/s, represent local machine or excitation-system modes. Their increased damping reflects the stronger internal control action of the excitation systems compared to the inter-area channel. The zero locations mirror the complex-conjugate pole distribution, indicating a well-conditioned plant with moderate non-minimum-phase behavior, suitable for robust control design.
Overall, the pole–zero configuration confirms that the identified model faithfully reproduces both the slow inter-area oscillation and the faster local dynamics. This validates the model structure used for subsequent frequency-domain interaction and damping-coordination analysis between the PSS and HVDC modulation controllers. The PSS installed on generator g2 (designated as M2 in Figure 4 of [
20]) and the HVDC MSDC were investigated. This generator was selected because of its close proximity to the converter station. The Nyquist loci in
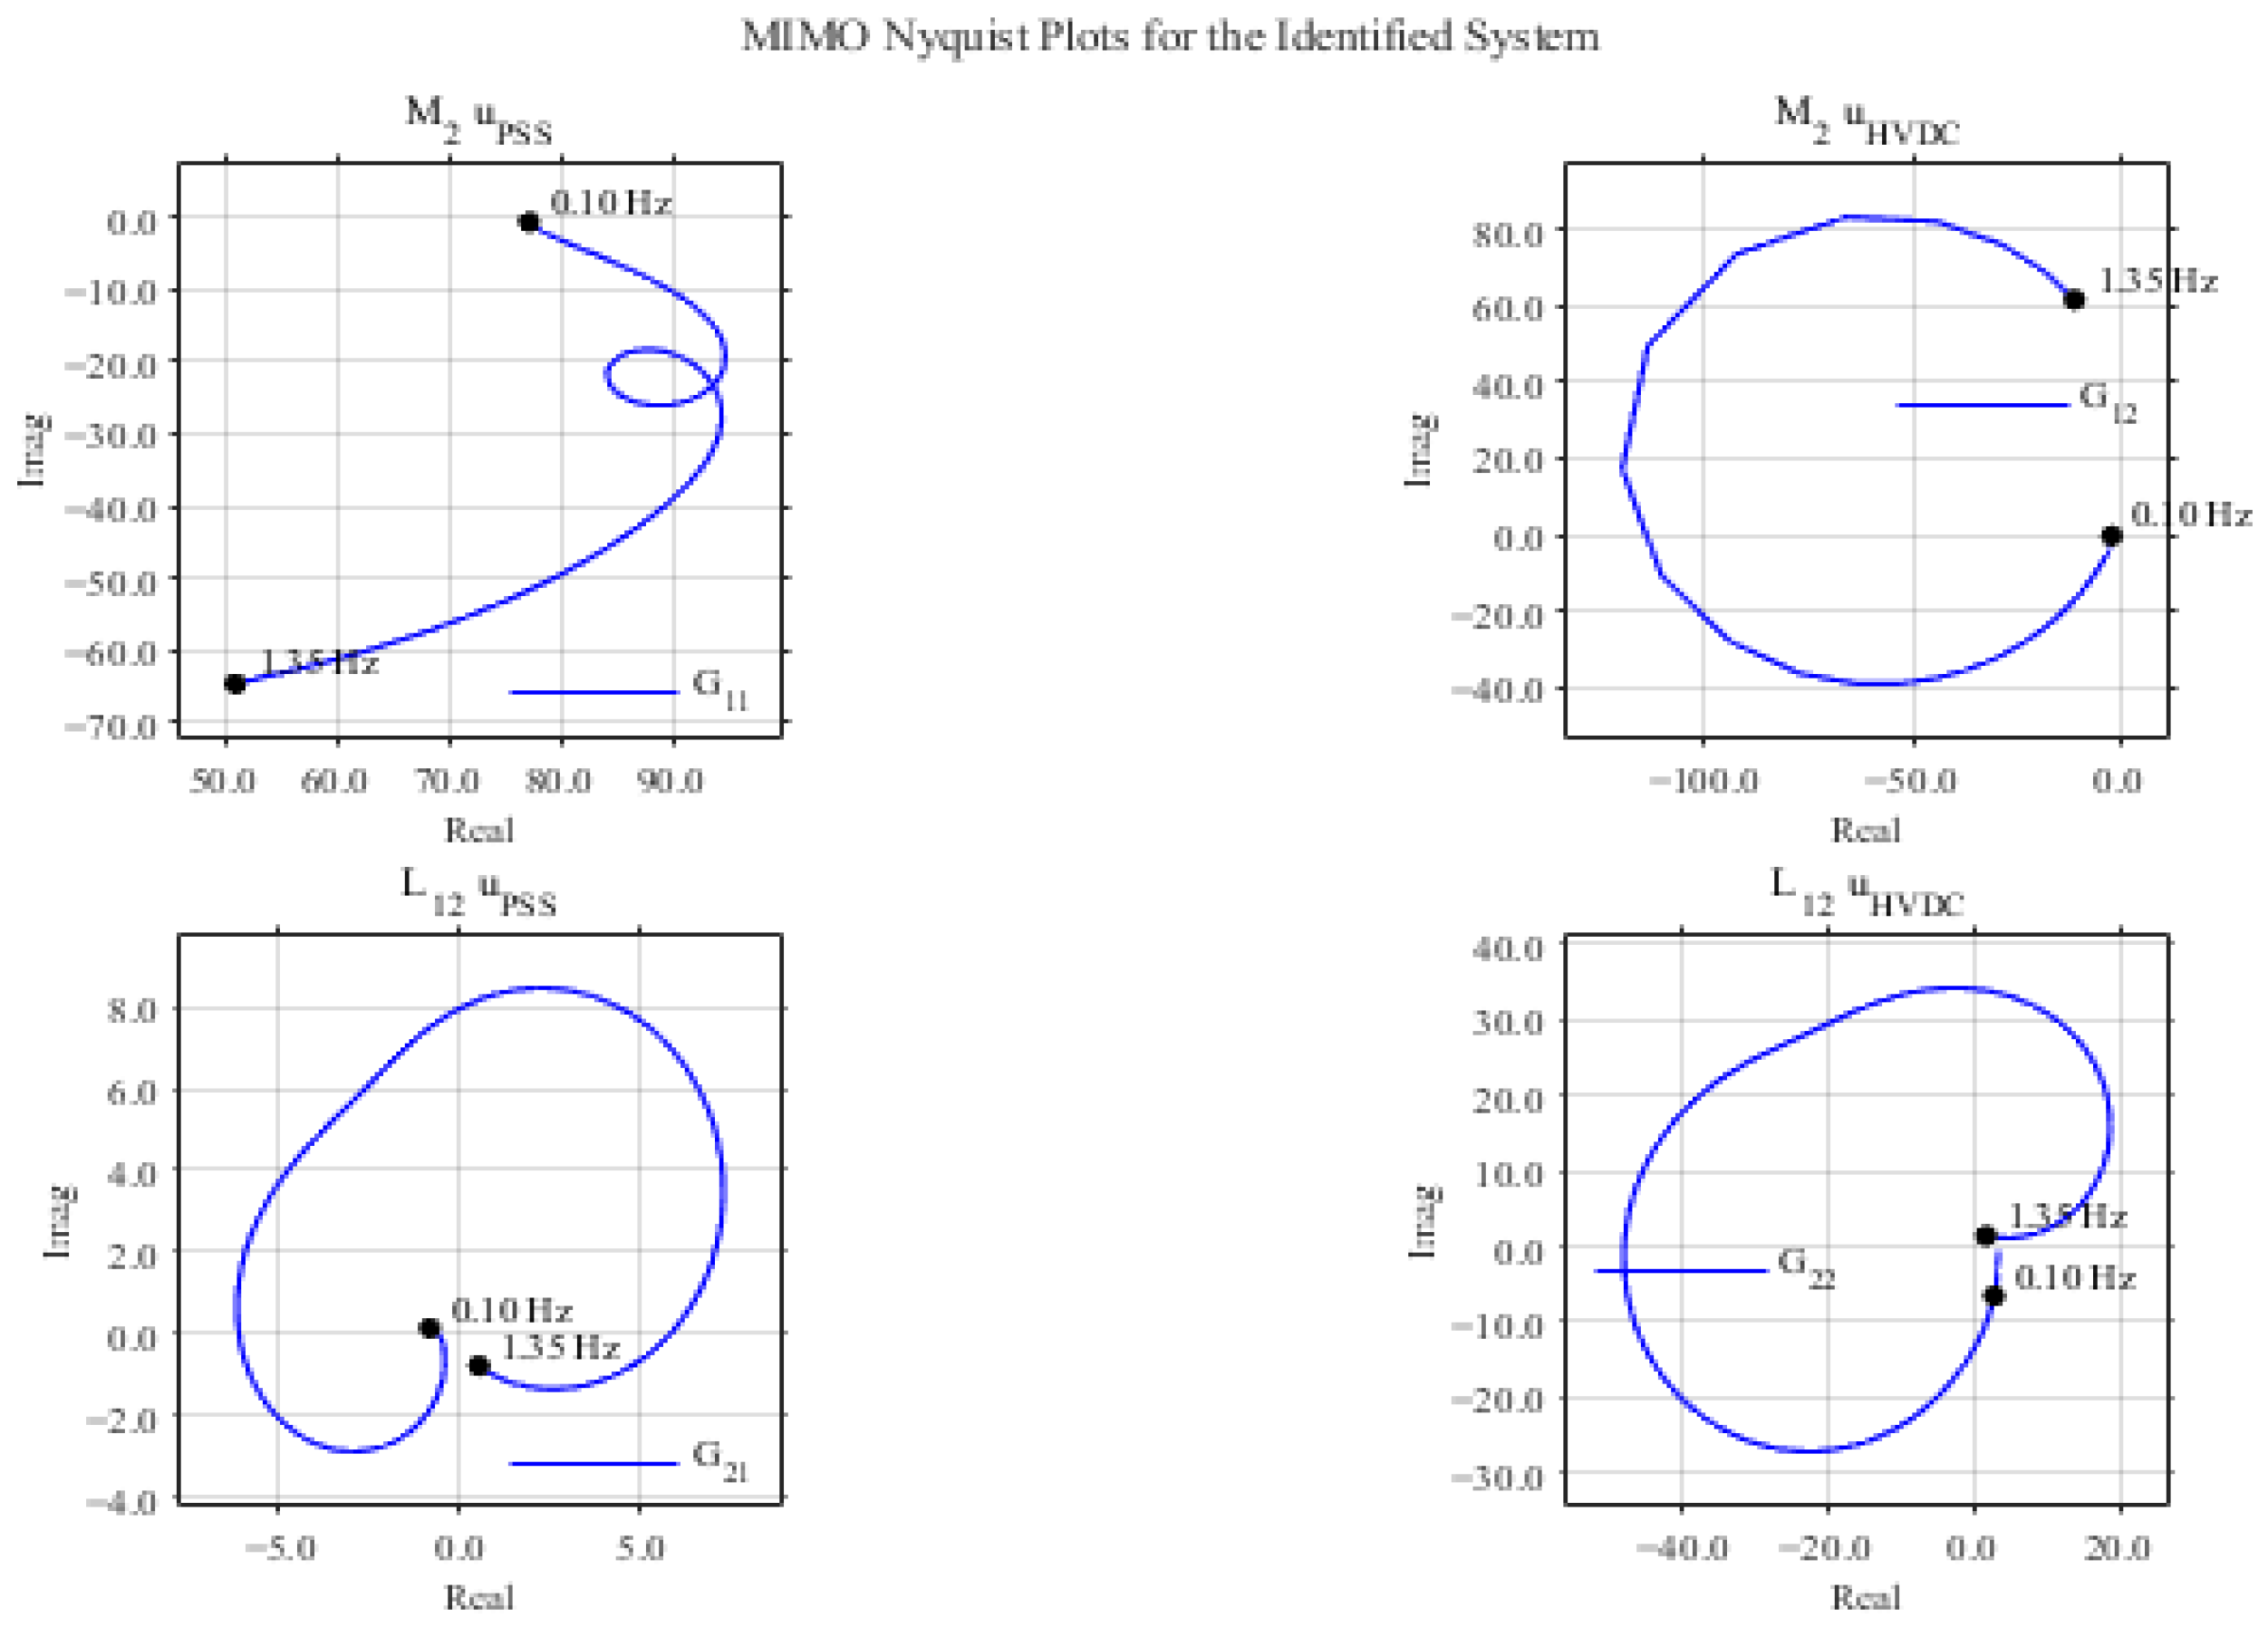
Figure 5 illustrate the frequency-domain characteristics of the identified MIMO system, highlighting the interaction between the PSS and the HVDC modulation-damping controller. In the
and
plots, the loci corresponding to the generator torque response show that the HVDC path exhibits a substantially larger loop magnitude and wider phase excursion around 0.35–0.40 Hz, which corresponds to the dominant inter-area oscillatory mode. The PSS contribution within this frequency range is comparatively small, indicating that the HVDC controller provides the principal damping torque, while the PSS acts mainly on local machine dynamics.
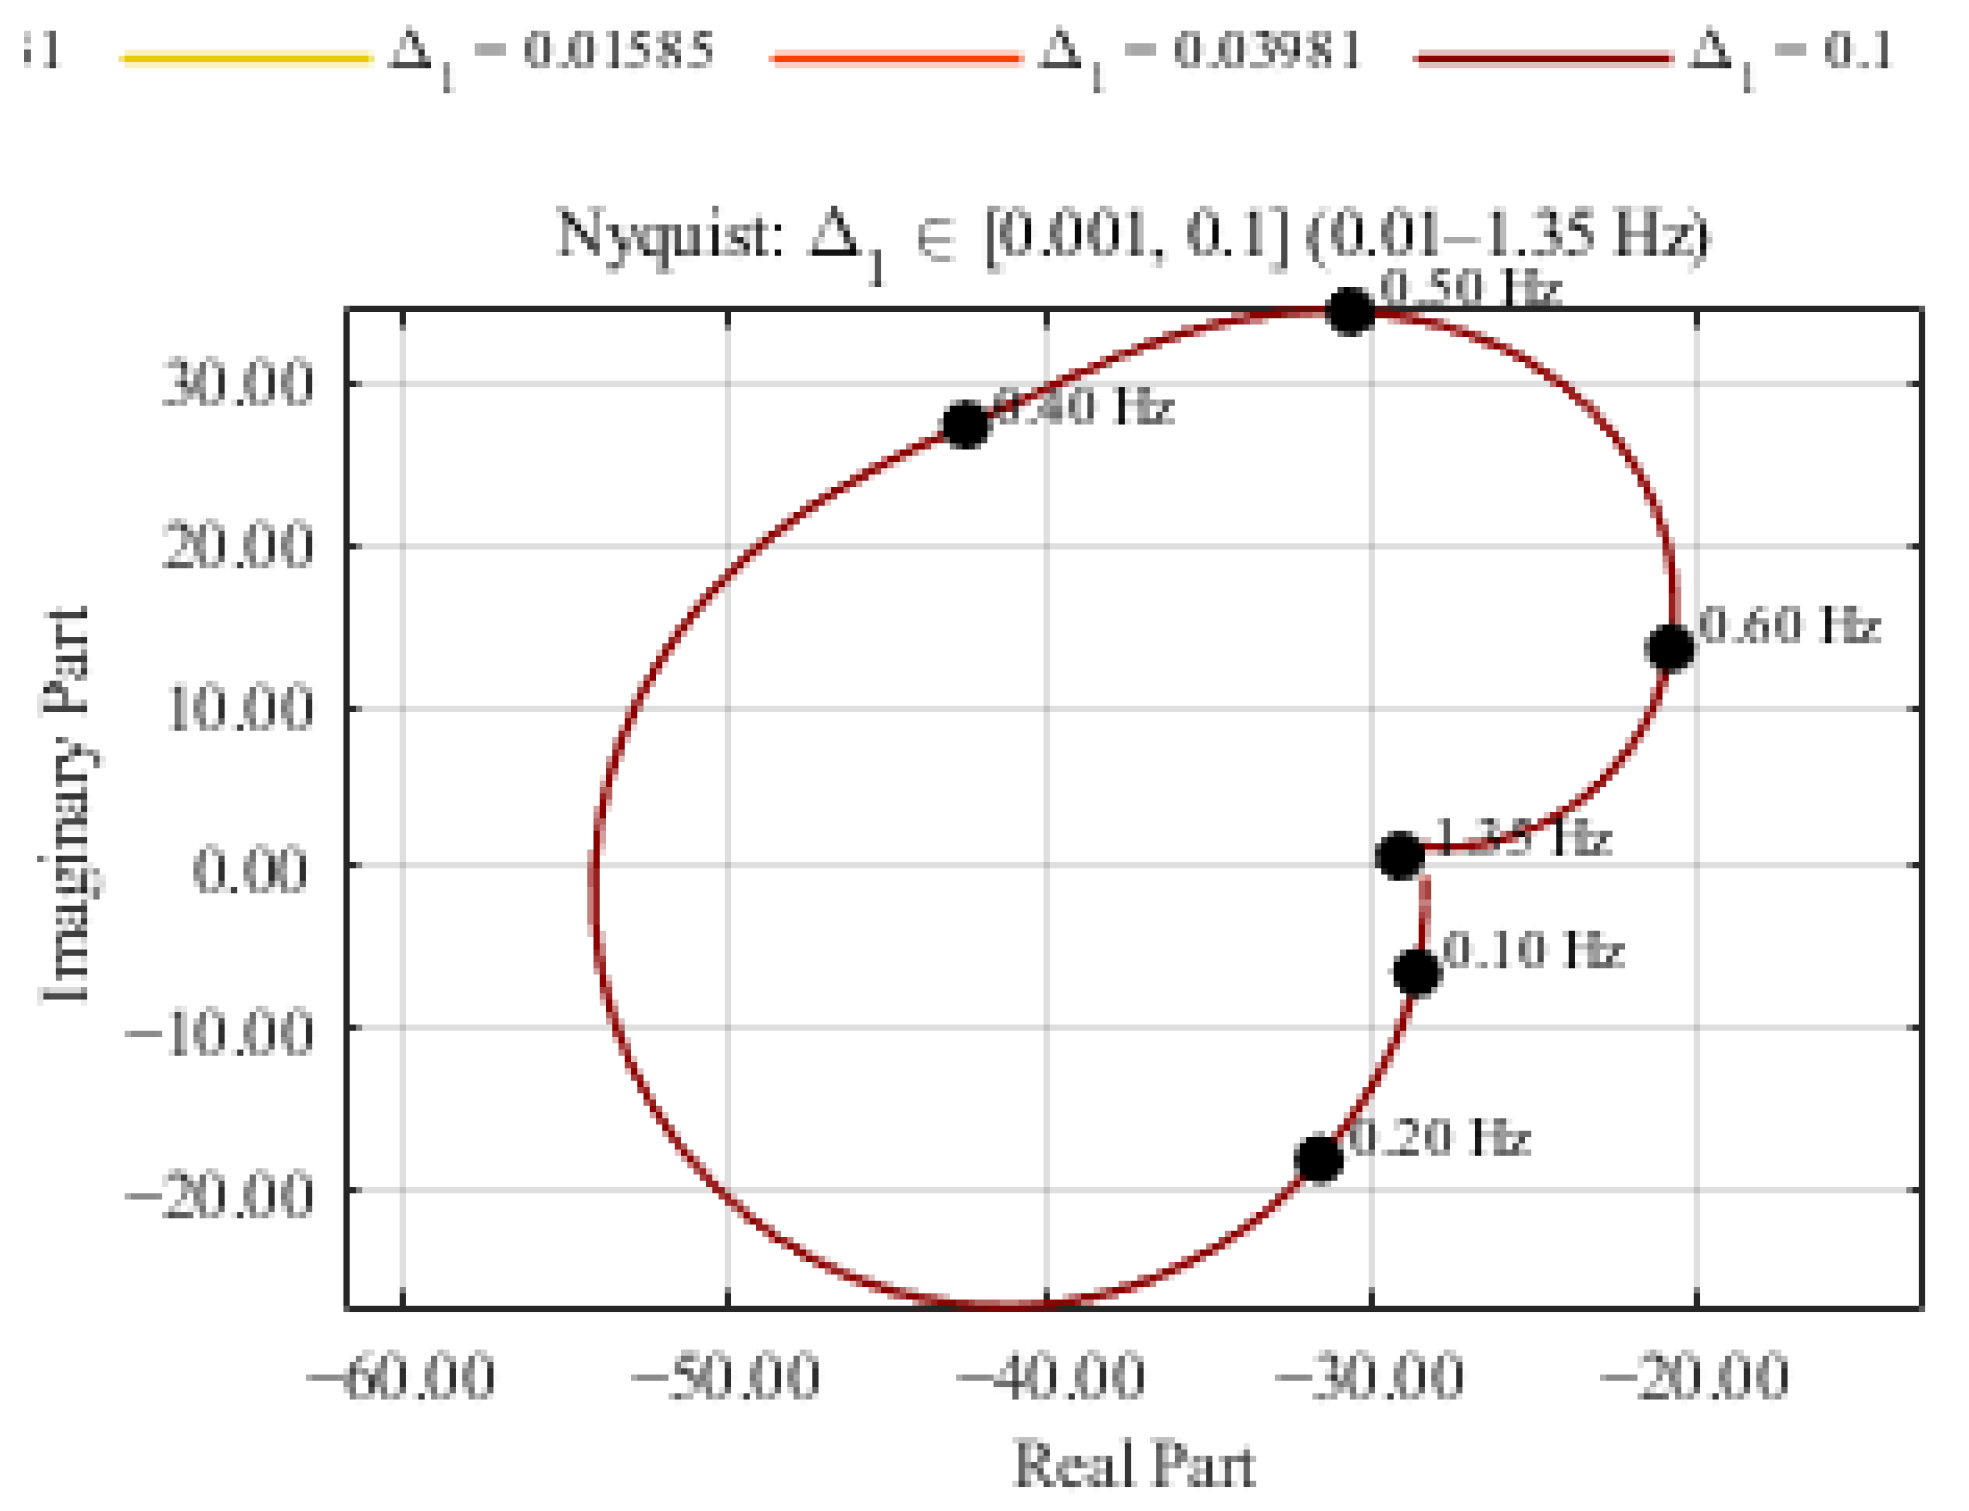
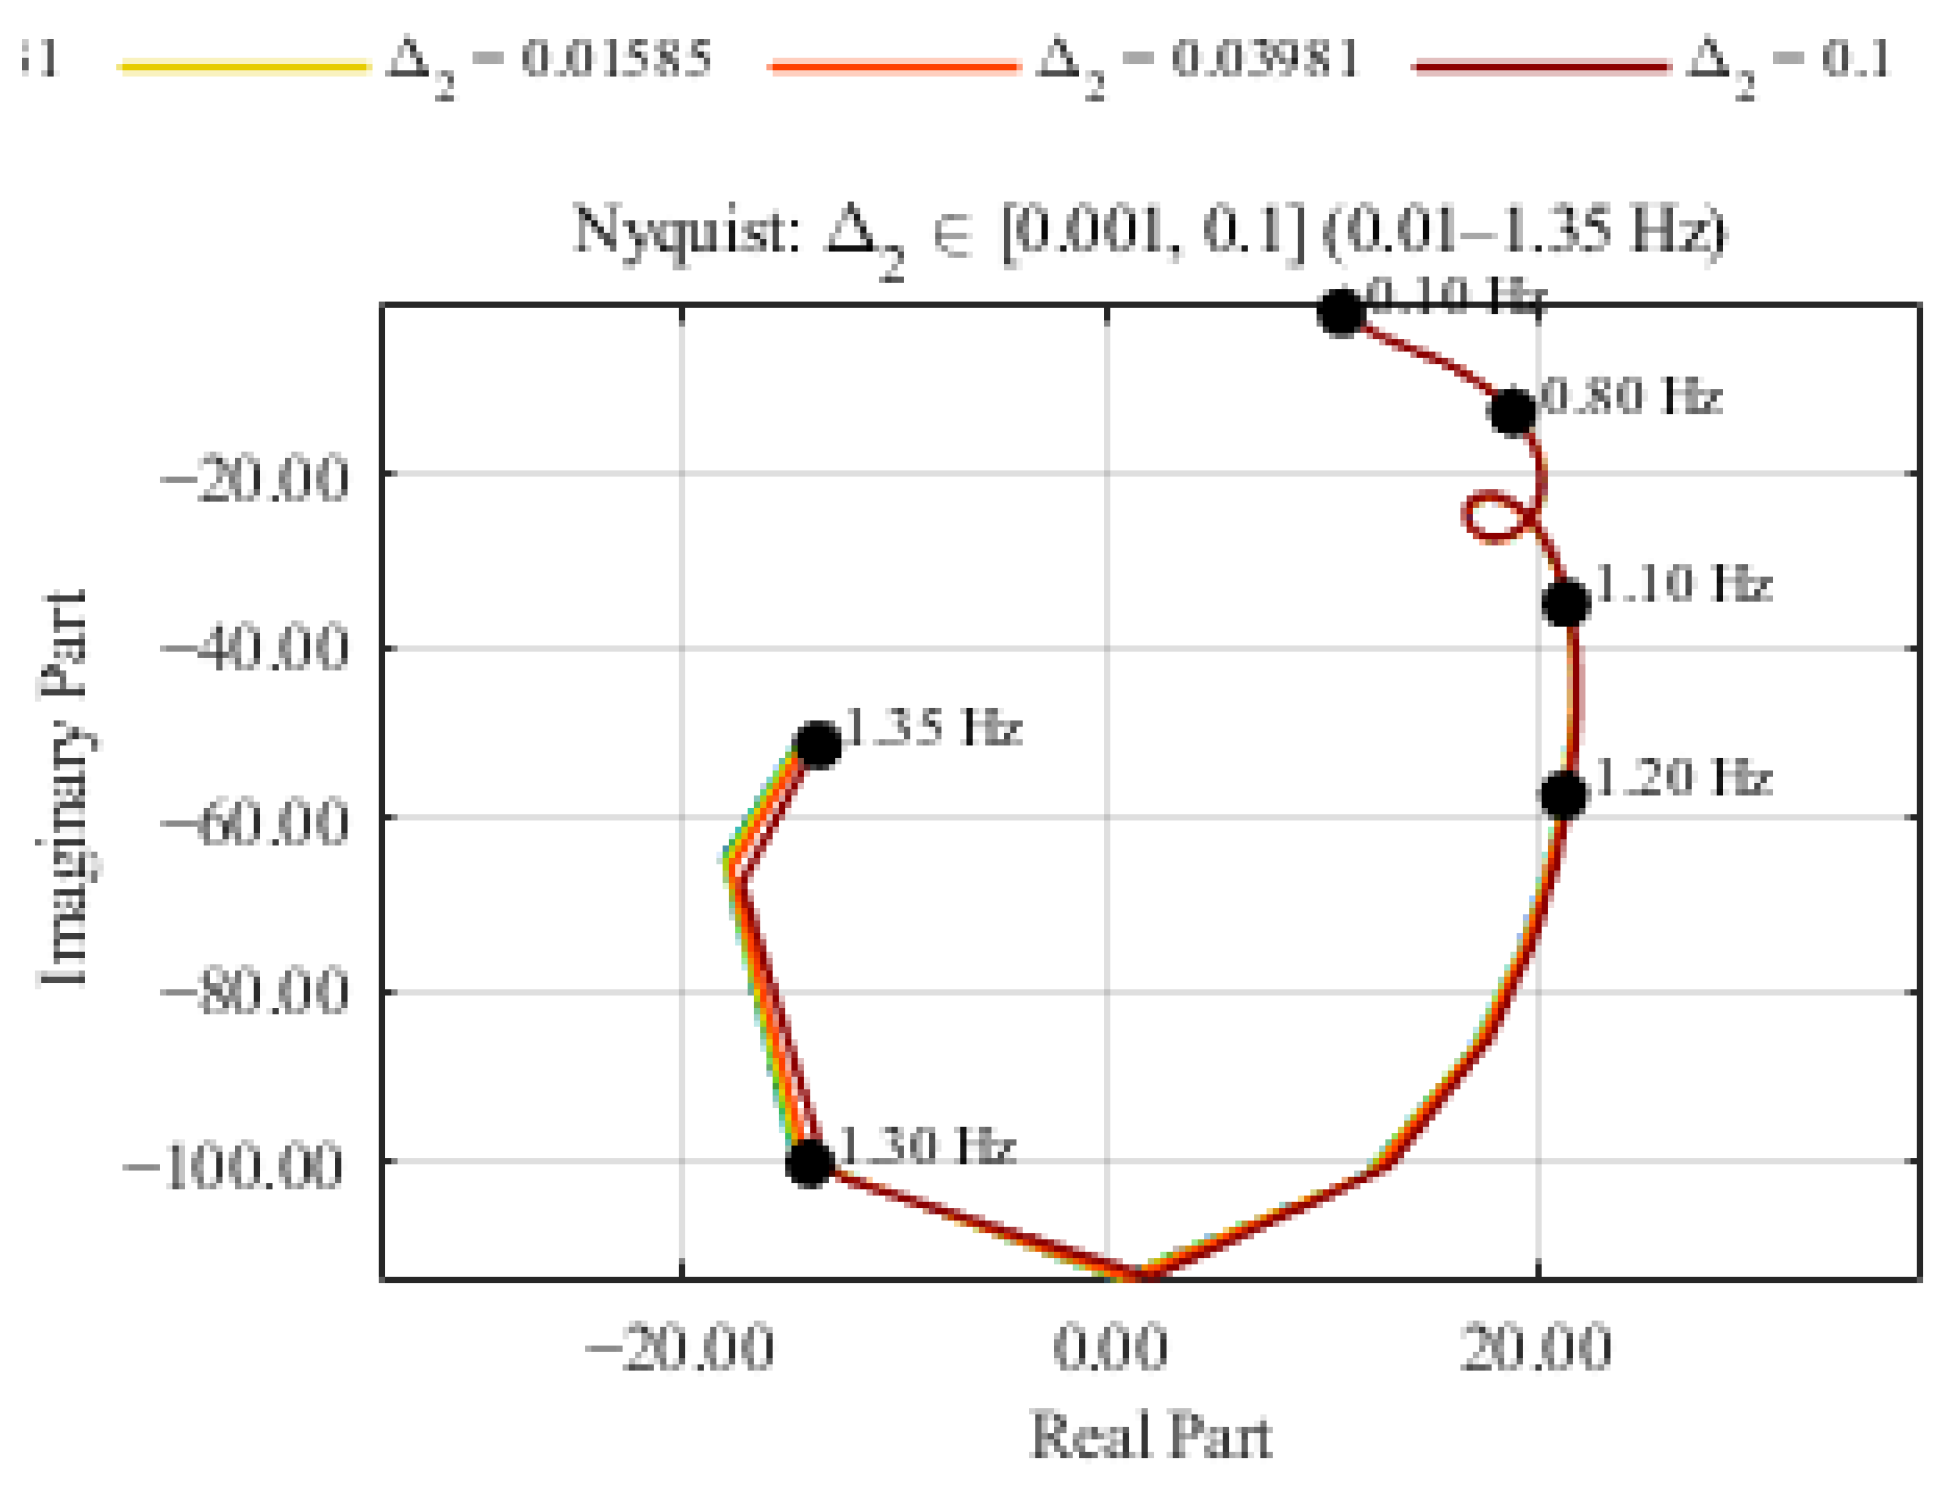
The parameter-sweep Nyquist diagrams in
Figure 6 and
Figure 7 can be used to examine the robustness of these loops to variations in the normalized controller gains, denoted Δ1 (PSS channel) and Δ2 (HVDC channel). For the Δ1 sweep, the Nyquist trajectory remains well separated from the (
) point across all frequencies from 0.01 to 1.35 Hz, indicating that moderate changes in PSS gain do not compromise the closed-loop stability or alter the damping allocation. In contrast, the Δ2 sweep shows more pronounced deformation of the Nyquist locus, with the 0.8–1.2 Hz segment moving closer to the critical point as Δ2 increases. This behavior suggests that excessive HVDC gain can reduce stability margins and potentially trigger interaction with higher-frequency modes.
4. Conclusions and Recommendations
This paper presented a Nyquist-based framework for analyzing control interactions between a PSS and an HVDC MSDC operating concurrently in a hybrid AC/DC system. By introducing loop-at-a-time perturbations and examining the resulting deformation of the Nyquist loci, the method provides a direct frequency-domain visualization of cross-channel coupling. The Nyquist spectral-radius margin, defined as the minimum distance between the Nyquist loci of the perturbed loop and the critical point (−1 + j0), was used as a quantitative metric to assess interaction-induced robustness degradation.
Reduced-order transfer functions identified using the MP enabled reconstruction of the underlying 2 × 2 loop transfer matrix from RMS transient-stability simulations. The Nyquist responses and the associated spectral-radius margins showed that, in the inter-area frequency range, the HVDC modulation loop exhibits stronger loop influence on closed-loop robustness than the PSS loop, as reflected by larger Nyquist excursions and greater sensitivity of the spectral-radius margin to HVDC gain variation. In contrast, variations in PSS gain produced comparatively small changes in the Nyquist loci and only minor variations in the spectral-radius margin, indicating weaker cross-channel interaction within the operating conditions studied.
The scope of this study was limited to small-signal electromechanical dynamics, a single PSS location, and one HVDC modulation channel under fixed operating conditions. EMT-level converter dynamics, large-disturbance nonlinear effects, and interactions among multiple damping controllers were not considered.
Future research will therefore extend this framework to EMT-hybrid simulations, multi-controller environments, and online monitoring schemes that track Nyquist deformation in real time. Another promising direction is the development of coordinated tuning strategies or optimization algorithms that explicitly maximize the spectral-radius margin and enforce desired dominance conditions across the damping bandwidth. These extensions will broaden the applicability of the Nyquist-based interaction method to larger, converter-dominated networks with multiple interacting damping controllers.
Author Contributions
Conceptualization, R.V., J.v.C. and C.G.; methodology, R.V.; software, R.V.; validation, R.V., J.v.C. and C.G.; formal analysis, R.V.; investigation, R.V.; resources, J.v.C. and C.G.; data curation, R.V.; writing—original draft preparation, R.V.; writing—review and editing, R.V., J.v.C. and C.G.; visualization, R.V.; supervision, J.v.C. and C.G.; project administration, C.G.; funding acquisition, J.v.C. and C.G. All authors have read and agreed to the published version of the manuscript.
Funding
This research received no external funding.
Institutional Review Board Statement
Not applicable.
Informed Consent Statement
Not applicable.
Data Availability Statement
Acknowledgments
During the preparation of this manuscript/study, the author(s) used ChatGPT, 5.2 for the purposes of proofreading. The authors have reviewed and edited the output and take full responsibility for the content of this publication.
Conflicts of Interest
The authors declare no conflicts of interest.
Abbreviations
The following abbreviations are used in this manuscript:
| AVR | Automatic Voltage Regulator |
| AC | Alternation Current |
| DC | Direct Current |
| HVDC | High-Voltage Direct Current |
| PSS | Power System Stabilizer |
| LFO | Low-Frequency Oscillations |
| ETAP | Power Systems Simulation Software |
| MIMO | Multiple-Input Multiple-Output |
| SISO | Single-Input Single-Output |
| LS | Least Squares |
| TLS | Total Least Squares |
| LHP | Left-Half Plane |
| MPM | Matrix Pencil Method |
| EMT | Electromagnetic Transient |
| LCC | Line Commutated Converter |
| RMS | Phasor-Domain Dynamic Simulation |
| MATLAB | Simulation Software |
Appendix A
Table A1.
Results of transfer function identification procedure.
Table A1.
Results of transfer function identification procedure.
| G2uPSS |
| ξ | A | W | γr_meas | γβ_meas | γr_recon | γβ_recon |
| −0.70895 + 7.823 i | 0.0422707 + 0.327727 i | −0.0203438 + 0.0127435 i | −0.035525 − 0.082898 i | −0.99711 + 2.1947 i | −0.035525 − 0.082898 i | −0.99711 + 2.1947 i |
| −0.70895 − 7.823 i | 0.0422707 − 0.327727 i | −0.0203438 − 0.0127435 i | −0.035525 + 0.082898 i | −0.99711 − 2.1947 i | −0.035525 + 0.082898 i | −0.99711 − 2.1947 i |
| −0.30638 + 9.4057 i | 13.4671 + 14.7898 i | 0.182016 + 0.656755 i | −1.2578 × 10⁻⁵−1.2704 × 10⁻⁵ i | −4.8049 + 0.87602 i | −1.2578 × 10⁻⁵−1.2704 × 10⁻⁵ i | −4.8049 + 0.87602 i |
| −0.30638 − 9.4057 i | 13.4671 − 14.7898 i | 0.182016 − 0.656755 i | −1.2578 × 10⁻⁵ + 1.2704 × 10⁻⁵ i | −4.8049 − 0.87602 i | −1.2578 × 10⁻⁵ + 1.2704 × 10⁻⁵ i | −4.8049 − 0.87602 i |
| −0.37497 + 11.518 i | −51.3048 − 13.5725 i | 0.953986 − 2.17368 i | −5.7409 × 10⁻⁵ + 6.764 × 10⁻⁷ i | 21.498 − 16.05 i | −5.7409 × 10⁻⁵ + 6.764 × 10⁻⁷ i | 21.498 − 16.05 i |
| −0.37497 − 11.518 i | −51.3048 + 13.5725 i | 0.953986 + 2.17368 i | −5.7409 × 10⁻⁵−6.764 × 10⁻⁷ i | 21.498 + 16.05 i | −5.7409 × 10⁻⁵−6.764 × 10⁻⁷ i | 21.498 + 16.05 i |
| −0.31478 + 5.7056 i | −0.69946 + 0.293053 i | −0.00224537 + 0.000843282 i | −0.0030565 − 0.01852 i | −0.02496 − 0.0017228 i | −0.0030565 − 0.01852 i | −0.02496 − 0.0017228 i |
| −0.31478 − 5.7056 i | −0.69946 − 0.293053 i | −0.00224537 − 0.000843282 i | −0.0030565 + 0.01852 i | −0.02496 + 0.0017228 i | −0.0030565 + 0.01852 i | −0.02496 + 0.0017228 i |
| G2uhvdc |
| −0.99834 + 7.8086 i | 0.0056548 + 0.00946899 i | 0.000510204 − 0.000325359 i | −0.014995 − 0.007343 i | 0.19537 − 0.34688 i | −0.014995 − 0.007343 i | 0.19537 − 0.34688 i |
| −0.99834 − 7.8086 i | 0.0056548 − 0.00946899 i | 0.000510204 + 0.000325359 i | −0.014995 + 0.007343 i | 0.19537 + 0.34688 i | −0.014995 + 0.007343 i | 0.19537 + 0.34688 i |
| −0.54492 + 3.5314 i | 0.0772761 − 0.00325203 i | −0.000864003 + 0.000172722 i | −0.0013154 + 0.0094318 i | 0.012917 − 0.027933 i | −0.0013154 + 0.0094318 i | 0.012917 − 0.027933 i |
| −0.54492 − 3.5314 i | 0.0772761 + 0.00325203 i | −0.000864003 − 0.000172722 i | −0.0013154 − 0.0094318 i | 0.012917 + 0.027933 i | −0.0013154 − 0.0094318 i | 0.012917 + 0.027933 i |
| −0.1819 + 8.1651 i | 0.985107 + 2.55356 i | −0.00577787 + 0.0585211 i | −1.5639 × 10⁻⁵ + 2.2763 × 10⁻⁵ i | 0.090225 − 0.14864 i | −1.5639 × 10⁻⁵ + 2.2763 × 10⁻⁵ i | 0.090225 − 0.14864 i |
| −0.1819 − 8.1651 i | 0.985107 − 2.55356 i | −0.00577787 − 0.0585211 i | −1.5639 × 10⁻⁵−2.2763 × 10⁻⁵ i | 0.090225 + 0.14864 i | −1.5639 × 10⁻⁵−2.2763 × 10⁻⁵ i | 0.090225 + 0.14864 i |
| L7uPSS |
| −0.31876 + 1.8503 i | −0.914126 + 0.401932 i | 0.369102 − 0.732724 i | −0.26193 − 0.86265 i | 5.4938 − 3.4825 i | −0.26193 − 0.86265 i | 5.4938 − 3.4825 i |
| −0.31876 − 1.8503 i | −0.914126 − 0.401932 i | 0.369102 + 0.732724 i | −0.26193 + 0.86265 i | 5.4938 + 3.4825 i | −0.26193 + 0.86265 i | 5.4938 + 3.4825 i |
| −0.53411 + 3.5615 i | 0.974566 − 1.0388 i | 0.0141439 + 0.109733 i | 0.24277 + 0.1067 i | −3.4093 − 1.0084 i | 0.24277 + 0.1067 i | −3.4093 − 1.0084 i |
| −0.53411 − 3.5615 i | 0.974566 + 1.0388 i | 0.0141439 − 0.109733 i | 0.24277 − 0.1067 i | −3.4093 + 1.0084 i | 0.24277 − 0.1067 i | −3.4093 + 1.0084 i |
| −0.70391 + 1.9585 i | 0.246787 + 0.102648 i | −0.0479669 + 0.027798 i | 0 + 0 i | −4.151 + 3.4228 i | −6.93889e−18 + 0 i | −4.151 + 3.4228 i |
| −0.70391 − 1.9585 i | 0.246787 − 0.102648 i | −0.0479669 − 0.027798 i | 0 + 0 i | −4.151 − 3.4228 i | −6.93889 × 10⁻¹⁸ + 0 i | −4.151 − 3.4228 i |
| −0.66794 + 2.7244 i | 0.148201 − 0.276132 i | −0.0380374 − 0.0466722 i | −0.031662 − 0.04216 i | 2.0433 − 4.1537 i | −0.031662 − 0.04216 i | 2.0433 − 4.1537 i |
| −0.66794 − 2.7244 i | 0.148201 + 0.276132 i | −0.0380374 + 0.0466722 i | −0.031662 + 0.04216 i | 2.0433 + 4.1537 i | −0.031662 + 0.04216 i | 2.0433 + 4.1537 i |
| L7uhvdc |
| −2.6511 + 2.3423 i | −6.37948 × 10⁻⁵−3.72636 × 10⁻⁵ i | −2.42243 × 10⁻¹⁴−1.10651 × 10⁻¹⁵ i | 1.3057 − 0.34187 i | 0 + 0 i | 1.3057 − 0.34187 i | 1.05879e−22 + 0 i |
| −2.6511 − 2.3423 i | −6.37948 × 10⁻⁵ + 3.72636 × 10⁻⁵ i | −2.42243 × 10⁻¹⁴ + 1.10651 × 10⁻¹⁵ i | 1.3057 + 0.34187 i | 0 + 0 i | 1.3057 + 0.34187 i | 1.05879 × 10⁻²² + 0 i |
| −0.54455 + 3.5354 i | 1.26247 − 3.46977 i | −0.0087685 + 0.155982 i | 0.53793 + 0.24455 i | −4.311 − 3.24041 i | 0.53793 + 0.24455 i | −4.311 − 3.24041 i |
| −0.54455 − 3.5354 i | 1.26247 + 3.46977 i | −0.0087685 − 0.155982 i | 0.53793 − 0.24455 i | −4.311 + 3.24041 i | 0.53793 − 0.24455 i | −4.311 + 3.24041 i |
| −0.63795 + 12.251 i | −0.220403 − 0.167441 i | −0.00336788 + 0.0389656 i | −1.3401 × 10⁻⁵−7.7223 × 10⁻⁶ i | −2.0902 − 1.3263 i | −1.3401 × 10⁻⁵−7.7223 × 10⁻⁶ i | −2.0902 − 1.3263 i |
| −0.63795 − 12.251 i | −0.220403 + 0.167441 i | −0.00336788 − 0.0389656 i | −1.3401 × 10⁻⁵ + 7.7223 × 10⁻⁶ i | −2.0902 + 1.3263 i | −1.3401 × 10⁻⁵ + 7.7223 × 10⁻⁶ i | −2.0902 + 1.3263 i |
| −0.80672 + 9.9022 i | 0.00332897 − 0.0246972 i | −0.00765801 + 0.00423533 i | 3.6886 × 10⁻⁵ + 5.3828 × 10⁻⁵ i | 0.74587 + 1.4796 i | 3.6886 × 10⁻⁵ + 5.3828 × 10⁻⁵ i | 0.74587 + 1.4796 i |
| −0.80672 − 9.9022 i | 0.00332897 + 0.0246972 i | −0.00765801 − 0.00423533 i | 3.6886 × 10⁻⁵−5.3828 × 10⁻⁵ i | 0.74587 − 1.4796 i | 3.6886 × 10⁻⁵−5.3828 × 10⁻⁵ i | 0.74587 − 1.4796 i |
| −0.6433 + 1.0162 i | −0.895093 + 0.380564 i | −0.121911 − 0.069889 i | 0 + 0 i | −9.0272 − 1.8095 i | 0 − 1.38778 × 10⁻¹⁷ i | −9.0272 − 1.8095 i |
| −0.6433 − 1.0162 i | −0.895093 − 0.380564 i | −0.121911 + 0.069889 i | 0 + 0 i | −9.0272 + 1.8095 i | 0 + 1.38778 × 10⁻¹⁷ i | −9.0272 + 1.8095 i |
| −0.55833 + 2.9259 i | 1.1049 + 0.245736 i | −0.101295 − 0.0533547 i | 0 + 0 i | −4.0893 − 1.3382 i | -1.38778 × 10⁻¹⁷ + 1.38778 × 10⁻¹⁷ i | −4.0893 − 1.3382 i |
| −0.55833 − 2.9259 i | 1.1049 − 0.245736 i | −0.101295 + 0.0533547 i | 0 + 0 i | −4.0893 + 1.3382 i | −1.38778 × 10⁻¹⁷−1.38778 × 10⁻¹⁷ i | −4.0893 + 1.3382 i |
| −0.38031 + 1.8749 i | −2.921 + 8.89158 i | 0.00242854 − 0.383363 i | 0 + 0 i | 1.68 − 4.1187 i | −5.55112 × 10⁻¹⁷−1.11022 × 10⁻¹⁶ i | 1.68 − 4.1187 i |
| −0.38031 − 1.8749 i | −2.921 − 8.89158 i | 0.00242854 + 0.383363 i | 0 + 0 i | 1.68 + 4.1187 i | −5.55112 × 10⁻¹⁷ + 1.11022 × 10⁻¹⁶ i | 1.68 + 4.1187 i |
| −0.84746 + 8.8185 i | −0.00806607 − 0.0125891 i | 0.00120127 + 0.00645538 i | 0 + 0 i | 1.3232 + 0.93508 i | 1.73472 × 10⁻¹⁸ + 1.73472 × 10⁻¹⁸ i | 1.3232 + 0.93508 i |
| −0.84746 − 8.8185 i | −0.00806607 + 0.0125891 i | 0.00120127 − 0.00645538 i | 0 + 0 i | 1.3232 − 0.93508 i | 1.73472 × 10⁻¹⁸−1.73472 × 10⁻¹⁸ i | 1.3232 − 0.93508 i |
References
- Liao, Y.; Wang, X.; Blaabjerg, F. Stability of hybrid AC/DC power systems: A review. IEEE Trans. Power Electron. 2021, 36, 7480–7499. [Google Scholar]
- Khazaei, J.; Idowu, P.; Asrari, A.; Shafaye, A.B.; Piyasinghe, L. Review of HVDC control in weak AC grids. Electr. Power Syst. Res. 2018, 162, 194–206. [Google Scholar] [CrossRef] [Scilit]
- Sybille, G. HVDC control interactions in hybrid AC/DC grids. IEEE Trans. Power Deliv. 2020, 35, 97–108. [Google Scholar]
- Zeng, L.; Yao, W.; Zeng, Q.; Li, D.; Fang, J.; Ai, X.; Wen, J.; He, H. Design and real-time implementation of data-driven adaptive wide-area damping controller for back-to-back VSC-HVDC. Int. J. Electr. Power Energy Syst. 2019, 109, 558–574. [Google Scholar] [CrossRef] [Scilit]
- Yu, Z.; Liu, T.; Hill, D.J. Interaction modes in modern converter-dominated systems. IEEE Trans. Power Syst. 2022, 37, 827–839. [Google Scholar]
- Lyu, J.; Wang, X.; Guerrero, J.M. Stability assessment and interaction analysis in hybrid multi-terminal AC/DC systems. IEEE Trans. Smart Grid 2021, 12, 4083–4096. [Google Scholar]
- Debnath, S.; Mahseredjian, J.; Dinavahi, V. EMT–phasor hybrid simulation tools for AC/DC grids. IEEE Trans. Power Deliv. 2020, 35, 2595–2608. [Google Scholar]
- Bagheri, A.; Quintero, J.; Kovács, P. Matrix pencil identification for oscillation analysis in power systems. IEEE Trans. Power Syst. 2018, 33, 7051–7062. [Google Scholar]
- Zhou, N.; Meng, D.; Dosiek, L. Wide-area oscillation monitoring using Prony and pencil methods. IEEE Trans. Power Syst. 2021, 36, 3677–3688. [Google Scholar]
- Zhou, K.; Doyle, J.C.; Glover, K. Robust and Optimal Control; Prentice-Hall: Upper Saddle River, NJ, USA, 1996. [Google Scholar]
- MathWorks. Robust Control Toolbox User’s Guide; MathWorks Inc.: Natick, MA, USA, 2023. [Google Scholar]
- Bristol, E.H. On a new measure of interaction for multivariable process control. IEEE Trans. Autom. Control 1966, 11, 133–134. [Google Scholar] [CrossRef] [Scilit]
- Skogestad, S.; Postlethwaite, I. Multivariable Feedback Control: Analysis and Design, 2nd ed.; Wiley: Chichester, UK, 2005. [Google Scholar]
- Hauer, J.F. Application of Prony analysis to the determination of modal content and equivalent models for measured power system response. IEEE Trans. Power Syst. 1991, 6, 1062–1068. [Google Scholar] [CrossRef] [Scilit]
- Kay, S.M. Fundamentals of Statistical Signal Processing: Estimation Theory; Prentice-Hall: Englewood Cliffs, NJ, USA, 1993. [Google Scholar]
- Van Huffel, S.; Vandewalle, J. The Total Least Squares Problem; SIAM: Philadelphia, PA, USA, 1991. [Google Scholar]
- Hua, Y.; Sarkar, T.K. Matrix pencil method for estimating parameters of exponentially damped/undamped sinusoids in noise. IEEE Trans. Acoust. Speech Signal Process. 1990, 38, 814–824. [Google Scholar] [CrossRef] [Scilit]
- Pierre, D.A.; Trudnowski, D.J.; Hauer, J.F. Identifying reduced-order models for large nonlinear systems with arbitrary initial conditions and multiple outputs using Prony signal analysis. In Proceedings of the American Control Conference, San Diego, CA, USA, 23–25 May 1990; pp. 149–154. [Google Scholar]
- Trudnowski, D.J.; Smith, J.R.; Short, T.A.; Pierre, D.A. An application of Prony methods in PSS design for multimachine systems. IEEE Trans. Power Syst. 1991, 6, 118–126. [Google Scholar] [CrossRef] [Scilit]
- Vengesai, R.; van Coller, J.; Gomes, C. Emulation of LCC HVDC systems in ETAP for control interaction studies between PSS and HVDC modulation damping controllers. In Proceedings of the IEEE AFRICON 2025, Johannesburg, South Africa, 28–30 May 2025. [Google Scholar]
| Disclaimer/Publisher’s Note: The statements, opinions and data contained in all publications are solely those of the individual author(s) and contributor(s) and not of MDPI and/or the editor(s). MDPI and/or the editor(s) disclaim responsibility for any injury to people or property resulting from any ideas, methods, instructions or products referred to in the content. |