Proceeding Paper

Liquid-Based Semiconductor Rheostat for DC Arc Fault Suppression †
School of Electrical and Information Engineering, University of the Witwatersrand, Johannesburg 2000, South Africa
*
Author to whom correspondence should be addressed.
Presented at the 34th Southern African Universities Power Engineering Conference (SAUPEC 2026), South Africa, 30 June–1 July 2026.
Eng. Proc. 2026, 140(1), 26; https://doi.org/10.3390/engproc2026140026

Published: 20 May 2026

Abstract

Validation testing of a liquid-based rheostat confirmed its efficacy in mitigating DC arc faults in photovoltaic systems by exceeding critical resistance and voltage–current thresholds. Experimental characterization of electrode immersion depth, separation, and electrolyte concentration identified zinc-galvanized steel to copper in NaHCO3 as the optimal configuration, achieving a dynamic range factor of 39.10. Further analysis prioritized high minimum resistance (RMIN) for arc extinction, favouring stable electrode pairs like copper to brass with a 10 g solute concentration. A unified piecewise resistance model validated arc suppression through a load line analysis, demonstrating non-intersection with the Mayr extinction boundary. These findings support scaling the device to a 5 kW, 250 VDC rating for electric geysers, utilizing 200 mm × 50 mm electrodes and increased electrolyte volume to ensure operational stability.

1. Introduction

The widespread adoption of photovoltaic (PV) systems necessitates reliable DC arc management methods. DC arc extinction is inherently challenging due to absent zero crossing points, which presents fire risks [1,2]. Mechanical switching devices worsen this through contact bounce, initiating arcing and accelerating degradation [2,3]. Conventional suppression techniques (arc chutes, gas-insulated breakers) are often costly, bulky, or unsuitable for DC characteristics and distributed PV layouts [4,5]. Given PV systems’ operational profile (low voltages, moderate currents, outdoor durability), cost-effective alternatives are essential [1].
This project investigates a liquid-based device for DC arc mitigation, adapting industrial liquid rheostats that modulate resistance via electrode submersion depth in electrolytes [6,7]. The device maintains low resistance during normal operation while rapidly injecting high resistance during switching to quench arcs. The Mayr model defines critical extinction thresholds [1,2]. An experimental prototype is tested across configurations using various electrodes and electrolytes to validate arc suppression. The design targets 5 kW for electric geysers connected to PV systems.
This paper proceeds as follows. Section 2 details the Mayr arc model, contact bounce, arc ignition, and liquid rheostat operation. Section 3 describes prototype construction, test procedures for electrode and electrolyte combinations, and the corresponding results. Section 4 presents the empirical model developed from data analysis and assesses arc extinction using resistance and V–I curve analysis. Section 5 discusses how the system would change if the power was increased. Section 6 summarizes the study and evaluates whether the objectives were met.

2. Background

DC arc fault mitigation requires an understanding of arc behaviour and liquid rheostat design. DC systems maintain continuous current flow, allowing arcs to persist indefinitely [2]. Series arcs in PV wiring reach temperatures exceeding 3000 °C, and have caused fires [1]. Direct-coupled PV configurations lack arc fault detection, making them particularly vulnerable.

2.1. The DC Arc Extinction Principle and Mayr’s Model

The Mayr model treats the arc as a thermally-governed conductance element [1,8], assuming the arc column loses heat at constant rate P0 regardless of instantaneous current [1]. Arc conductance G = 1/Rarc evolves according to Equation (1) [1]. When power input Pin > P0, the arc temperature rises, increasing ionisation and conductance (dG/dt > 0); when Pin < P0, the plasma cools and conductance decays exponentially (dG/dt < 0) [1,8]. Time constant τ represents arc thermal inertia [8]. The Mayr model captures low-current behaviour near extinction, while Cassie suits high-current arcs [8]. Arc initiation occurs through rapid contact opening, beginning as resistance from a melted metallic bridge until circuit voltage reaches a critical threshold, then transitioning into a persistent arc sustaining indefinitely unless circuit conditions are altered [2]. This necessitates rapid high-resistance injection by the liquid rheostat to force the current below the extinction threshold before persistent arc formation.
1 G d G d t = 1 τ P i n P 0 1

2.2. Liquid Rheostat Operation and Influence

The device operates as a variable liquid rheostat [6] with electrodes submerged in a conductive electrolyte [6,7]. Full immersion provides low resistance during normal operation [7]. Upon switching, electrode withdrawal increases the current path length and volume, rapidly raising resistance to suppress arcs [6]. Resistance follows Equation (2) [7].
R = ρ L A
Controlling separation L, area A, or resistivity ρ achieves the high resistance needed for arc suppression per Mayr’s power limit P0 [1] and the critical transition threshold [2].

3. Methodology and Test Results

The methodology was designed to empirically determine the liquid-based semiconductor device’s capability to generate sufficient resistance for DC arc suppression. The research followed a sequential approach to validate theoretical models, to optimize geometric and material configurations, and to confirm performance under varying conditions.

3.1. Validation of Mayr Model and Actuator Design

3.1.1. Preliminary Arc Measurements

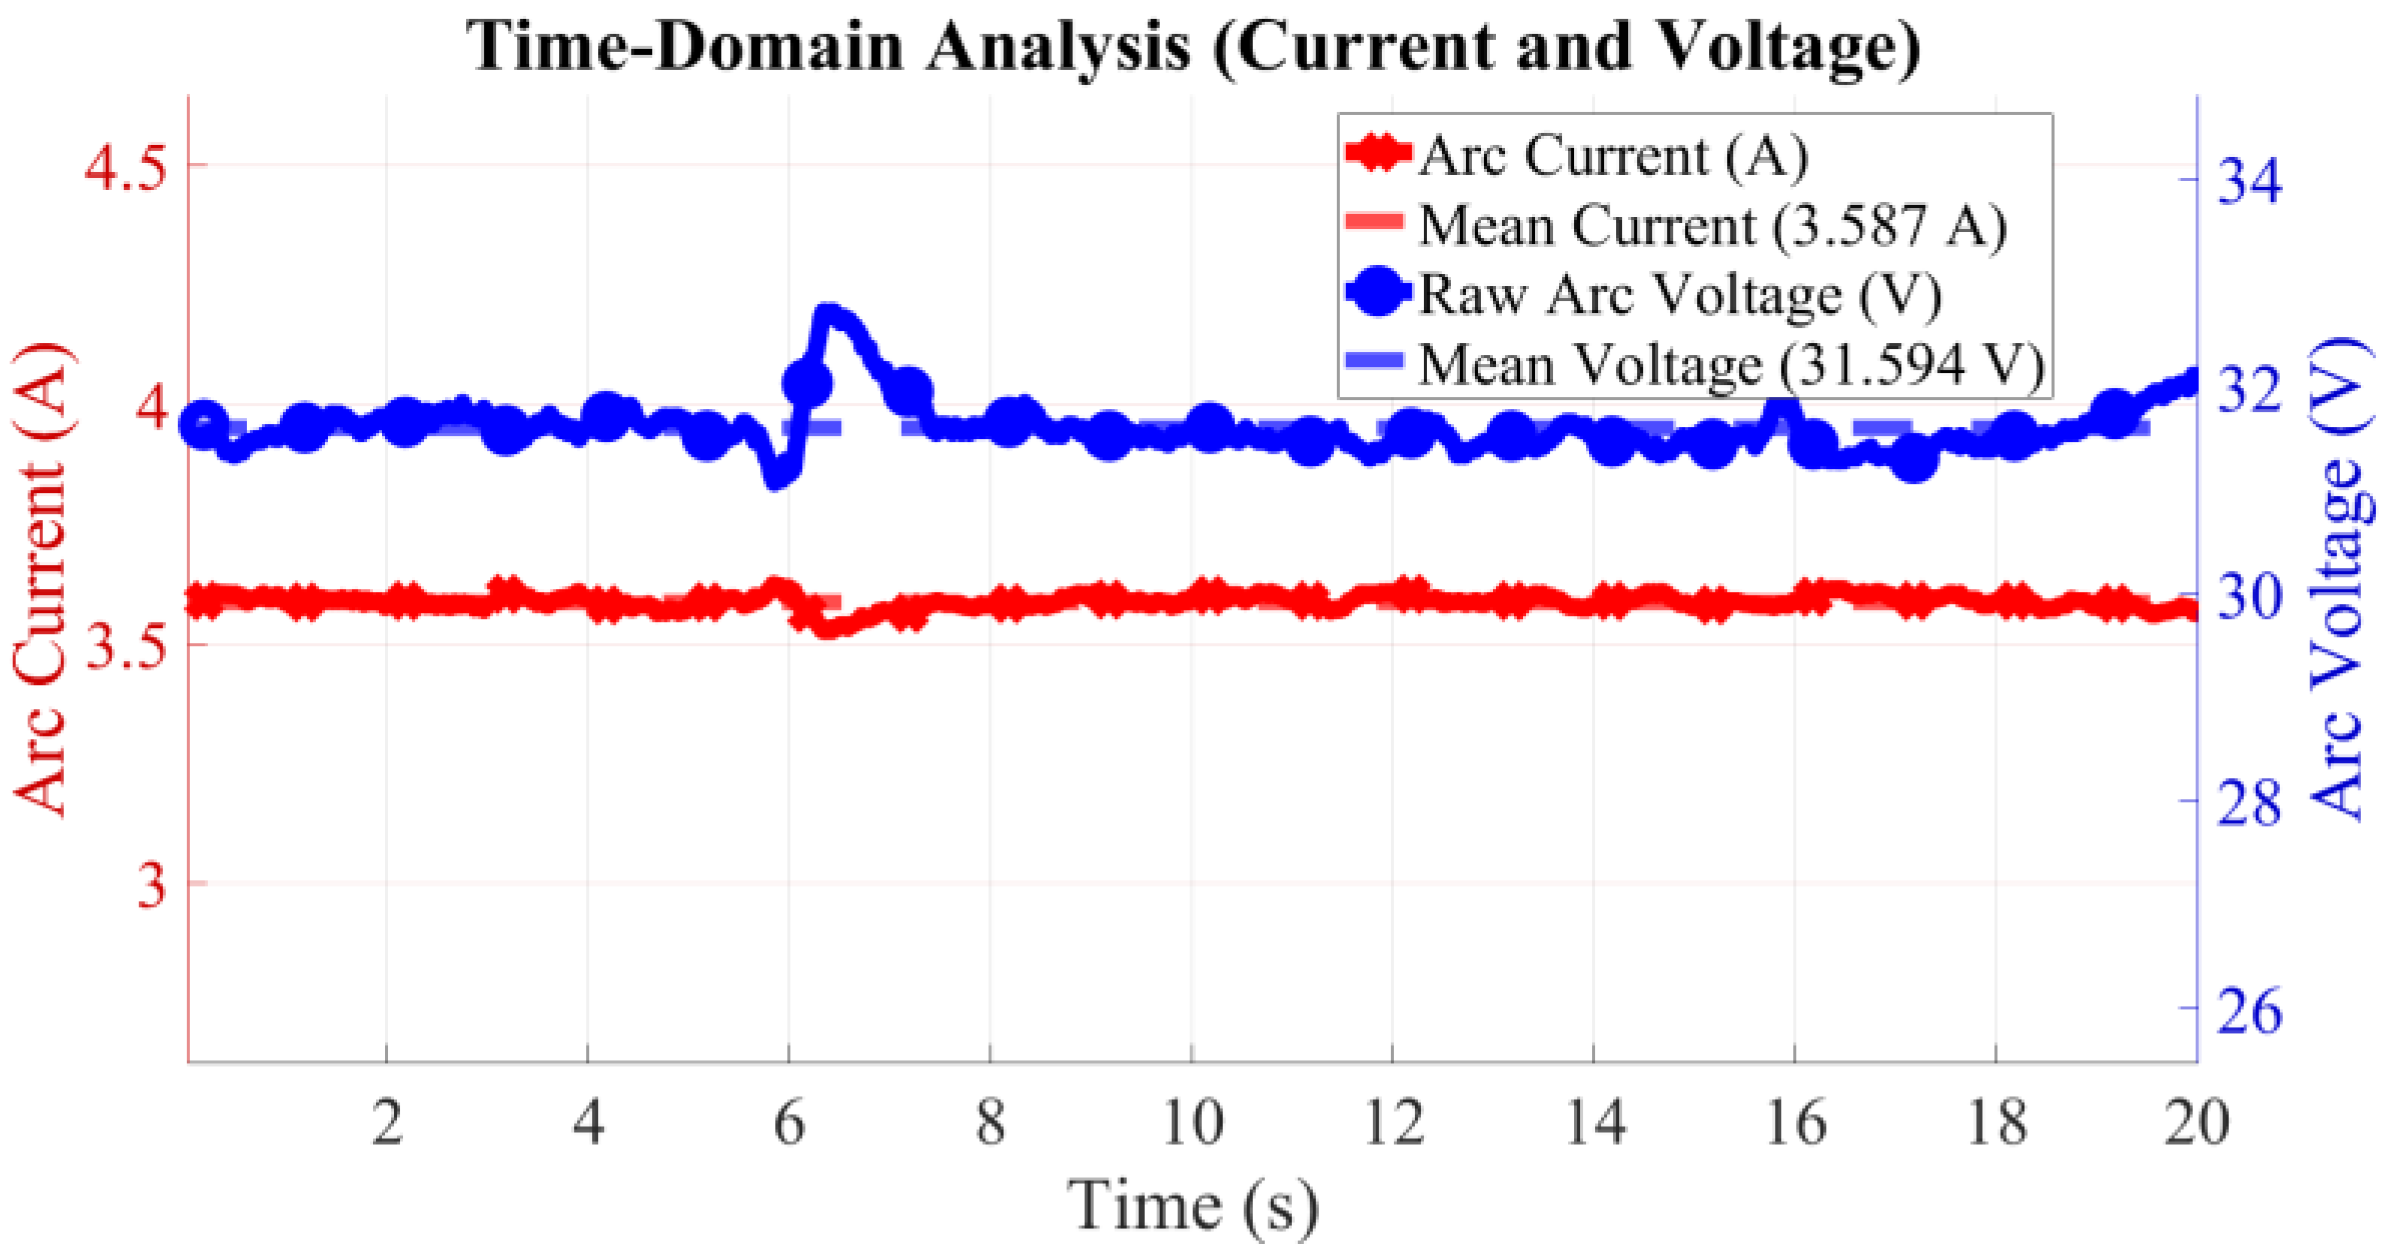
Suppression requirements were established by measuring stable static arc characteristics in air across electrode materials. Five materials were evaluated: copper (Cu), zinc-galvanized steel (ZS), stainless steel (SS), brass (B), and aluminium (Al). Arcs were sustained across a 4 mm gap with Vsource = 60.00 V and 6.00 A current limit. Stable arc powers ranged from 52 W to 120 W depending on the material: 52.97 W for Al–SS (lowest) and 119.93 W for ZS–SS (highest). Mean values from ZS–SS were used for the Mayr model calculations, with the results shown in Figure 1. From stable operating points V0,air = 31.59 V and I0,air = 3.59 A, the Mayr model cooling power is P0 = 113.33 W, defining the extinction criterion (VarcIarc < P0). The minimum resistance, Rneeded = 8.80 Ω, represents the threshold the liquid rheostat must inject to prevent stable arc formation, ranging from 5.70 Ω (ZS–SS) to 12.80 Ω (Al–SS) depending on the electrode material.

3.1.2. Actuation and Time-Dependence Analysis

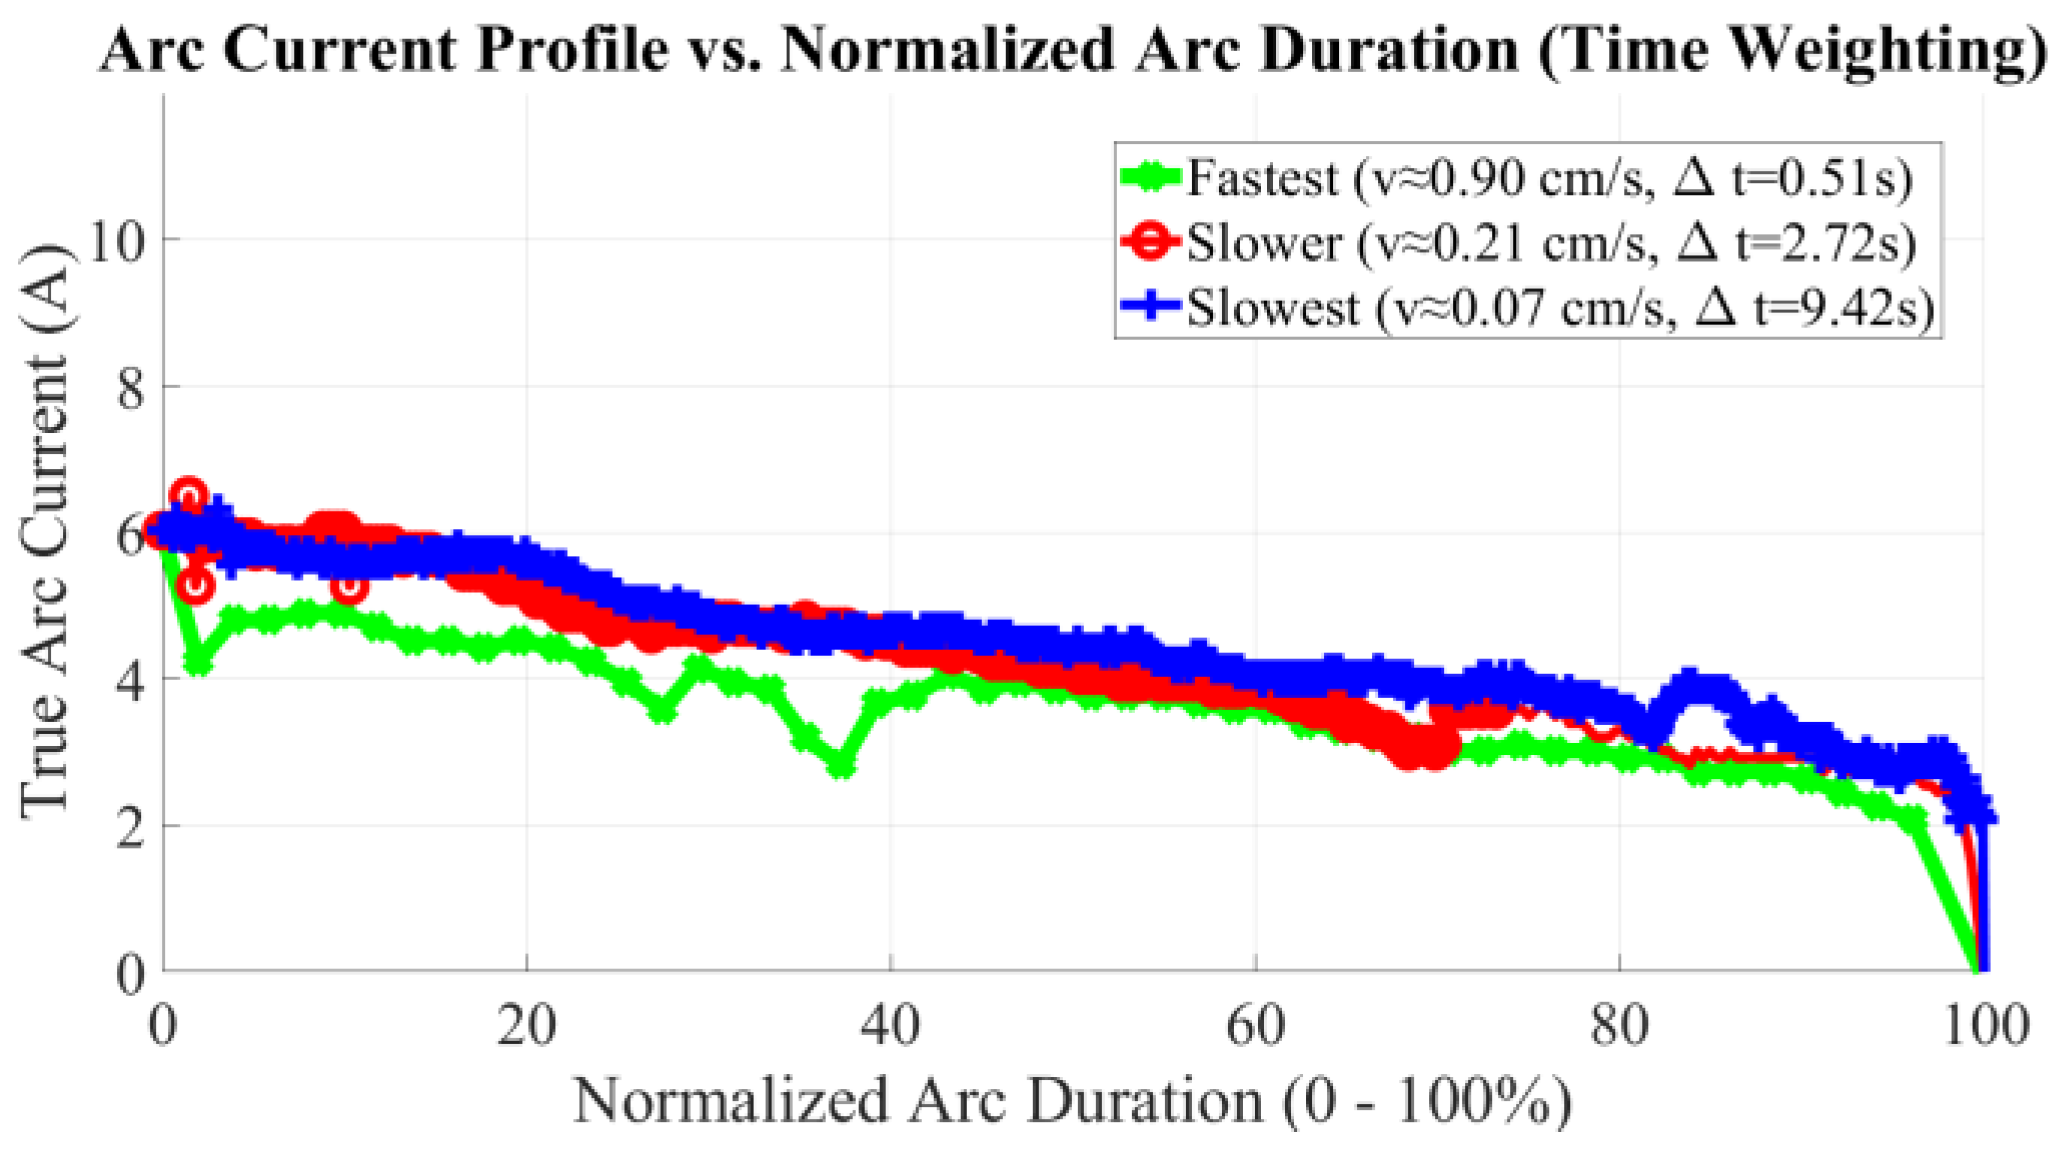
The arc suppression system used a custom linear actuator integrated with the liquid rheostat for precise electrode motion control via a voltage-regulated DC motor. Time-dependence testing at three speeds (vfast ≈ 0.90 cm/s, vmedium ≈ 0.21 cm/s, vslow ≈ 0.07 cm/s) imposed different resistance change rates and current decay (dI/dt). Despite these variations, measured arc voltage and current responses converged within the same ranges, particularly near extinction (Figure 2), indicating arc behaviour is time-independent and governed by an instantaneous electrical state. Consequently, the time-dependent term ( 1 G d G d t ) in the Mayr model can be neglected, reducing to static power balance VI = P0, confirming that time is not a dominant factor and validating the calculated extinction resistance.

3.2. System Resistance Measurements

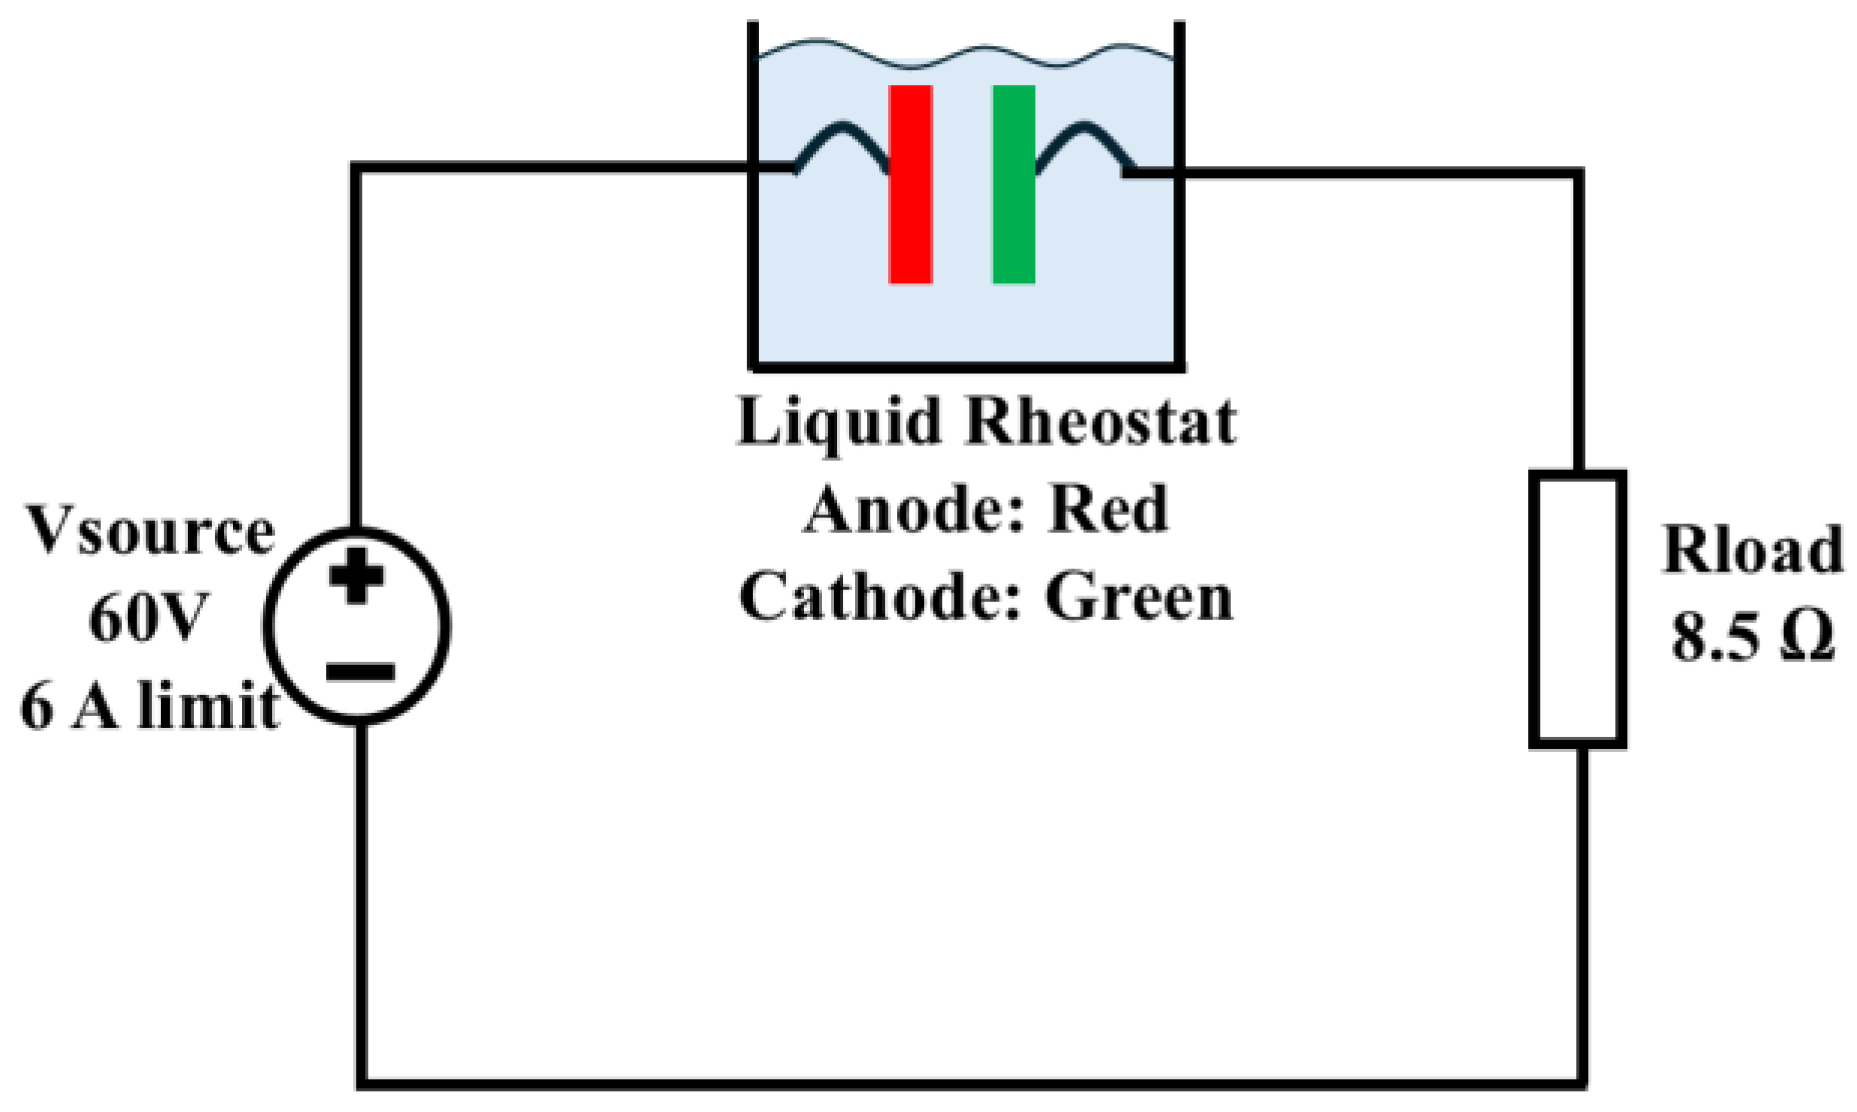
To characterize the liquid rheostat and to verify the required extinction resistance, the experimental setup (Figure 3) used a 60 V DC supply and 8.5 Ω load resistor for simultaneous voltage and current measurement. Fifteen electrode configurations across five materials (SS, B, Cu, ZS, Al), each 80 mm × 20 mm, captured the material-dependent behaviour. Three electrolytes were evaluated: KOH for high ionic conductivity and OH− effects, NaCl as the high-conductivity baseline, and NaHCO3 for buffering and gas evolution relevant to arc extinction [6]. Actuator speed was fixed at v = 0.70 cm/s for repeatability.

3.2.1. Varying Length Between Electrodes

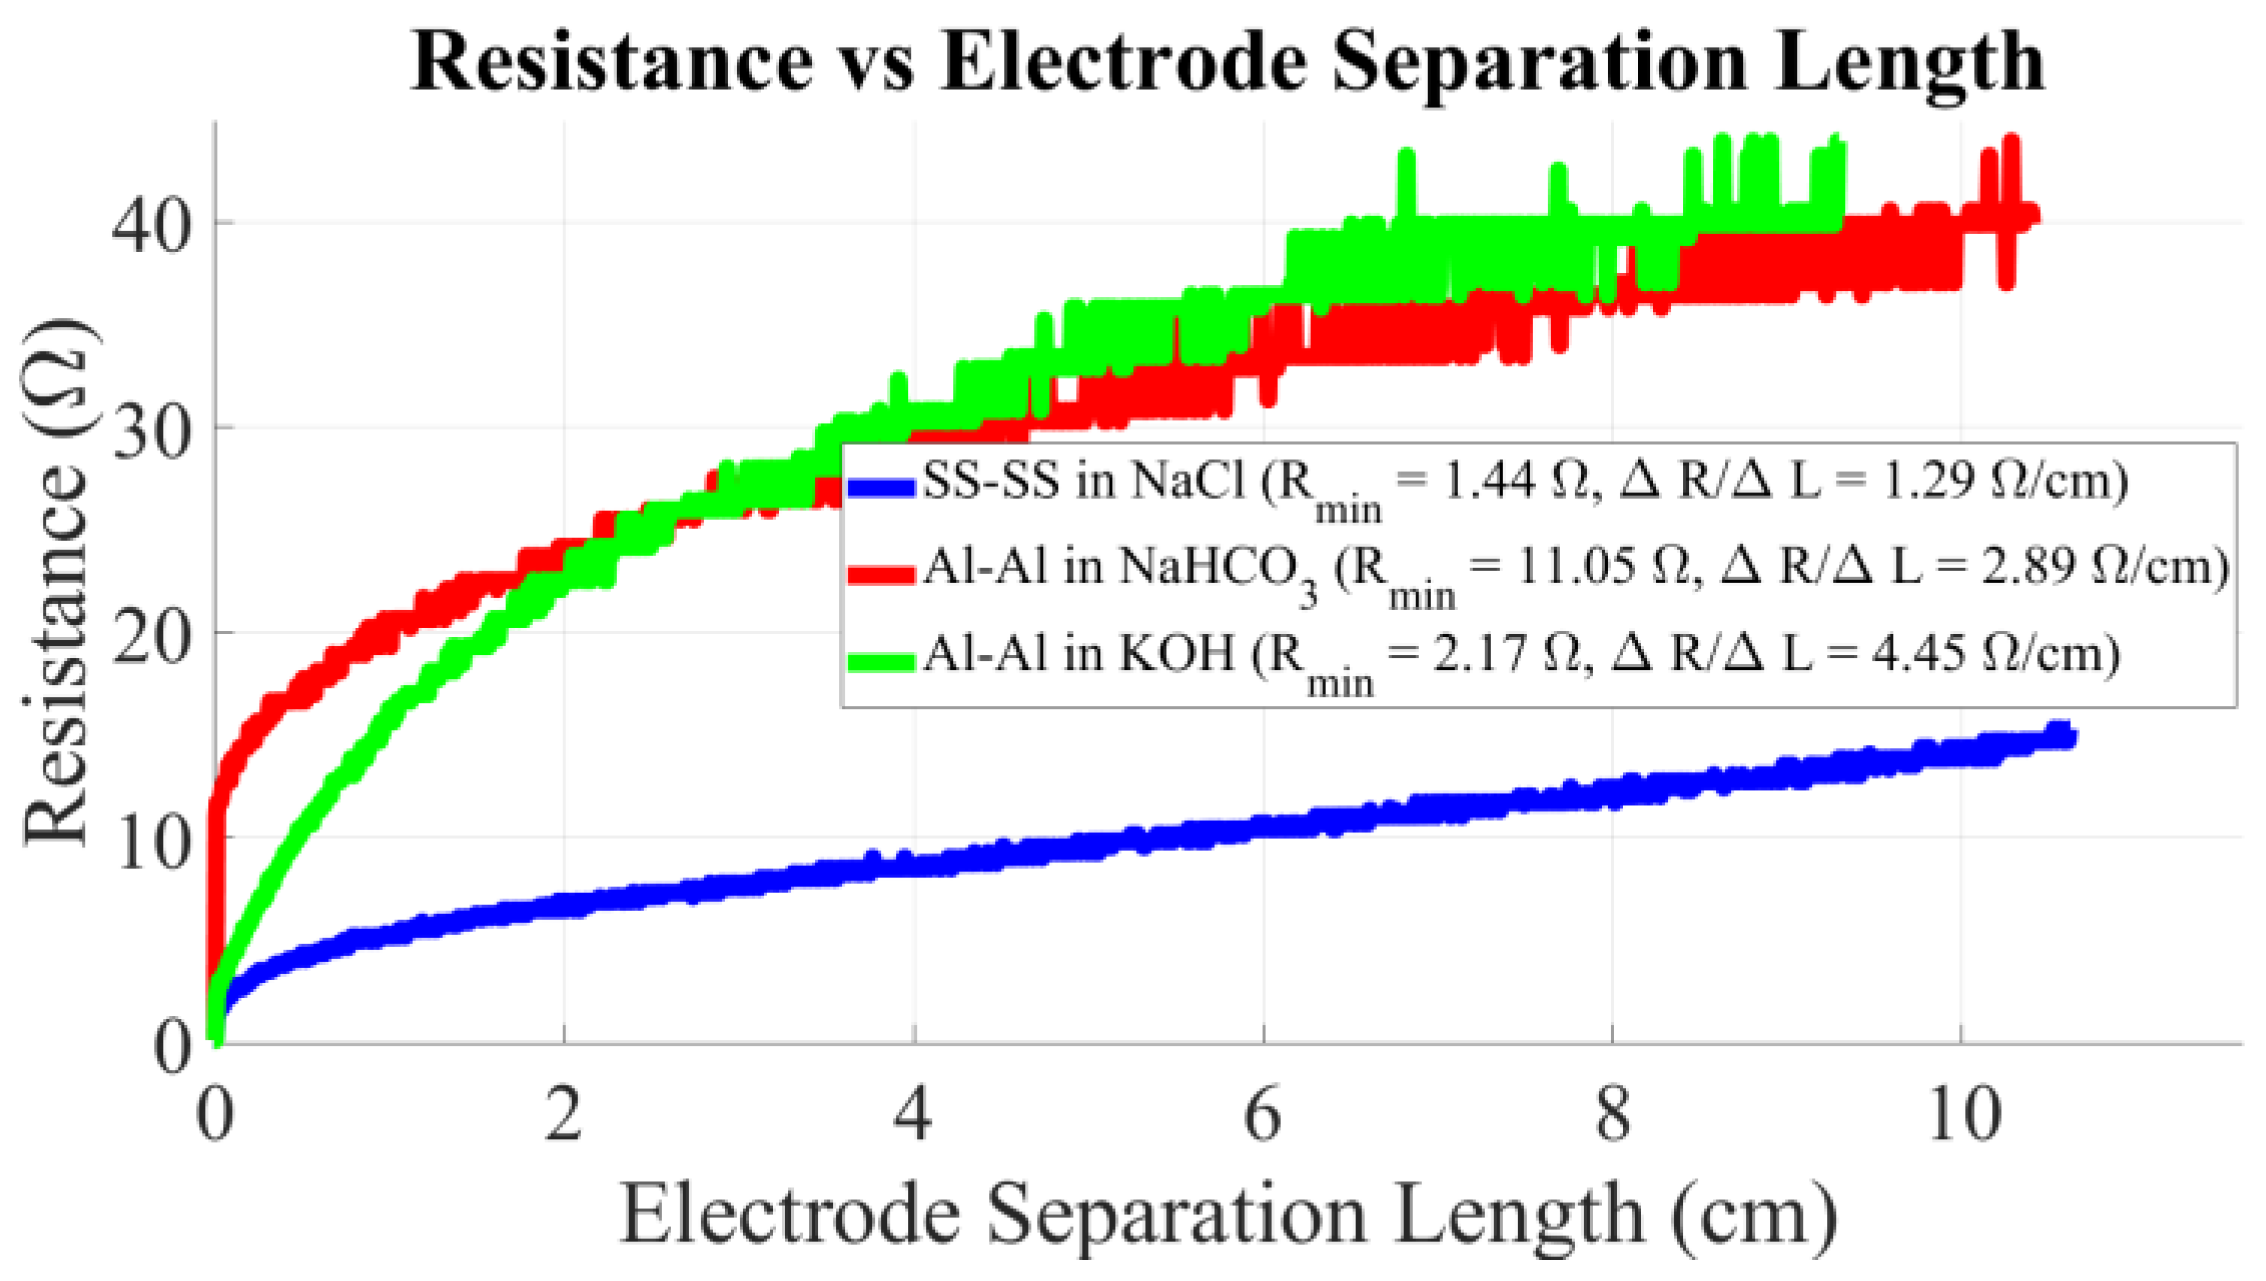
Varying length tests characterized the resistance–separation profile using tap water at 1500 mL and 10 g solute. All configurations exhibited a minimum resistance spike (RMIN) upon electrode separation, followed by a linear resistance increase with distance, as shown in Figure 4. The primary criterion was achieving the highest RMIN to instantly exceed the required threshold (Rneeded), with control sensitivity (ΔR/ΔL) becoming secondary when RMINRneeded (governing only post-extinction resistance growth) but critical when RMIN < Rneeded.
The evaluation revealed a clear trade-off: high conductivity electrolytes (NaCl, KOH) produced very low RMIN, making them unsuitable for instant extinction despite high ΔR/ΔL. The critical finding was in NaHCO3, where Al ↔ Al yielded RMIN = 11.05 Ω (Figure 4). Table 1 ranks the performance accounting for stability (metal reactivity, resistance oscillations) beyond just RMIN and ΔR/ΔL. Selection prioritizes chemical resilience using SS, B, Cu, and ZS [9]. All Al configurations were excluded despite having the highest electrical performance: Al’s low melting point [9] renders it unsuitable for thermal stress, and in KOH, Al reacts vigorously, forming oxidation layers that alter conductivity. Figure 4 shows Al curves oscillating uncontrollably, rendering the system impractical.

3.2.2. Varying Immersion Depth

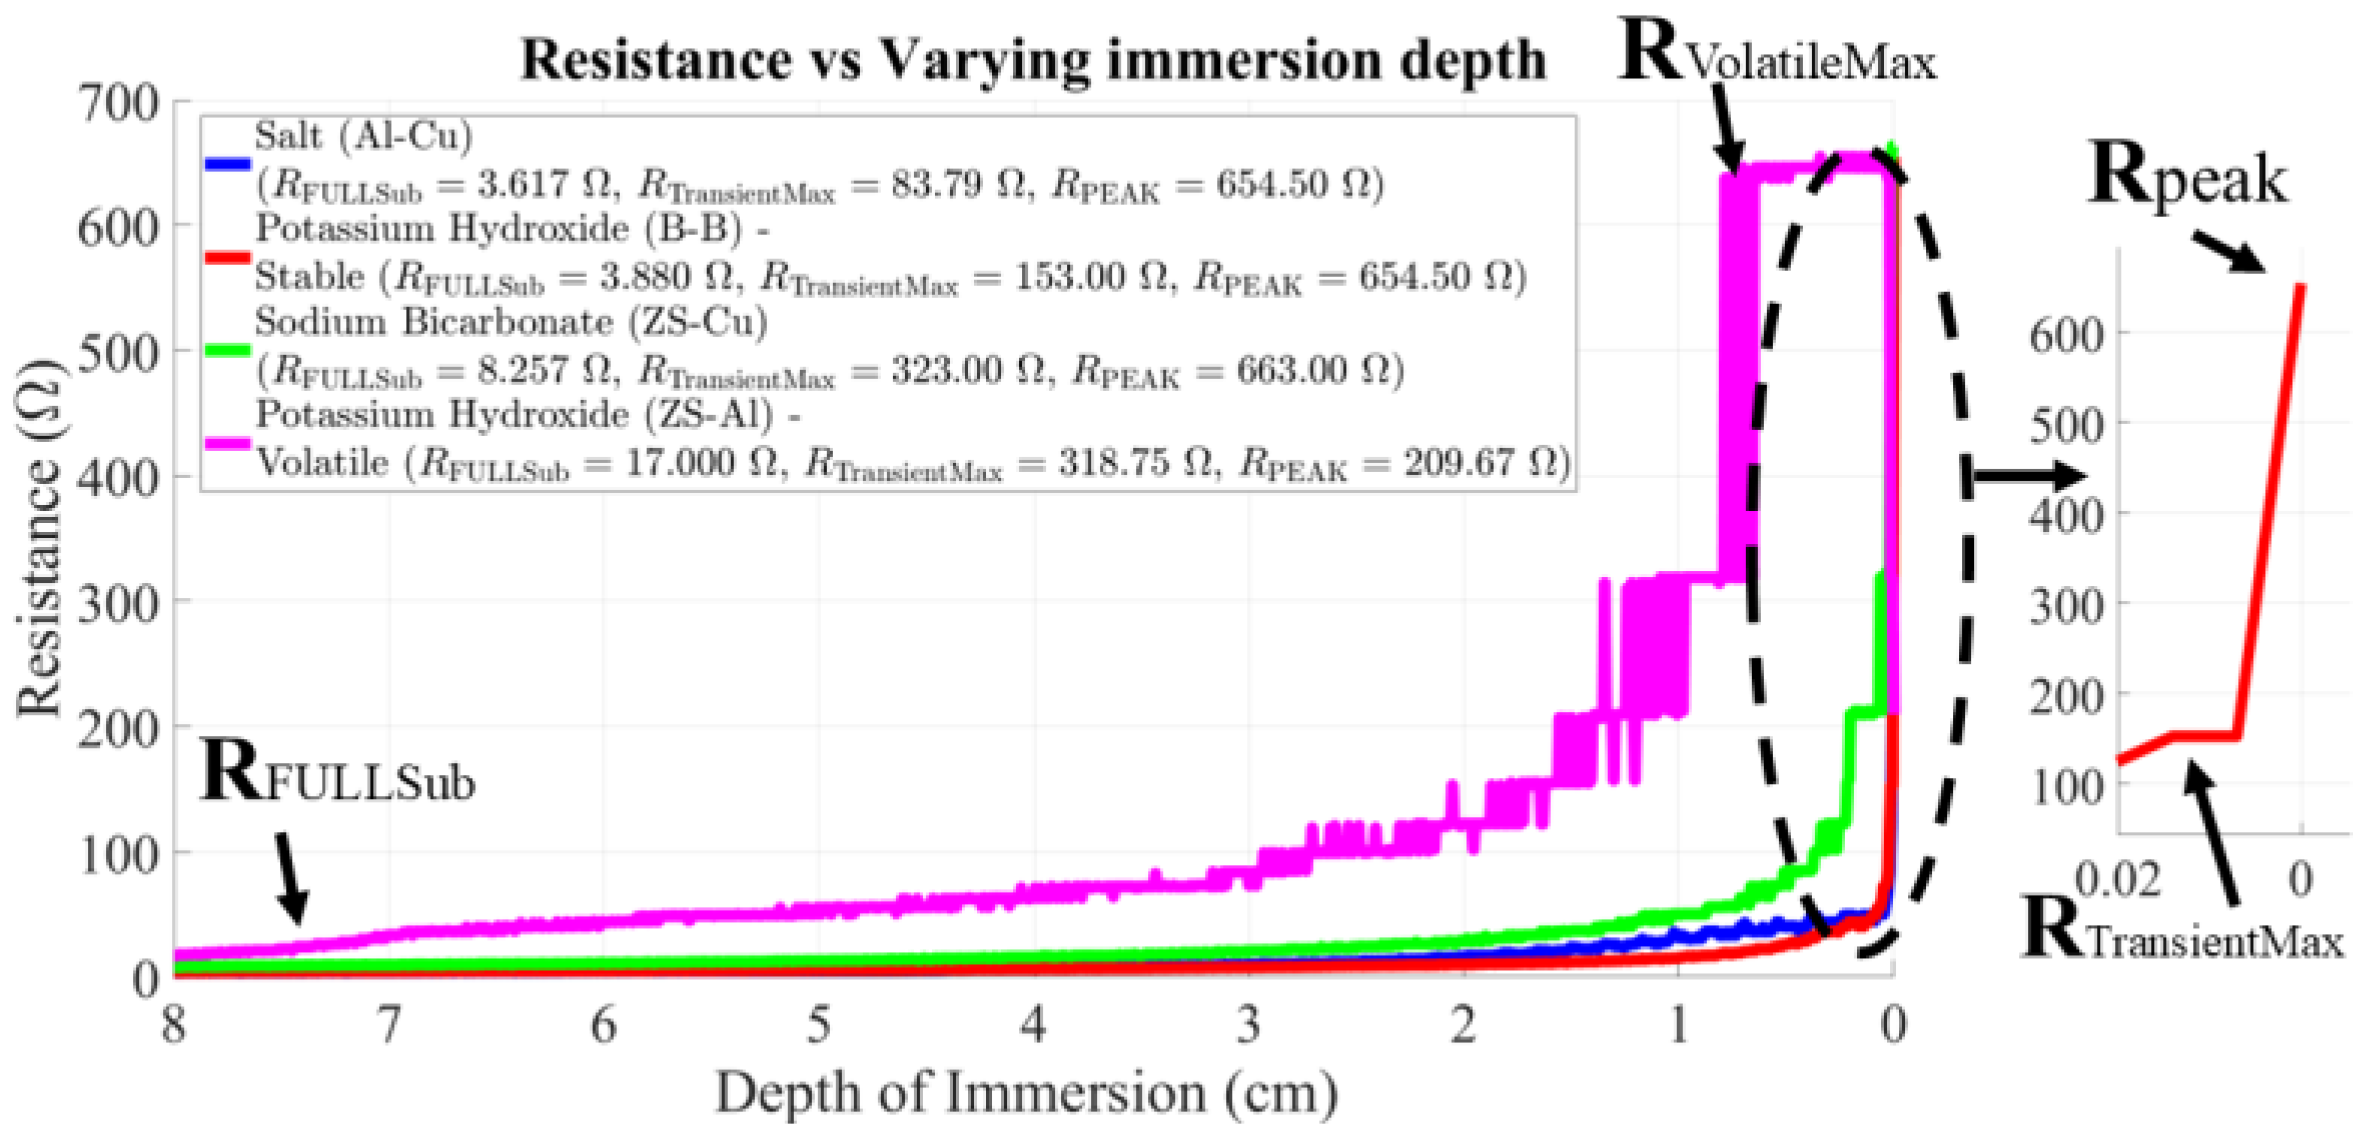
The variable depth test evaluates the performance during current interruption by maintaining constant electrode separation (1 cm) while withdrawing electrodes (decreasing D). This follows a hyperbolic relationship (R ∝ 1/Area), rendering linear sensitivity (ΔR/ΔD) unsuitable. Control is assessed via the non-linear resistance profile with key events highlighted in Figure 5, showing the RFULLSub (stable minimum at maximum depth), RPEAK (temporary high resistance at surface contact), RTransientMax (highest stable sustained resistance), and RVolatileMax (absolute maximum during unstable spikes).
The primary performance metric is the dynamic range factor established using DRF = RTransientMax/RFULLSub, with stability quantified by the volatility extreme (RVolatileMaxRTransientMax). The results reveal an inherent trade-off: high DRF systems typically exhibit reduced stability. Figure 5 shows that optimal configurations maximize DRF while preserving stability and highlights the marked instability of the ZS ↔ Al pair in KOH (pink graph) despite its high resistance capacity. This framework defines the system control range via DRF and assesses the resistance to volatile spiking. For NaHCO3, ZS ↔ Cu achieved optimal performance with the highest DRF (39.10) and maximum stability (Table 2, Figure 5), outperforming B ↔ Cu (DRF = 38.63), which showed lower stability. In KOH, B ↔ B proved optimal, combining top stability with strong DRF (37.59). For NaCl, Al ↔ Cu achieved the highest DRF (23.15) with high stability, which is remarkable given aluminium pairs’ typical instability.

3.2.3. Concentration Measurement Results and Chemical Composition Analysis

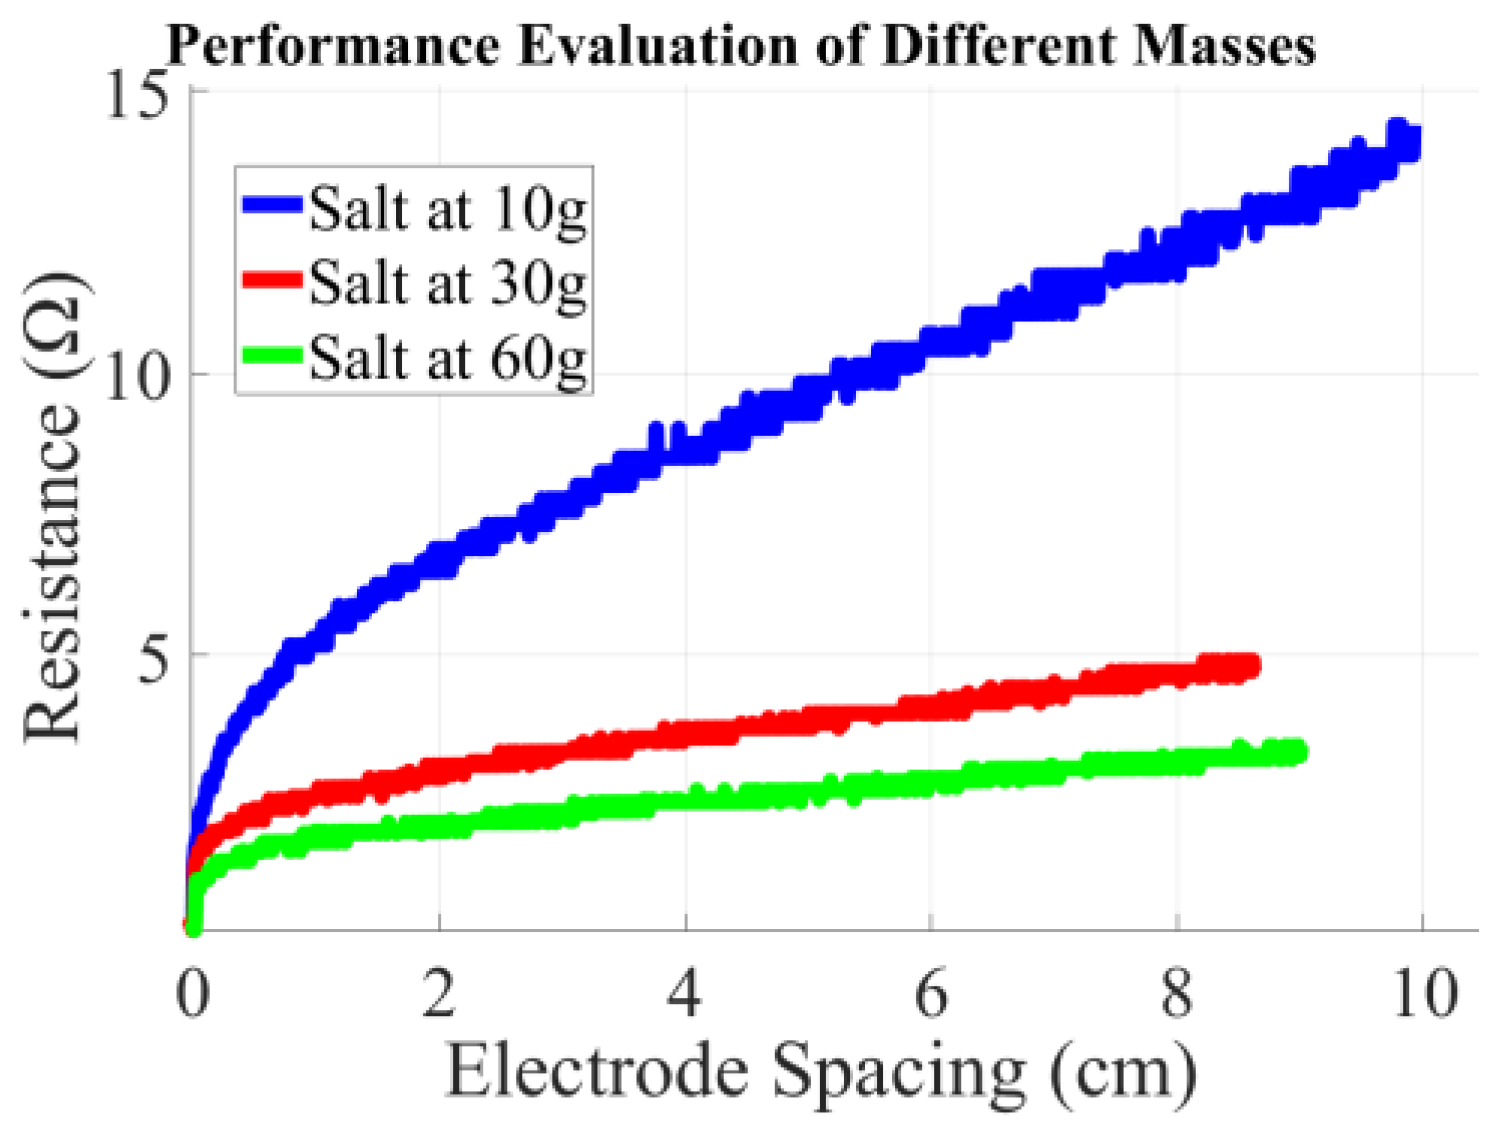
Electrolyte concentration governs the rheostat’s electrical behaviour and was evaluated using 1500 mL of tap water with solute masses of 10 g, 30 g, and 60 g. As shown in Figure 6, NaCl exhibits an inverse relationship between solute mass and resistance, with the 10 g solution producing the highest resistance and the 60 g solution the lowest due to increased ionic concentration and mobility.
KOH presents low baseline resistivity due to complete dissociation and high OH− ion mobility [10], yielding low RMIN under full immersion. NaHCO3, a weaker electrolyte with less mobile HCO3 ions, exhibits higher resistivity enabling faster attainment of Rneeded during withdrawal. Arc extinction is further governed by localized electrolysis and gas evolution at the electrode–electrolyte interface, where increased current density promotes insulating gas bubbles (H2, O2, CO2), producing resistance peaks, particularly at 10 g. This concentration provides balance for reliable transition to high-resistance and required DRF for effective DC arc quenching without thermal instability of more concentrated systems.

4. Model Validation and Extinction Assessment

This section details the proposal of the unified piecewise resistance model as the definitive predictive tool for the liquid rheostat.

4.1. Unified Piecewise Resistance Model (RTOTAL)

The total resistance of the liquid rheostat is modelled in Equation (3).
R _ T O T A L =     R P E A K S T . D   ( Transient   Phase )   for   0 D D T K / D   ( Hyperbolic )   for   D T < D D M A X
Geometric factor (K = ρ·L/W) defines the resistance capability based on fluid properties and geometry, with W being the width of the electrode. The empirical geometric factor (Kexp = RFULLSub DMAX) calibrates the model to measured conditions, while ST defines the transient slope near the electrolyte surface. Total resistance, RTOTAL, depends on immersion depth (D), separation length (L), and concentration (C). Decreasing D reduces the submerged area, producing a sharp resistance rise in the hyperbolic stable range (DT < DDMAX), then switching to a transient phase near the surface (0 ≤ DDT) to capture spikes; full withdrawal must exceed Rneeded for extinction. Separation L scales resistance linearly (R ∝ L), while concentration C controls resistivity ρ; higher ρ at 10 g raises RFULLSub and maximizes DRF for enhanced current control.

4.2. Load Line Analysis and Extinction Assessment

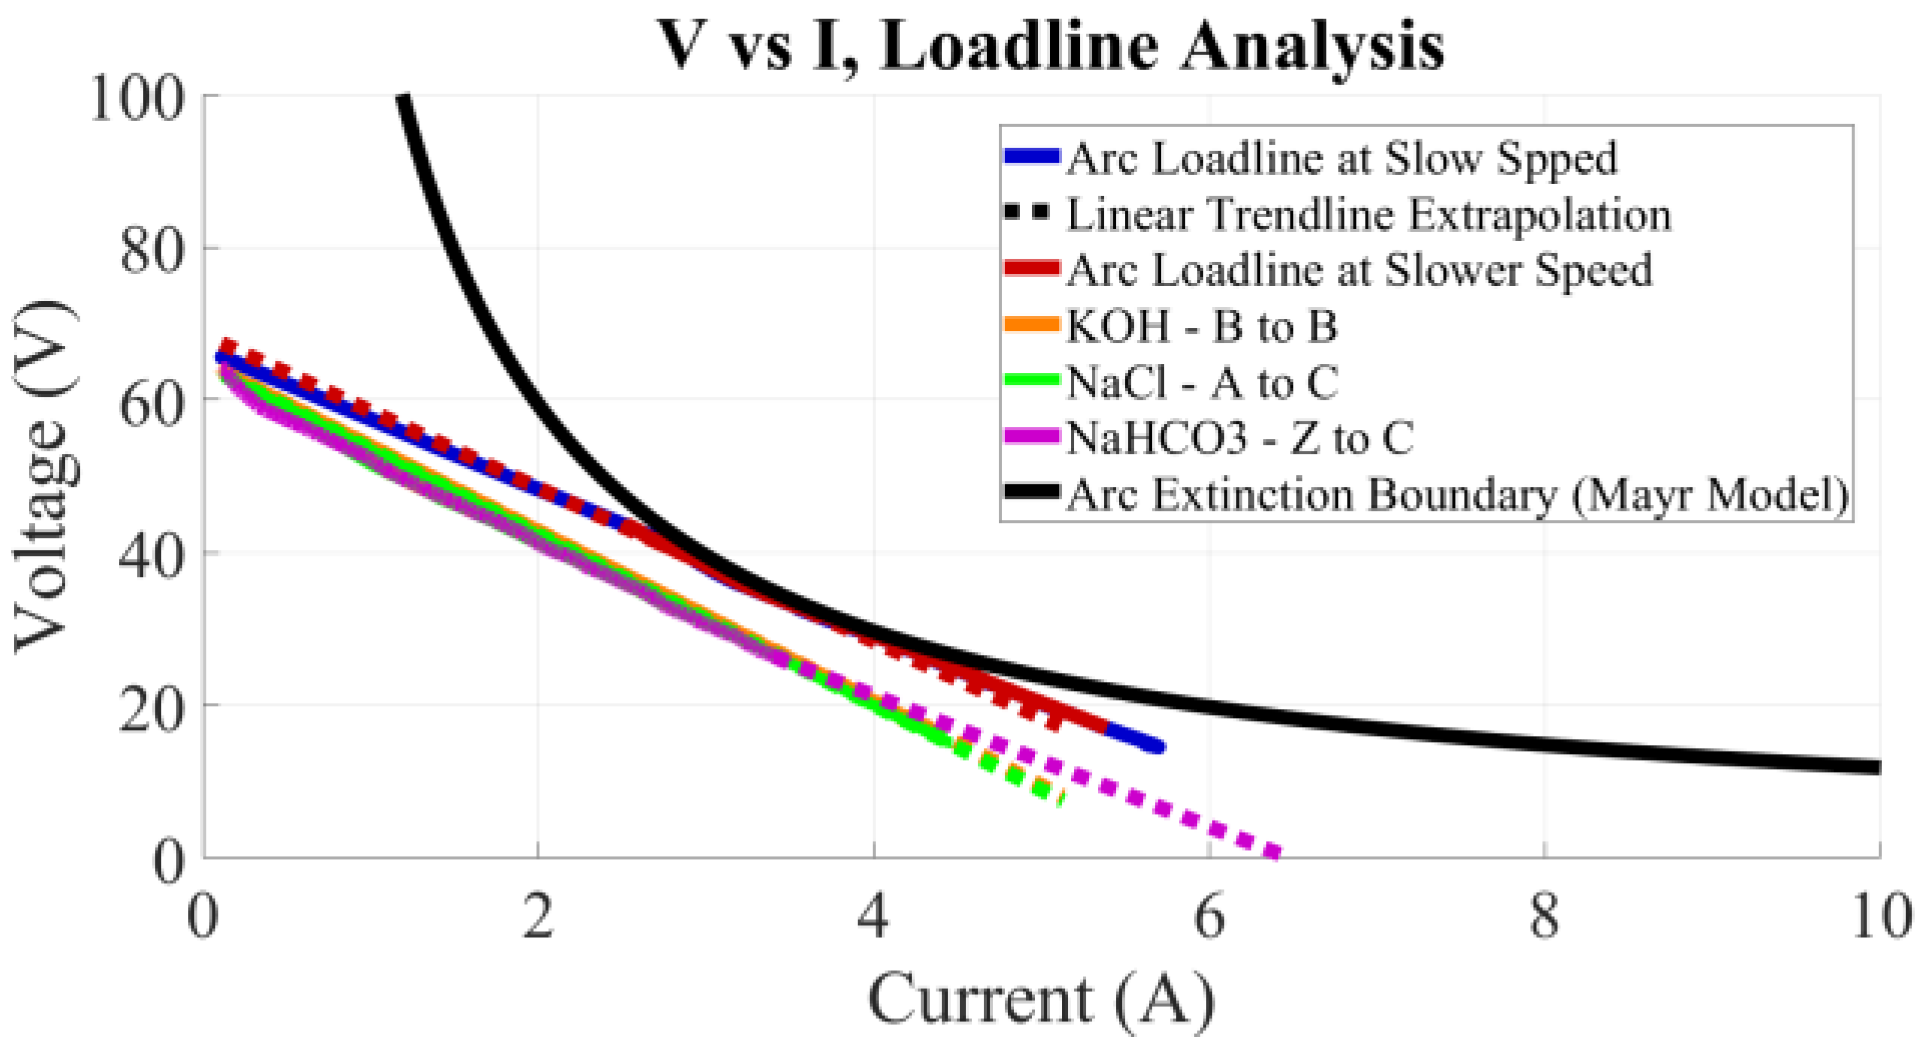
The liquid rheostat’s arc suppression capability is validated through the load line analysis in Figure 7, comparing operational characteristics against the theoretical arc extinction boundary from the static Mayr model. Load lines for all three optimal electrolyte configurations, KOH (B ↔ B), NaCl (Al ↔ Cu), and NaHCO3 (ZS ↔ Cu), do not intersect the arc extinction boundary, confirming sufficient resistance injection to suppress arcs across all tested ranges. Close overlap between load lines at different actuator speeds verifies time-independence, justifying the static Mayr model and unified piecewise resistance model.

5. System Scaling and Parameter Adjustment

Scaling to 5 kW requires translating the laboratory resistance behaviour to a higher power whilst preserving the arc-extinction capability. The unified piecewise resistance model and geometric-factor relation guide this process. For a 5 kW system, the required equivalent resistance is Req = V2sys/Ptarget, showing that system voltage directly dictates sizing. The hyperbolic region (R = K/D) provides stable control at D > DT, where electrode separation L, width W, and electrolyte resistivity ρ are tuned so KReqDop, ensuring arc power Pin = VI remains below the Mayr threshold P0. A higher system voltage steepens the VI load line leftwards, lowering currents and increasing margin from the arc-sustain boundary. Low-voltage operation at 5 kW forces higher currents, reducing extinction reliability. Practical deployment requires increased electrode separation L or higher-resistivity electrolyte, favouring modular tank architecture with stages in series. The scaled system comprises a compact enclosed electrolyte vessel with vertically actuated electrodes, integrated cooling, and immersion-depth control.

6. Conclusions

This work validated a liquid-based rheostat for DC arc fault mitigation in PV systems using resistance injection and VI load line shifting. The ZS ↔ Cu pair in NaHCO3 achieved the highest performance with a DRF of 39.10, while maximum RMIN was confirmed as the governing extinction criterion and a 10 g solute concentration maximized dynamic range. The unified piecewise resistance and load line analysis showed non-intersection with the Mayr extinction boundary, ensuring suppression. Scaling to 5 kW at 250 VDC requires 200 mm × 50 mm electrodes and increased electrolyte volume, with a modular, vertically actuated, immersion-controlled tank design recommended for practical deployment.

Author Contributions

Conceptualization, J.B.; methodology, K.N. and T.M.; validation, K.N. and T.M.; formal analysis, K.N. and T.M.; investigation, K.N. and T.M.; resources, J.B., K.N. and T.M.; writing—original draft preparation, K.N. and T.M.; writing—review and editing, K.N., T.M. and J.B.; visualization, K.N. and T.M.; supervision, J.B. All authors have read and agreed to the published version of the manuscript.

Funding

This research received no external funding.

Institutional Review Board Statement

Not applicable.

Informed Consent Statement

Not applicable.

Data Availability Statement

Data available upon request.

Acknowledgments

The authors would like to acknowledge the technicians and management of the University of the Witwatersrand, Genmin Lab for their generous supply of materials and expert assistance in the construction of the equipment.

Conflicts of Interest

The authors declare no conflicts of interest.

References

  1. Lu, S.; Phung, B.T.; Zhang, D. A comprehensive review on DC arc faults and their diagnosis methods in photovoltaic systems. Renew. Sustain. Energy Rev. 2018, 89, 88–98. [Google Scholar] [CrossRef]
  2. Andrea, J.; Besdel, P.; Zirn, O.; Bournat, M. The electric arc as a circuit component. In Proceedings of the 41st Annual Conference of the IEEE Industrial Electronics Society (IECON), Yokohama, Japan, 9–12 November 2015; pp. 3027–3034. [Google Scholar]
  3. Haase, R.; Berger, F. Simulation of relay contact bouncing including a short arc model. In Proceedings of the 60th Annual Holm Conference on Electrical Contacts (HOLM), New Orleans, LA, USA, 12–15 October 2014. [Google Scholar]
  4. Xie, M.; Zhang, X.; Dong, Y.; Li, W. Arc fault detection for DC solid state power controllers. In Proceedings of the 2014 IEEE Transportation Electrification Conference and Expo, Asia-Pacific (ITEC Asia-Pacific), Beijing, China, 31 August–3 September 2014; pp. 1–6. [Google Scholar]
  5. Andrea, J.; Zirn, O.; Bournat, M. Principle of Arc Fault Detection for Solid State Power Controller. In Proceedings of the 2012 IEEE 58th Holm Conference on Electrical Contacts (HOLM), Portland, OR, USA, 23–26 September 2012. [Google Scholar]
  6. Wilson, W. Some notes, on the design of liquid rheostats. J. Inst. Electr. Eng. 1922, 60, 196–211. [Google Scholar] [CrossRef]
  7. Elliott, R.L. A Water Rheostat for Shipyard Use. In Proceedings of the 1981 Annual Meeting Industry Applications Society, Cincinnati, OH, USA, 5–9 October 1981; pp. 343–347. [Google Scholar]
  8. Jalil, M.; Samet, H.; Ghanbari, T.; Tajdinian, M. An Enhanced Cassie–Mayr Based Approach for DC series Arc Modeling in PV Systems. IEEE Trans. Instrum. Meas. 2021, 70, 9005710. [Google Scholar] [CrossRef]
  9. Uniweld Products, Inc. Melting Point Chart. Available online: https://www.uniweld.com/resources/safety/melting-point-chart/ (accessed on 2 November 2025).
  10. Marx, D.; Chandra, A.; Tuckerman, M.E. Aqueous Basic Solutions: Hydroxide Solvation, Structural Diffusion, and Comparison to the Hydrated Proton. Chem. Rev. 2010, 110, 2174–2216. [Google Scholar] [CrossRef] [PubMed]
Figure 1. Preliminary arc results in air. The stability of the V–I characteristics confirm the applicability of the Mayr model in the steady-state region.
Engproc 140 00026 g001
Figure 2. Comparative current analysis across three different actuator speeds. The convergence of data points demonstrates the time independence of the arc characteristic.
Engproc 140 00026 g002
Figure 3. Electrical Setup for Liquid Rheostat and Resistance Tests.
Engproc 140 00026 g003
Figure 4. Comparative Resistance vs. Length for configurations from each electrolyte (KOH, NaCl, NaHCO3), illustrating the differences in Control Sensitivity (ΔR/ΔL) and the critical RMIN value.
Engproc 140 00026 g004
Figure 5. Comparative analysis of resistance vs. varying immersion depth. Rheostat control and stability across multi-electrolyte systems, with key events highlighted.
Engproc 140 00026 g005
Figure 6. Evaluation of Dynamic Resistance vs. Electrode Spacing for Varying Salt (NaCl) Concentrations, illustrating the inverse relationship between solute mass and system resistance.
Engproc 140 00026 g006
Figure 7. V vs. I load line analysis: Comparison of liquid rheostat operating load lines against the Mayr model. The non-intersection confirms reliable arc suppression.
Engproc 140 00026 g007
Table 1. Top three stable electrode systems by electrolyte (Varying Length Test).
ElectrolyteElectrode PairSensitivity (ΔR/ΔL) (Ω/cm)RMIN (Ω)
NaHCO3Cu ↔ B
B ↔ B
SS ↔ Cu
2.30
2.29
2.21
5.18
2.60
2.77
KOHZS ↔ B
SS ↔ ZS
ZS↔ ZS
2.06
1.88
1.87
5.18
6.49
7.32
NaClSS ↔ SS
SS ↔ B
Cu ↔ Cu
1.29
1.20
1.17
1.44
1.66
1.26
Table 2. Top Three Electrode Systems from the Varying Immersion Depth Test.
ElectrolyteElectrode PairDRFStability Rating
NaHCO3ZS ↔ Cu
B ↔ Cu
B ↔ ZS
39.10
38.63
24.25
Maximum
Very High
High
KOHB ↔ B
Cu ↔ Cu
B ↔ Cu
37.59
25.79
13.46
Most Stable
Very High
High
NaClAl ↔ Cu
Cu ↔ ZS
Al ↔ SS
23.15
21.60
15.24
High
High
High
Disclaimer/Publisher’s Note: The statements, opinions and data contained in all publications are solely those of the individual author(s) and contributor(s) and not of MDPI and/or the editor(s). MDPI and/or the editor(s) disclaim responsibility for any injury to people or property resulting from any ideas, methods, instructions or products referred to in the content.