1. Introduction
Recently, extreme rainfall events triggered by global climate change have made flooding one of the major disaster risks for Taiwan and its neighboring countries. Historically, heavy rainfall events often featured short, high-intensity characteristics, but in recent years, there has been a noticeable increase in continuous torrential rain events, which not only heighten the uncertainty of rainfall but also present unprecedented challenges to existing drainage and flood control systems. This phenomenon highlights the importance of community-level vulnerability and the ability to respond autonomously in the face of disasters.
From the end of July to early August 2025, southern Taiwan was affected by a low-pressure system and southwest air currents, causing record-breaking rainfall in many areas, including Chiayi, Tainan, and Kaohsiung, resulting in severe flooding. In Tainan’s Cigu and Yongkang districts, the water depth increased, leading to situations such as drainage facilities overflowing. The accumulated rainfall in the Gaoping mountain area exceeded 2000 mm, causing road disruptions and isolating communities. This event reflects that the impact of extreme flooding is no longer limited to engineering solutions, but extends to people’s daily lives, public safety, and social operations.
In contrast, in August of the same year, the Kumamoto region in Japan was impacted by heavy rainfall carried by atmospheric rivers, with rainfall surpassing observation records, leading to widespread flooding, river overflow, and landslides. Post-disaster investigations indicated that residents lacked awareness of the risks of flooding in underground spaces, which became one of the important factors contributing to disaster-related injuries. This case shows that, in addition to engineering flood prevention measures, residents’ risk perception and disaster preparedness attitudes are also crucial non-engineering factors in determining the outcomes of disasters.
The cases show that the characteristics of flooding under extreme climate events have become more frequent, intense, and uncertain. Relying solely on government engineering measures is no longer sufficient to comprehensively reduce risks. In contrast, the importance of people-centered disaster prevention strategies, such as enhancing residents’ risk perception, promoting community disaster prevention education participation, and shaping positive disaster preparedness attitudes, has gradually increased.
Therefore, in this study, we analyzed the risk perception and disaster preparedness attitudes of Taiwanese community residents and explored whether disaster prevention education promotes their behavioral intentions, serving as an important foundation for the future promotion of self-reliant disaster-prevention communities and improvement of disaster prevention policies.
We surveyed Taiwanese community residents, collecting data through an online questionnaire to analyze the relationship between residents’ risk perception, participation in self-reliant flood prevention activities, and disaster preparedness attitudes. We examined the mediating role of disaster prevention education. Through a literature review, research framework, questionnaire design, data collection, and statistical analysis, the results clarify how disaster prevention education can transform residents’ risk awareness into concrete disaster prevention actions and explore its impact on community protective capacity and the establishment of a disaster prevention culture. The results also provide references for promoting self-reliant disaster-prevention communities, disaster prevention education practices, and subsequent policy-making.
2. Literature Review
2.1. Definition of Disaster
International disaster databases and related organizations commonly define disasters as events triggered by natural or human factors under specific time and spatial conditions, which cause significant harm to life safety, property, the environment, and socio-economic systems. These impacts exceed the capacity of the affected community’s own response and recovery abilities, requiring external resources for assistance [
1]. In Taiwan, disasters are also categorized into two main types: natural disasters and man-made disasters, with an emphasis on their deep impact on public safety and social operations [
2].
From an academic perspective, disasters cause direct or indirect harm to human life, property, and the environment. The sources of disasters are classified into natural environmental disasters and human-made environmental disasters [
3]. Additionally, disasters are often accompanied by sudden environmental changes, disrupting social order, endangering physical and mental health, and causing significant losses [
4]. The scale of a disaster is not solely determined by the natural event [
5]. The extent of its impact depends on the response capacity and coping strategies of the affected individuals or communities. Therefore, raising public awareness of disaster prevention and education has been regarded as a critical prerequisite for reducing disaster risk and implementing preventive measures.
2.2. Disaster Prevention Education
According to Article 22 of the Disaster Prevention and Protection Act of Taiwan, all levels of government are required to promote education, training, and advocacy measures related to disaster reduction during normal times [
2]. The Disaster Education White Paper issued by the Ministry of Education centers on a safety culture and presents principles such as priority on prevention, pursuit of sustainability, strengthening proactive safety culture, and moving towards zero disaster to enhance national disaster prevention knowledge and strengthen the overall disaster resilience of society.
From an academic perspective, the functions of disaster prevention education can be divided into three aspects: pre-disaster capacity building, correct responses during disasters, and damage reduction after disasters [
6]. Disaster prevention education not only helps residents understand disaster risks but also, through the transmission of knowledge, skills, and attitudes, allows them to take more appropriate actions in response. Therefore, we took disaster prevention education as a key interface that transforms residents’ risk awareness into concrete actions, and further quantitatively explores its relationship with disaster preparedness attitudes.
2.3. Definition of Disaster Preparedness Attitude
Attitude is generally regarded as an individual’s relatively stable psychological tendency toward a specific object, based on cognitive and affective components, which significantly influences behavior [
7,
8].
In the context of safety and disaster prevention, negative attitudes and improper habits are recognized as significant contributors to accidents. Conversely, positive behavioral beliefs and proactive safety attitudes play a crucial role in reducing accident incidence. Previous studies suggest that a sound safety attitude encompasses the following beliefs: most accidents are preventable; prevention must be based on knowledge; accidents impose high social and economic costs; self-monitoring and rapid response capabilities are essential; health and safety are interdependent; and collective efforts are necessary for effective disaster prevention [
9,
10].
For disaster prevention, these insights highlight the importance of cultivating safety-oriented mindsets alongside technical measures. A comprehensive approach requires structural, engineering safeguards, and behavioral interventions that reinforce awareness, responsibility, and collaboration. By integrating knowledge-based prevention strategies with positive safety attitudes, communities and organizations can strengthen resilience and minimize risks associated with disasters. The Ministry of Education views disaster preparedness attitude as a comprehensive concept that includes concern for those affected by disasters, active participation in issues, resilience values, and a willingness to take action.
Reference [
11] emphasizes three main aspects: concern for and awareness of disasters, correct beliefs and values regarding disaster prevention and response, and a sense of responsibility and tendency to engage in proactive actions. Therefore, we operationalize disaster preparedness attitude in three dimensions in this study: (1) concern and awareness of disasters, (2) correct beliefs and sense of responsibility, and (3) participation and preparedness behavior tendencies, for subsequent quantitative analysis.
2.4. Disaster Prevention Knowledge and Skills
According to social cognitive theory, knowledge is the foundation for behavior change. Individuals can only initiate and sustain new behavior patterns once they possess relevant knowledge. However, knowledge alone is not a sufficient condition for immediate behavior change [
12,
13]. Disaster prevention knowledge primarily includes understanding disaster types and characteristics, the potential degree of harm, and possible preventive and response actions [
11].
Disaster prevention skills refer to observable abilities such as pre-disaster preparation, in-disaster response, and post-disaster recovery. The proficiency of these skills is measured by the accuracy of actions and the quality of execution [
14]. Research has pointed out that skill training, along with attitudes and knowledge, is equally important and constitutes the three key elements of effective disaster prevention education [
11]. Overall, knowledge provides the theoretical basis, while skills ensure the behavioral ability. They complement each other so that disaster preparedness attitudes can be translated into actions to enhance the overall protective capacity of the community.
2.5. Risk Perception
Risk perception refers to an individual’s subjective assessment of potential hazards or loss situations, which influences their judgment and response behaviors [
15]. Its formation is influenced by multiple factors, including the level of knowledge, personal experience, values, the severity of events, and feelings of autonomy and control. Disaster experiences enhance an individual’s sensitivity to nearby hazards and the likelihood of future occurrences, thus promoting preparedness behaviors [
16].
In addition to the cognitive aspects, emotions are an important component of risk perception. Negative emotions such as worry and fear provide quick judgment cues in the face of uncertainty and intervene in the attitude formation process [
17]. Effective risk communication is required to improve an individual’s understanding of the likelihood of occurrence and the severity of consequences of a hazard [
18]. There is a bidirectional relationship between worry and risk perception: higher levels of worry promote preparedness behaviors, and after preparedness behaviors accumulate, worry may decrease [
19].
Both direct experience (personal experience of a disaster) and indirect experience (media or disaster prevention education) enhance risk perception, with the effect being particularly significant for those who have not personally experienced a disaster [
20,
21]. Recently, Taiwan’s promotion of disaster prevention education and community empowerment has increased residents’ awareness of evacuation sites, disaster prevention maps, and community resources, thereby strengthening their risk perception and response capabilities.
Risk perception is the result of the combined effects of cognition and emotion. These two factors interact to influence an individual’s evaluation, attitudes, and preparedness behaviors, forming the core foundation of their action tendencies when facing a disaster.
3. Research Method
3.1. Research Structure
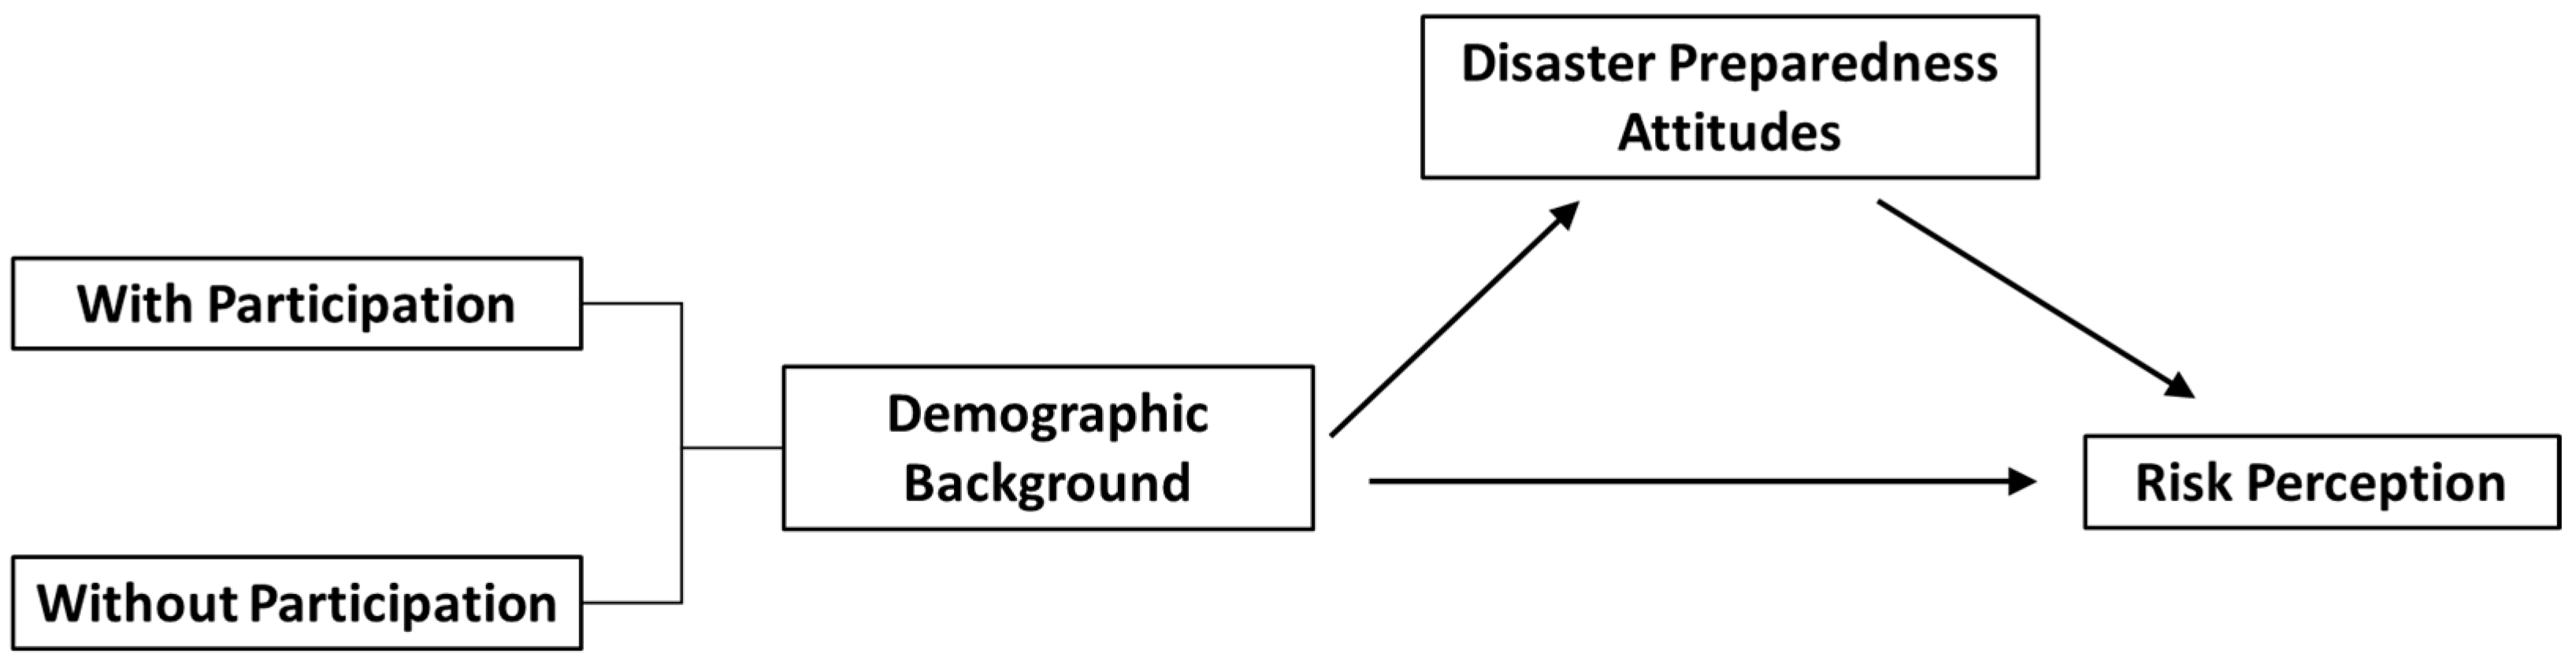
We explored the impact of participation in self-reliant flood disaster prevention education on residents’ risk perception and disaster preparedness attitudes. Demographic characteristics of the residents (gender, age, occupation, educational level, years of residence in the community, marital status, whether they have children, place of residence, etc.) were included as control or grouping variables to assess their impact on the two outcome variables. The research framework is shown in
Figure 1, with arrows representing the hypothesized directional paths, including: (1) demographic background → disaster preparedness attitudes/risk perception; (2) disaster preparedness attitudes → potential association with risk perception. This framework was used to examine the sources of cognitive and attitudinal differences among community residents and their potential interactive relationships.
3.2. Research Subjects and Questionnaire
We adopted a quantitative cross-sectional research design and an online questionnaire for data collection. The target population was residents across Taiwan, with a convenience sampling method employed. The questionnaire was administered from March 7 to 16, 2024, yielding a total of 205 valid responses. All participants voluntarily and anonymously completed the questionnaire after reading the research instructions, ensuring the study’s ethical standards and data quality.
The questionnaire consisted of the following parts.
Personal information: This section includes demographic background data, as outlined in
Table 1.
Participation experience in self-reliant flood disaster prevention education: This section is included to understand whether the participants have been involved in related disaster prevention activities, with the relevant items shown in
Table 2.
Disaster preparedness attitude scale: This section is included to assess the participants’ attitudes across various dimensions, including concern for disasters, beliefs and responsibilities, and intention to take action. The items are presented in
Table 3.
Except for nominal and ordinal variables, items were socred on a five-point Likert scale (1 = Strongly disagree, 5 = Strongly agree) to reflect the differences in participants’ levels of agreement.
3.3. Survey
We distributed the questionnaire through online convenience sampling. The participants read the research objectives, data usage methods, and ethical statements before expressing their consent to proceed with the questionnaire. After the questionnaire responses were collected, data cleaning was conducted, including the removal of duplicate responses and the examination of extreme or unreasonable answers. The data were subjected to subsequent statistical analysis procedures. All data processing was carried out in accordance with research ethics guidelines.
3.4. Data Analysis
Statistical Package for the Social Sciences software (Version 31.0.0) was used for data processing and analysis as follows.
Data preprocessing: This included removing invalid samples, standardizing variable coding, and examining missing values and normal distribution.
Descriptive statistical analysis: Nominal and ordinal variables were presented using frequency and percentage to describe their distribution. For interval variables, the mean (M) and standard deviation (SD) were used to provide statistical descriptions of their central tendency and dispersion.
Reliability analysis: Cronbach’s α was calculated for multi-item constructs to test the internal consistency of the scale. A Cronbach’s α value of ≥0.7 is considered acceptable reliability, while that of ≥0.8 indicates good reliability. The analysis results report the number of items for each construct and their corresponding Cronbach’s α values.
Inferential statistical analysis: Independent sample t-tests and one-way analysis of variance (ANOVA) were conducted to examine differences in risk perception and disaster preparedness attitudes among participants with different demographic backgrounds (gender, age, occupation, educational level, years of residence in the community, marital status, whether they have children, place of residence) and participation in self-reliant flood disaster prevention education. Before conducting t-tests, Levene’s test was used to check for equality of variances. If ANOVA results were significant, post hoc comparisons were conducted using Tukey or Games-Howell based on the assumption of homogeneity of variances to ensure the appropriateness of the statistical inferences.
Statistical testing standards: We used two-tailed tests with a significance level of α = 0.05. In addition to reporting p-values, effect size indicators (Cohen’s d for t-tests and η2 for ANOVA) were calculated at a 95% confidence interval to enhance the interpretability of the results and the completeness of the research inferences.
4. Results and Discussion
The online questionnaire survey was conducted from 7 to 16 March 2024, with a total of 205 valid responses collected, resulting in a 100% valid response rate. The results showed the descriptive statistics of the sample structure, scale reliability testing (Cronbach’s α), and inferential statistical results regarding group differences in the levels of participation in disaster prevention education, risk perception, and disaster preparedness attitudes.
4.1. Analysis of Resident Data
The majority of the participants were male (72.2%). The age distribution was concentrated in the 20–39 year-old group, with 31.7% aged 20–29 years and 25.9% aged 30–39 years, accounting for 57.6% of the sample. Most respondents had attained higher education (66.8%), including 2.9% with postgraduate degrees. In terms of community residence, 91.8% had lived in their community for more than six years, with the largest subgroup residing for 11–15 years (33.2%). A majority were unmarried (62.9%), and 63.9% reported not having children. Additionally, 51.7% had participated in community disaster prevention education.
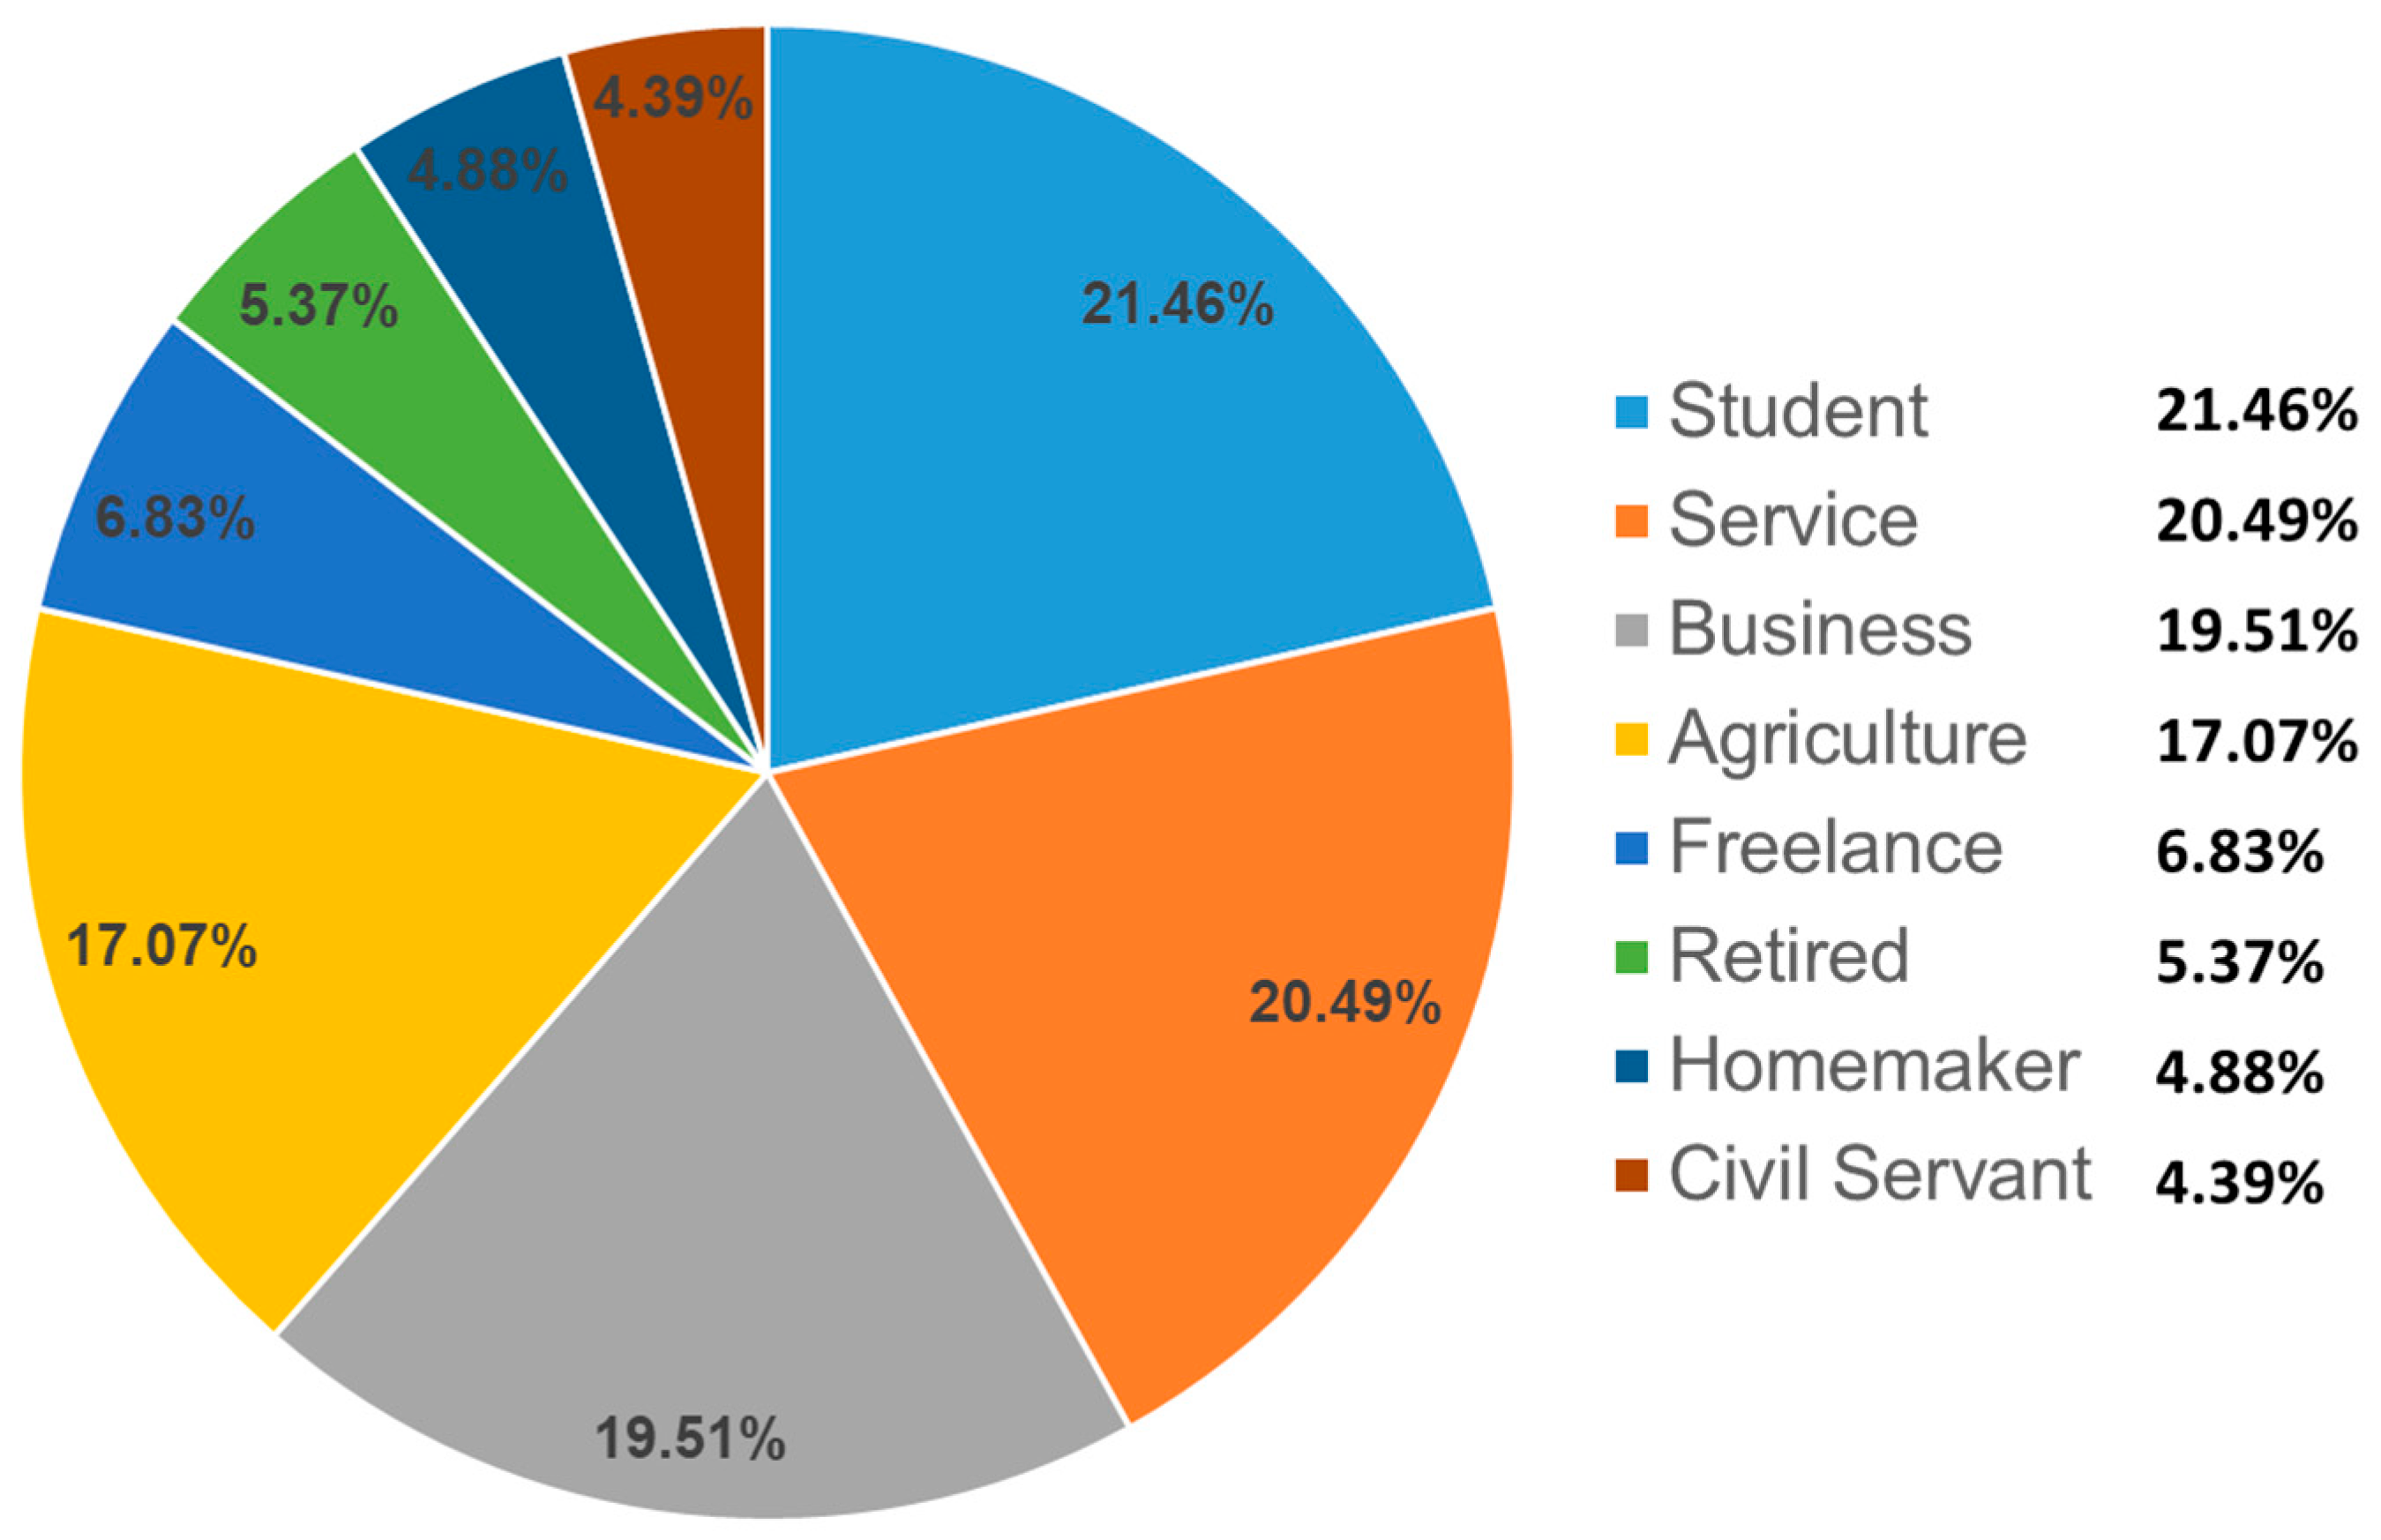
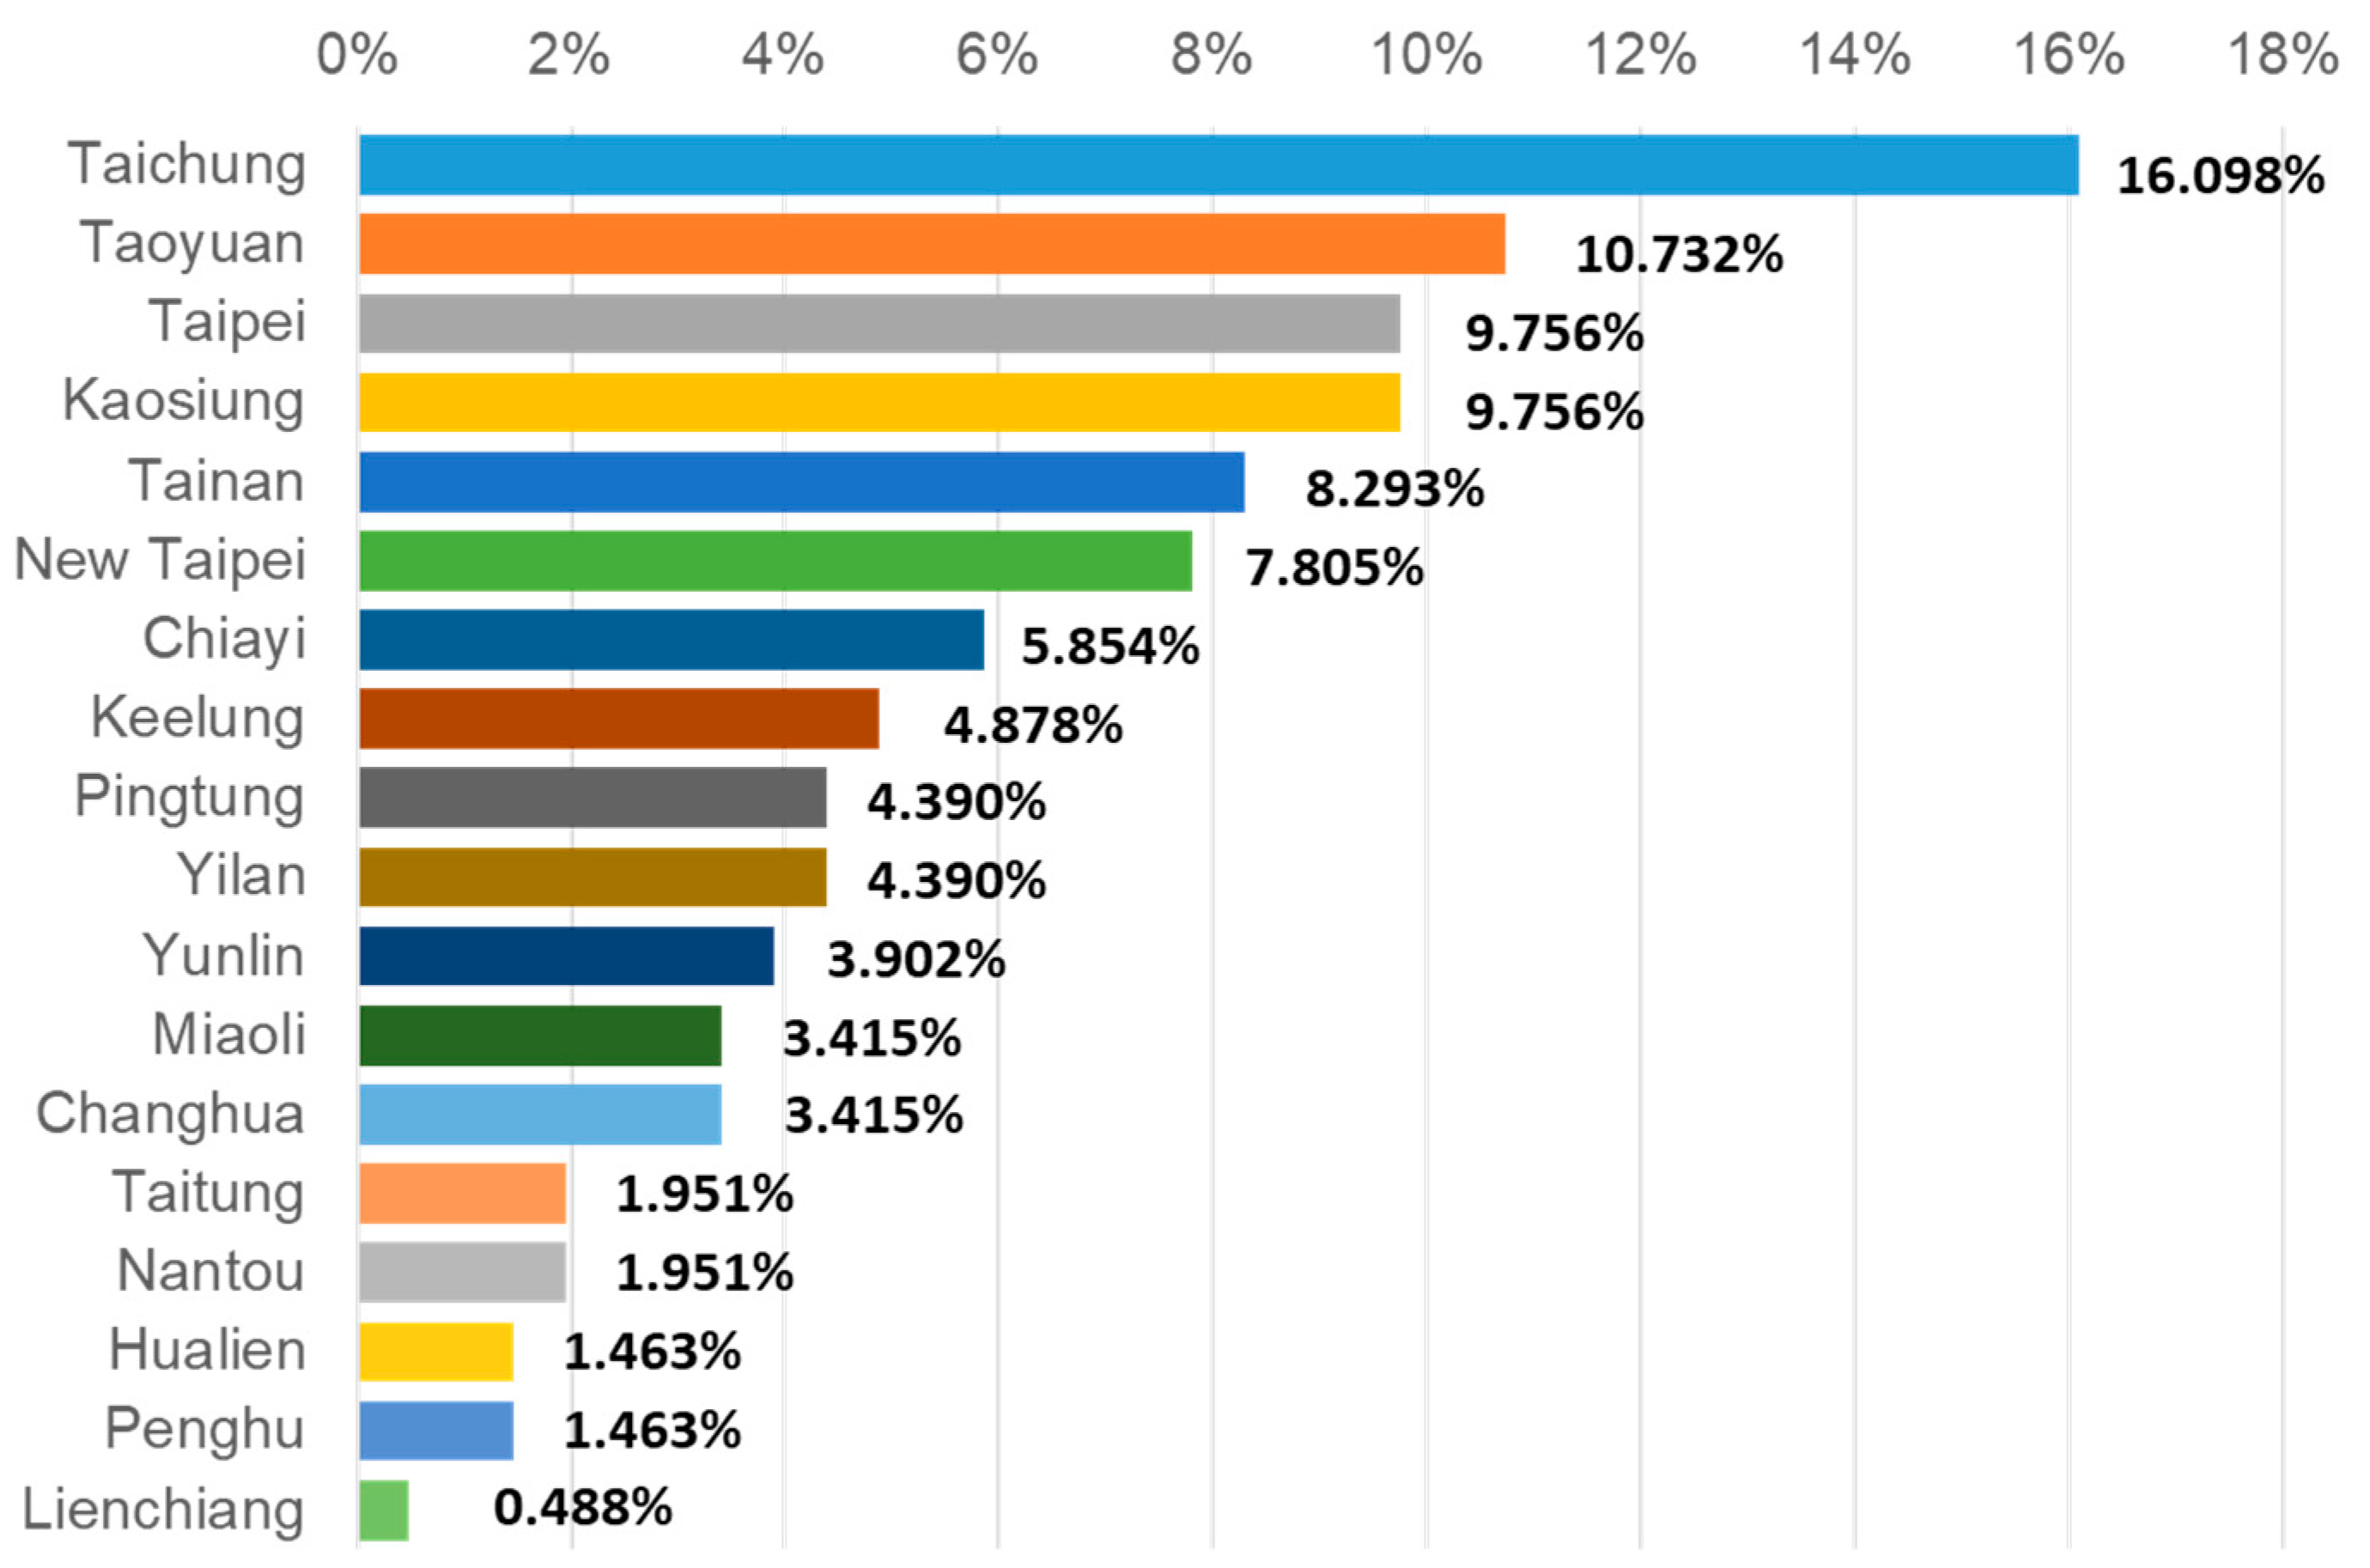
Regarding occupation, the most common groups were students (21.46%), service industry workers (20.49%), and business professionals (19.51%). Residential distribution was highest in Taichung (16.098%), followed by Taoyuan (10.732%), and Taipei and Kaohsiung (both 9.756%). The demographic and community-related variables are presented in
Table 4, and
Figure 2 and
Figure 3.
4.2. Questionnaire Reliability
We conducted an internal consistency test of the scale using the formal sample (N = 205), with Cronbach’s α used as the reliability indicator. Cronbach’s α for the Flood Disaster Self-Preparedness Education Participation Scale was 0.848, and that for the Flood Disaster Self-Preparedness Attitude Scale was 0.814. Both values met the threshold for good reliability, demonstrating that the scales possess stable and consistent quality, which supports the subsequent inferential analysis.
4.3. Differential Analysis of Residents’ Participation in Self-Reliant Disaster Prevention Education
Independent sample
t-tests and one-way ANOVA were conducted to examine the differences in disaster prevention education participation, risk perception, and disaster preparedness attitudes based on various resident background variables (gender, age, occupation, educational level, years of residence in the community, marital status, whether the participant has children, and residential area). The test results are summarized in
Table 5.
4.4. Differential Analysis of Residents’ Disaster Preparedness Attitudes
This section uses independent sample
t-tests (for binary variables: gender, marital status, whether the participant has children, and whether the participant has participated in community disaster prevention education) and one-way ANOVA (for variables with three or more categories: age, occupation, educational level, and years of residence in the community) to examine differences in disaster preparedness attitudes based on various background variables. It further compares the inter-group differences in participation in community disaster prevention education. All statistical tests are two-tailed with α = 0.05, and effect sizes are reported (Cohen’s d for
t-tests; η
2 for ANOVA; and 95% confidence intervals are provided when necessary). The complete results are shown in
Table 6.
4.5. Analysis of Differences in Disaster Preparedness Attitudes Among Residents
We examined the impact of participation in community disaster prevention education on risk perception and disaster preparedness attitudes. For binary group comparisons, independent sample
t-tests were conducted, while for multiple group comparisons, one-way ANOVA was conducted. Post hoc analysis was performed the results were significant. All statistical tests were conducted in two-tailed analysis with α = 0.05, and effect sizes are reported (Cohen’s d for
t-tests; η
2 for ANOVA). The complete results are presented in
Table 7.
4.6. Discussion
The analysis results showed that age and years of residence in the community presented significant differences in both dimensions, with an increasing trend observed. Educational level also showed significant differences in both dimensions, with a distribution characteristic where lower education levels were associated with higher scores. These results showed differences in lifestyle and community participation levels across age and education groups. In particular, older individuals generally had lower educational levels but more flexible daily schedules, which makes them likely to participate in community affairs and disaster prevention education. As a result, they showed higher scores in self-reliant disaster prevention participation and disaster preparedness attitudes.
In contrast, younger and middle-aged groups, who are often in school or employed, face time constraints due to academic and work schedules, limiting their opportunities to participate in community disaster prevention activities, which influences the development of their related attitudes and behaviors. Furthermore, whether the participants have participated in community disaster prevention education shows significant differences, indicating that such educational interventions do enhance residents’ disaster prevention awareness and attitudes, aligning with existing literature that highlights the positive correlation between educational interventions and disaster prevention intentions.
The participants with different marital statuses and numbers of children showed significant differences across both dimensions. Unmarried individuals and those with children reported higher average scores. Participation in community disaster prevention education also produced significant differences, with participants scoring higher than non-participants. These findings highlight the influence of family responsibilities, lifestyle, and social roles on disaster prevention participation and attitudes. Married individuals or those with children may assume greater family safety responsibilities, increasing their risk perception and motivation for disaster prevention. Conversely, unmarried individuals or those without children may face fewer family-level risks and have simpler living environments, limiting their involvement. However, the higher scores among unmarried participants suggest that they may have more discretionary time or greater exposure to community-driven activities, enhancing their willingness to engage in self-reliant disaster prevention.
Gender did not show significant differences in self-reliant disaster prevention participation (p = 0.201) or disaster preparedness attitudes (p = 0.824). Occupation had no significant effect on participation (p = 0.228) but did influence preparedness attitudes (p = 0.008). Retirees and homemakers scored higher, while students scored lower. These results suggest that widespread disaster prevention education and growing awareness may be reducing the influence of gender roles. Meanwhile, retirees and homemakers may benefit from more flexible schedules and stronger family or community involvement, motivating greater attention to safety. Students, constrained by academic demands and limited exposure to practical disaster prevention, scored lower.
5. Conclusions
Based on 205 valid survey responses, we examined the risk perception and disaster preparedness attitudes of residents in Taiwan, focusing on group differences influenced by background variables such as gender, age, and educational level. Despite the sample being concentrated in younger, higher-educated groups (72.2% male, 66.8% higher education, and 31.7% aged 20–29 years), the results provide significant insights. Participation in community disaster prevention education was effective, with the participants scoring significantly higher on the use of digital disaster prevention tools such as mobile water situation apps.
Self-reliant disaster prevention participation was influenced by age, years of residence, marital status, having children, and participation in disaster prevention education. Individuals aged 40–49 and above, those with longer community residence, married individuals, and those with children showed higher participation scores. These results support that life stage, localized context, and family responsibilities are important factors in disaster prevention actions. Interestingly, educational level showed an inverse gradient, with lower education levels associated with higher participation scores, suggesting that while younger, highly educated individuals may possess knowledge advantages, they may face challenges in translating this knowledge into community-level action.
Based on these conclusions, three recommendations are proposed in this study.
Improve representativeness: Future studies are necessary by incorporating community-based paper surveys, face-to-face interviews, and short in-depth interviews to capture diverse voices.
Engage younger populations: Disaster prevention agencies must strengthen online promotion and task-based recruitment (e.g., offering participation rewards) to align with the preferences of younger groups, thereby increasing participation and sustainability.
Integrate digital tools into training: The operation and contextual application of digital tools, such as mobile water situation apps, must be emphasized in disaster prevention education to ensure that knowledge is effectively translated into immediate and efficient risk response actions.
Author Contributions
Conceptualization, S.-H.H.; methodology, S.-H.H.; software, Y.-W.L.; validation, H.C.; formal analysis, Y.-W.L.; investigation, Y.-W.L.; resources, H.C.; data curation, Y.-W.L.; writing—original draft preparation, S.-H.H.; writing—review and editing, S.-H.P.; visualization, Y.-W.L.; supervision, S.-H.P.; project administration, S.-H.P. All authors have read and agreed to the published version of the manuscript.
Funding
This research received no external funding.
Institutional Review Board Statement
Institutional Review Board approval was not required for this study.
Informed Consent Statement
Informed consent was obtained from all subjects involved in the study.
Data Availability Statement
Data are available upon reasonable request. Please contact the corresponding author.
Acknowledgments
We would like to express our heartfelt gratitude to all anonymous participants who generously took the time to complete our questionnaire survey.
Conflicts of Interest
The authors declare no conflicts of interest.
References
- United Nations Office for Disaster Risk Reduction (UNDRR). Living with Risk: A Global Review of Disaster Reduction Initiatives; UNDRR: Geneva, Switzerland, 2004. [Google Scholar]
- Ministry of the Interior (MOI). Disaster Prevention and Protection Act. 2025. Available online: https://law.moj.gov.tw/ENG/LawClass/LawAll.aspx?pcode=D0120014 (accessed on 4 December 2025).
- Teng, J.-Y.; Hu, C.-P.; Tzeng, G.-H. Study on the Residents’ Perception of Their Living Environment and Coping Behavior Factors in the Keelung River Basin. Bull. Geogr. Soc. China 1990, 18, 23–39. [Google Scholar]
- Jian, Y.L. A Study on Disaster Prevention Literacy of University Students-Case of National Pingtung University of Science and Technology. Master’s Thesis, National Pingtung University of Science and Technology, Pingtung County, Taiwan, 2021. [Google Scholar]
- White, G.F. Natural Hazards, Local, National, Global; Oxford University Press: Oxford, UK, 1974. [Google Scholar]
- Lin, H.Y. A Study of Hazard Perception of Preparatory Geography Teacher. Master’s Thesis, National Taiwan University, Taipei, Taiwan, 2003. [Google Scholar]
- Lin, R.R. Public Servant Attitude Research of Township Office Government Disaster Prevention and Dealing with Emergency for Debris Flow in Taitung Area. Master’s Thesis, National Pingtung University of Science and Technology, Pingtung County, Taiwan, 2005. [Google Scholar]
- Pan, L.C. A Study on Knowledge, Attitude and Behavior of Disaster Prevention in Typhoon and Flood of Grade 6 Elementary School Students from Tainan County. Master’s Thesis, National University of Tainan, Taipei, Taiwan, 2010. [Google Scholar]
- Strasser, M.K.; Aaron, J.E.; Bohn, R.C.; Eales, J.R. Fundamentals of Safety Education; Macmillan: New York, NY, USA, 1964. [Google Scholar]
- Florio, A.E.; Stafford, G.T. Safety Education; McGraw-Hill: New York, NY, USA, 1969. [Google Scholar]
- Wu, Y.J. An Investigative Study of Disaster Prevention Literacy for Junior High and Elementary School Students in Taiwan. Master’s Thesis, National Kaohsiung Normal University, Kaohsiung, Taiwan, 2007. [Google Scholar]
- Bandura, A. Self-efficacy mechanism in human agency. Am. Psychol. 1982, 37, 122–147. [Google Scholar] [CrossRef]
- von Lersner, H. Outline for an ecological economy. Sci. Am. 1995, 273, 188. [Google Scholar]
- Lyons, P. A robust approach to employee skill and knowledge development. Ind. Commer. Train. 2005, 37, 3–9. [Google Scholar] [CrossRef] [Scilit]
- Cutter, S.L. Living with Risk: The Geography of Technological Hazards; Hodder Education Publishers: London, UK, 1993. [Google Scholar]
- Gregg, C.E.; Houghton, B.F.; Johnston, D.M.; Paton, D.; Swanson, D.A. The perception of volcanic risk in Kona communities from Mauna Loa and Hualālai volcanoes, Hawai’i. J. Volcanol. Geotherm. Res. 2004, 130, 179–196. [Google Scholar] [CrossRef] [Scilit]
- Sandman, P.M. Risk communication: Facing public outrage. EPA J. 1987, 13, 21. [Google Scholar] [CrossRef] [Scilit]
- Wogalter, M.S.; DeJoy, D.; Laughery, K.R. Warnings and Risk Communication; CRC Press: Boca Raton, FL, USA, 1999. [Google Scholar]
- Bronfman, N.C.; Cisternas, P.C.; Repetto, P.B.; Castañeda, J.V.; Guic, E. Understanding the relationship between direct experience and risk perception of natural hazards. Risk Anal. 2020, 40, 2057–2070. [Google Scholar] [CrossRef] [Scilit] [PubMed]
- Slovic, P.; Finucane, M.L.; Peters, E.; MacGregor, D.G. Risk as analysis and risk as feelings: Some thoughts about affect, reason, risk and rationality. In The Feeling of Risk; Routledge: London, UK, 2013; pp. 21–36. [Google Scholar]
- Bubeck, P.; Botzen, W.J.W.; Aerts, J.C. A review of risk perceptions and other factors that influence flood mitigation behavior. Risk Anal. 2012, 32, 1481–1495. [Google Scholar] [CrossRef] [Scilit] [PubMed]
| Disclaimer/Publisher’s Note: The statements, opinions and data contained in all publications are solely those of the individual author(s) and contributor(s) and not of MDPI and/or the editor(s). MDPI and/or the editor(s) disclaim responsibility for any injury to people or property resulting from any ideas, methods, instructions or products referred to in the content. |