1. Introduction
Unmanned aircraft systems (UASs) are set to become a major part of European very-low-level (VLL) urban airspace, creating significant air risk and safety challenges. The European U-space regulation addresses this by establishing services like flight authorization, tactical deconfliction, and strategic conflict detection to maintain an acceptable level of safety (ALS) for mid-air collisions (MACs).
This work builds on the SPATIO project [
1], which focuses on conflict resolution and the relationship between separation and capacity in U-space. A key challenge is determining appropriate protection buffer sizes, as analytical derivation is impractical due to the stochastic nature of UAS trajectories, navigation uncertainty, and complex multi-aircraft interactions.
To overcome this, a high-performance, C++-based Monte Carlo simulation framework was developed. It evaluates conflict frequencies under various airspace conditions and buffer sizes by modeling UAS motion and uncertainty. The simulator uses OpenMP to execute multiple independent airspace instances in parallel, allowing for the analysis of long-duration scenarios (over 100,000 flight hours). This provides a quantitative basis for setting buffer sizes that keep conflict frequencies below the required ALS thresholds.
The simulations incorporate multiple trajectory uncertainty models (gas-based dispersion, random walk, and GPS-derived noise). Conflict events are categorized by severity (from tactical conflict to MAC) and aggregated. Furthermore, a normalization approach is introduced to make conflict frequencies independent of the number of simulated drones, enabling results obtained with small-scale simulations to be extrapolated to airspace with arbitrarily high traffic densities.
This paper details the modeling assumptions, simulation architecture, conflict taxonomy, and normalization methodology, presenting a structured set of results to demonstrate how these outputs can be used to dimension protection buffers in U-space airspace.
2. Problem Description
U-space regulation requires Member States to define an ALS, expressed as fatalities per flight hour for En-Route MACs, before U-space airspace is designated. To comply with the ALS, it is necessary to determine separation minima and protection buffers that ensure the frequencies of MACs and near mid-air collisions (NMACs) remain below regulatory thresholds.
However, collision risk in UAS operations depends on a large set of interacting factors:
Aircraft categories: Each aircraft category has specific performance parameters (rate of climb/descent, cruise speed, turn rate), which influence relative motion and conflict likelihood. The simulator currently includes the following categories: OPEN A1, OPEN A2, OPEN A3, PDRA/STS, SPECIFIC SAIL I–II, SPECIFIC SAIL III–IV, SPECIFIC SAIL V–VI, Certified Type 2, and manned VFR/IFR.
Traffic mix: The probability distribution defining how likely each category is to appear in the simulated traffic.
Position uncertainty: Defined by total system error (TSE), which controls the spatial dispersion around each aircraft’s nominal trajectory.
Airspace geometry: A rectangular prism airspace characterized by dimensions , vertical limits, and the number of altitude layers.
Traffic density: The number of simultaneously flying drones, which directly impacts computational complexity and conflict rates.
The complexity and stochasticity of these contributing factors make analytical derivation of collision risk unfeasible. Therefore, a simulation-based approach is required to:
- 1.
Estimate conflict frequency under realistic operational and uncertainty conditions.
- 2.
Evaluate how protection buffer size influences MAC/NMAC rates.
- 3.
Identify buffer values that ensure compliance with ALS.
- 4.
Provide a normalization mechanism enabling extrapolation to large traffic densities without the computational burden of simulating them directly.
3. Methodology
The simulator employs a highly parallel Monte Carlo approach. Multiple independent airspace instances, subject to identical configuration but different random seeds (governing drone placement, heading, and uncertainty), evolve simultaneously. Aggregating results across these instances yields statistically robust estimates of conflict frequencies for specified protection buffer sizes.
3.1. Input Configuration
The simulator is configured through a graphical interface that allows operators to specify all relevant parameters defining the U-space environment.
Airspace geometry (side sizes, minimum and maximum altitude, number of layers).
Traffic mix (probability distribution across UAS categories).
Performance parameters for each category (speeds, climb/descent rates, turn rates).
Numerical values for navigation system error (NSE), flight technical error (FTE), and the resulting TSE.
The range of protection buffer sizes to evaluate and the number of intermediate values.
Simulation parameters: total simulated hours per instance, number of instances, desired parallel threads, and maximum concurrent drones.
Simulating a range of buffer sizes allows for the automated construction of conflict frequency curves as a function of the protection buffer size during post-processing.
3.2. Parallel Execution Model
Using OpenMP, a parallel region is created where each thread constructs an independent airspace instance. Each instance evolves autonomously with thread-specific random number generators, ensuring stochastic independence. This provides two main benefits: significant reduction in total runtime and natural statistical averaging, leading to more reliable conflict frequency estimates.
Each airspace instance maintains its own list of active drones. New drones are spawned at the boundaries of the airspace, consistent with the desired traffic density. When a drone exits the airspace or experiences a MAC event, it is replaced by a new drone placed randomly along the boundary, maintaining a constant level of utilization across the simulated hours.
3.3. Strategic Deconfliction Mechanism
Before a drone is allowed to enter an instance, a strategic deconfliction check is performed. The newly proposed trajectory and heading are compared with all active drones already present in the instance. The simulation computes the closest point of approach (CPA) between the new drone and each existing drone. The new drone is inserted only if all CPAs exceed a threshold defined by the user-defined minimum separation plus the protection buffer being evaluated.
If a conflict is detected, the drone’s initial conditions and position are regenerated and checked again. This filtering ensures that all observed conflicts result solely from stochastic in-flight deviations, allowing the simulation to properly assess the buffer’s adequacy against uncertainty.
3.4. Modeling Trajectory Uncertainty
Each drone’s trajectory is perturbed according to one of three models:
- 1.
Gas model, in which the aircraft’s position is sampled from a normal distribution around the nominal path. This approach simulates instantaneous dispersion that reflects TSE-based uncertainty.
- 2.
Random walk model, in which small stochastic increments are applied at each timestep. The dispersion of errors in this model grows with the number of steps.
- 3.
GPS error model, which combines higher-frequency white noise errors from GNSS measurements with slower-varying biases that capture ionospheric shifts and other long-term deviations [
2].
3.5. Dynamic Timestep Calculation
To balance accuracy and efficiency, the simulator uses a dynamic timestep algorithm. At each iteration, it calculates the minimum time required for any drone pair to progress to the tactical conflict threshold under the worst-case relative geometry (drones flying in the same direction facing each other). This time determines the largest timestep that guarantees no tactical conflict is skipped. If a more severe conflict state is present, the timestep is further reduced according to predefined values associated with each severity level. This significantly reduces computational cost while ensuring fine temporal resolution during safety-critical events.
3.6. Conflict Detection and Severity Classification
The distances between all drone pairs are computed at every timestep, and each pair is classified by conflict severity. Transitions to a more severe state are tracked, allowing the calculation of conflict frequencies for all severity levels:
5—No conflict
4—Tactical Conflict (TC)
3—Separation Loss (SL)
2—Imminent Collision (IC)
1—Near Mid-Air Collision (NMAC)
0—Mid-Air Collision (MAC)
These frequencies serve as the primary safety outputs used to determine the protection buffer sizes necessary to meet ALS constraints.
3.7. Safe Aggregation of Simulation Outputs
Upon completion, each airspace instance stores its results in a thread-safe shared array. The final aggregate conflict frequencies are combined across all instances for each protection buffer size. These outputs are then post-processed to generate risk curves and determine the minimum buffer required for acceptable risk.
3.8. Normalization of Conflict Frequencies
Raw conflict counts depend on simulation duration and the number of aircraft, as conflict probability grows with traffic density. Therefore, a normalization is essential for comparison and extrapolation.
The first metric is the conflict frequency per simulated hour, defined as follows:
This frequency expresses the average number of conflicts per hour of simulation time. However, it remains sensitive to the number of drones, as scenarios with higher densities naturally exhibit larger values of .
To reduce this dependency, the conflict frequency can be expressed per flight hour by dividing by the number of active drones:
While this formulation provides a better measure of the number of conflicts per unit of drone flight time, it does not fully eliminate the influence of traffic density. This is because conflicts originate from pairwise interactions, and the number of potential interacting pairs grows quadratically with the number of drones. To properly account for this effect, a fully normalized metric is introduced, expressing the conflict frequency per flight hour per drone pair:
The captures the conflict probability associated with a particular airspace configuration, trajectory uncertainty model, traffic mix, and protection buffer size. Empirical evidence obtained with the simulator shows that this metric converges to consistent values across simulations with different numbers of drones, provided that all other parameters remain unchanged. This convergence demonstrates that effectively removes the artificial dependence on the chosen simulation density.
The implications of this normalization are significant. Since the computational cost of the simulation grows as , the metric allows simulations to be performed with a small number of drones, dramatically reducing computation time. Results can then be reliably extrapolated to high-density airspace using the appropriate scaling factors.
This normalization procedure transforms raw conflict counts into a density-independent indicator that reflects the fundamental safety characteristics of the airspace.
4. Results
This section presents the Monte Carlo simulation outcomes, focusing on the relationship between protection buffer sizes and conflict frequencies, the validation of the normalization metric, and computational performance.
4.1. Reference Scenarios
Two reference scenarios were defined to assess conflict risk under varying operational conditions. They differ in traffic mix, airspace structure, and uncertainty.
Table 1 details the geometry and error models: Scenario 1 has a higher TSE and fewer layers, while Scenario 2 has a more complex layer structure and reduced TSE.
The traffic mix—referring to the probability distribution of different aircraft categories—also varies between scenarios.
Table 2 summarizes the performance characteristics and the mix percentages for each category.
4.2. Conflict Frequency Analysis
Simulations were run in batches across a protection buffer range of 0 to 20 meters, using 30 parallel independent instances, each simulating 100,000 flight hours, for traffic densities of 2 to 12 concurrent drones.
4.2.1. Impact of Protection Buffer on Conflict Rates
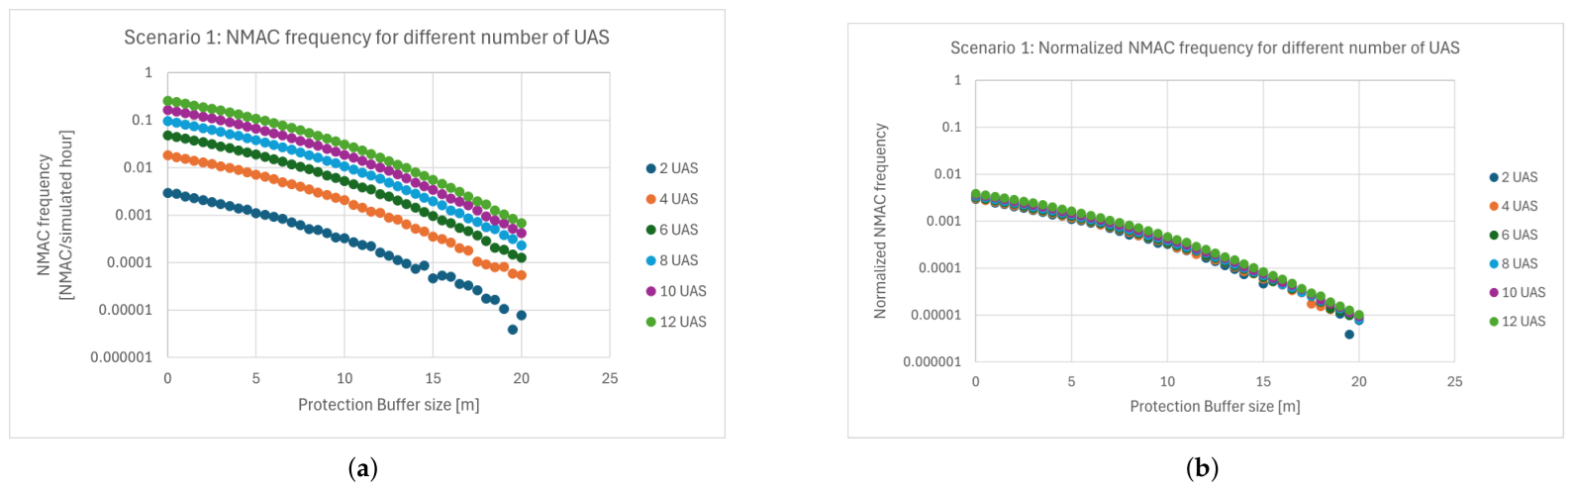
Figure 1a illustrates the raw conflict frequency per simulated hour as a function of the protection buffer size for Scenario 1. As expected, two clear trends are observed:
Larger protection buffers significantly reduce the conflict frequency.
For a fixed buffer size, higher traffic densities (e.g., 12 drones) result in higher conflict rates compared to lower densities (e.g., 2 drones).
The results suggest that increasing the buffer size effectively filters out potential conflicts during the strategic deconfliction phase, thereby reducing the residual risk during operations.
4.2.2. Normalization Validation
To validate the normalization method of Equation (
3), the raw conflict frequencies in
Figure 1a were normalized into the metric
shown in
Figure 1b. After normalization, the curves corresponding to different drone counts (2–12) collapse onto a single line within each scenario. This indicates that
does not depend on how many drones are simulated.
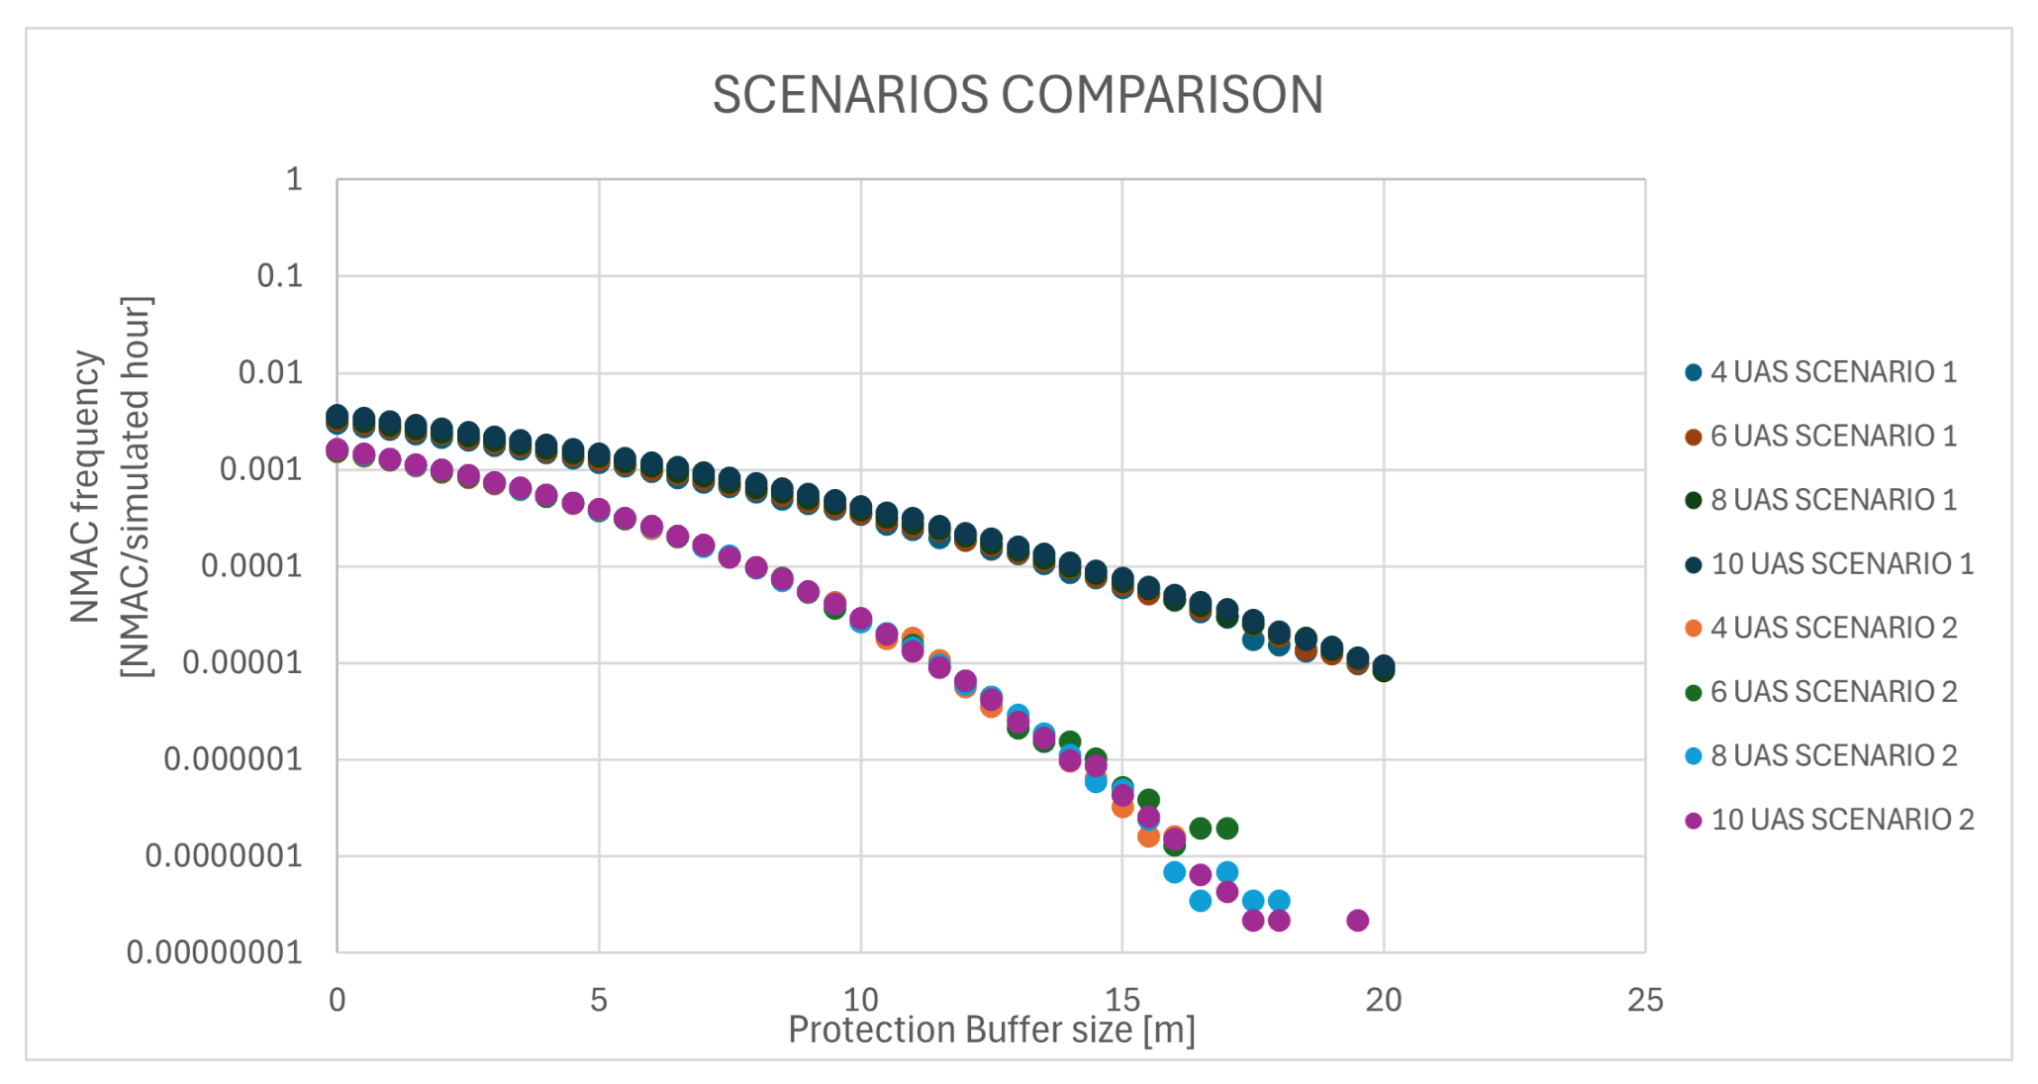
Figure 2 reinforces this result: for both scenarios, all drone-count curves converge to their respective scenario-specific trend line. The fact that Scenario 1 and Scenario 2 produce two distinct trend lines confirms that the normalized frequency is insensitive to traffic density but remains sensitive to the underlying airspace configuration and traffic mix.
4.3. Computational Performance
The efficiency of the simulator was analyzed to determine the cost of scaling the simulations.
4.3.1. Cost vs. Buffer Size
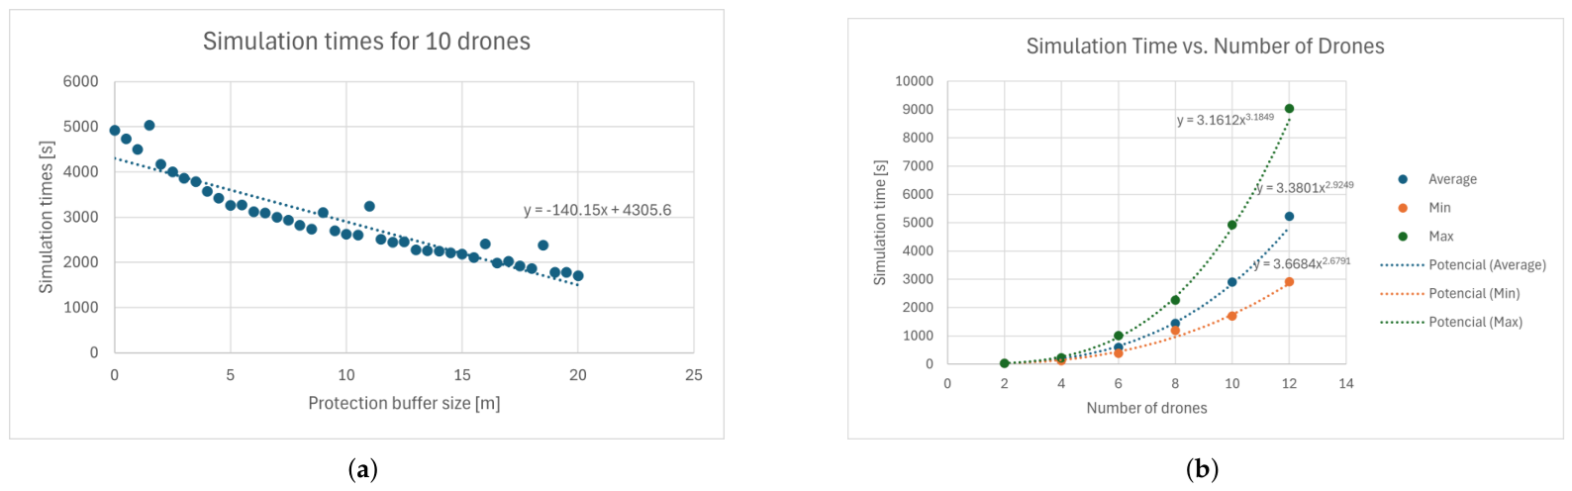
Figure 3a shows the processing time for simulations in Scenario 2 (10 drones) as the protection buffer increases, revealing a roughly linear decrease. This performance gain is due to the dynamic timestep algorithm: larger buffers reduce the likelihood of drones approaching closely during the simulation, allowing the algorithm to take bigger steps without compromising safety checks.
4.3.2. Cost vs. Traffic Density
Figure 3b shows that the simulation time scales approximately with
. This arises because every simulation timestep and the strategic deconfliction phase require evaluating all drone pairs, making the computational load grow rapidly as traffic increases. Three specific cases are highlighted:
- 1.
Worst Case (Buffer = 0 m): This requires the finest temporal resolution due to frequent close interactions.
- 2.
Best Case (Buffer = 20 m): This allows for faster execution due to larger separation.
- 3.
Average Case: This represents the mean performance across the simulated batches.
4.4. Sensitivity Analysis
Scenario Comparison
Figure 2 compares the normalized NMAC frequencies between Scenario 1 and Scenario 2. The plot reveals two distinct “families” of curves with different slopes. This divergence highlights the sensitivity of collision risk to the specific traffic mix and airspace configuration. Scenario 2, despite having a lower TSE, presents a different risk profile due to its specific traffic composition (higher percentage of faster SAIL III-IV drones) and layer structure.
5. Discussion
The results confirm that the highly parallel Monte Carlo framework is a viable, scientifically grounded, and computationally feasible method for assessing conflict risk and dimensioning protection buffers in U-space.
The most critical technical finding is the successful validation of the normalized conflict frequency (
). Since
is density-independent (
Figure 1b), it provides a direct quantitative link between protection buffer size and the intrinsic safety level of the airspace. Regulators can determine the minimum required buffer size by simply locating the corresponding risk threshold on the
curve to comply with the ALS. This method eliminates the need for computationally prohibitive simulations of extremely dense traffic.
Analysis of computational performance highlights a trade-off. The observed
complexity (
Figure 3b) is higher than the
expected for pairwise checks. This cubic behavior arises because, at each timestep, the algorithm must evaluate every drone pair, and during strategic deconfliction, it must additionally compare the new drone against all others to resolve potential conflicts. Conversely, performance improves linearly with increasing protection buffer size (
Figure 3a), since larger buffers reduce the likelihood of drones approaching closely and larger timesteps are permitted.
The sensitivity analyses (
Figure 2) reveal that regulatory efforts must look beyond uniform assumptions about airspace operations. The resulting risk profiles vary significantly depending on the traffic mix and the performance characteristics of each aircraft category—for example, differences in speed, climb/descent capability, and maneuverability. These operational factors are the main drivers of residual risk, highlighting that effective regulation must explicitly account for heterogeneous traffic performance rather than treating all aircraft as operationally equivalent.
In summary, the simulation framework and the normalized metric provide a robust, scientifically grounded, and computationally feasible method for establishing the necessary separation standards, enabling regulatory bodies to dimension U-space protection buffers in a manner that is both compliant with ALS and scalable with increasing traffic density.
Author Contributions
Conceptualization, J.V.B.; methodology, B.F. and J.V.B.; software, B.F. and A.S.; validation, B.F., S.A. and A.S.; formal analysis, B.F.; investigation, B.F.; writing—original draft preparation, B.F.; supervision, J.V.B.; funding acquisition, J.V.B. All authors have read and agreed to the published version of the manuscript.
Funding
This research was funded by the SESAR 3 Joint Undertaking (JU) under grant number 101114674. The JU receives support from the European Union’s Horizon Europe research and innovation programme and from the SESAR 3 JU members other than the Union.
Institutional Review Board Statement
Not applicable. This research did not involve human subjects or animal studies.
Informed Consent Statement
Not applicable. This research did not involve human subjects.
Data Availability Statement
The data generated in this study are available upon request from the corresponding author.
Conflicts of Interest
The authors declare no conflicts of interest. The funders had no role in the design of the study; in the collection, analyses, or interpretation of data; in the writing of the manuscript; or in the decision to publish the results.
References
- SESAR Joint Undertaking. Available online: https://www.sesarju.eu/projects/SPATIO (accessed on 4 May 2026).
- Gallo, E. Stochastic High Fidelity Autonomous Fixed Wing Aircraft Flight Simulator; Universidad Politécnica de Madrid, Centro de Automática y Robótica: Madrid, Spain, 2023; pp. 72–73. [Google Scholar]
| Disclaimer/Publisher’s Note: The statements, opinions and data contained in all publications are solely those of the individual author(s) and contributor(s) and not of MDPI and/or the editor(s). MDPI and/or the editor(s) disclaim responsibility for any injury to people or property resulting from any ideas, methods, instructions or products referred to in the content. |