Proceeding Paper

A Behavioural Economics Approach to Demand Management for the Airport Capacity Problem †

by
Alvaro Rodriguez-Sanz
1,2,* and
Luis Rubio Andrada
2,*
1
Department of Aerospace Systems, Air Transport and Airports, Universidad Politécnica de Madrid (UPM), Plaza Cardenal Cisneros N3, 28040 Madrid, Spain
2
Department of Applied Economics, Universidad Autónoma de Madrid (UAM), Ciudad Universitaria Cantoblanco, 28049 Madrid, Spain
*
Authors to whom correspondence should be addressed.
Presented at the 15th EASN International Conference, Madrid, Spain, 14–17 October 2025.
Eng. Proc. 2026, 133(1), 88; https://doi.org/10.3390/engproc2026133088
Published: 7 May 2026

Abstract

Airports face persistent capacity constraints and increasing delays. This study introduces a behavioural framework for demand management that integrates airport and airline preferences with principles from Prospect Theory. By incorporating concepts from behavioural economics—such as loss aversion, reference dependence, and non-linear probability weighting—into choice architectures, we explore how adaptive decision environments can influence airline scheduling and demand distribution. A practical example illustrates the applicability of the proposed methodology. Results suggest that behavioural interventions can sustain economically viable schedules while maximising total prospect value. This approach provides policymakers and operators with innovative tools to address complex capacity challenges in air transport systems.

1. Introduction: The Airport Congestion Problem

The aviation sector has grown substantially, with global passenger traffic reaching 9.5 billion in 2024 and projected to exceed 19 billion by 2040 [1]. However, airport infrastructure has not kept pace, creating widespread congestion—defined as demand exceeding capacity—resulting in delays and disruptions [2]. Many major airports operate at full capacity and face expansion constraints due to political, environmental, and geographic factors [2,3]. The management of airport capacity and demand, and therefore airport performance, can be divided into interventions that seek to act on the supply side and initiatives aimed at modelling the demand side. On the supply side, we can find measures related to the expansion of infrastructure (both physical and technological) or the improvement of operating procedures. On the demand side, actions seek to modify the temporal or spatial characteristics of air traffic through access regulation that controls the number of scheduled flights at peak times at busy airports, or through incentives to stimulate demand at off-peak times or at underserved airports [4]. Demand-side strategies—such as congestion pricing and slot allocation—provide short-term relief by redistributing traffic across time or airports [5]. The allocation of flight slots is a resource-constrained allocation problem and serves as an important tool for demand management at airports. Incorporating behavioural science into these strategies can enhance effectiveness by leveraging psychological and economic insights to influence airline decisions and passenger behaviour through incentives, nudges, and adaptive policies.

2. Demand Management Strategies for the Airport Congestion Problem

Air travel demand exhibits pronounced peaks during morning and evening hours, particularly for short- and medium-haul flights. This concentration of operations at major airports leads to congestion during busy periods, while significant off-peak capacity remains underutilised. Demand management encompasses interventions designed to limit flight scheduling at congested airports during peak times, thereby redistributing traffic and optimising capacity utilisation [6]. These measures can be administrative (regulatory), economic (market-based), or a combination of both and aim to modify the temporal and spatial characteristics of demand through changes in airline scheduling [6,7]. Zografos et al. [6] provided a thorough review of current scheduling intervention models, which can be categorised into single-airport slot allocation models and network-wide slot allocation models. From a temporal perspective, demand management includes strategic actions, which shape long-term traffic patterns, and real-time interventions, which address short-term irregularities. When infrastructure expansion or operational improvements are infeasible, strategic demand management becomes essential to prevent congestion [7]. Focusing on strategic actions, existing approaches fall into three categories: administrative, economic, and hybrid. Administrative measures include schedule coordination, restrictions on unscheduled flights, and adjustments to user mix through regulatory mechanisms or lotteries. Economic measures involve congestion pricing and slot auctions, which introduce market incentives for efficient allocation [7]. Globally, the most widely adopted approach is the IATA schedule coordination process, which classifies airports into three levels—non-coordinated (Level 1), schedule-facilitated (Level 2), and fully coordinated (Level 3)—and allocates slots based on historical precedence [7]. While this system offers predictability and benefits from extensive implementation experience, it often results in inefficiencies, reduced competition, and barriers to entry [8]. Research has focused on optimisation models for slot allocation, aiming to minimise displacement from requested times, improve fairness, and incorporate slot value differentiation [9,10,11,12]. Our work builds on this literature by introducing a model that explicitly accounts for slot value and risk, while capturing trade-offs among delay reduction, capacity utilisation, and fairness. Applied to a case study, the proposed approach demonstrates improvements over existing allocation practices by reducing slot displacement and enhancing equity.

3. Behavioural Economic Inputs for the Airport Congestion Problem

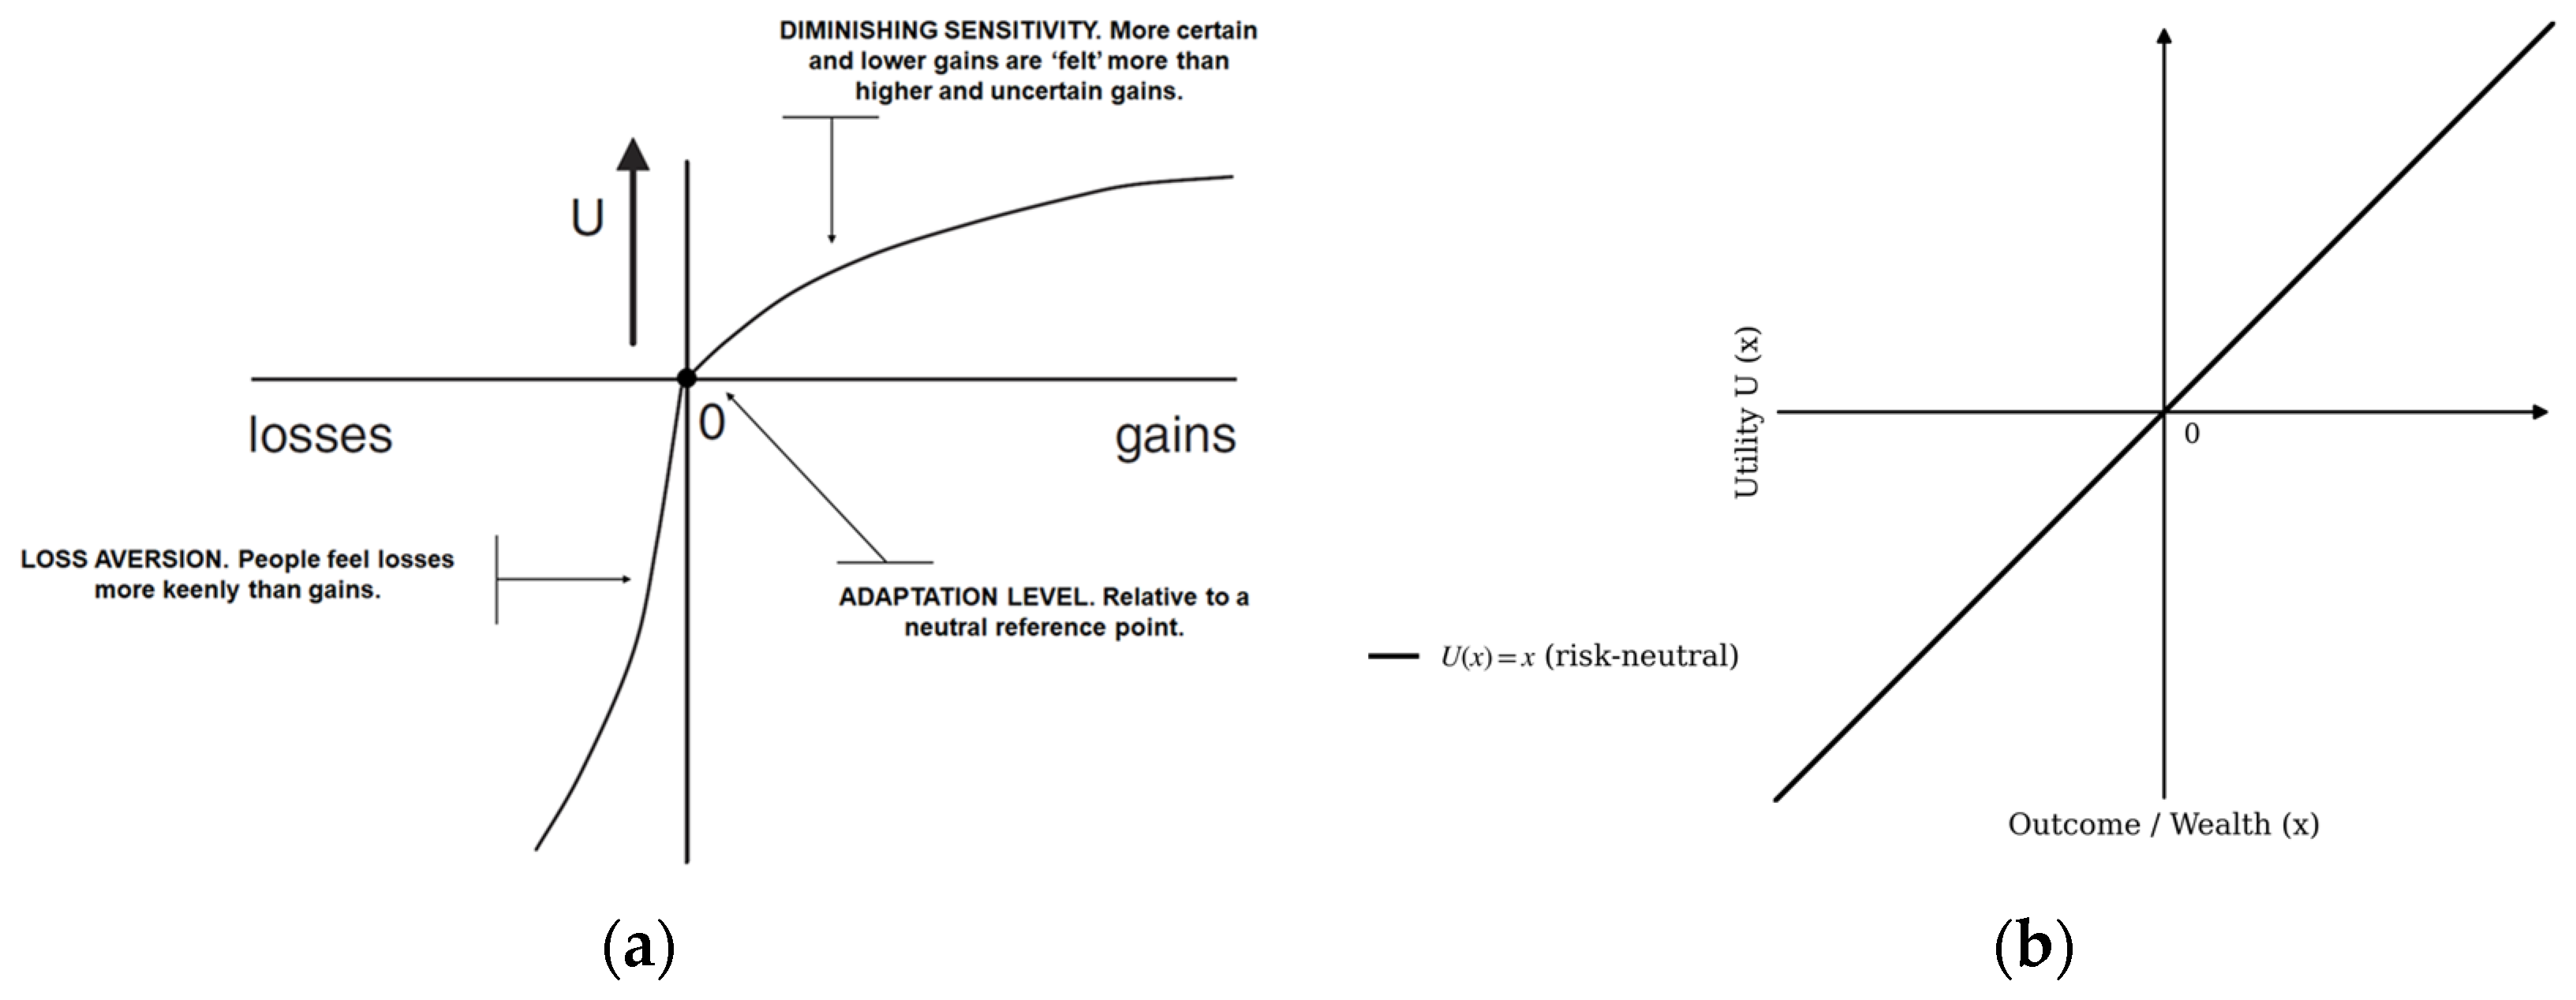
Behavioural economics provides a set of insights that are highly relevant to the airport congestion problem, as airline scheduling decisions often deviate from fully rational optimisation and are shaped by uncertainty. First introduced in 1979 by Kahneman and Tversky [13], Prospect Theory (PT) brings together core behavioural mechanisms—loss aversion, reference dependence, diminishing sensitivity, and non-linear probability weighting—that shape how decision-makers evaluate alternatives under risk [14]. In PT, outcomes are assessed relative to a reference point, with losses weighted more heavily than equivalent gains and with sensitivity decreasing as outcomes move away from that reference [13,14]. This generates the characteristic S-shaped value function, concave for gains and convex for losses, as illustrated in Figure 1a. In contrast, traditional transport models assume a nearly linear, risk-neutral utility function (Figure 1b), which cannot capture empirically observed behaviours such as airlines’ reluctance to accept certain displacements, asymmetric reactions to schedule disruption, or the overweighting of low-probability risks like underoccupancy or missed connections.
The most widely used parametric specification of the value function in PT is the power family, commonly referred to in economics as the Constant Relative Risk Aversion (CRRA) class [14], which has been widely used for modelling risk aversion. Tversky and Kahneman (1992) [15] proposed a valuation function expressed as Equation (1):
U ( α ) = α θ if   α 0   ( g a i n s ) λ   ( α ) θ * if   α < 0   ( l o s s e s )
where θ, θ*, and λ are positive-valued parameters that determine the shape of the utility function for outcome α (0 < θ, θ* ≤ 1 control diminishing sensitivity and λ > 1 captures loss aversion). Notably, the asymmetry between gains (α > 0) and losses (α < 0). Under this specification, U(α) = 0 at α = 0, places the reference point at the origin, although this position may be shifted to incorporate scaling or reference dependence.
Non-linear probability weighting describes how people’s perception of probabilities deviates from rational choice theory. Specifically, it suggests that people tend to overweight small probabilities and underweight large probabilities. Expected utility theory assumes a linear relationship between probability and perceived value. The non-linear probability weighting operates independently of the value function’s curvature and is modelled via the probability weighting mechanism of Cumulative Prospect Theory (CPT). CPT transforms cumulative probabilities rather than individual probabilities, thereby capturing empirically observed non-linear probability perception. We employ Prelec’s weighting function with Equation (2) [16]. This reflects the overweighting of small probabilities and underweighting of large ones, is based on a clean axiomatic foundation, and is widely used for decisions under risk contexts like slot assignment under uncertain demand [14].
w p = e x p   { [ l n ( p ) ] α } , w i t h   0 < α < 1
In the proposed behavioural demand management framework, the airline’s requested slot and planned schedule define the reference point. Displacement-induced impacts (e.g., underoccupancy or missed connections) are evaluated as relative losses and amplified by the loss aversion parameter λ, while curvature parameters (θ, θ*) capture diminishing sensitivity as outcomes move away from the reference. The perceived risk of allocating flights to low-demand off-peak periods is modelled via non-linear probability weighting using Prelec’s function w (·), allowing overweighting of rare adverse states and underweighting of high-probability ones. As a result, airlines with stronger loss aversion (λ) and more pronounced probability distortion exhibit greater resistance to off-peak assignments unless adequately compensated through incentives or fairness constraints. Heterogeneity is captured by an external multiplicative coefficient β i , which scales each airline’s response to the CPT-weighted bad-state probability. β i is distinct from Prelec’s parameter α (which controls the cognitive distortion of the underlying probability) and is not classical risk aversion, which is governed by the value function curvature via θ and θ*. Therefore, cognitive misperception of rare adverse states is disentangled from curvature-driven loss sensitivity, allowing the model to capture heterogeneous behavioural responses without conflating distinct risk mechanisms.

4. A Methodological Framework for Behavioural Demand Management

The model addresses the slot allocation problem at a congested airport that experiences periods of both over- and under-scheduling. We let x i , t , k ∈ {0,1} indicate whether airline i is assigned to slot t with aircraft type k. It is a binary decision: 1 if airline i uses slot t with type k, and 0 if otherwise. Δ i , t ≥ 0 denote absolute displacement between requested and allocated times, and z i is the average displacement for airline i, which is later used in fairness metrics. Type k represents seat capacity classes, t are 10 min bins, and D ^ t is the baseline expected demand at time t. Each flight is evaluated through a prospect value function that blends economic fundamentals with behavioural components. Equation (3) defines the per-flight prospect value U i , t , k P as the combination of four terms: nominal economic stakes V i , t , k ; operational costs C i , t , k ; incentives I i , t , k ; and a behavioural risk term R i , t , k . Therefore, we define an operational net relative to the requested plan ( V i , t , k ,   C i , t , k ,   I i , t , k ) and a risk term ( R i , t , k ) that penalises value cuts. The system objective in Equation (4) maximises total system prospect value, defined as the sum of prospect values across all airlines, slots, and aircraft types (i, t, k). Equations (5)–(7) detail the construction of each economic component. V i , t , k captures capacity, expected demand, and revenue proxies. Incentives I i , t , k reward slot shifts away from peak periods (off-peaks discounts or bonuses), while costs C i , t , k depend on the aircraft type. The risk term R i , t , k is described in Equation (8). It incorporates probability weighting and loss aversion consistent with CPT, allowing the model to reflect behavioural patterns observed in real-world airline decision-making.
U i , t , k P = V i , t , k C i , t , k + I i , t , k R i , t , k
m a x   U t o t a l = i t k x i , t , k · U i , t , k P
V i , t , k = C a p a c i t y k · D ^ t · p   ( or :   seat _ k × expected   load _ t × fare   proxy )
I i , t , k = I n c e n t i v e k · 1 D ^ t
C i , t , k = C o s t k
R i , t , k = β i   · w   ( 1 D ^ t ) ·   V i , t , k + λ · E   L o s s e s i , t , k
In the risk term (8), w (·) denotes Prelec’s probability weighting, β i captures airline-specific risk sensitivity, and λ (>1) represents loss aversion. The ‘bad-state’ probability 1 D ^ t (underoccupancy) is perceived non-linearly through w   ( 1 D ^ t ) , and its impact is amplified by the economic stakes V i , t , k , reflecting that higher-value flights are perceived as riskier. Expected losses are entered as λ · E   L o s s e s i , t , k , ensuring losses receive greater weight than commensurate gains, consistent with PT/CPT. Therefore, the loss function embedded in the prospect-based risk term R i , t , k incorporates the two core behavioural features of PT/CPT: loss aversion and non-linear probability weighting. Diminishing sensitivity to displacement is captured by specifying displacement-induced losses as a function of Δ i , t : E   L o s s e s i , t , k = f Δ i , t with f Δ i , t =   Δ i , t θ * . Conceptually, ( V i , t , k C i , t , k + I i , t , k ) is the net economic outcome relative to the requested schedule (reference), while R i , t , k provides the CPT-based risk correction applied to that same net outcome rather than to revenue alone. Consequently, the risk component is specified on expected value shortfalls relative to the requested schedule rather than on delay itself, with displacement acting as a driver of monetised operational and commercial losses (e.g., underoccupancy, revenue shortfalls, missed-connection penalties, or additional operating/crew costs). By applying CPT corrections to net economic value (rather than to revenue alone) the formulation separates economic exposure from behavioural perception: probability weighting governs how bad states are perceived, while loss aversion scales the impact of negative deviations. This ensures internal consistency between the prospect-based objective and the operational interpretation of slot displacement.
Equation (9) formalises airline-level fairness through the average displacement z i , while Equation (10) introduces a system-level fairness index ( Φ ) based on deviations from the median displacement across airlines. N i denotes the total number of slot requests made by airline i, ensuring that the metric reflects an average rather than an aggregate displacement.
z i = 1 N i · t , k x i , t , k · Δ i , t
Φ = i z i m e d i a n   ( z j j ) ( median   deviation   of   airline - level   displacement )
The fairness metric does not represent a ‘hard’ revenue loss nor a ‘soft’ form of passenger defection. Those mechanisms are already incorporated through the behavioural elements of the model, specifically the CPT-weighted underoccupancy risk and loss-aversion components. Fairness instead operates orthogonally to these mechanisms; it governs how displacement is distributed across airlines, either via a fairness-oriented objective term ( Φ ) or through an explicit fairness cap z i z m a x , ensuring that congestion management does not systematically disadvantage a particular carrier. The regulator may account for both airline-level fairness (‘player fairness’) and system-wide fairness, i.e., how equitably displacement is shared across all operators.
The model is structured in two levels. The first level maximises total system prospect value subject to feasibility constraints. The second level represents the regulator’s strategy as a non-negative weighted scalarisation of four aggregate objectives (total displacement, maximum displacement, number of displaced slots, and fairness Φ) combined through a non-negative weight scalarisation (ωa, ωb, ωc, ωd), as in Equation (11). This second level does not re-optimise assignments. It selects a regulator-preferred compromise by evaluating these summary metrics computed from the first-level allocation, so the two levels are coupled through aggregate values rather than duplicated decision variables. In practice, the first level provides feasible allocations and associated metrics, which are then fed to the regulator objective. Thus, the two levels are coupled through these aggregate values rather than through duplicated decision variables.
m i n   J = ω a · i , t , k x i , t , k · Δ i , t + ω b · m a x i , t   Δ i , t + ω c · ( n u m b e r   o f   d i s p l a c e d   s l o t s ) + ω d · Φ
The constraints to include in the model are as follows.
  • Slot capacity (at most one operation per slot t ) : i , k x i , t , k 1 ∀ t.
  • Fleet/availability (per airline and type): t x i , t , k F l e e t i , k ∀ i, k.
  • Allocation completeness (per request r of airline i): t , k x i , t , k r = 1 ∀ r.
  • Maximum time shift (operational acceptability): Δ i , t Δ m a x ∀ i,t.
  • Displacement definition (absolute value form): Δ Δ i , t     t t i r e q if x i , t , k = 1 .
  • Rolling capacity windows (for any window W): t W i , k x i , t , k C a p ( W ) .
  • Optional fairness cap (system wide fairness): z i z m a x ∀ i.
  • Binary and non-negativity conditions as appropriate: x i , t , k { 0,1 } , Δ i , t ≥ 0.

5. Case Study: A Practical Example for the New Behavioural Demand Management Framework

In this section, the proposed slot allocation model is applied to a case study, with the objectives of demonstrating its applicability and comparing the results with the actual coordination of slots recorded. The latter will quantify the potential benefits associated with the implementation of the model to support slot coordination decisions. The case study is based on slot request and slot allocation data for the summer season of 2024 (from 31 March 2024 to 26 October 2024). It corresponds to a busy airport, coordinated in schedules (Level 3), and with a declared capacity of 10 movements, five arrivals and five departures per 10 min, and 30 arrivals and 25 departures per hour. However, this corresponds to the practical capacity of the runway, which can reach a throughput capacity of 33 arrivals and 27 departures per hour (this capacity is, as do not consider a level of admissible delay). The airline slot request information includes details such as the airline, requested time, flight frequency, start time, end time, and flight connection information. A total of 117,925 slots were requested by airlines. We implemented the model using CPLEX (the IBM optimisation software package), with GAMS (version 50) as the modelling language. We looked for exact solutions (with a 0% optimality gap). In this preliminary exercise, the operational components ( V i , t , k C i , t , k + I i , t , k ) and the airline-specific risk sensitivity β i are populated from standardised administrative records and public coordinator datasets (e.g., seat capacity by type, typical operating cost by aircraft class, baseline demand by 10 min bin, and generic off-peak incentive schedules). These simplifying hypotheses are intended to demonstrate the model’s usefulness rather than provide final estimates and can be refined with carrier-specific data. For illustration, we set V i , t , k as seat capacity × expected load × mean fare (e.g., A320: 180 × 0.85 × €90 ≈ €13,770); C i , t , k as a type-dependent average turn cost (e.g., €4800 for narrowbody, €12,000 for widebody); and I i , t , k via an off-peak schedule I t = κ   ( 1 D ^ t ) with κ [ 1000 ,   3000 ] (e.g., if D ^ t = 0.3 , then I t 2100 for κ = 3000 ). Behavioural parameters follow standard CPT [13,14,15,16] as θ* = 0.88, λ = 2.0, and Prelec’s weighting with α = 0.70 applied to the bad-state probability of underoccupancy. Airline risk response is governed by β i , segmented by carrier family (legacy 0.55–0.65, hybrid 0.40–0.50, low-cost 0.25–0.35, regional 0.20–0.30) to reflect heterogeneous operational attitudes toward off-peak risk and connection integrity. Loss aversion λ is identified from loss–gain asymmetry around the reference schedule (normalised against the gains coefficient), and β i from the marginal effect of the CPT-weighted underoccupancy proxy ( w   ( 1 D ^ t ) · V i , t , k ) on observed accept/assign choices (with segmentation by carrier family). Expected losses ( E   L o s s e s i , t , k ) are defined as monetised shortfalls relative to the airline’s reference plan (requested slot and its baseline value), combining monetary components (e.g., foregone revenue from underoccupancy, missed connections, additional handling/crew costs) and reputational components proxied by displacement. Operationally, E   L o s s e s i , t , k can be implemented as a piecewise linear or convex penalty in Δ i , t and low D ^ t , normalised to the value scale so that λ · E   L o s s e s i , t , k is commensurate with the other terms in the prospect-valued objective. In this preliminary analysis, we use standard administrative proxies and leave carrier-level calibration of monetary and reputational components for future work. Relative to the coordinator’s slot allocation, the behavioural model achieves −13% total displacement (108,853 min), −5% maximum displacement (40 min), −4% displaced slots (14,151), and +12% in a system-wide fairness index; these deltas are robust under ±25% weight perturbations. These results should be regarded as preliminary, as they rely on simplified parameters, assumptions, and estimated input values. They are nonetheless valid for demonstrating the model’s applicability and usefulness. However, the application of the model to more representative case studies is required to provide greater robustness to the proposed theoretical framework. Regarding the behavioural impact quantification, with holding operational parameters fixed, a +20% increase in λ (from 2.0 to 2.4) raises the share of peak-time assignments by ~1.8 pp and increases median displacement by ~0.6 min, while a −20% shift reduces these effects accordingly; similarly, moving α from 0.70 to 0.60 (stronger overweighting of rare events) requires ~€300–€600 higher off-peak incentives per affected slot to recover the same off-peak uptake for high-β carriers. These variations remain within the feasible region and preserve the ordering of outcomes reported above, indicating that the behavioural levers primarily affect the mix of peak/off-peak allocations rather than feasibility. An analysis of the results shows that higher values of λ (loss aversion) steer the optimisation away from assignments perceived as losses (such as off-peak slots with underoccupancy), even when moderate incentives are offered. In parallel, Prelec’s weighting term w 1 D ^ t overweights low-probability adverse states, meaning that sufficiently calibrated incentives are required to unlock off-peak shifts for airlines with higher β i . Furthermore, the use of rolling windows mitigates artefacts associated with static hourly capacity caps, which is consistent with the observed improvements in total displacement (−13%) and fairness (+12%). The weights (ωa, ωb, ωc, ωd) for the four regulatory objectives (total displacement associated with all allocated slots throughout the period, maximum displacement imposed on any slot, number of slots that were scheduled at a different time than requested, and system fairness) are combined in a baseline approach (1, 0.25, 0.5, 0.5). This reflects a pragmatic balance (priority to total displacement, secondary attention to peak burdens and equity). To ensure that our findings are not driven by a particular scalarisation choice, we perform a ±25% local sensitivity analysis on the weights around the baseline configuration. Across these perturbations, the allocation patterns and the qualitative ordering of outcomes remain stable: total displacement, maximum displacement and the count of displaced slots improve against the coordinator baseline, while the system-wide fairness index increases. The behavioural interpretation is unchanged: higher λ steers the solution away from perceived-loss assignments, w   ( 1 D ^ t ) amplifies underoccupancy risk primarily when expected demand is very low, and β i governs carrier-specific risk sensitivity. These findings indicate that our results are robust to plausible regulatory preference shifts represented by alternative weight combinations.

6. Conclusions and Future Work

Airports are limited in terms of capacity. When it is not possible to increase infrastructure or improve procedures, it is necessary to act on demand. This allows for a response with a limited scope but greater ease of implementation. In this study, we have developed a new model based on maximising the prospect value of the system, applying concepts from behavioural economy. The use of behavioural concepts to inform policy grants the design of more realistic slot allocation mechanisms and the challenge of traditional assumptions regarding utility (loss aversion, reference dependence, non-linear probability weighting, and diminishing sensitivity to gains and losses). The model has been applied to a case study for a congested airport. A comparison with the schedule coordinator decisions shows a potential improvement in the different indicators (total displacement, maximum displacement, number of slots displaced, and ‘system-wide’ fairness). The insights gained can be used to inform future potential adjustments to slot allocation guidelines and rules so that the process reflects actual demand behaviour, maintaining profitable flight schedules that can meet current passenger demand and reduce delays. The model should be calibrated using a broader set of use cases to achieve a more robust estimation of its parameters and variables. Furthermore, the conceptual framework can be strengthened by applying the model to an airport network rather than to a single airport. Nevertheless, we believe that this work constitutes an important step toward more efficient and behaviour-based capacity–demand management.

Author Contributions

Both authors have contributed substantially to the work reported. Conceptualisation, A.R.-S. and L.R.A.; methodology, A.R.-S.; software, A.R.-S.; validation, A.R.-S. and L.R.A.; formal analysis, A.R.-S. and L.R.A.; investigation, A.R.-S. and L.R.A.; data curation, A.R.-S.; writing—original draft preparation, A.R.-S.; writing—review and editing, A.R.-S. and L.R.A.; visualisation, A.R.-S. All authors have read and agreed to the published version of the manuscript.

Funding

This research received no external funding.

Institutional Review Board Statement

Not applicable.

Informed Consent Statement

Not applicable.

Data Availability Statement

The original contributions presented in this study are included in the article. Further inquiries can be directed to the corresponding author.

Conflicts of Interest

The authors declare no conflicts of interest.

References

  1. ACI World; ICAO. Passenger Traffic Report, Trends, and Outlook; Airport Council International and International Civil Aviation Organization: Montreal, QC, Canada, 2025. [Google Scholar]
  2. Jacquillat, A.; Odoni, A.R. A roadmap toward airport demand and capacity management. Transp. Res. Part A Policy Pract. 2017, 114, 168–185. [Google Scholar] [CrossRef]
  3. Rodriguez-Sanz, A.; Rubio-Andrada, L. A Behavioral Framework for the Evaluation of Airport Infrastructure Investments. Transp. Res. Procedia 2023, 71, 347–354. [Google Scholar] [CrossRef]
  4. Vaze, V.; Barnhart, C. An assessment of the impact of demand management strategies for efficient allocation of airport capacity. Int. J. Revenue Manag. 2012, 6, 5–27. [Google Scholar] [CrossRef]
  5. Fan, T.P.; Odoni, A.R. A Practical Perspective on Airport Demand Management. Air Traffic Control Q. 2002, 10, 285–306. [Google Scholar] [CrossRef]
  6. Zografos, K.G.; Madas, M.A.; Androutsopoulos, K.N. Increasing airport capacity utilisation through optimum slot scheduling: Review of current developments and identification of future needs. J. Sched. 2017, 20, 3–24. [Google Scholar] [CrossRef]
  7. Ribeiro, N.A.; Jacquillat, A.; Antunes, A.P.; Odoni, A.R.; Pita, J.P. An optimization approach for airport slot allocation under IATA guidelines. Transp. Res. Part B Methodol. 2018, 112, 132–156. [Google Scholar] [CrossRef]
  8. Jiang, Y.; Zografos, K.G. A decision-making framework for incorporating fairness in allocating slots at capacity-constrained airports. Transp. Res. Part C Emerg. Technol. 2021, 126, 103039. [Google Scholar] [CrossRef]
  9. Fairbrother, J.; Zografos, K.G.; Glazebrook, K.D. A Slot-scheduling mechanism at congested airports that incorporates efficiency, fairness, and airline preferences. Transp. Sci. 2020, 54, 115–138. [Google Scholar] [CrossRef]
  10. Keskin, M.; Zografos, K.G. Optimal network-wide adjustments of initial airport slot allocations with connectivity and fairness objectives. Transp. Res. Part B Methodol. 2023, 178, 102801. [Google Scholar] [CrossRef]
  11. Ranieri, A.; Alsina, N.; Castelli, L.; Bolic, T.; Herranz, R. Airport slot allocation: Performance of the current system and options for reform. In Proceedings of the SESAR Innovation Days SIDs 2013, Stockholm, Sweden, 26–28 of November 2013. [Google Scholar]
  12. Gurtner, G.; Cook, A.J.; Graham, A.; Cristóbal, S. The economic value of additional airport departure capacity. J. Air Transp. Manag. 2018, 69, 1–14. [Google Scholar] [CrossRef]
  13. Kahneman, D.; Tversky, A. Prospect Theory: An Analysis of Decision under Risk. Econometrica 1979, 47, 263–291. [Google Scholar] [CrossRef]
  14. Wakker, P.P. Prospect Theory for Risk and Ambiguity; Cambridge University Press: Cambridge, UK, 2010. [Google Scholar]
  15. Tversky, A.; Kahneman, D. Advances in prospect theory: Cumulative representation of uncertainty. J. Risk Uncertain. 1992, 5, 297–323. [Google Scholar] [CrossRef]
  16. Prelec, D. The probability-weighting function. Games Econ. Behav. 1998, 42, 497–528. [Google Scholar] [CrossRef]
Figure 1. Utility functions: (a) a value function that embodies the findings of PT; and (b) a traditional linear utility function in which gains and losses are treated symmetrically.
Engproc 133 00088 g001
Disclaimer/Publisher’s Note: The statements, opinions and data contained in all publications are solely those of the individual author(s) and contributor(s) and not of MDPI and/or the editor(s). MDPI and/or the editor(s) disclaim responsibility for any injury to people or property resulting from any ideas, methods, instructions or products referred to in the content.