Proceeding Paper

Heatwave Impacts on Airport Operations Under Future Climate Scenarios: A Climate Risk Assessment †
1
Deep Blue s.r.l., 00185 Rome, Italy
2
Amigo s.r.l., 00196 Rome, Italy
*
Author to whom correspondence should be addressed.
Presented at the 15th EASN International Conference, Madrid, Spain, 14–17 October 2025.
Eng. Proc. 2026, 133(1), 74; https://doi.org/10.3390/engproc2026133074
Published: 7 May 2026

Abstract

Rising air temperatures are expected to increasingly affect aircraft take-off performance, potentially causing disruption in airport operations. This study develops an airport climate-risk assessment framework combining aircraft performance modeling with the IPCC hazard–exposure–vulnerability approach, using publicly available data. The Take-Off Distance Required (TODR) was simulated for an A320-231 aircraft under varying temperature conditions, and threshold temperatures, above which fully-laden aircraft cannot depart for a given runway length, were derived for six European airports. Climate projections for 2050 were used to forecast frequency of threshold exceedance (hazard), while exposure and vulnerability were estimated through traffic volume and infrastructure-related factors. Results show that mid-century warming will raise the number of days when temperature is so high that the TODR is longer than the available runway length. Airports with shorter runways, frequent departures, and infrastructure constraints exhibit the highest projected risk levels. The findings indicate that increasing temperatures may impose growing operational constraints. The proposed framework provides an accessible preliminary tool for screening climate-related operational risks, supporting early identification of airports that may require targeted adaptation measures.

1. Introduction

Climate change is already having an effect on life on Earth [1], altering the frequency and intensity of extreme weather events, increasing global temperature, and posing challenges for critical infrastructure, including aviation [2]. Increasing air temperatures directly affect aircraft performance at take-off by reducing air density, forcing planes to reach higher ground speeds to generate the required lift [3,4,5], and thus decreasing the engine thrust [6]. As a result, higher air temperatures lead to longer take-off distance required (TODR) for a given aircraft configuration and payload. If the available runway length is equal to or shorter than the TODR, aircraft must depart below their maximum take-off mass (MTOM) to comply with safety regulations. This results in payload restrictions, delays, or flight cancellations, conditions already observed at airports operating near their runway length limits [7]. Several studies have investigated how increasing temperature will impact on aircraft performance. Increased take-off distances under mid-century climate scenarios have been confirmed by [3,5], while payload restrictions of up to 4% have been projected by [8]. These studies show that temperature rise is a key driver of operational risk in aviation, affecting both safety and economic performance.
The present study develops a climate–aviation risk assessment framework to quantify how climate change will alter temperature across different latitudes and geographic contexts, and how this translates into increased risk of airport disruptions due to degradation of aircraft take-off performance. The approach used in this study follows the hazard-exposure-vulnerability structure proposed by [9]. Hazard is the physical event that has the potential to cause harm. In this study, the hazard is the temperature exceeding a critical threshold for take-off operations. Exposure is defined as presence of elements that could be adversely affected, e.g., the departures volume. Vulnerability is the combination of the propensity of exposed elements to be adversely affected by hazard occurrence and adaptive capacity of airport infrastructure to cope with those impacts. The proposed framework was applied to six European airports, as detailed in Section 2.1. Section 2 details the data sources and modeling approach used to quantify hazard, exposure, and vulnerability.

2. Materials and Methods

2.1. Data Selection & Climate Scenario

In this study, climate projections are combined with aircraft performance modeling to assess the effect of rising temperature on airport operations because of climate change. To demonstrate applicability of the proposed framework, six representative European airports were selected to cover different climatic, geographical, and operational contexts: Barcelona (LEBL), Catania (LICC), Dublin (EIDW), Palma De Mallorca (LEPA), Rotterdam (EHRD), and Zurich (LSZH). Historical and projected climate data were obtained from the Coupled Model Intercomparison Project Phase 6 (CMIP6) ensemble, using the EC-Earth3 global climate model. Future climate scenario were analyzed for the mid-century period centred on year 2050 (2035–2064), under three different Socioeconomic Pathways (SSPs): SSP1-2.6, SSP3-7.0, and SSP5-8.5. The historical baseline scenario covers the 1985–2014 period, centred on year 2000. For each airport and for both historical and SSP5-8.5 scenarios, the daily maximum temperature of air at 2 m above the surface was extracted from the CMIP6 cell corresponding to the airport location, with daily temporal resolution. The SSP5-8.5 scenario was chosen as a worst-case scenario for the temperature increase at the selected airports. After the extraction climate data underwent a bias correction process using CERRA reanalysis, following the methods described by [10,11].

2.2. Aircraft Performance Modeling and Take-Off Distance Required

In this study, TODR was calculated as the sum of ground roll distance and airborne distance (the distance needed to climb to 35 ft 10.7 m), multiplied by 1.15 safety factor [12]. The ground roll segment was obtained by numerically integrating the aircraft’s acceleration profile, updating ground speed in 1 m/s increments at each integration step. At each integration step, thrust, drag, and lift are recomputed until the lift force equals aircraft weight, which defines the lift-off condition. The effect of temperature on air density is incorporated in this formulation, which follows the method already employed by [3,4]. In this study, all simulations were conducted using the Airbus A320 equipped with the IAE V2500 engine as reference aircraft. Aircraft characteristics and aerodynamic parameters were obtained from the OpenAP v2.5.0 Python library [13]. To isolate the effect of temperature on aircraft performance, in all simulations pressure was set at 101,325 Pa as in International Standard Atmosphere (ISA) conditions, relative humidity at 50%, and no headwind. The mean airport altitude was included in the model to account for the effect of elevation on aircraft thrust. This model was applied to calculate how TODR changes with temperature (see Section 3.2), and to find the threshold temperature T thr , at which, for each airport, the TODR is equal to the published runway length.

2.3. Climate Risk Framework for Airports

In this study, the the following definitions were used:
  • Hazard (H) is defined as the frequency of days when maximum temperature exceeds threshold temperature T thr for a given airport. For multi-runway airports, the shortest runway is used, except in the case of Dublin, for which the second runway is selected. The presence of additional runways is incorporated in the vulnerability assessment, as it contributes to the ability of the system to cope with hazardous situation.
  • Exposure (E) as the number of departures per hour per runway. This metric represents the degree to which airport traffic is exposed to disruption should the hazard occur. Due to constraints in publicly available data, the exposure in this study was estimated based on the annual number of flights for each airport, assuming 50% were departures and a uniform temporal distribution of operations throughout the year. Future exposure (year 2050) was projected using EUROCONTROL’s Average Annual Growth Rate under their base scenario [14]. To integrate exposure into the risk framework, hourly departure rates F were mapped into five exposure classes. Airports with fewer than 3 departures per hour per runway are assigned to level 1; levels 2 to 4 correspond to [3, 5), [5, 7), and [7, 15) departures per hour per runways intervals, respectively; and airports with 15 or more departures per hour fall into level 5. These thresholds correspond approximately to one departure every 20, 12, 8, and 4 min.
  • Vulnerability (V) is derived from six binary indicators capturing operational, geographic, and structural constraints. The score increases by + 1 for each of the following conditions: peak summer operations (i.e., busiest traffic days are in summer), single runway, mountainous surroundings (i.e., terrain elevation exceeds 800 m within 10 km of the airport), nearby residential areas (i.e., settlements located within 4 km of the airport perimeter), and explicit noise restrictions. Conversely, recent or planned infrastructure investments (e.g., runway extension) reduce vulnerability by 1.
The overall airport climate risk index (R) is defined, following the IPCC methods [9], as:
R = H × E × V
Equation (1) ensures that risk is an interaction of H, E and V. It prevents high exposure or vulnerability alone to generate high risk score even in absence of realized hazard. Both E and V are normalized to range between 0 and 1, ensuring comparable weighting and a bounded risk metric. The resulting index allows for both temporal and cross-airport comparison, supporting the identification of adaptation priorities. In Section 3.3, the risk assessment framework proposed is applied to the selected airports and the results are reported as a risk matrix.

3. Results

3.1. Temperature Trends and Airport Exposure

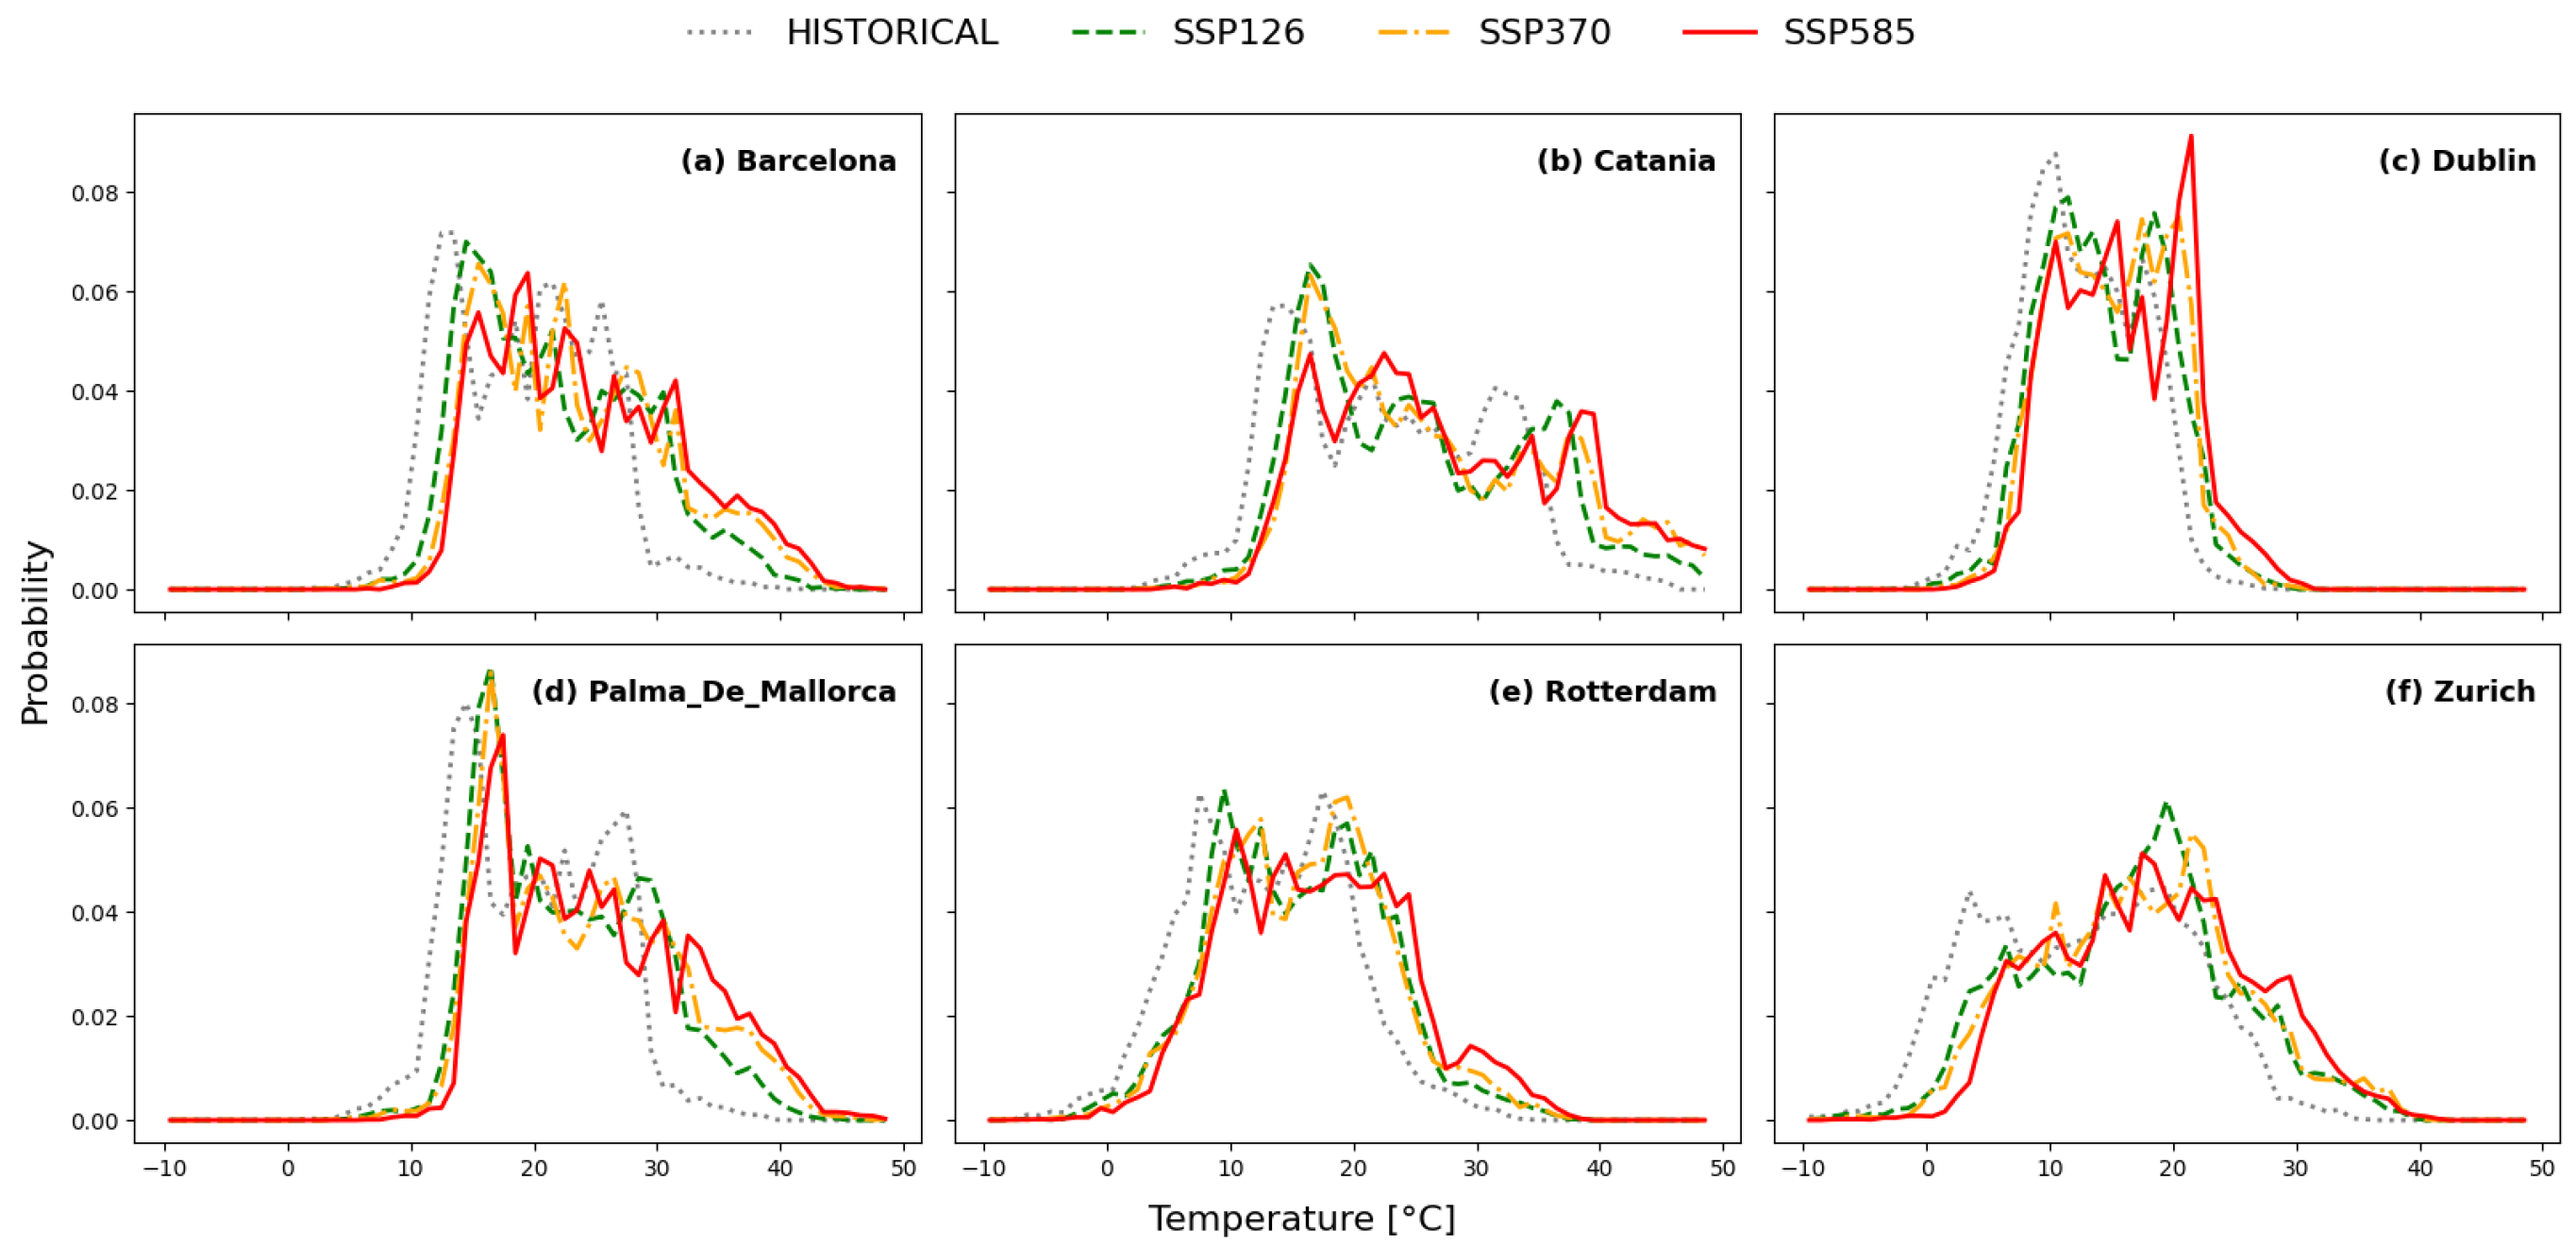
The analysis of historical data and projections under the three SSPs, shows warming trends across all the six investigated airports. Figure 1 shows the distribution of daily maximum temperatures calculated in the historical baseline (1985–2014, grey-dotted line) and in three future scenarios, SSP1-2.6, SSP3-7.0, and SSP5-8.5 (2035–2064, green-dashed, yellow-dot-dashed and red-solid lines, respectively) at Barcelona, Catania, Dublin, Palma De Mallorca, Rotterdam, and Zurich airports. Between the historical baseline and the projections for future scenarios the highest daily maximum temperatures increase between 1.1 °C and 9.8 °C, depending on the selected scenario and airport’s location.
This predicted temperature rise directly increases the hazard component of the risk framework, as explained in the Section 3.2. Under such conditions, airports with short runways might face an increased number of delayed or canceled flights, payload restrictions and limitations to the allowed Maximum Take-Off Mass (MTOM), i.e., the maximum aircraft mass that can be permitted for take-off under specific operating conditions, ensuring compliance with all performance and safety margins. From an exposure point of view, airports with higher flight volume and single runway are more exposed to the temperature-induced hazard analyzed in this study.

3.2. TODR Sensitivity to Temperature

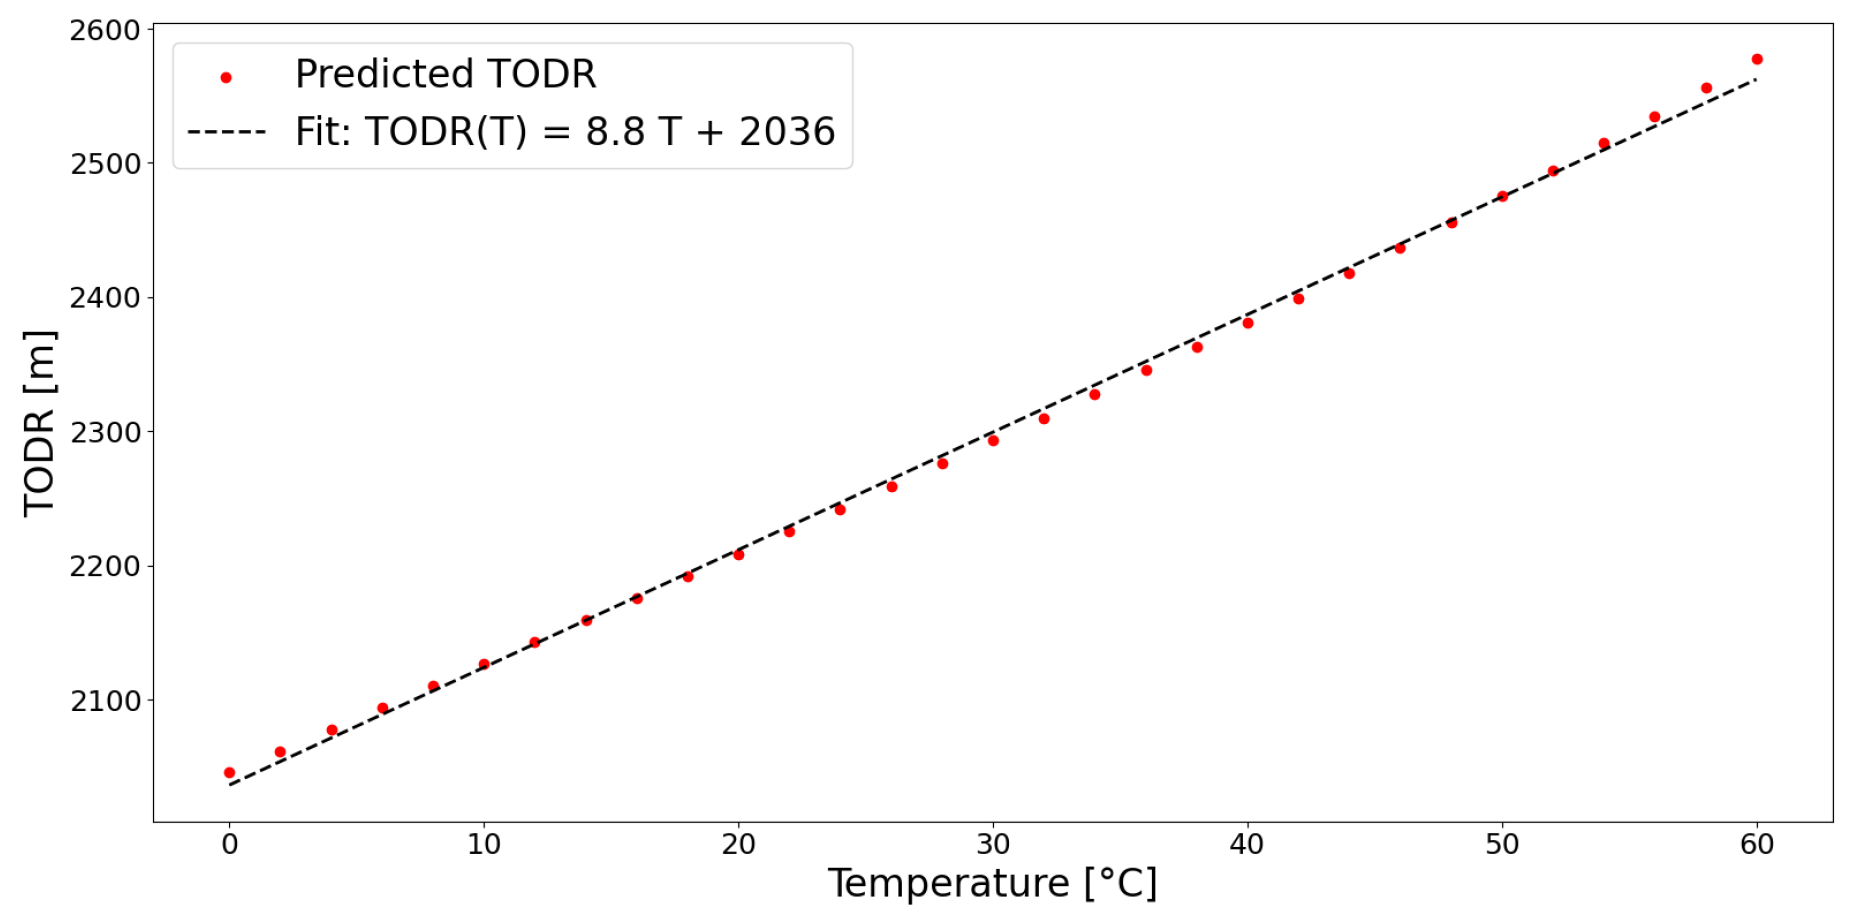
The TODR was calculated as introduced in Section 2.2, as a function of temperature, keeping all other parameters (relative humidity, pressure, wind, altitude) constant at ISA value. Figure 2 shows that in the range [0, 60] °C the TODR of a fully-laden A320 aircraft increases almost linearly with temperature. This is expected, as both lift and drag scale with air density and with the square of the true airspeed. At higher temperature, lower air density requires higher true airspeed to reach the same lift-off conditions, ultimately increasing drag and leading to longer acceleration and TODR.
The fitted linear regression, shown in Figure 2, indicates that, for the considered temperature range and aircraft model, TODR increases ncrease of about 8.8269 m per degree Celsius. Under standard ISA conditions at sea level, the predicted TODR for a fully-laden A320-231 aircraft is 2168 m. At 30 °C, a temperature observed or projected at all considered airports, the TODR increases to 2300 m. Putting these values in operational context, two of the analysed airports (Dublin and Rotterdam) have at least one runway shorter than 2300 m, meaning that, at 30 °C, an A320 would require payload reduction to meet safety margins. This highlights that temperature increase is already sufficient to make TODR exceed the physical limits of existing infrastructure at several airports.

3.3. Integrated Climate Risk Profiles

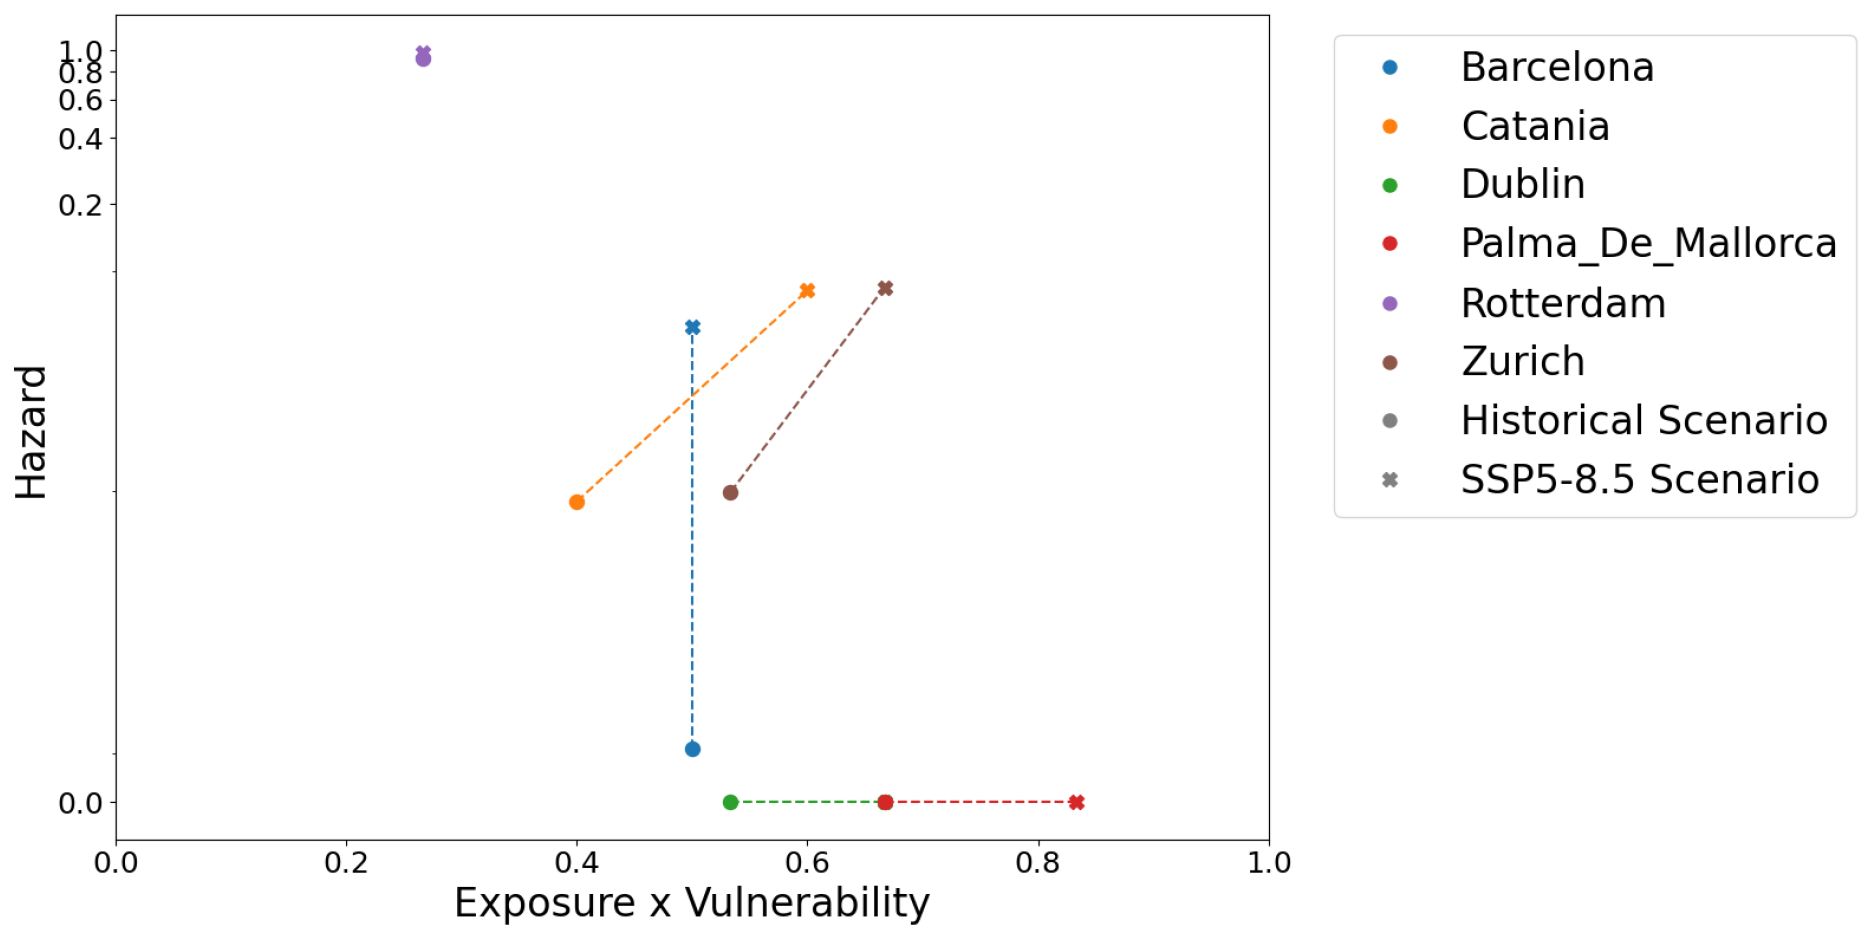
The framework described in Section 2 was applied to derive the H, E and V components for each airport and climate scenario. The hazard value is defined as the probability that the daily maximum temperature exceeds T thr . Exposure and vulnerability capture, respectively, operational intensity at the airport and its sensitivity to the hazard due to infrastructural, environmental, and planning constraints. After the evaluation, all three components were normalized and aggregated according to Equation (1), obtaining a normalized, dimensionless metric of the overall climate-related risk. The final results are shown in Figure 3 in the form of a risk matrix.
The hazard is plotted against the product of exposure and vulnerability. Different colours identify different airports. Circles are calculated with historical data, whereas crosses represent the SSP5-8.5 scenario. Dashed lines connect the markers of the same airport. A shift upwards in the diagram indicates an increased hazard of TODR exceeding the runway length with a fully-laden A320-231, as a result of the increasing temperatures. A shift rightwards in the diagram corresponds to higher exposure (e.g., increased traffic) or vulnerability (e.g., infrastructural limitations and lack of adaptation measures). Airports here analyzed exhibit an upward or rightward trajectory or a combination of both, indicating that both the intensification of temperature hazard and the limited resilience of the current infrastructure contribute to an overall increase in risk. Barcelona and Rotterdam airports, for example, display a clear upward shift in hazard but no horizontal movement, meaning that while warming increases the probability of TODR exceedance, the exposure–vulnerability component remains effectively unchanged. In this framework, vulnerability can vary only through infrastructural modifications (e.g., runway extensions) or political decisions (e.g., implementation of noise restrictions), both of which are difficult to predict without direct collaboration with the relevant airport authorities. Exposure also remains constant for both airports in the transition from the historical to the future scenario. In the case of Rotterdam, the slight increase in flight volume projected by [14] is not sufficient to change the airport’s exposure class. Barcelona, on the other hand, is already in the highest exposure class, so further increases in traffic do not alter its exposure score. The magnitude of the hazard increase at Barcelona and Rotterdam airports is similar, in Figure 3. However, this resemblance is coincidental due to the combined effect of their slightly different runway lengths and different warming trends (see Figure 1). A comparable pattern is observed for Catania and Zurich, which display similar shifts despite their different climatic conditions and elevations. In both airports, the interaction between projected warming, increasing flights volume and runway length results in a comparable effect. For Zurich, elevation amplifies the sensitivity of TODR to temperature, whereas Catania the key driver is the warming expected in the Mediterranean basin. Although the mechanisms differ, their net effect is similar, placing both airports on analogous trajectories in the hazard–exposure–vulnerability space. Airports approaching the upper-right quadrant, i.e., high hazard and high exposure–vulnerability, can be identified as priority sites for adaptation measures, while those remaining near the lower-left quadrant show greater resilience under future conditions.

4. Discussion

The results highlight projected intensification of temperature-driven risk for airports. Airports located in warmer regions (e.g., Barcelona and Catania) and airports with shorter runways (e.g., Rotterdam) show an increased frequency of threshold-exceedance days, increasing hazard H. Airports with a single runway or with a steep forecast increase in flight traffic (e.g., Zurich) will have to cope with an increased exposure level indicating that infrastructure constraints and traffic pressure amplify climate sensitivity beyond meteorology alone. Since H represents a frequency, even seemingly low values carry operational significance: a hazard score of H = 0.08 , in Catania and Zurich future projections, corresponds to roughly thirty days per year in which MTOM limitations may occur. For airports with pronounced seasonality, these limitations may align with peak-traffic periods, potentially leading to delays, passenger inconvenience, and increased costs. For this reason, summer peak is one of the factors in the proposed vulnerability evaluation. It is important to stress that the presented results are obtained under worst-case configuration, combining daily maximum temperature with the high-emission SSP5-8.5 scenario. Assessing how the frequency of exceeding T thr vary under different climate scenarios would provide useful insight into the rate at which climate risk intensifies under different emission pathways. Additionally, the present status of the analysis does not account for how long the T thr exceedance lasts, whether for brief intervals or for several consecutive hours, a factor that can critically influence real-world operations and needs deeper investigation. The evaluated exposure scores are impacted by the uncertainty surrounding future traffic growth. EUROCONTROL’s Base scenario employed is considered the most probable. However, Ref. [14] highlights that long-term forecasts remain uncertain since strongly influenced by economic conditions, fuel prices, capacity constraints, and policy developments. This uncertainty should be kept in mind when interpreting future exposure–vulnerability levels. The exposed findings are consistent with previous studies showing climate change will increase TODR and lead to payload limitations [3,5]. In addition, this work broadens the perspective by combining climate-based results with operational exposure and structural vulnerability, integrating airports peculiarities into the risk assessment, contributing to a more systemic view of aviation climate risk. The purpose of this study was to develop an airport climate risk assessment framework based on publicly available data. This approach has the advantage of being easily applicable and uniformly transferable across airports, making it suitable for comparative assessments. However, it necessarily relies on simplifications and, therefore, provides approximations of temperature impacts on airport operations. As such, it should be used for preliminary assessment. A more accurate and site-specific risk analysis would require detailed operational data. Partnerships with airport authorities will be sought to obtain such data for future TODR modelling refinement, e.g., to more precisely compute runway friction loss under different conditions, improving accuracy. Additionaly, a more specific risk analysis done with proprietary data would enable validation of publicly available data-based results, quantifying the uncertainty introduced by data limitations. Our current approach presents additional limitations. First, climate inputs are derived from a single CMIP6 model, which does not capture the full range of uncertainty associated with inter-model variability. Using multi-model ensembles would provide an insight into predictions dependence on the considered model. Second, TODR is estimated under simplified assumptions: in the real world, tailwinds further increase TODR and climate change may also alter prevailing wind patterns, potentially increasing the intensity of tailwinds, and thus cause an additional constraint to operations. Similarly, runway slope significantly affects acceleration. Incorporating these realistic parameters is a priority for future work to refine the physical hazard modeling. Furthermore, this study focuses on the A320-231 aircraft, commonly adopted in the literature as representative of short-to-medium haul traffic in Europe. Heavier long-haul aircraft (e.g., A350, B777) or regional turboprops have distinct thrust-to-weight ratios, resulting in different sensitivities to temperature increases. The future development of the framework should include a representative range of aircraft to account for these variations. Third, exposure can include not only mean departure numbers but also other airport scheduling features such as peak clustering and non-uniform runway usage. Incorporating these features will yield a more accurate risk estimation, particularly at airports where peak traffic volume coincides with the hottest hours of the day. Finally, for the vulnerability component, the framework adopts a simple checklist in which all factors carry equal weight to prioritise usability. Future research could utilize historical delay analyses or expert knowledge elicitation to assign relative weights based on cause frequency, calibrating the index to better reflect the real-world operational impact of each vulnerability factor. Despite limitations, the framework offers a scalable tool to understand how warming temperatures may shift operational risk profiles across airports. By highlighting where risk will increase, it supports early awareness and helps stakeholders begin identifying mitigation actions. The approach has been discussed with aviation stakeholders as part of the AEROPLANE project receiving positive feedback and highlighting clear directions for future development [15]. Priority extensions include incorporation of headwind effects, integration of climb performance into the hazard metric, and inclusion of a broader set of commonly operated aircraft models. These improvements will enhance the realism and operational relevance of the framework. From an adaptation perspective, results suggest leverage points to reduce future risk from infrastructure upgrades (e.g., runway extensions) and operational adaptation (e.g., rescheduling flights to cooler hours) to a transition to next-generation aircraft with improved thrust-to-weight ratios, offsetting TODR penalties. This study focuses on temperature-driven TODR limitations. The same framework can be applied to other weather phenomena, provided that the appropriate operational threshold are considered in the Hazard component (e.g., wind speeds for tailwind or braking action for precipitation).

5. Conclusions

This study shows that warming levels expected by mid-century can substantially increase the TODR, with the A320-231 model showing an average increase of about 8.8 m per degree Celsius. Consequently, a warmer climate will also increase the frequency of conditions where TODR exceeds the available runway length, imposing operational constraints. Airports with short runways, high traffic intensity, and limited recent investment show a rise in risk values, indicating that high traffic intensity and infrastructural limitations amplify the physical hazard imposed by climate change. Future improvements should include multi-model climate ensembles, refined traffic and runway usage data, airport-specific vulnerability indicators, and extension to other climate-related hazards, such as extreme winds and precipitation. Overall, increasing air temperatures are expected to degrade aircraft take-off performance and challenge airport operational resilience. The proposed framework provides a foundation for anticipating future risks and designing tailored adaptation and mitigation strategies in the aviation sector.

Author Contributions

Conceptualization, L.C. and C.A.; methodology, C.A.; software, L.C.; data curation, S.D.G., A.M. and G.M.; writing—original draft preparation, L.C.; writing—review and editing, C.A., S.D.G. and A.M. All authors have read and agreed to the published version of the manuscript.

Funding

The research work for this article is part of the AEROPLANE project which is supported by the SESAR 3 Joint Undertaking and its founding members over GA nr. 101114682.

Institutional Review Board Statement

Not applicable.

Informed Consent Statement

Not applicable.

Data Availability Statement

Data supporting the findings of this study are available from the corresponding author upon request.

Acknowledgments

The authors thank P. D. Williams and J. Williams for the helpful discussions on take-off modelling.

Conflicts of Interest

The authors declare no conflicts of interest. Authors are employed by Deep Blue s.r.l. and Amigo s.r.l.

Abbreviations

ISAInternational Standard Atmosphere
MTOMMaximum Take-Off Mass
TODRTake-Off Distance Required

References

  1. Kanitkar, T.; Mythri, A.; Jayaraman, T. Equity assessment of global mitigation pathways in the IPCC Sixth Assessment Report. Clim. Policy 2024, 24, 1129–1148. [Google Scholar] [CrossRef]
  2. Krakauer, N.Y. It Is Normal: The Probability Distribution of Temperature Extremes. Climate 2024, 12, 204. [Google Scholar] [CrossRef]
  3. Williams, J.; Williams, P.D.; Guerrini, F.; Venturini, M. Quantifying the Effects of Climate Change on Aircraft Take-Off Performance at European Airports. Aerospace 2025, 12, 165. [Google Scholar] [CrossRef]
  4. Gratton, G.; Padhra, A.; Rapsomanikis, S.; Williams, P.D. The impacts of climate change on Greek airports. Clim. Change 2020, 160, 219–231. [Google Scholar] [CrossRef]
  5. Zhou, Y.; Zhang, N.; Li, C.; Liu, Y.; Huang, P. Decreased takeoff performance of aircraft due to climate change. Clim. Change 2018, 151, 463–472. [Google Scholar] [CrossRef]
  6. Airbus, S.A.S. Getting to Grips with Aircraft Performance. Technical Report, SKYbrary Aviation Safety/AIRBUS. 2002. Available online: https://skybrary.aero/sites/default/files/bookshelf/2263.pdf (accessed on 13 November 2025).
  7. Rowan Kelleher, S. Flight Delays Monday: Extreme Heat Disrupts Air Travel. Forbes, 28 July 2025. Available online: https://www.forbes.com/sites/suzannerowankelleher/2025/07/28/flight-delays-monday-extreme-heat-disrupts-air-travel/ (accessed on 13 November 2025).
  8. Coffel, E.D.; Thompson, T.R.; Horton, R.M. The impacts of rising temperatures on aircraft takeoff performance. Clim. Change 2017, 144, 381–388. [Google Scholar] [CrossRef]
  9. Core Writing Team; Pachauri, R.K.; Meyer, L.A. Climate Change 2014: Synthesis Report. Contribution of Working Groups I, II and III to the Fifth Assessment Report of the Intergovernmental Panel on Climate Change; IPCC: Geneva, Switzerland, 2014; p. 151. Available online: https://www.ipcc.ch/site/assets/uploads/2018/02/SYR_AR5_FINAL_full.pdf (accessed on 13 November 2025).
  10. Trentini, L.; Dal Gesso, S.; Venturini, M.; Guerrini, F.; Calmanti, S.; Petitta, M. A Novel Bias Correction Method for Extreme Events. Climate 2022, 11, 3. [Google Scholar] [CrossRef]
  11. Trentini, L.; Venturini, M.; Guerrini, F.; Dal Gesso, S.; Calmanti, S.; Petitta, M. Identifying climate extremes in Southern Africa through advanced bias correction of climate projections. Bull. Atmos. Sci. Technol. 2025, 6, 9. [Google Scholar] [CrossRef]
  12. European Union Aviation Safety Agency. Easy Access Rules for Large Aeroplanes (CS-25). Available online: https://www.easa.europa.eu/en/document-library/easy-access-rules/easy-access-rules-large-aeroplanes-cs-25 (accessed on 13 November 2025).
  13. Sun, J.; Hoekstra, J.; Ellerbroek, J. OpenAP: An open-source aircraft performance model for air transportation studies and simulations. Aerospace 2020, 7, 104. [Google Scholar] [CrossRef]
  14. EUROCONTROL. EUROCONTROL Aviation Outlook 2050. Available online: https://www.eurocontrol.int/publication/eurocontrol-aviation-outlook-2050 (accessed on 13 November 2025).
  15. Moser, A.; Dal Gesso, S.; Venturini, M.; Abate, C.; De Bortoli Vizioli, A. A Climate Risk Assessment Framework for Heatwave Impacts on Airport Operations in Europe. Italian Society for Climate Sciences (SISC), Salerno, Italy. 2025; manuscript in preparation.
Figure 1. Temperature distribution comparison between the historical baseline (grey-dotted) and future climate scenarios SSP1-2.6, SSP3-7.0, and SSP5-8.5 (green-dashed, yellow-dot-dashed and red-solid, respectively) for the six analyzed airports: (a) Barcelona, (b) Catania, (c) Dublin, (d) Palma de Mallorca, (e) Rotterdam, and (f) Zurich. The curves represent the distribution of daily maximum temperatures, showing the projected shift toward higher values under future emission scenarios.
Engproc 133 00074 g001
Figure 2. Relationship between TODR and temperature for the reference fully-laden A320 aircraft model at ISA condition. The linear fit illustrates the quasi-linear dependence of TODR on temperature.
Engproc 133 00074 g002
Figure 3. Risk matrix combining the hazard (y-axis, logarithmic scale) and the product of exposure × vulnerability (x-axis) for each studied airport. Lines connect each airport’s position between the historical baseline and SSP5-8.5 scenario, illustrating the projected evolution of overall climate risk.
Engproc 133 00074 g003
Disclaimer/Publisher’s Note: The statements, opinions and data contained in all publications are solely those of the individual author(s) and contributor(s) and not of MDPI and/or the editor(s). MDPI and/or the editor(s) disclaim responsibility for any injury to people or property resulting from any ideas, methods, instructions or products referred to in the content.