Proceeding Paper

AI-Driven Non-Intrusive Aircraft Icing Detection Using Control Surface Sensors †
by
Gabriel Meisler
1,2,*,
Ouassim Bara
1,
Valérie Pommier-Budinger
2 and
Michael Bauerheim
2
1
Airbus Operations SAS, 316 Route de Bayonne, 31060 Toulouse, France
2
Institut Supérieur de L’Aéronautique et de L’Espace (ISAE-SUPAERO), Université de Toulouse, 10 Avenue Edouard Belin, 31400 Toulouse, France
*
Author to whom correspondence should be addressed.
Presented at the 15th EASN International Conference, Madrid, Spain, 14–17 October 2025.
Eng. Proc. 2026, 133(1), 123; https://doi.org/10.3390/engproc2026133123
Published: 13 May 2026

Abstract

Ice accretion can significantly degrade aircraft performance and hinder its operational capacities. The ability to detect and characterize ice formation in real time is paramount for enabling timely mitigation strategies. Existing solutions for in-flight ice detection are either physically intrusive, require dedicated hardware that offers only localized readings, or are operationally impractical, depending on complex dynamic models or flight maneuvers unsuitable for standard commercial use. This context highlights a pertinent need for non-intrusive and robust methodologies for detecting actual ice accretion on aircraft. This article proposes a novel, non-intrusive Artificial Intelligence (AI)-driven methodology for real-time aircraft icing detection through the leveraging of data obtained from existing control surface sensors, namely from the aircraft’s ailerons. A supervised learning database was compiled from an Airbus aircraft flight test campaign. In this dataset, flight tests with artificial ice shapes model aircraft behavior under icing conditions, while ice-free tests performed under analogous flight domains represent the nominal scenario. A gradient boosting model was trained on the dataset and evaluated for its performance in accurately identifying the presence of ice accretion. The research shows that aileron sensor data provides sufficient discriminating capacity for in-flight ice accretion detection.

1. Introduction

The adverse impacts of aircraft icing have been recognized since the early years of commercial aviation [1]. Among these effects, performance degradation is one of the most significant consequences, as it can lead to the hindering of an aircraft’s operational capacities [2]. To fight this challenge, most modern aircraft are equipped with specialized Ice Protection Systems (IPSs), which aim at removing existent ice buildup (deicing) or preventing ice accretion altogether (anti-icing).
Although IPSs significantly mitigate the risks associated with aircraft icing, they present their own set of challenges. First, IPS activation is on its own detrimental to aircraft performance as it, along with Environmental Control Systems (ECSs), consumes the majority of non-propulsive power in modern aircraft [3]. As IPS engagement is often an unautomated decision of the flight crew, providing reliable assessment of the aircraft’s actual exposure to ice accretion is imperative for ensuring well-informed decision-making, consequently avoiding unnecessary energy consumption and the associated efficiency penalties.
Second, the activation of the IPS does not immediately guarantee the complete absence of ice accretion on critical aerodynamic surfaces [4]. Pneumatic deicing boots, for instance, are susceptible to residual ice accumulation between cycles [5]. Moreover, their effectiveness can be limited by ice formation aft of their protected zones [6]. Thermal anti-icing systems, which rely on surface heating to avoid ice buildup, are equally exposed to ice formation beyond their limits [7]. Such runback ice can even be formed as a direct consequence of the system’s operation, when the initially melted ice refreezes further aft of the heated area [8].
In light of this context, ice detection systems are crucial not only for guiding pilot IPS activation, but also for monitoring the system’s effectiveness once activated. The current state-of-the-art ice detector includes two main branches: direct and indirect methodologies. Direct detection systems rely on specialized sensors physically mounted onto the aircraft, such as vibration probes [9], impedance-based systems [10] and ultrasonic waves sensors [11]. Indirect methodologies, on the other hand, infer the presence of ice by analyzing how an aircraft’s behavior deviates from a nominal baseline [12].
Nevertheless, both categories present drawbacks. First, direct methodologies require mounting specific hardware on the aircraft, which increases its design complexity, production costs and energy consumption needs. In addition, these solutions provide localized detection, indicating the presence of ice accretion only in the immediate vicinity of their installation. As these probes are usually mounted on the aircraft’s nose, a positive sensor detection does not imply ice buildup on other critical areas, such as the wings and tail [13]. Indirect methodologies, in turn, often require highly representative models of the aircraft’s nominal behavior across all flight domains to establish a reference baseline, which is challenging to acquire. In addition, solutions based on the estimation of aerodynamic derivatives often require aircraft excitation maneuvers that are unsuitable for standard commercial applications [4].
These limitations expose the need for a non-intrusive solution capable of robustly identifying aircraft in-flight ice accretion, particularly on its aerodynamic surfaces. To address the aforementioned limitations, such a solution should detect ice without requiring (i) additional hardware, (ii) intricate dynamic models, or (iii) artificial aircraft excitation.
To this end, a novel methodology for aircraft ice detection based on the aerodynamic impacts of ice accretion on control surfaces is proposed. The solution relies on the principle that ice accretion on an aircraft’s wings and tail modifies their aerodynamic profile, thereby altering their geometrical properties. This subsequently disrupts the airflow, leading to localized pressure variations around the contaminated lifting surfaces that can propagate towards their trailing edges, as indicated in Figure 1. In sections housing control surfaces, these aerodynamic perturbations may induce observable pressure distribution and hinge moment deviations from nominal operations [14,15]. Therefore, by collecting control surface load data over time for both iced and ice-free flights, a machine learning model could be trained to distinguish ice-induced anomalous behavior from nominal conditions.
While the solution’s guiding principle can be extended to any main aircraft control surface—including its elevator, rudder, flaps and ailerons—the scope of this article will be limited to the latter, with the goal of providing an initial proof of concept. The high number of recorded ice-induced incidents related to ailerons, notably ice-related aileron hinge moment reversal [6], motivates the choice of these control surfaces over the others.

2. Materials and Methods

2.1. Flight Test Data

Currently, the biggest challenges in developing machine learning models for in-flight ice accretion detection stem from the scarcity of representative, high-fidelity data from real-world iced-aircraft operations. This scarcity arises from three main factors: (i) the safety risks of deliberately flying into potentially hazardous icing conditions; (ii) the often prohibitive costs of conducting extensive flight tests solely for data collection; (iii) in cases where commercial aircraft data is available, the difficulty of accurately annotating the moments in those flights where ice accretion was present.
In order to circumvent these issues, this study leverages flight tests performed in the certification campaign of an Airbus aircraft. To represent iced-aircraft behavior, flight tests with artificial ice shapes are employed. These shapes, made from light materials, simulate the aerodynamic impacts of critical ice accretion patterns [16]. As these flights are part of a mandatory certification campaign, the safety risks are intrinsically managed, and no additional financial resources need to be allocated. In addition, the annotation problem is inherently solved, as the aircraft’s iced configuration is known a priori. To complete the dataset, clean certification flights are used to represent the ice-free flight class.
To maintain dataset consistency, all leveraged flight tests are performed in equivalent flight domains, which include climbing, cruise, landing, and stall approach phases. Furthermore, to ensure the data is representative of real-world icing phenomena, all data points with a Mach number ≥ 0.6 are excluded. This is because aerodynamic heating prevents the formation of natural icing at such high speeds [1]. However, unlike actual ice accretion, the artificial ice shapes used to generate the leveraged dataset are not altered by such heating and, therefore, do not melt or sublimate. Including this data would consequently introduce patterns unrepresentative of real-world applications, potentially harming the model’s practical applicability. The final dataset comprises seven artificial ice shapes and six ice-free flight tests, amounting to approximately 22 and 21 h of in-flight data, respectively.

2.2. Collected Parameters

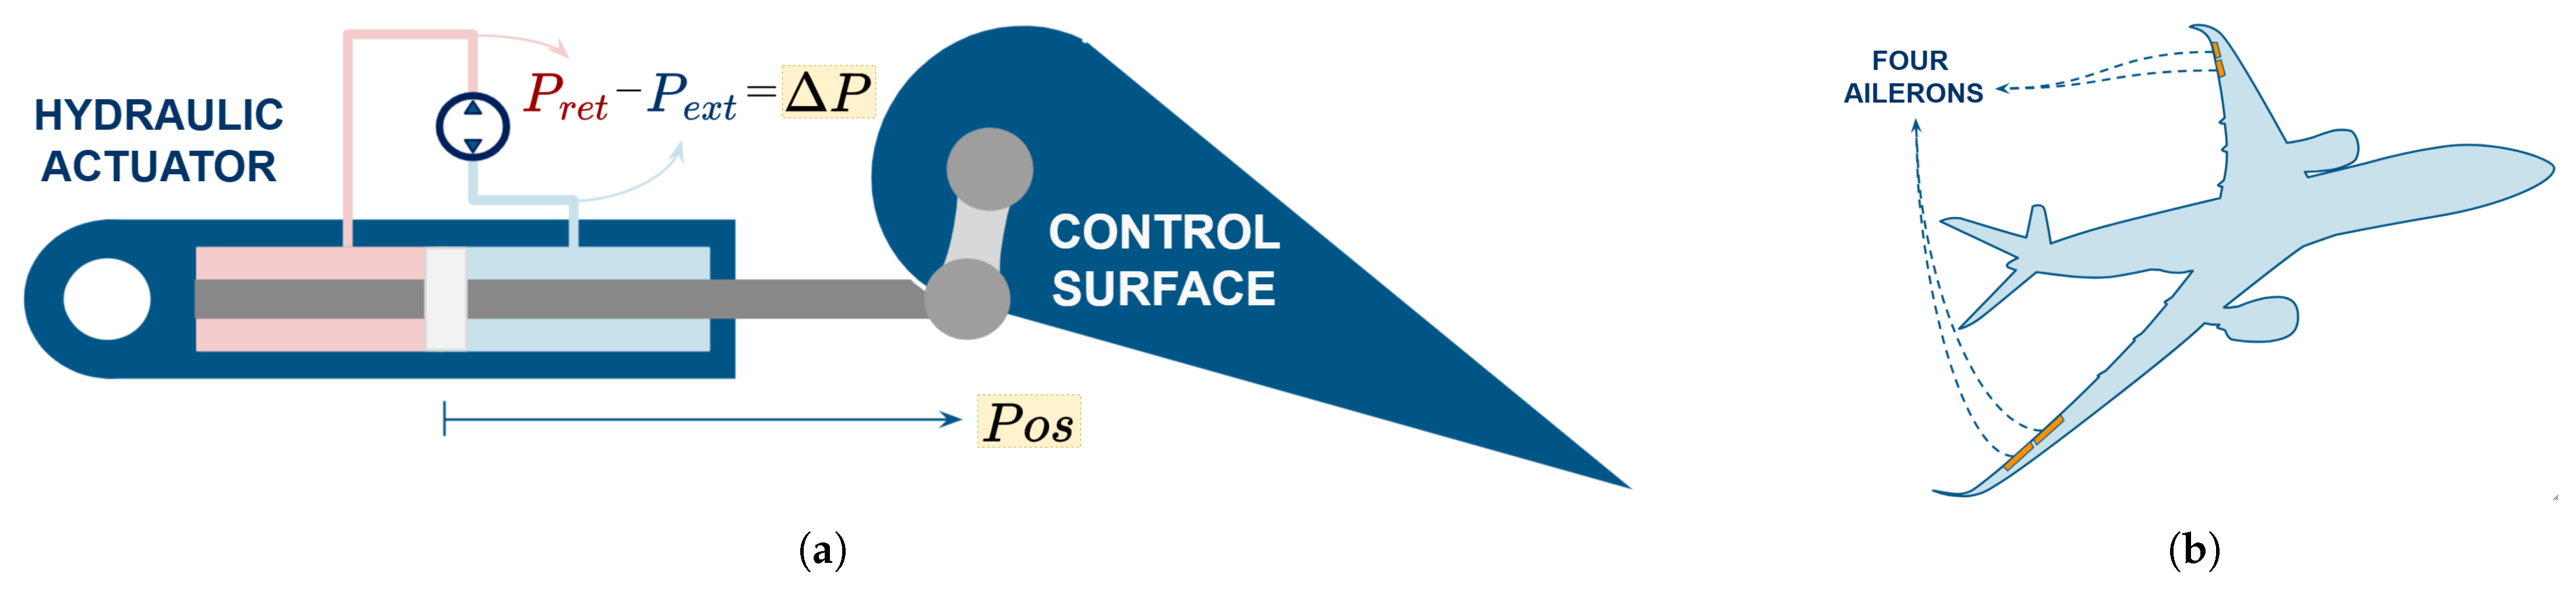
For each flight in the dataset, ten parameters are collected with a sampling rate of 1 Hz, which can be divided into two groups. First, sensors on the hydraulic actuator of each aileron are used to collect (i) the actuator’s valve position P o s and (ii) the pressure differential between its hydraulic chambers Δ P , as indicated in Figure 2. Since the considered aircraft contains four ailerons, this yields eight parameters. The pressure differential is directly related to the load on the control surface, thus providing a measurable representation of the pressure and hinge moment applied on the aileron. As presented in Section 1, ice-induced deviations in these quantities are precisely what the machine learning model is expected to capture for the ice detection task. Moreover, the position parameter, which represents the control surface deflection, provides context concerning the airflow conditions to which the aileron is exposed. Second, the aircraft’s Angle of Attack (AoA) and Mach Number are collected to provide further information on the overall aircraft’s flight condition, comprising the final two parameters.

2.3. Feature Generation: From Time-Series to Tabular Data

Each flight is segmented into rolling windows and assigned a binary label (iced or ice-free) based on the flight test category from which it originates. Each rolling window is 60 s in duration and contains the ten parameters presented in Section 2.2. The one-minute length was chosen to attenuate the impact of shorter-term perturbations (such as turbulence) that could be mistaken for ice accretion by the ML model. A stride of 1 s is implemented.
From each rolling window, a set of descriptive statistical features are then extracted, thereby converting the temporal data into a tabular format. The features, which are calculated with the TsFresh python library [17], were chosen to capture various aspects of the time-series signals, including basic distributional properties, temporal dependencies and complexity measurements. These features are listed in Table 1. For the Angle of Attack and Mach Number, which serve a contextual role, the extracted features were limited to a smaller subset, as indicated in the table’s last column. The final dataset contains approximately 156,000 samples with 224 features.
Although the transformation of temporal data into static features may suppress temporal dependency information, this approach significantly enhances result interpretability, justifying its adoption. By transforming raw time series into human-understandable features, the model’s predictions can be mapped back to specific properties of the input signals through dedicated feature importance analysis. This mapping provides clarification of the model’s internal workings, something highly valuable for eventual certification processes. Additionally, it reveals the specific signal characteristics that provide the highest discriminating power for ice detection, which may be useful for the development of more targeted detection algorithms in the future.

2.4. ML Model

For the classification task, a Light Gradient Boosting Machine (LightGBM) model was employed [18]. A gradient boosting machine (GBM) architecture was selected over a neural network based on extensive evidence of comparable performance on tabular data [19,20], coupled with the GBM’s advantages of lower model complexity and more straightforward hyperparameter tuning. Within the family of GBMs, the LightGBM was selected for its high training efficiency, low inference latency for real-time applications, and performance competitive with other state-of-the-art GBMs [21].

2.5. Model Evaluation Methodology

Model evaluation was performed using a 5 × 4 nested cross-validation (NCV) [22], partitioning the data by flight to ensure all instances from a single flight remained in the same fold. This flight-level partitioning is necessary because instances within a flight are not independent, exhibiting correlations that strengthen with temporal proximity. Instance-level splitting would cause data leakage if, for example, neighboring instances were distributed across different folds, resulting in optimistically biased metrics that do not accurately reflect generalization performance.
This strategy, however, introduces a trade-off. The small number of unique flights (the effective splitting units) makes the creation of balanced cross-validation folds difficult. Some heterogeneity between folds is, therefore, an expected consequence. This inter-fold heterogeneity makes a single train/test split unreliable, as the holdout set may be unrepresentative, containing flights that are overly easy or hard to classify. Although a standard k-fold cross-validation would increase the representativeness of the performance assessment, it would still be unsuitable for hyperparameter selection, as it produces an optimistic bias by tuning parameters on the same partitions used for final testing.
The nested cross-validation framework is therefore used to address these issues. The outer loop of the NCV, much like a standard CV, provides a stable and more representative performance estimate by averaging across multiple folds, which mitigates the risk of an unrepresentative split. The inner loops, nested within each outer training fold, are used exclusively for hyperparameter selection, ensuring a separation between the data used for model tuning from the data used for final performance evaluation.
Within these inner loops, LightGBM hyperparameters were optimized using the Area Under the Receiver Operating Characteristic (AUC-ROC) [23] as the objective metric. AUC-ROC provides a robust measure of the model’s overall discriminative power (1.0 = perfect; 0.5 = random chance). The hyperparameters were optimized via a grid search defined by the following space: Learning Rate ([0.005, 0.01, 0.05, 0.1, 0.2]), Number of Estimators ([50, 150, 300, 450]), Max. Leaves per Tree ([21, 31, 41]), L2 Regularization ([0, 1, 5]), and Column Subsampling Ratio ([0.8, 0.9, 1.0]).

3. Results and Discussion

3.1. Model Performance

Table 2 summarizes the model’s performance. The standard deviation across the five folds serves as an indication of performance stability.
Overall, the results demonstrate that the selected machine learning and feature extraction pipeline can reliably discriminate between iced and ice-free flights, with accuracies consistently around 93% in all cross-validation sets. In addition, the average precision and recall scores indicate an overall low incidence of false alarms and undetected ice events, respectively. Nevertheless, the observed predictive performance is accompanied by high variance in the calculated metrics among the external validation folds, most notably in the recall score. These variations likely stem from the inter-fold heterogeneity discussed in Section 2.5, which results in differing classification difficulty across the folds. This claim is supported by the fact that the introduction of additional regularization failed to reduce score variability, suggesting the problem is unlikely to be caused by possible architecture-related model exposure to overfitting. The non-inclusion of a confounding variable in the dataset is also a possible contributing factor.

3.2. Hyperparameter Selection

Following the hyperparameter selection methodology defined in Section 2.5, a consensus was reached across all outer folds for the maximum Learning Rate (0.2), the minimum Max. Leaves per Tree (21), and no L2 Regularization (0). Conversely, the optimal values were fold-dependent for the Number of Estimators (selected as either 300 or 450) and the Column Subsampling Ratio (0.8 or 0.9). These findings suggest the model consistently performs best as an ensemble of many simple trees, learning at a fast rate and relying on structural rather than L2 regularization.

3.3. Feature Importance

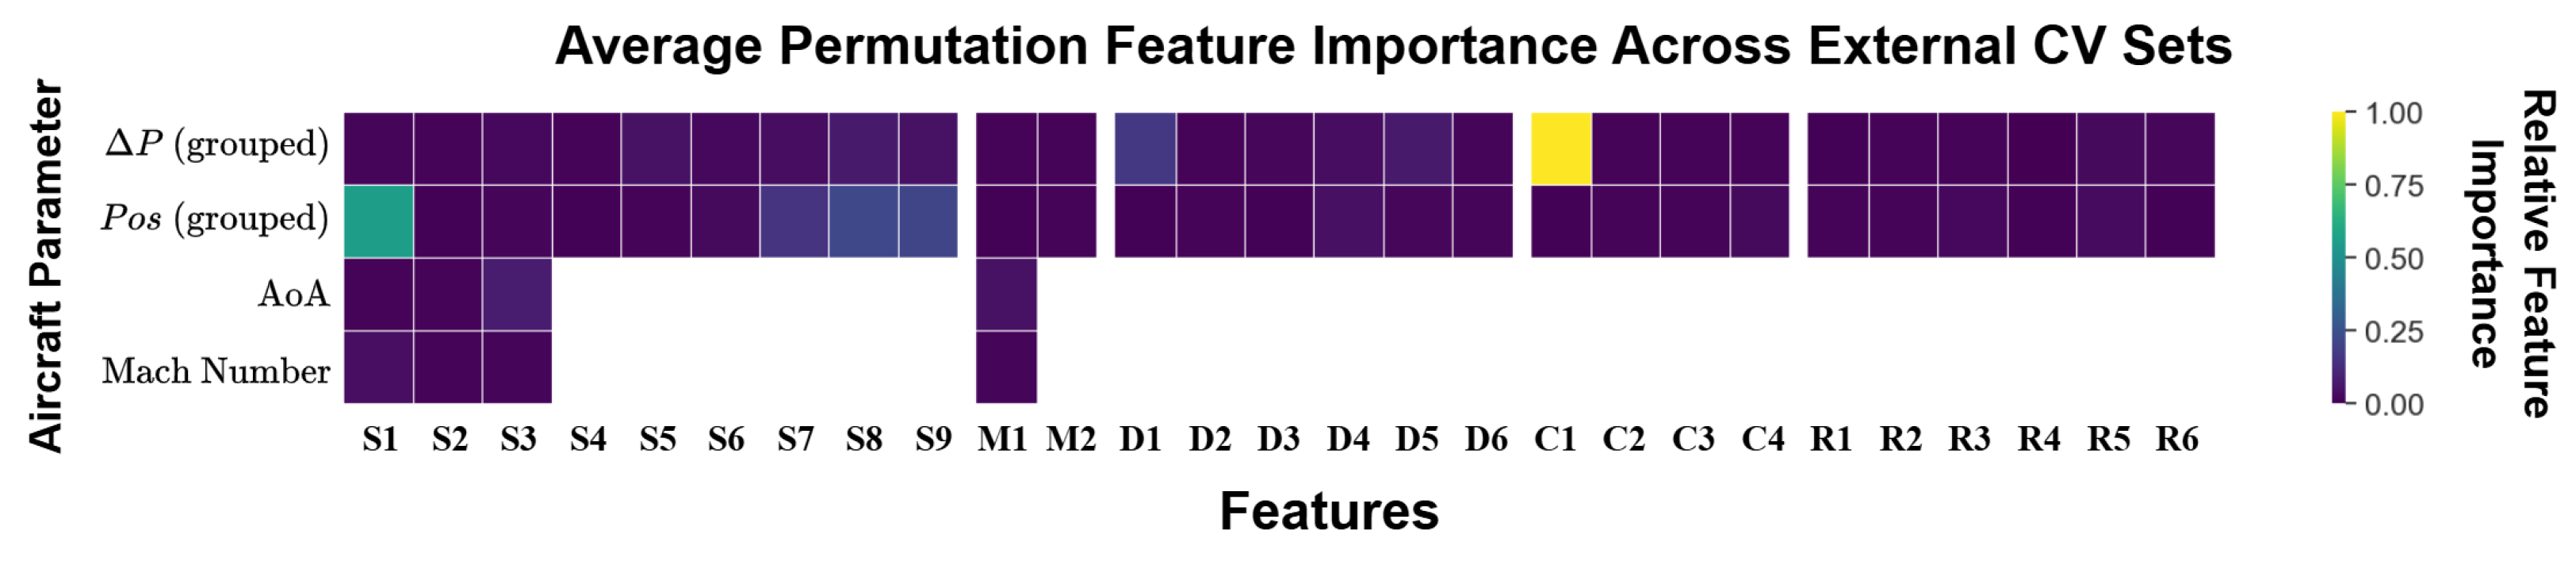
The feature importance analysis results are presented in Figure 3. The analysis was performed using a grouped permutation, in which for each statistical metric (Table 1), the corresponding features from the four pressure differential ( Δ P ) and four deflection ( P o s ) parameters were grouped and simultaneously permuted to assess the impact on the prediction outcome. This approach was implemented to (i) counter an expected multicollinearity among Δ P and P o s derived features, as all four ailerons react similarly to the simulated ice, and to (ii) determine the predictive value of the overall physical concept (e.g., “mean aileron Δ P ”) rather than the individual importance of that feature for each isolated aileron.
The feature importance analysis reveals two main findings. First, for the Δ P (pressure) variables, the model’s most relevant predictor is the Complexity Index (C1) [24], a feature representative of the signal unsteadiness. This observation is physically sound, as ice-induced flow separation is known to cause hinge moment (and consequently pressure) fluctuations [14]. In contrast, for the P o s variables, the model relies mainly on the signal median (S1). This suggests the model is not tracking unsteadiness in the aileron’s deflection, but rather using its position to properly interpret and contextualize the fluctuations in Δ P . Notably, features extracted from the Mach and AoA signals did not rank among the most important predictors.

4. Conclusions and Future Perspectives

This paper presented a novel, non-intrusive, AI-driven methodology for in-flight aircraft icing detection. To this end, a dataset was constructed from an Airbus flight test campaign, which contained flights with and without artificial ice shapes. A LightGBM model was then trained using data from existing aileron sensors, supported by contextual parameters. A nested cross-validation analysis demonstrated that the selected features provide sufficient discerning capacity for the ice-detection task, with accuracies consistently around 93% being achieved. Nevertheless, due to the limited number of flight tests available, a reduced stratification capacity across different validation folds led to variance in the evaluation metrics. Building on these findings, potential next steps comprise enlarging the dataset with additional flights and extending the analytical framework to include other control surfaces, such as the elevator and rudder. Additionally, future work will focus on validating the model’s generalization capabilities across different aircraft of similar configurations.

Author Contributions

Conceptualization, G.M., O.B., V.P.-B. and M.B.; methodology, G.M.; software, G.M.; validation, G.M. and O.B.; formal analysis, G.M.; investigation, G.M.; data curation, G.M.; writing—original draft preparation, G.M.; writing—review and editing, G.M., O.B., V.P.-B. and M.B.; visualization, G.M.; supervision, O.B., V.P.-B. and M.B. All authors have read and agreed to the published version of the manuscript.

Funding

This work has been funded by Airbus Operations SAS and the French National Agency for Technological Research (ANRT) under grant number 2024/144.

Institutional Review Board Statement

Not applicable.

Informed Consent Statement

Not applicable.

Data Availability Statement

Due to industrial confidentiality, the data supporting the findings of this study cannot be made publicly available.

Conflicts of Interest

Authors G.M. and O.B. were employed by the company Airbus Operations SAS. The remaining authors declare that the research was conducted in the absence of any commercial or financial relationships that could be construed as a potential conflict of interest.

References

  1. Gent, R.W.; Dart, N.P.; Cansdale, J.T. Aircraft Icing. Philos. Trans. R. Soc. Lond. Ser. A 2000, 358, 2873–2911. [Google Scholar] [CrossRef] [Scilit]
  2. Advisory Group for Aerospace Research & Development. Ice Accretion Simulation; AGARD-AR-344; NATO: Brussels, Belgium, 1997. [Google Scholar]
  3. Chakraborty, I.; Ozcan, M.F.; Mavris, D.N. Effect of Major Subsystem Power Off-takes on Aircraft Performance in More Electric Aircraft Architectures. In Proceedings of the 15th AIAA Aviation Technology, Integration, and Operations Conference, Dallas, TX, USA, 22–26 June 2015. [Google Scholar]
  4. Deiler, C.; Fezans, N. Performance-Based Ice Detection Methodology. J. Aircr. 2020, 57, 209–223. [Google Scholar] [CrossRef] [Scilit]
  5. Broeren, A.P.; Bragg, M.B. Effect of Residual and Intercycle Ice Accretions on Airfoil Performance; DOT/FAA/AR02/68; Federal Aviation Administration, Office of Aviation Research: Washington, DC, USA, 2002. Available online: https://www.faa.gov/sites/faa.gov/files/aircraft/air_cert/design_approvals/small_airplanes/aceReportAR-02-68.pdf (accessed on 24 July 2025).
  6. Bragg, M. Aircraft Aerodynamic Effects Due to Large Droplet Ice Accretions. In Proceedings of the 34th Aerospace Sciences Meeting and Exhibit, Reno, NV, USA, 15–18 January 1996. [Google Scholar]
  7. Broeren, A.P.; Whalen, E.A.; Busch, G.T.; Bragg, M.B. Aerodynamic Simulation of Runback Ice Accretion; NASA/TM-2010-215676; National Aeronautics and Space Administration, Glenn Research Center: Cleveland, OH, USA, 2010. Available online: https://ntrs.nasa.gov/api/citations/20100012829/downloads/20100012829.pdf (accessed on 24 July 2025).
  8. Al-Khalil, K.M.; Keith, T.G.; De Wittt, K.J. New Concept in Runback Water Modeling for Anti-Iced Aircraft Surfaces. J. Aircr. 1993, 30, 41–49. [Google Scholar] [CrossRef] [Scilit]
  9. Werner, F.D.; Grindheim, E.A. Ice Detector. U.S. Patent US3341835A, 12 September 1967. [Google Scholar]
  10. Jarvinen, P.O. Total Impedance and Complex Dielectric Property Ice Detection System. U.S. Patent US7439877B1, 21 October 2008. [Google Scholar]
  11. Watkins, R.D.; Gillespie, A.B.; Deighton, M.O.; Pike, R.B.; Scott-Kestin, C.B. Ice Detector. U.S. Patent US4604612A, 5 August 1986. [Google Scholar]
  12. Løw-Hansen, B.; Hann, R.; Stovner, B.N.; Johansen, T.A. UAV Icing: A Survey of Recent Developments in Ice Detection Methods. IFAC-PapersOnLine 2023, 56, 10727–10739. [Google Scholar] [CrossRef] [Scilit]
  13. Ikiades, A. Fiber Optic Ice Sensor for Measuring Ice Thickness, Type and the Freezing Fraction on Aircraft Wings. Aerospace 2023, 10, 31. [Google Scholar] [CrossRef] [Scilit]
  14. Gurbacki, H.M.; Bragg, M.B. Sensing Aircraft Icing Effects by Flap Hinge-Moment Measurement. In Proceedings of the 17th AIAA Applied Aerodynamics Conference, Norfolk, VA, USA, 28 June–1 July 1999. [Google Scholar]
  15. Lee, S. Effects of Supercooled Large-Droplet Icing on Airfoil Aerodynamics. Ph.D. Dissertation, University of Illinois at Urbana-Champaign, Urbana, IL, USA, 2001. [Google Scholar]
  16. Kind, R.J.; Potapczuk, M.G.; Feo, A.; Golia, C.; Shah, A.D. Experimental and computational simulation of in-flight icing phenomena. Prog. Aerosp. Sci. 1998, 34, 257–354. [Google Scholar] [CrossRef] [Scilit]
  17. Christ, M.J.; Braun, N.A.; Neuffer, J.; Kempa-Liehr, A.W. Time Series FeatuRe Extraction on basis of Scalable Hypothesis tests (tsfresh–A Python package). Neurocomputing 2018, 307, 72–77. [Google Scholar] [CrossRef] [Scilit]
  18. lightgbm: Light Gradient Boosting Machine. Available online: https://github.com/Microsoft/LightGBM (accessed on 8 August 2025).
  19. Shwartz-Ziv, R.; Armon, A. Tabular data: Deep learning is not all you need. Inf. Fusion 2022, 81, 84–90. [Google Scholar] [CrossRef] [Scilit]
  20. Gorishniy, Y.; Rubachev, I.; Khrulkov, V.; Babenko, A. Revisiting deep learning models for tabular data. Adv. Neural Inf. Process. Syst. 2021, 34, 18932–18943. [Google Scholar]
  21. Bentéjac, C.; Csörgő, A.; Martínez-Muñoz, G. A comparative analysis of gradient boosting algorithms. Artif. Intell. Rev. 2021, 54, 1937–1967. [Google Scholar] [CrossRef] [Scilit]
  22. Stone, M. Cross-Validatory Choice and Assessment of Statistical Predictions. J. R. Stat. Soc. Ser. B Methodol. 1974, 36, 111–133. [Google Scholar] [CrossRef] [Scilit]
  23. Bradley, A.P. The use of the area under the ROC curve in the evaluation of machine learning algorithms. Pattern Recogn. 1997, 30, 1145–1159. [Google Scholar] [CrossRef] [Scilit]
  24. Batista, G.E.; Keogh, E.J.; Tataw, O.M.; De Souza, V.M. CID: An efficient complexity-invariant distance for time series. Data Min. Knowl. Discov. 2014, 28, 634–669. [Google Scholar] [CrossRef] [Scilit]

Figure 1. Simplified airflow representation over an airfoil with a flap-like control surface for (a) ice-free and (b) iced conditions.
Engproc 133 00123 g001
Figure 2. (a) Simplified scheme of an aileron actuator and physical representation of P o s and Δ P parameters. (b) The considered Airbus aircraft contains two outboard and two inboard ailerons.
Engproc 133 00123 g002
Figure 3. Grouped permutation feature importance results. The results indicate average feature importance across the five cross-validation folds.
Engproc 133 00123 g003
Table 1. List of extracted time-series features. All the features were extracted with TsFresh.
No.FeatureObservationMach & AoA
1. Basic Statistics & Distribution
S1Median
S2Mean
S3Standard Deviation
S4Skewness
S5Kurtosis
S610th Percentile
S725th Percentile
S875th Percentile
S990th Percentile
2. Signal Magnitude & Energy
M1Root Mean Square
M2Absolute Energy
3. Signal Dynamics and Volatility
D1Mean Absolute Change
D2Mean Second Derivative
D3Slope of Linear Regression Line
D4Mean Change in Bottom 20%
D5Mean Change in Top 20%
D6Longest Strike Above Mean
4. Complexity & Structure
C1Complexity Index (CID)
C2Count of Ricker Wavelet PeaksMaximum width n = 5
C3Binned Entropy10 bins
C4Lempel–Ziv Complexity10 bins
5. Temporal Dependence (Autocorrelation)
R1AutocorrelationLag τ = 1
R2AutocorrelationLag τ = 2
R3AutocorrelationLag τ = 3
R4Partial AutocorrelationLag τ = 2
R5Partial AutocorrelationLag τ = 3
R6Partial AutocorrelationLag τ = 4
Table 2. Nested CV results: average performance from the outer folds after hyperparameter tuning. The value is presented as the metric’s average ± standard deviation across the 5 outer folds.
AUC-ROCAccuracyPrecisionRecallF1
0.92 ± 0.04 0.93 ± 0.03 0.92 ± 0.03 0.93 ± 0.09 0.92 ± 0.05
Disclaimer/Publisher’s Note: The statements, opinions and data contained in all publications are solely those of the individual author(s) and contributor(s) and not of MDPI and/or the editor(s). MDPI and/or the editor(s) disclaim responsibility for any injury to people or property resulting from any ideas, methods, instructions or products referred to in the content.