1. Introduction
In recent years, there has been significant development of aeronautical technologies in the field of vertical take-off and landing (VTOL), especially for urban air mobility (UAM). These innovations represent a major step towards efficient, safe and sustainable air operations in urban environments. The most common VTOL configurations, which combine vertical take-off and landing capability with efficient forward flight, include three basic types: tilt-propulsion, lift-cruise concept and the tilt-wing. This article focuses on the last of these—the tilt-wing configuration.
A dynamic model and flight control system (FCS) is designed for a scaled tilt-wing aircraft demonstrator in Matlab/Simulink R2024b environment. This platform was developed as a physical representation derived from a feasibility study focused on designing a four-passenger VTOL vehicle for UAM applications. Tilt-wing configurations are critical architectures in the VTOL domain, as they effectively merge the cruise efficiency of fixed-wing flight with vertical take-off and landing capabilities.
Our tilt-wing configuration is characterized by four main propulsion units (propeller–motor–ECS assemblies) positioned along the leading edge of the tilt-wing. These units generate the primary thrust in forward flight and lift required for hover regime. Additionally, the demonstrator features two auxiliary ducted fans integrated into the tail of the fuselage. One fan generates upward thrust, and the other in opposite direction, primarily utilized for pitching moment control during hover and transition flight. Moreover, tilt-wing aircraft has traditional aerodynamic control surfaces such an ailerons, a rudder, an all-moving horizontal tail and an elevator located on it. The geometry of the demonstrator has been directly derived from the preliminary UAM feasibility study, which defined the key configuration parameters, overall layout, and performance objectives for a full-scale four-passenger VTOL aircraft.
2. Dynamic Model Formulation
Compared to a conventional fixed-wing aircraft, the aerodynamic modeling of a tilt-wing configuration requires several significant modifications [
1].
2.1. Specifics of Aerodynamic Modeling
Modeling aerodynamic and propulsive forces and moments for tilt-wing aircraft differs significantly from conventional aircraft modeling techniques. The classic approach relying on the freestream dynamic pressure
to describe aerodynamic forces is insufficient. Instead, the concept of slipstream dynamic pressure
is introduced, which is defined as the superposition of the freestream dynamic pressure and the propeller-induced dynamic pressure:
where
is mean thrust force produced by propellers and
is propeller diameter. This increased dynamic pressure is a key factor, as a significant portion of the wing operates within the high-energy slipstream produced by the propellers, especially at low forward speeds and throughout the transition phase.
The performance of the propulsor is characterized by the thrust coefficient T
Cs, which represents the non-dimensional thrust relative to the slipstream dynamic pressure and the propeller disk area A
p:
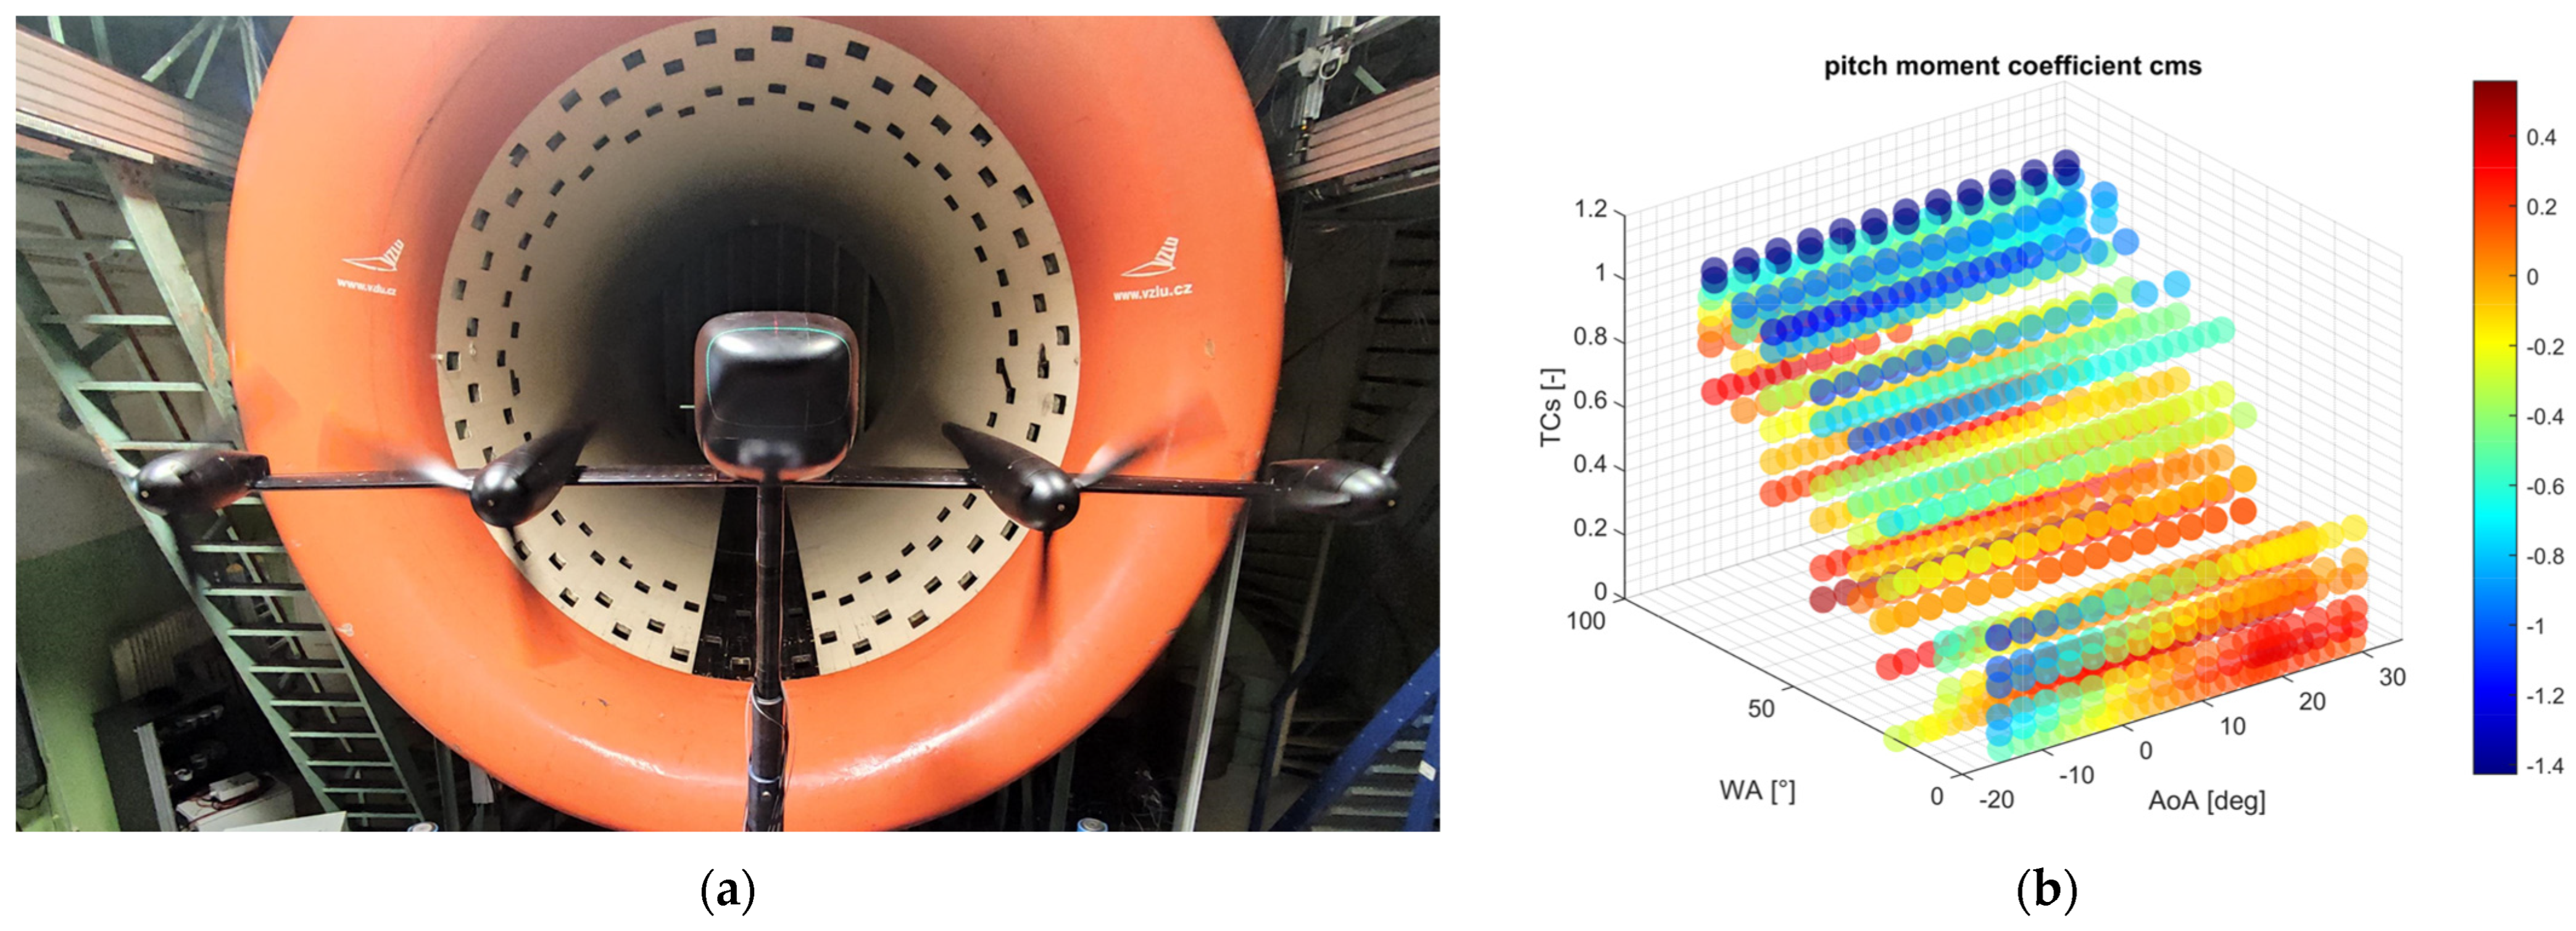
Thrust coefficient is a critical parameter indicating the propeller loading under specific flight conditions. Aerodynamic characteristics were generated by combining extensive wind tunnel measurements (see
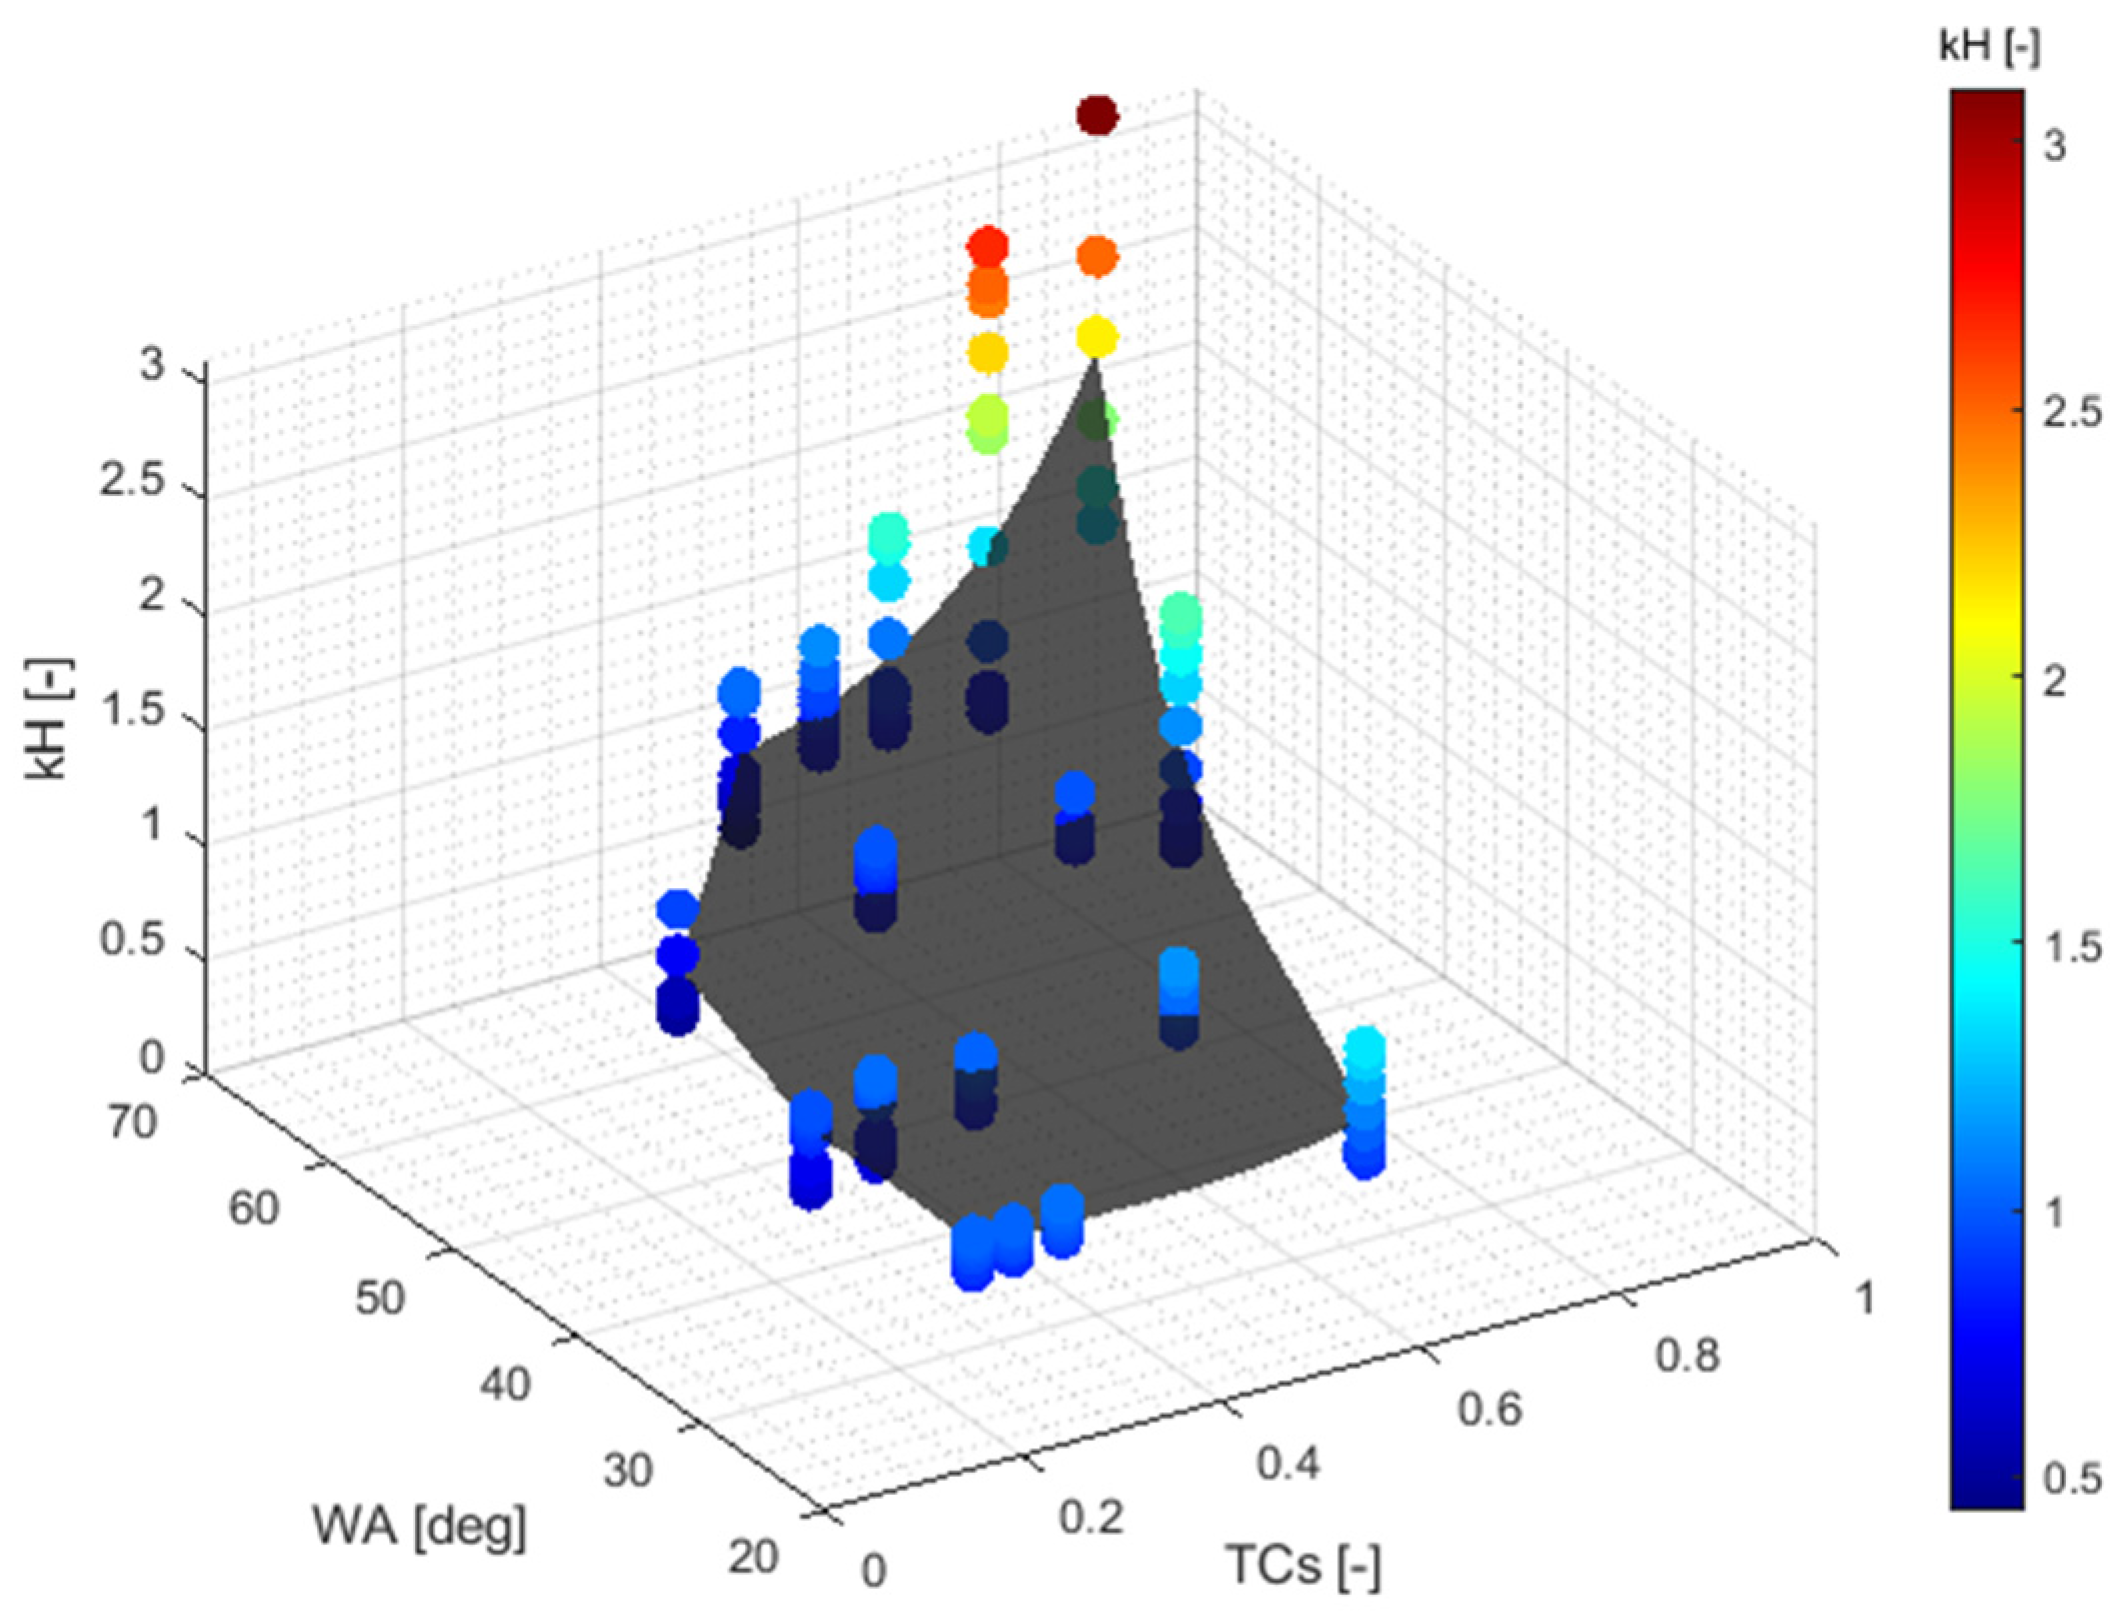
Figure 1a) and CFD simulations, resulting in a database (look-up tables) of aerodynamic coefficients. For example, the pitch moment coefficient, relative to slipstream dynamic pressure, is a complex function dependent not only on the angle of attack but also on the wing angle (WA) and the thrust coefficient. The non-linear distribution of the moment coefficient value is shown in
Figure 1b.
2.2. The Propeller and the Effects of Non-Axial Inflow
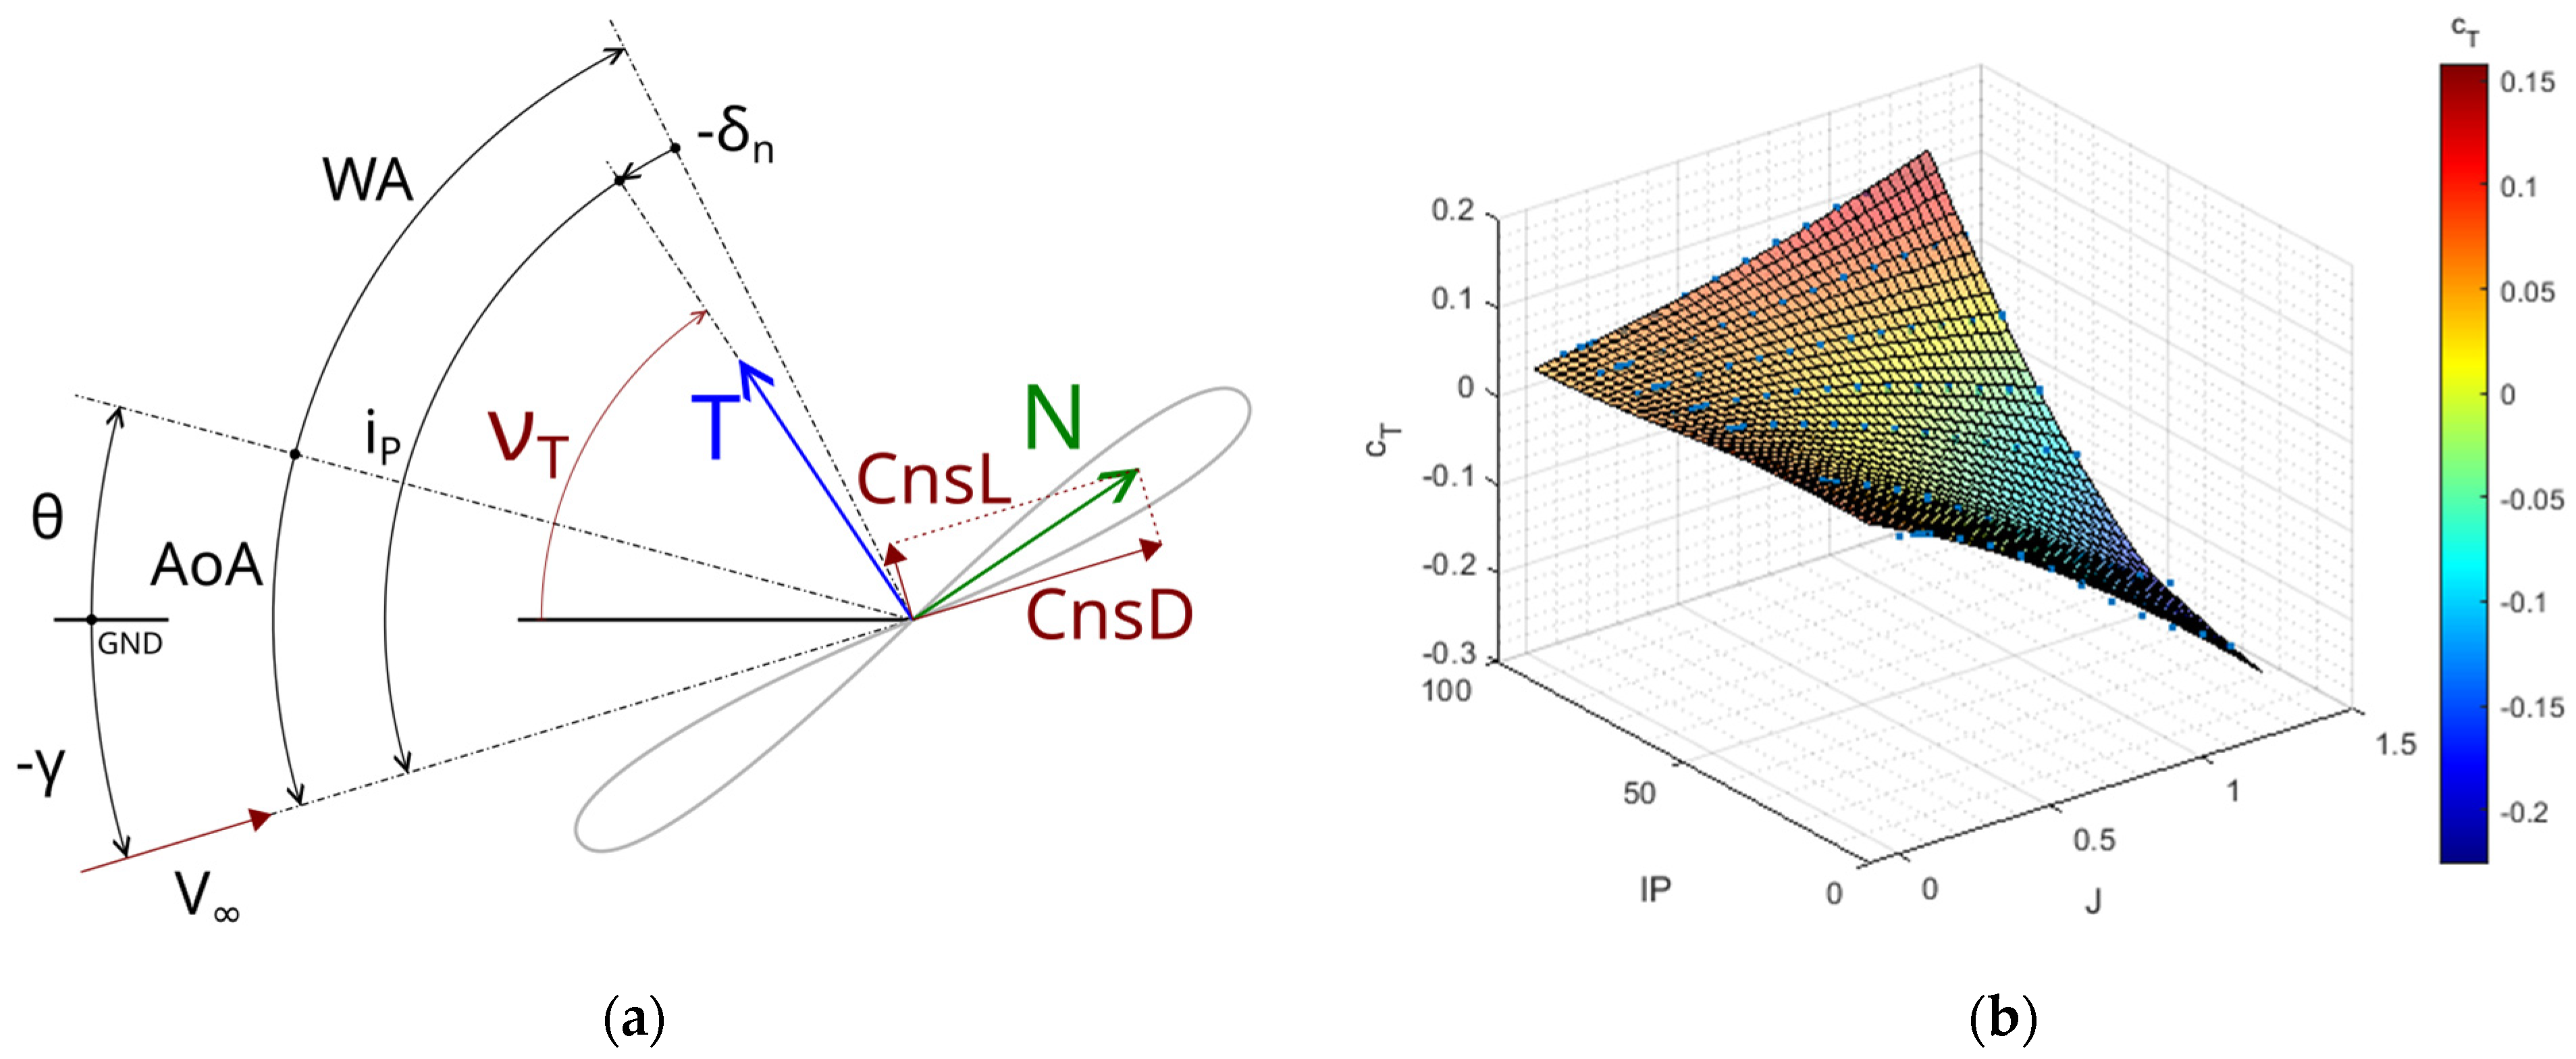
A key difference is the continuously changing inflow angle at the propeller disk, which varies with the wing tilt angle, WA, over the full range from 0° to 90°. This angle (propeller incidence angle—iP) variation generates a significant component of normal force on the propeller disk, which is typically negligible in conventional designs.
Due to the relatively large moment arm between the propellers and the aircraft’s center of gravity (CG), this normal force component generates a significant, speed-dependent pitching moment. As described above, this effect must therefore be accurately captured in the aerodynamic–propulsive model, since its proper representation is essential for the formulation and design of a precise control law.
In addition, the propeller incidence angle affects the characteristics of the propeller thrust coefficient, which must be modeled as a function of the advanced ratio and the propeller incidence angle. An example of influence of non-axial inflow on the propeller thrust coefficient is depicted in
Figure 2.
2.3. Horizontal Tailplane Modeling
The aircraft’s control surfaces include a floating stabilizer and an elevator mounted on it, both primarily used for pitching moment control. The standard formulation for the horizontal tail contribution is well-established in a flight mechanics.
where
describes the change in lift produced by the horizontal tail due to a change in the local angle of attack,
is the freestream angle of attack,
is the downwash angle,
is the horizontal tail deflection,
describes the change in lift produced by the elevator due to the change in elevator deflection,
is the elevator deflection,
is the dynamic pressure efficiency factor,
is the freestream dynamic pressure,
is the horizontal tail area and
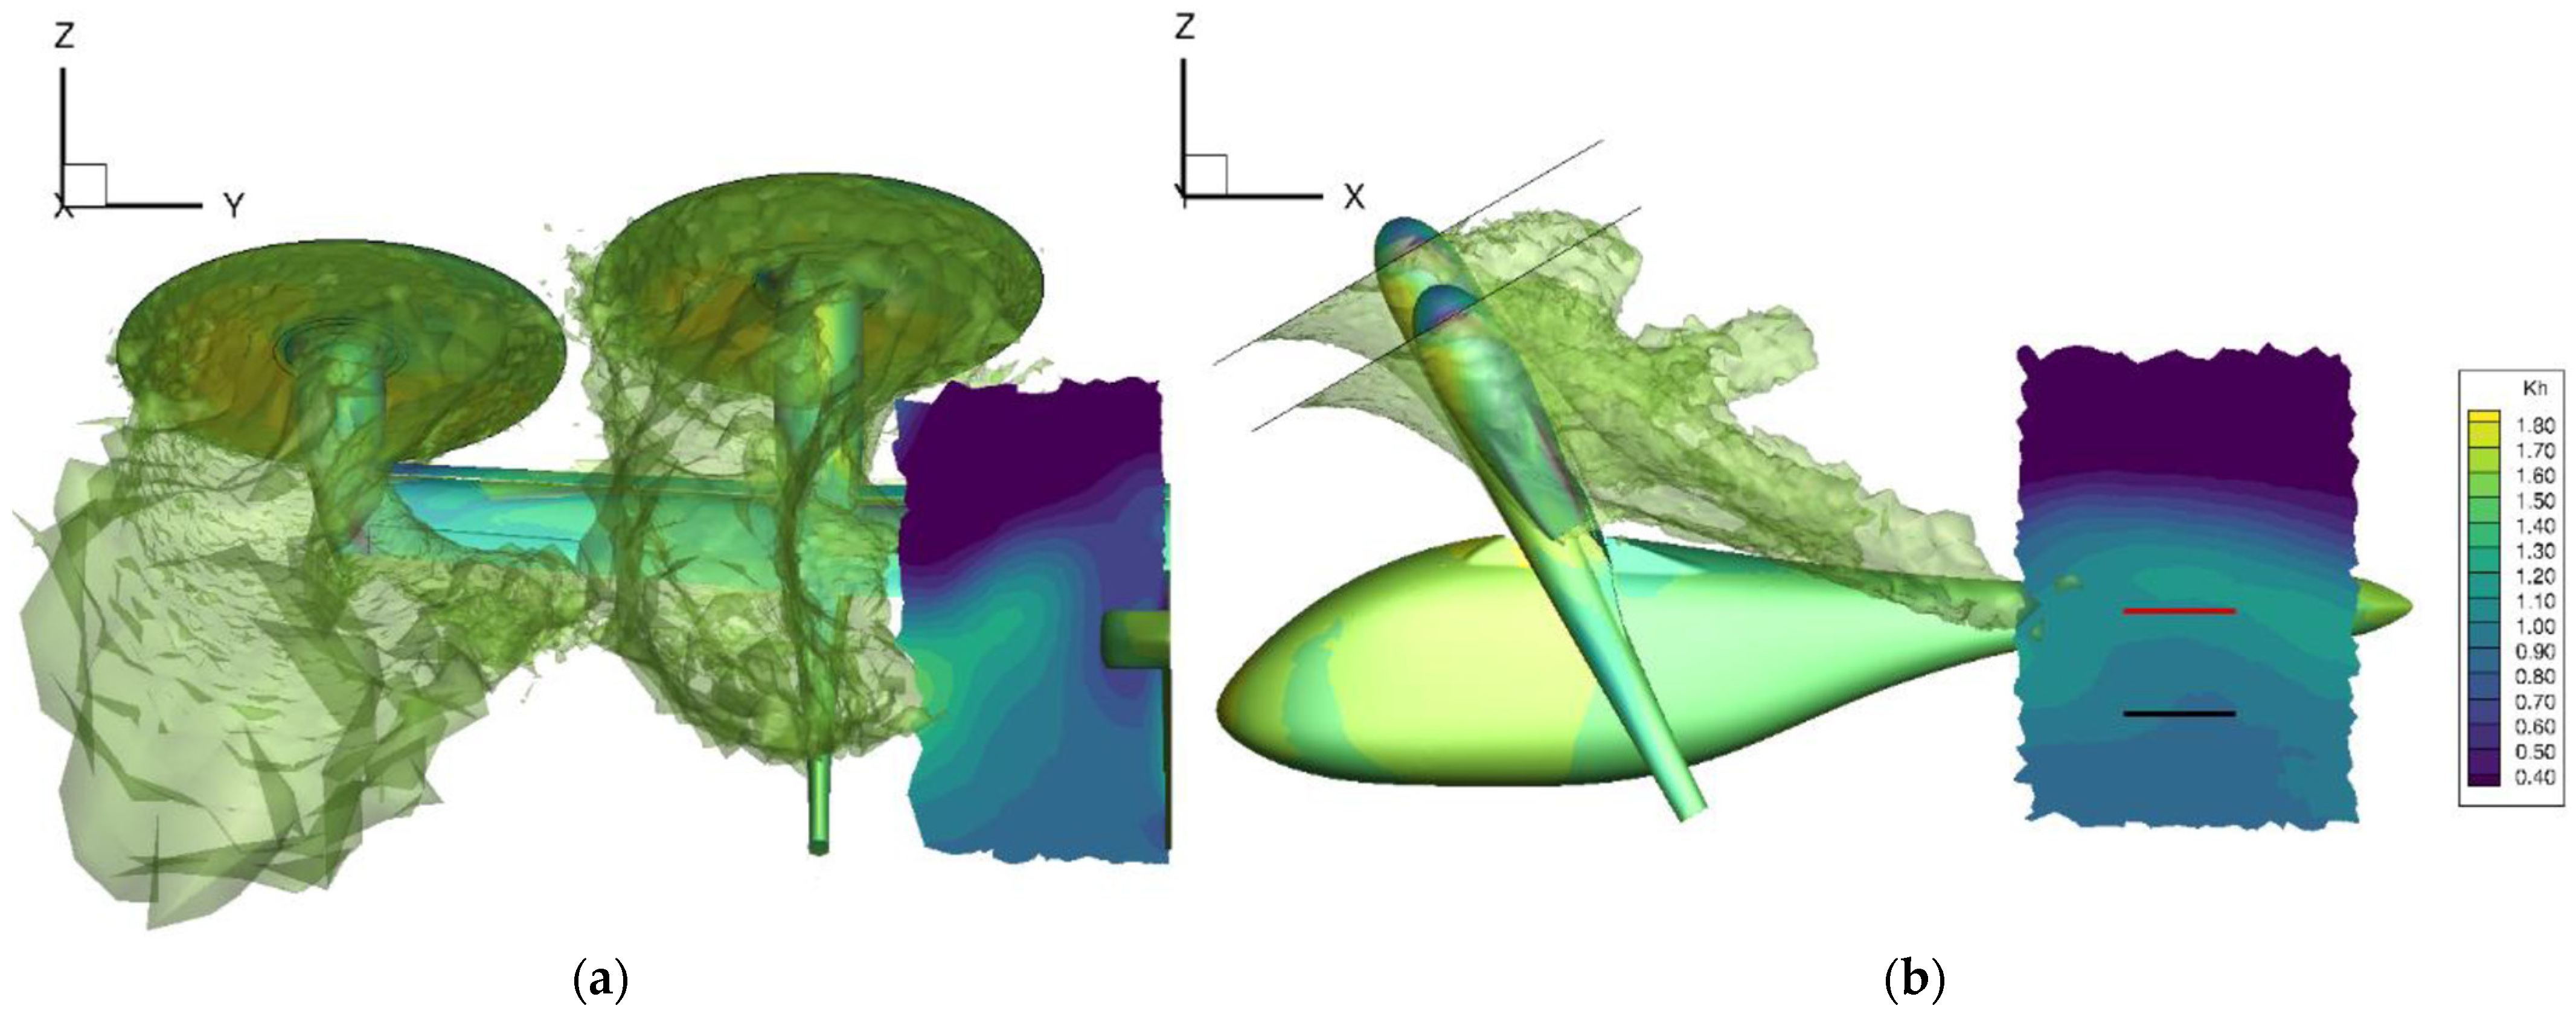
is the range between the quarter point of the horizontal tail and the CG. However, critical parameters—specifically, the downwash angle and the dynamic pressure efficiency factor, which are often assumed as near-constant in conventional aircraft—are in this case highly dependent on the wing angle and the thrust coefficient. This strong dependence arises from the massive influence of the propeller slipstream on the airflow over the tail surfaces. This aerodynamic phenomenon has the greatest effect in the transition zone, which is clearly visible from the CFD calculations shown in the
Figure 3.
Therefore, an accurate flight simulation requires a comprehensive, multi-variable functional model that captures the coupled non-linear interactions between aerodynamics, propulsion, and control effects. The nonlinear character of dynamic pressure efficiency factor
depending on the flight mode is shown in
Figure 4.
3. Dynamic Model Integration and Trimming Analysis
Following the collection of all aerodynamic and propulsive characteristics, a complete non-linear six-degrees-of-freedom (6-DoF) dynamic model of the aircraft was assembled. The model includes:
Full rigid-body equations of motion;
Complex aerodynamic model;
Propulsor-specific induced-velocity models;
Coupling through slipstream-dependent dynamic pressure;
Influence of the wing angle (WA) on the position of the center of gravity and moments of inertia.
The basis is provided by general equations of motion for a point mass, which can be divided into three differential equations of linear acceleration:
and three equations for calculating angular velocities [
2]:
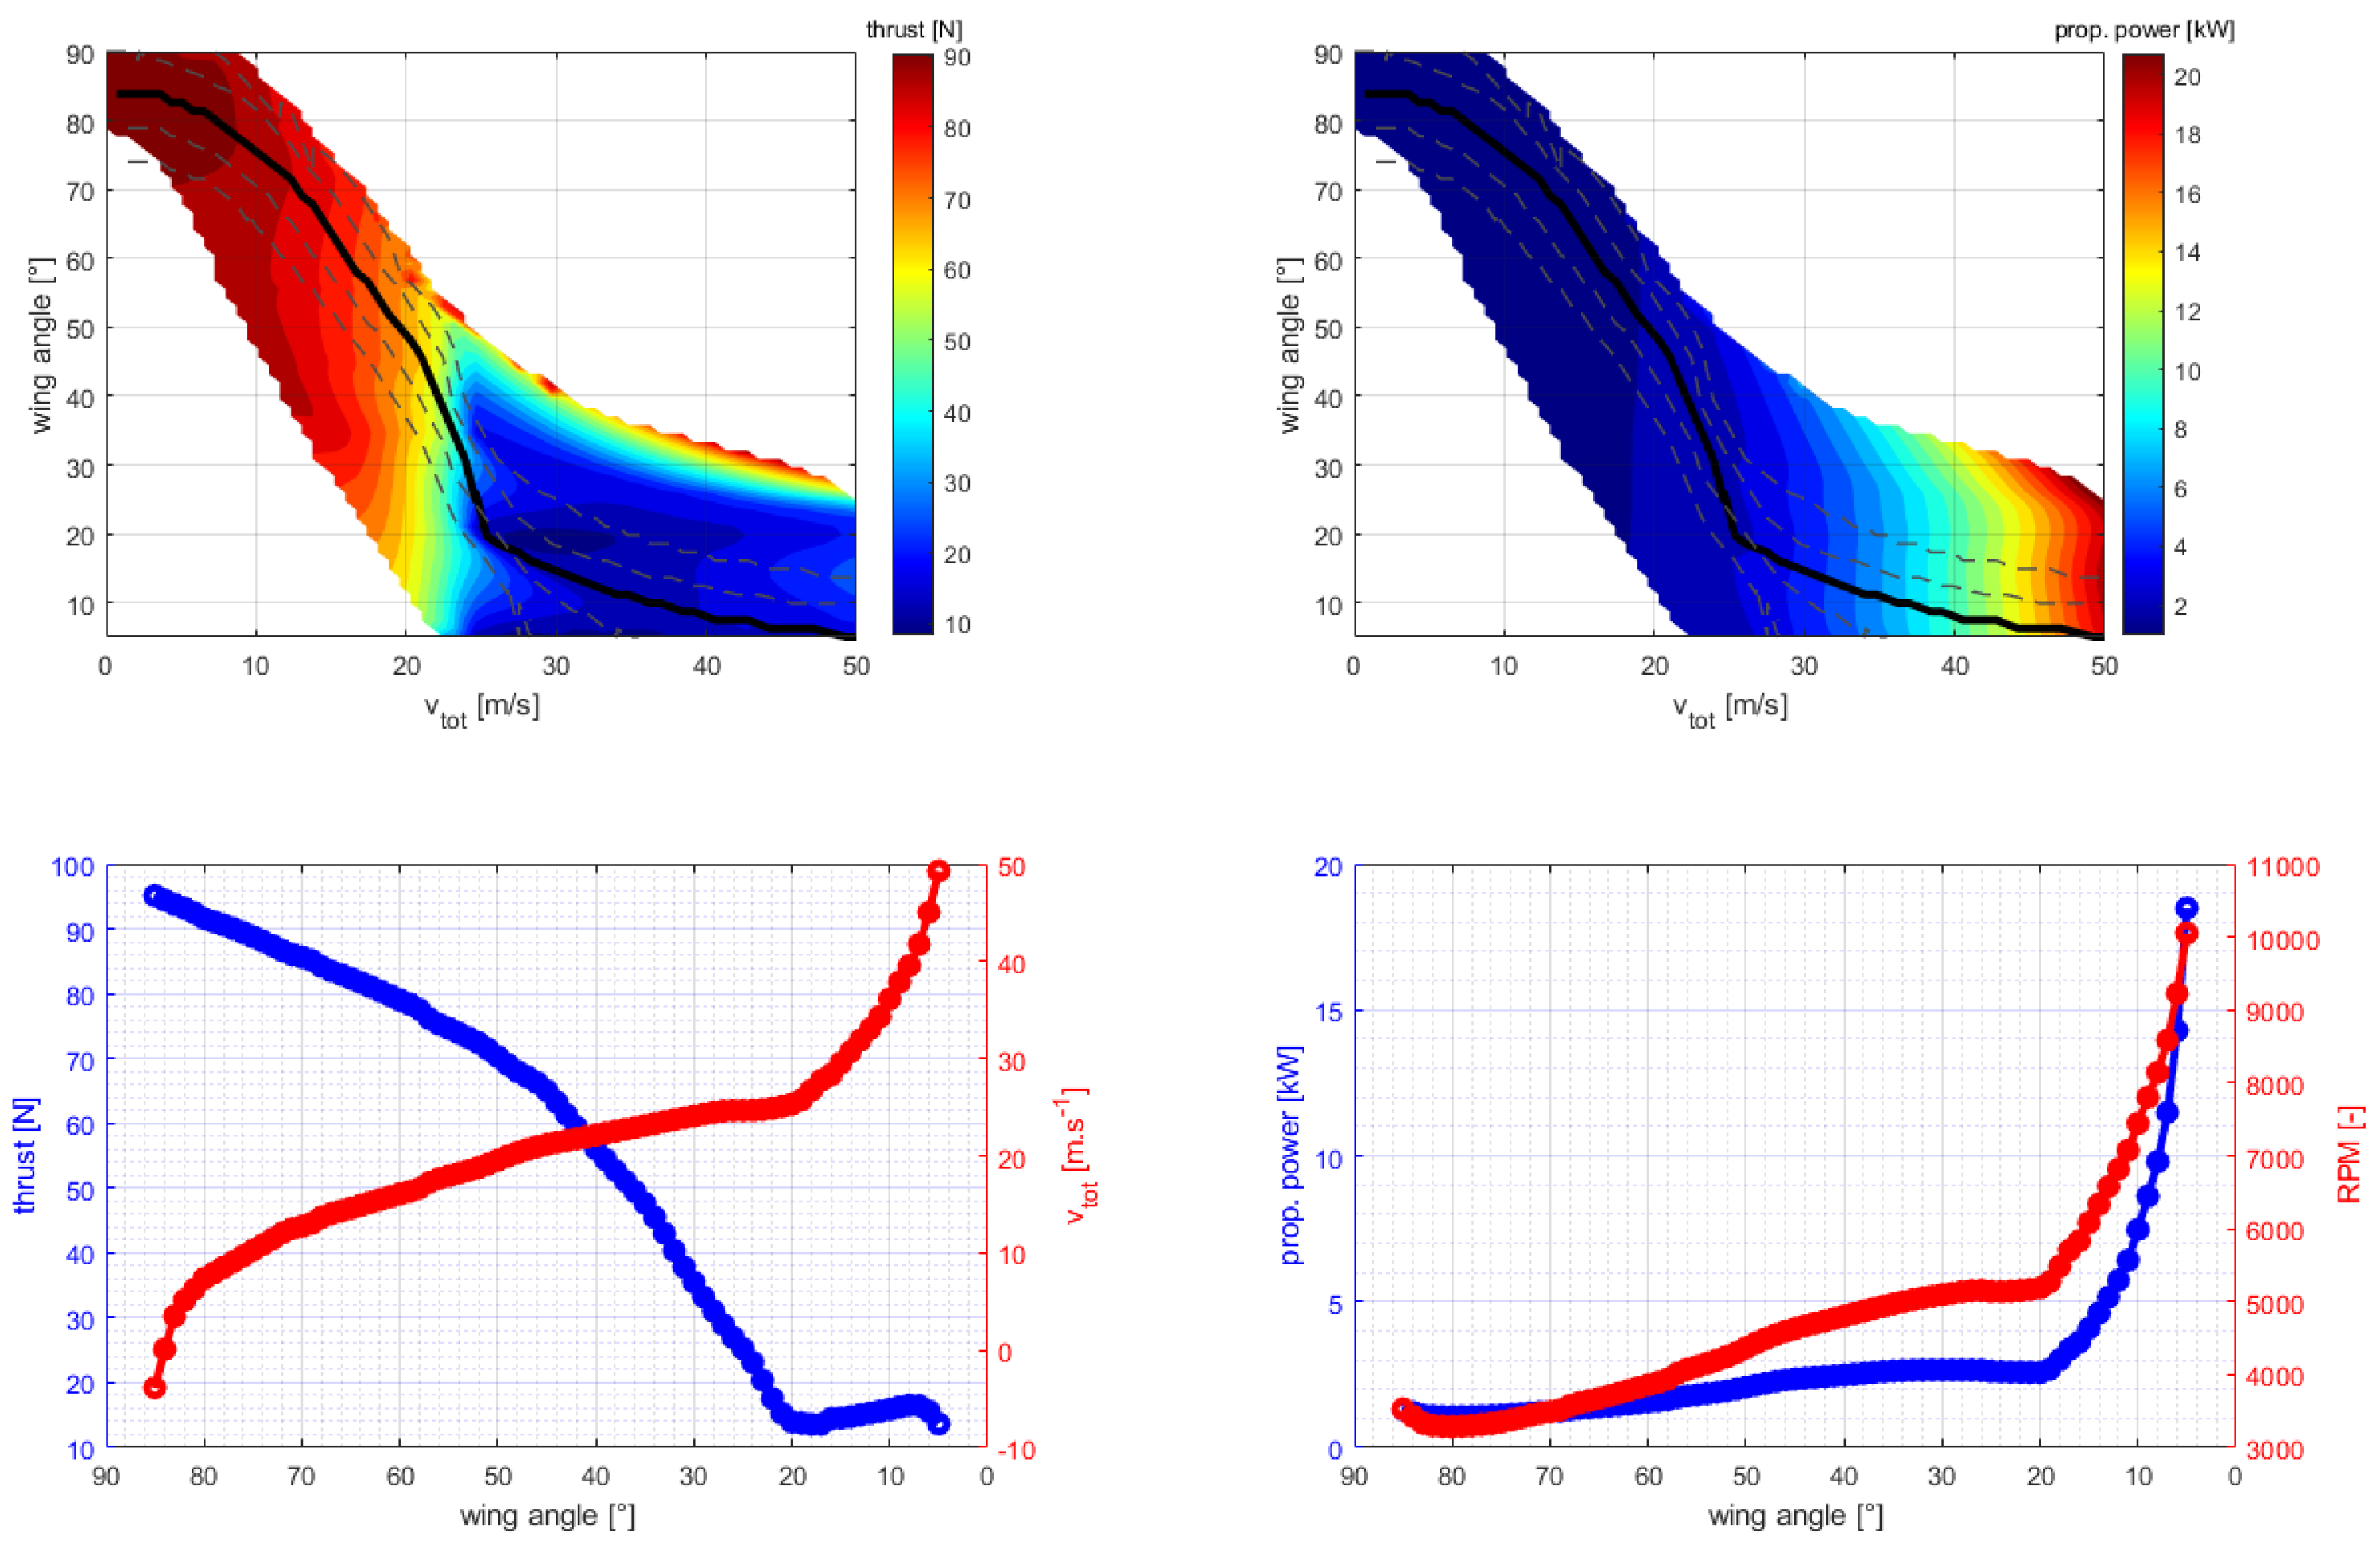
A trimming function was developed to calculate the necessary thrust settings and control surface deflections required for equilibrium flight at a selected condition, primarily defined by the forward flight speed and WA. The analysis of the trimming solutions allowed for the definition of the transition corridor. This corridor determines the feasible combinations of speed and wing angle where straight, steady flight is achievable, illustrating the operational envelope for the full transition from vertical to horizontal flight.
The
Figure 5 illustrates a representative solution and outlines the transition corridor, i.e., the region of combinations of airspeed and wing tilt angle where a trimmed solution exists and is controllable. The top two graphs show the transition corridor depending on forward speed (horizontal axis) and wing angle (vertical axis). The required propeller thrust (left graph) and the required power input to the engine shaft (right graph) are marked in color. The trajectory of the transition with zero pitch angle is marked in black on these graphs. For the zero pitch angle value, the lower graphs show the curves of the required thrust and forward speed as a function of the wing angle (lower left graph) and the power on the motor shaft and motor speed (lower right graph).
4. Flight Control System Design
4.1. FCS Design Challenges and Control Allocation
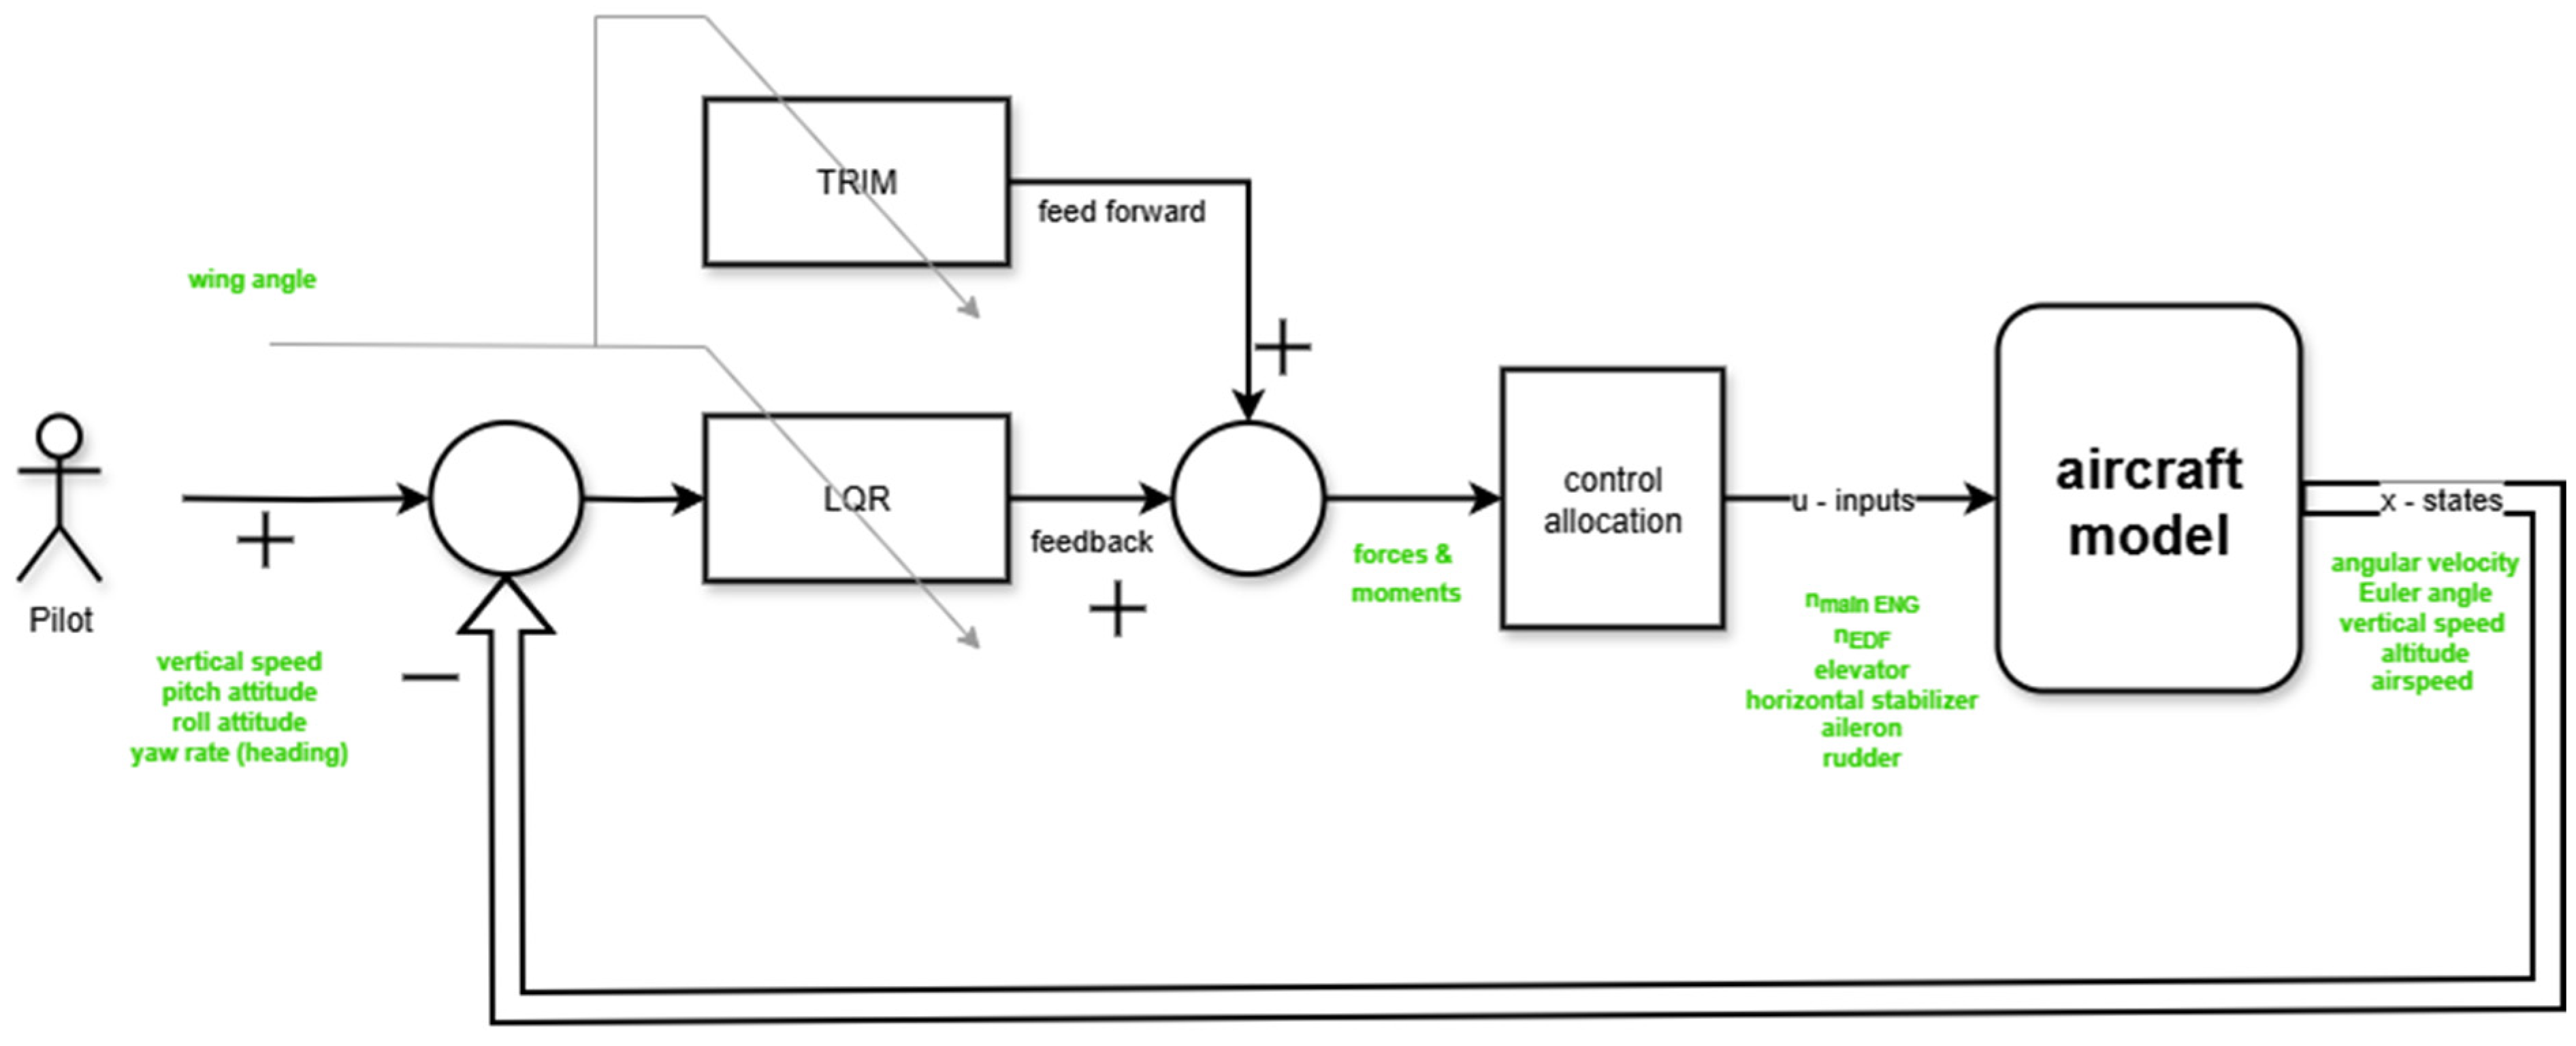
The dynamic model is highly non-linear in terms of propulsive forces, changes in center of gravity and moment of inertia, and aerodynamic characteristics. Specifically, the effectiveness of the control inputs change dramatically based on the wing position. For example, aileron deflection generates a yawing moment in hover mode, while the same deflection generates a rolling moment in cruise mode. Furthermore, the system is over-actuated. The pitching moment, for example, can be controlled using the two electric ducted fans, the floating stabilizer, and the elevator. This requires a control allocation system to optimally distribute the required control forces and moments across the available actuators, ensuring efficiency and saturation avoidance throughout the operational envelope. The proposed control law uses calculated values from trimming, such as the required engine speed, stabilizer deflection, and fan speed. These are in the form of polynomials dependent on the wing angle setting and are precalculated in the control law according to the current flight regime–feed forward. Feedback control is provided by LQR, which changes the values of individual gains again using the wing angle function. This is followed by a control allocation block that ensures the distribution of the required moments to the individual aircraft inputs. The pilot references the vertical speed, pitch and roll angle and turn rate (or aircraft heading). A simplified diagram of the proposed control approach is depicted in the
Figure 6.
4.2. Control Results
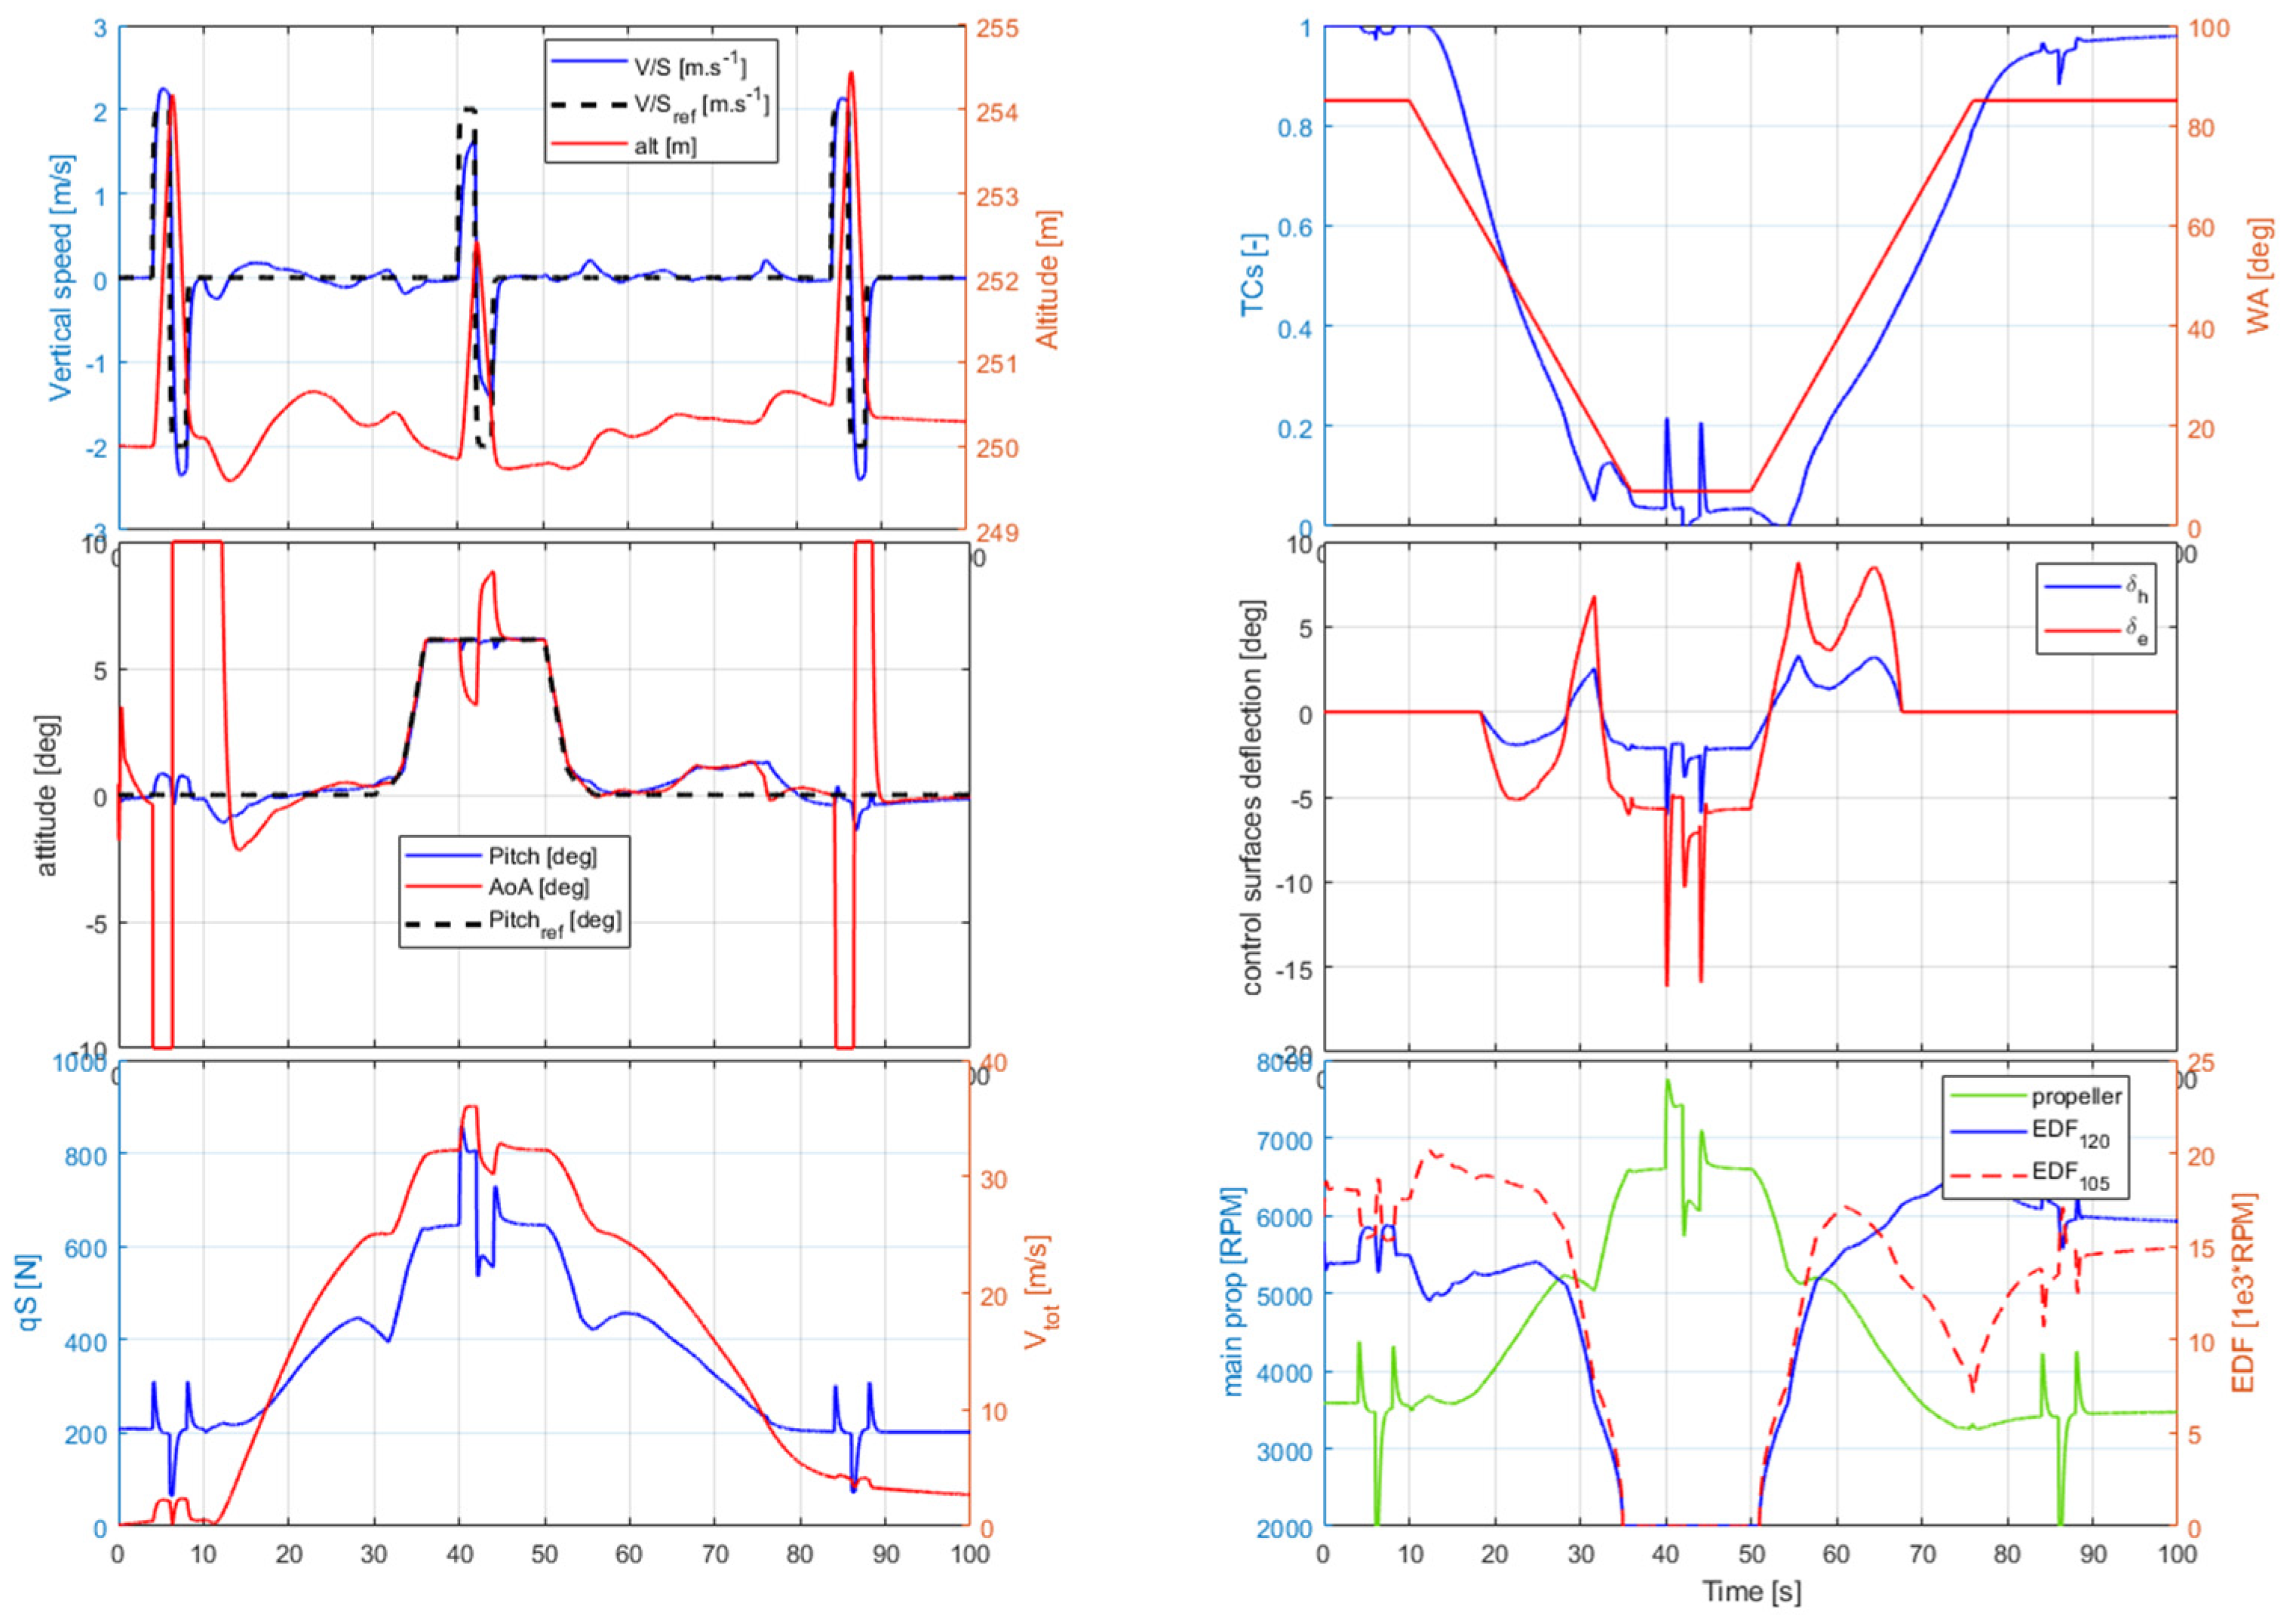
To validate the capabilities of the designed FCS, a simulation of a controlled transition for the aircraft’s longitudinal dynamics was performed in this example, demonstrating a smooth and stable trajectory between flight modes. The result is depicted in the
Figure 7.
The simulation begins in hover regime, the WA is 85° (upper right graph, red line). The aircraft has controlled vertical speed and pitch angle (upper and middle graphs in the left column). References for these variables are marked with a black dashed line. The pitch angle, for WA angles less than 20 degrees, is controlled to increase to approximately 7 degrees. This increases the lift coefficient and reduces the speed required for forward flight, thereby limiting the maximum engine speed.
The simulation shows that the control of vertical speed by the required doublet is relatively accurate and stable. Furthermore, it can be seen that the stabilization of the pitch angle in the hover regime is ensured by the inputs of both fans. Their influence is reduced for lower values of the wing angle (lower right graph). During forward flight, the fans are not used for control at all, and only the aerodynamic surfaces of the stabilizer and elevator are used.
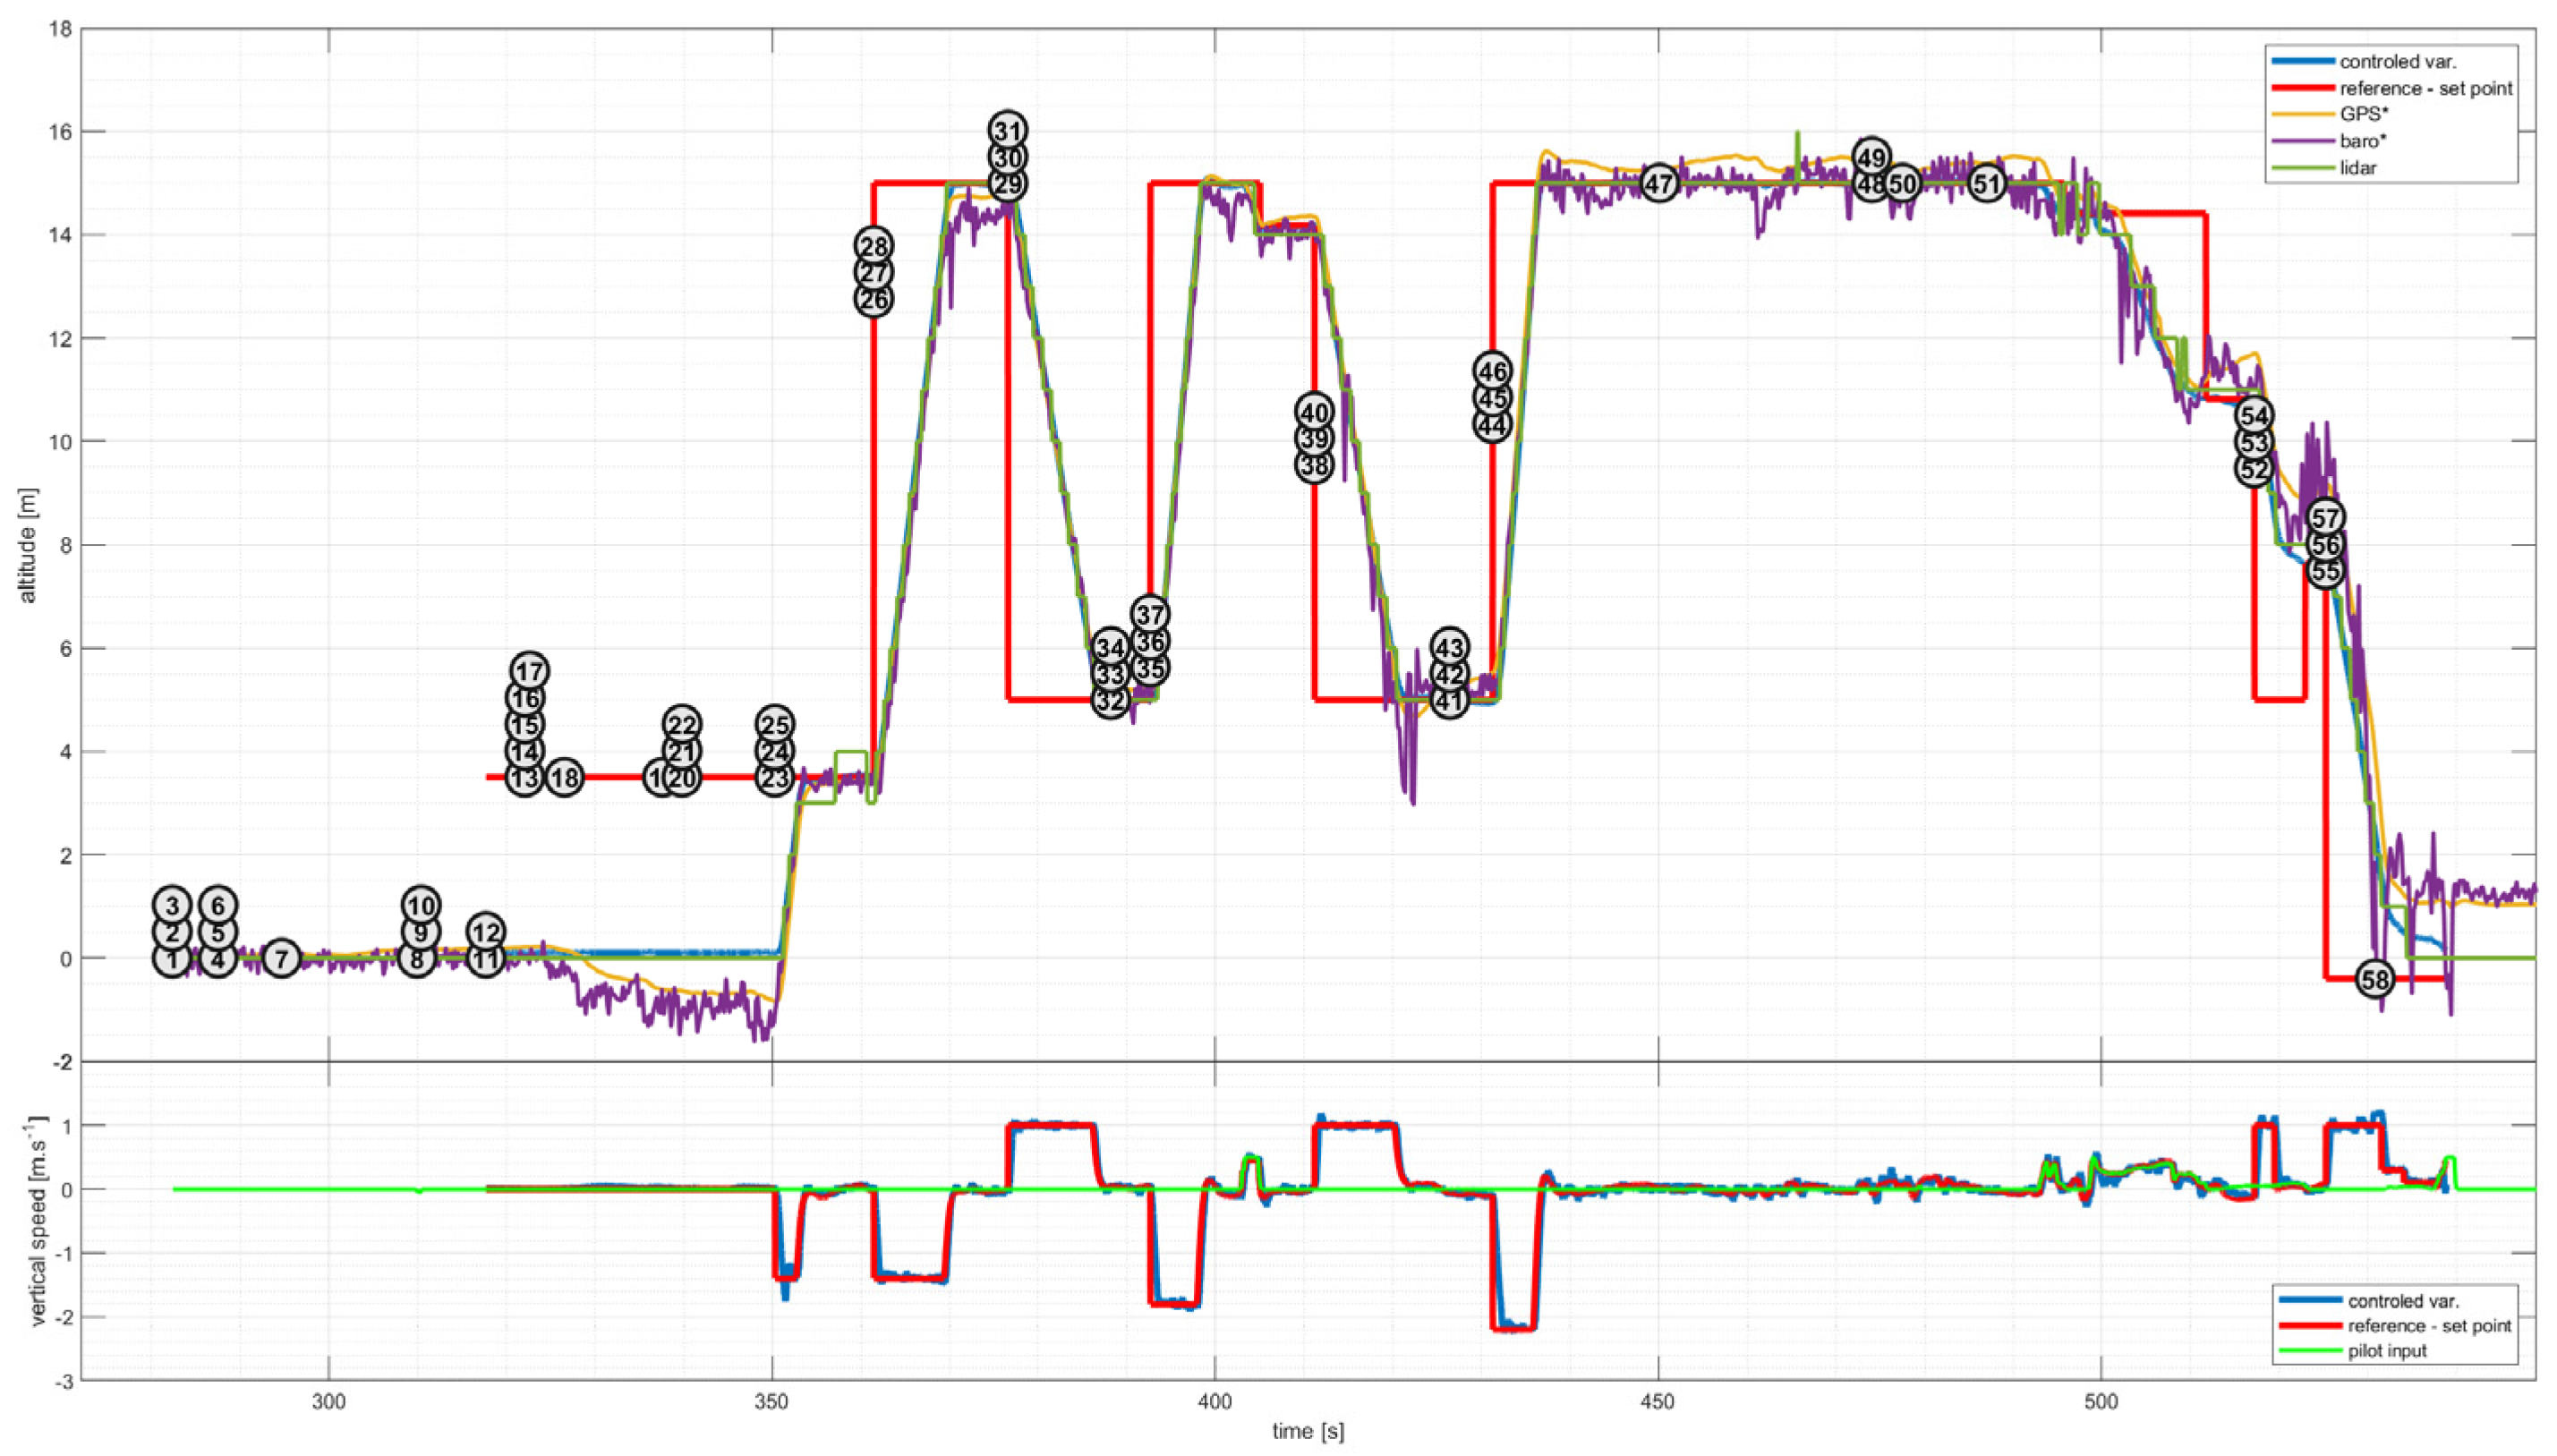
Experimental results from hover flights (
Figure 8) illustrate altitude and vertical speed control using the same architecture. The altitude set point is entered via a ground station, and the pilot controls the vertical speed of the aircraft. The graph shows various sensors for calculating altitude, with data fusion directly integrated into the px4 autopilot used to calculate the controlled variable. Other altitude signals are depicted just for illustration (GPS*, baro* and lidar). When the altitude reference is changed, the vertical speed reference, which is primarily controlled, becomes saturated. Flight tests have so far focused only on hover mode.
5. Conclusions
This work focuses primarily on explaining the issues involved in modeling and controlling tilt-wing aircraft. The article describes aspects that differ from conventional aviation. These are primarily nonlinearities associated with wing tilting, which create nonlinearities in terms of changes in the aerodynamic characteristics of both the aircraft and the control surfaces, propulsive characteristics taking into account the non-axis inflow on the propeller, and the propeller–wing interaction. A control concept was proposed here using trimmed values in individual transition modes for forward feedback, LQR feedback control (both as a function of wing angle), and control allocation on over-actuated systems. This concept was tested in simulation from hover to transition and forward flight, and the hover regime was verified experimentally. Further experimental tests focused on mastering the transition mode and forward flight are planned for next year.
Author Contributions
R.K. defined the aerodynamic description, performed the wind tunnel test and provided flight mechanics analyses. P.H. created dynamic model, designed flight control system and performed flight tests. All authors have read and agreed to the published version of the manuscript.
Funding
These research activities were carried out from funds provided for the “Long-term development of a research organization” (DKRVO2) in the form of institutional support of the Ministry of Industry and Trade of the Czech Republic, partial target 1.3: IAUTO0 project.
Institutional Review Board Statement
Not applicable.
Informed Consent Statement
Not applicable.
Data Availability Statement
The aerodynamic characteristics and database of other flight parameters are not publicly available.
Conflicts of Interest
Pavel Hospodář and Robert Kulhánek were employed by the VZLU AEROSPACE company. The authors declare that the research was conducted in the absence of any commercial or financial relationships that could be construed as a potential conflict of interest.
Abbreviations
The following abbreviations are used in this manuscript:
| CFD | Computational fluid dynamics |
| VTOL | Vertical take-off and landing |
| UAM | Urban air mobility |
| FCS | Flight control system |
| ESC | Electronic speed controller |
| WA | Wing angle |
| CG | Center of gravity |
| DoF | Degree of freedom |
| LQR | Linear quadratic regulator |
References
- Kulhánek, R.; Vrchota, P.; Hospodář, P. Aerodynamic modelling of a tilt-wing transition corridor. J. Phys. Conf. Ser. 2023, 2526, 012001. [Google Scholar] [CrossRef] [Scilit]
- Stevens, B.L.; Lewis, F.L.; Johnson, E.N. Aircraft Control and Simulation: Dynamics, Controls Design, and Autonomous Systems, 3rd ed.; John Wiley & Sons: Hoboken, NJ, USA, 2016; ISBN 978-1-118-87098-3. [Google Scholar]
| Disclaimer/Publisher’s Note: The statements, opinions and data contained in all publications are solely those of the individual author(s) and contributor(s) and not of MDPI and/or the editor(s). MDPI and/or the editor(s) disclaim responsibility for any injury to people or property resulting from any ideas, methods, instructions or products referred to in the content. |