1. Introduction
Natural disasters, such as earthquakes, often cause widespread damage to infrastructure and buildings. Rapid and accurate assessment of this damage is essential for effective emergency response, resource allocation, and recovery efforts. Traditional manual damage assessment is time-consuming, resource-intensive, and often dangerous. To address this challenge, high-precision mapping for estimating building damage using simplified remote sensing indicators has been proposed [
1,
2,
3,
4]. Advances in remote sensing technology and deep learning offer a promising path toward automating this process.
We developed a deep multi-layer perceptron (MLP) model to analyze image patches for earthquake damage detection. Our primary objective is to classify image segments as “No Damage” or “Damage.” To improve the accuracy of existing methods that use simplified remote sensing indices, we introduced a deep learning model. By leveraging robust feature engineering techniques and optimizing the deep learning architecture, high accuracy and, more importantly, high recall were obtained for the damage classification, minimizing the risk of overlooking affected areas.
2. Method
38 handcrafted features were extracted from each image patch, including color-based (RGB mean/variance, normalized RGB, Redness Index), edge-based (Sobel filter, edge angles), and hue-saturation-value color space (mean/variance) features. Additionally, it incorporates various texture and statistical features, including pixel range, standard deviation, Laplacian variance, horizontal/vertical difference statistics, gradient magnitude mean squares, and grayscale percentiles (median, Q25, and Q75). The extract_features_function ensures a consistent output of 38 features.
A custom DeepMLPModel was designed, featuring seven hidden layers with decreasing neuron counts (512 down to 8). It incorporated batch normalization and rectified linear unit activation after each layer for stable training and non-linearity, along with dropout (varying rates from 0.4 to 0.1) to prevent overfitting. The final layer is a single linear unit for binary classification.
The model was trained using a robust 5-fold stratified cross-validation. To address class imbalance, the synthetic minority over-sampling technique (SMOTE) was applied to the training data within each fold. Features were scaled using StandardScaler. nn. BCEWithLogitsLoss was used as the loss function, with pos_weight balancing class contributions. An AdamW optimizer and ReduceLROnPlateau scheduler (patience 15) were employed, and Early stopping (patience 50) was implemented to prevent overfitting. Performance was evaluated using accuracy, receiver operating characteristic-area under the curve (ROC-AUC), F1-score, and a detailed classification report. A final model is trained on the entire dataset (with SMOTE) and saved.
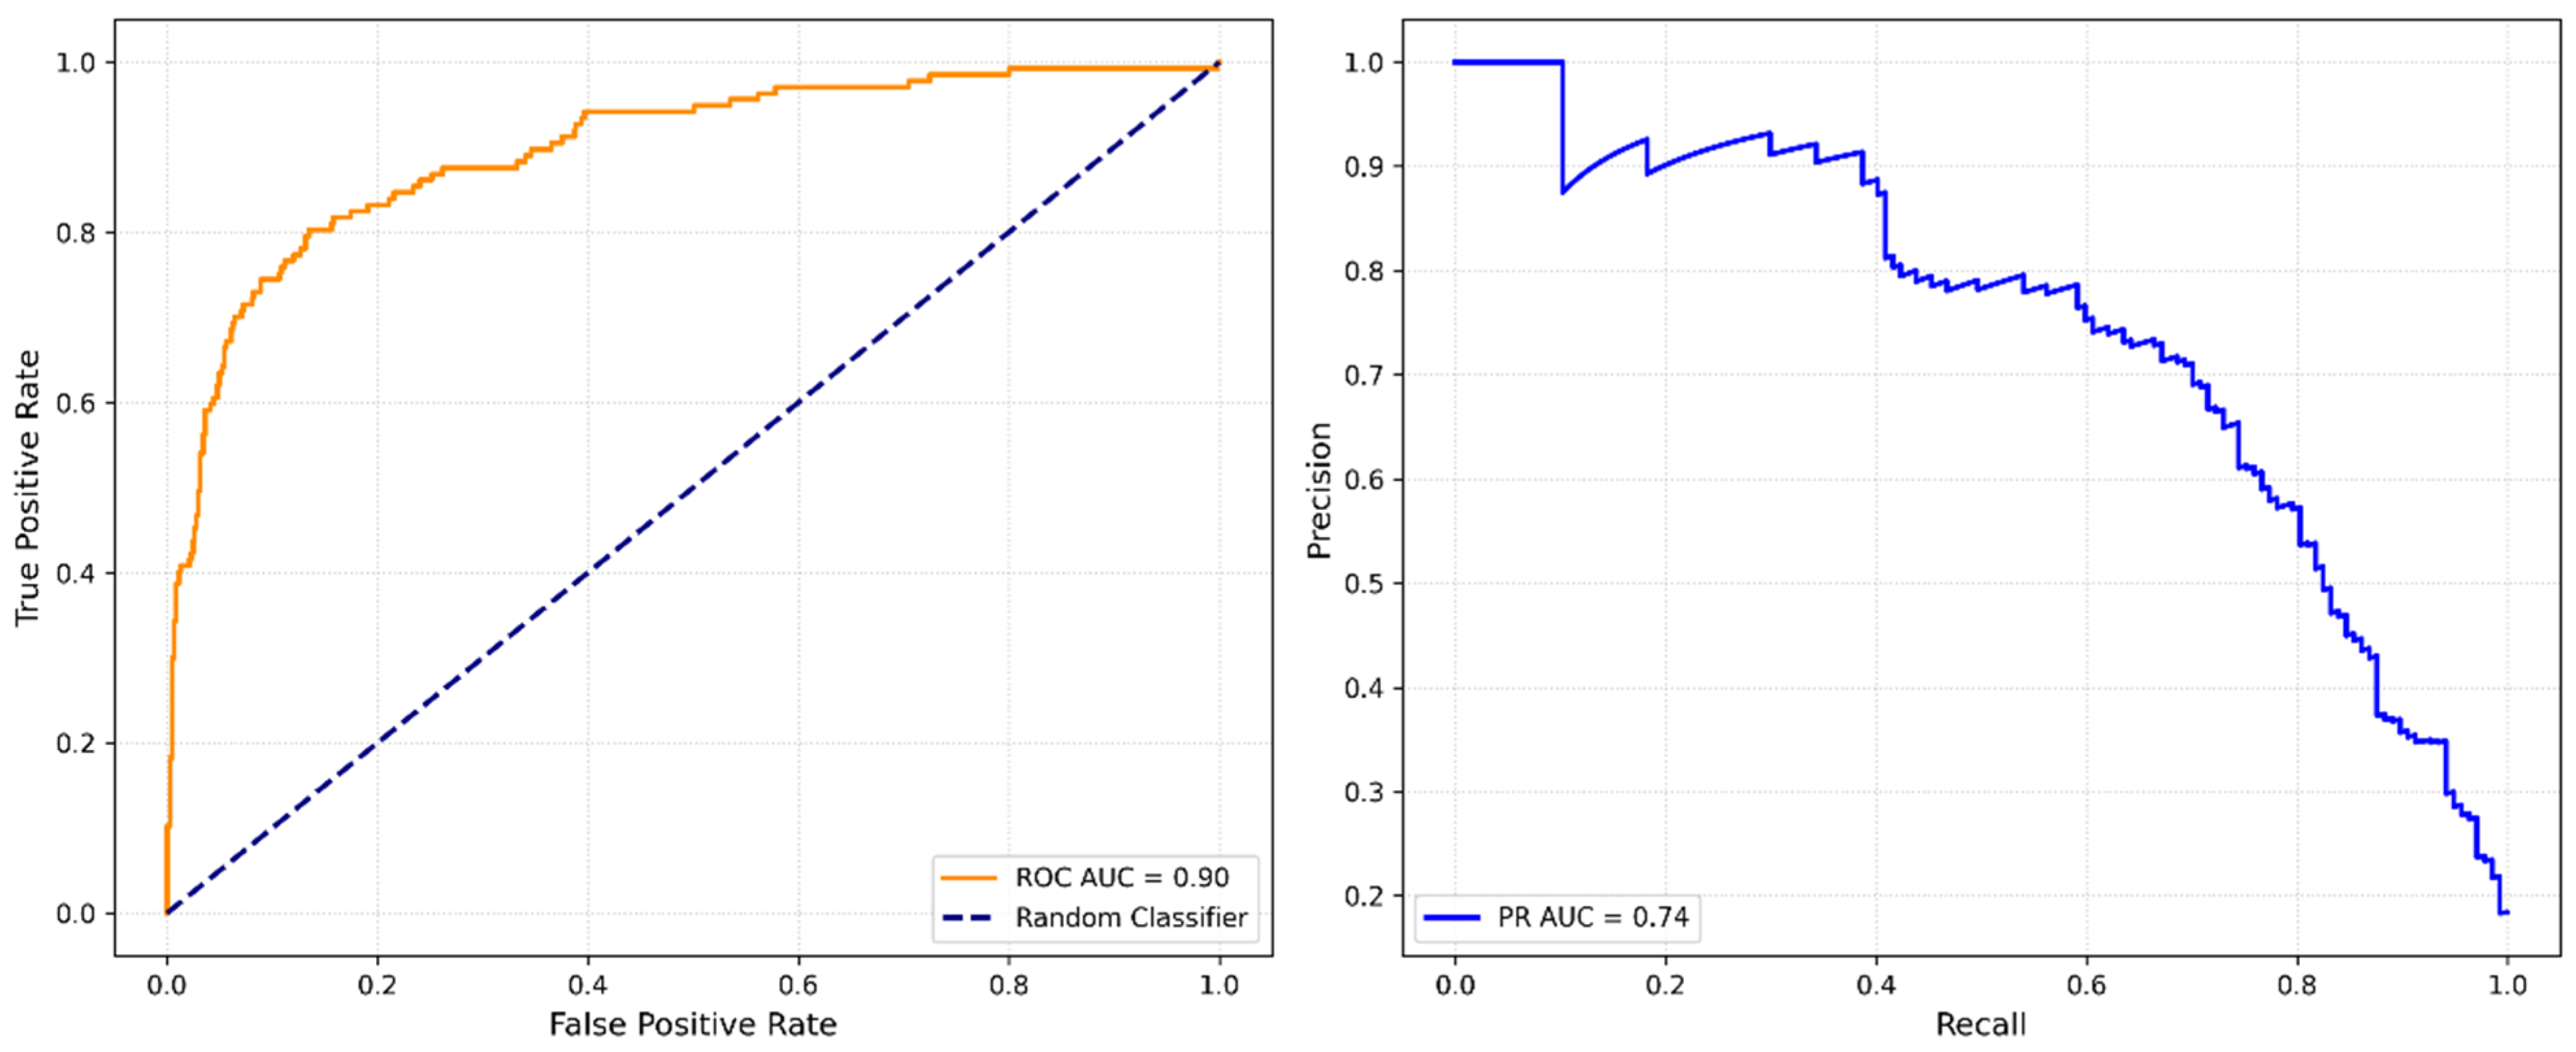
The trained model predicts damage probabilities for unseen image patches, which are then visualized. This includes predicted probability over time, distribution of predicted probabilities (histogram), distribution of predicted classes (bar chart), ROC and precision-recall curves (
Figure 1), a confusion matrix (
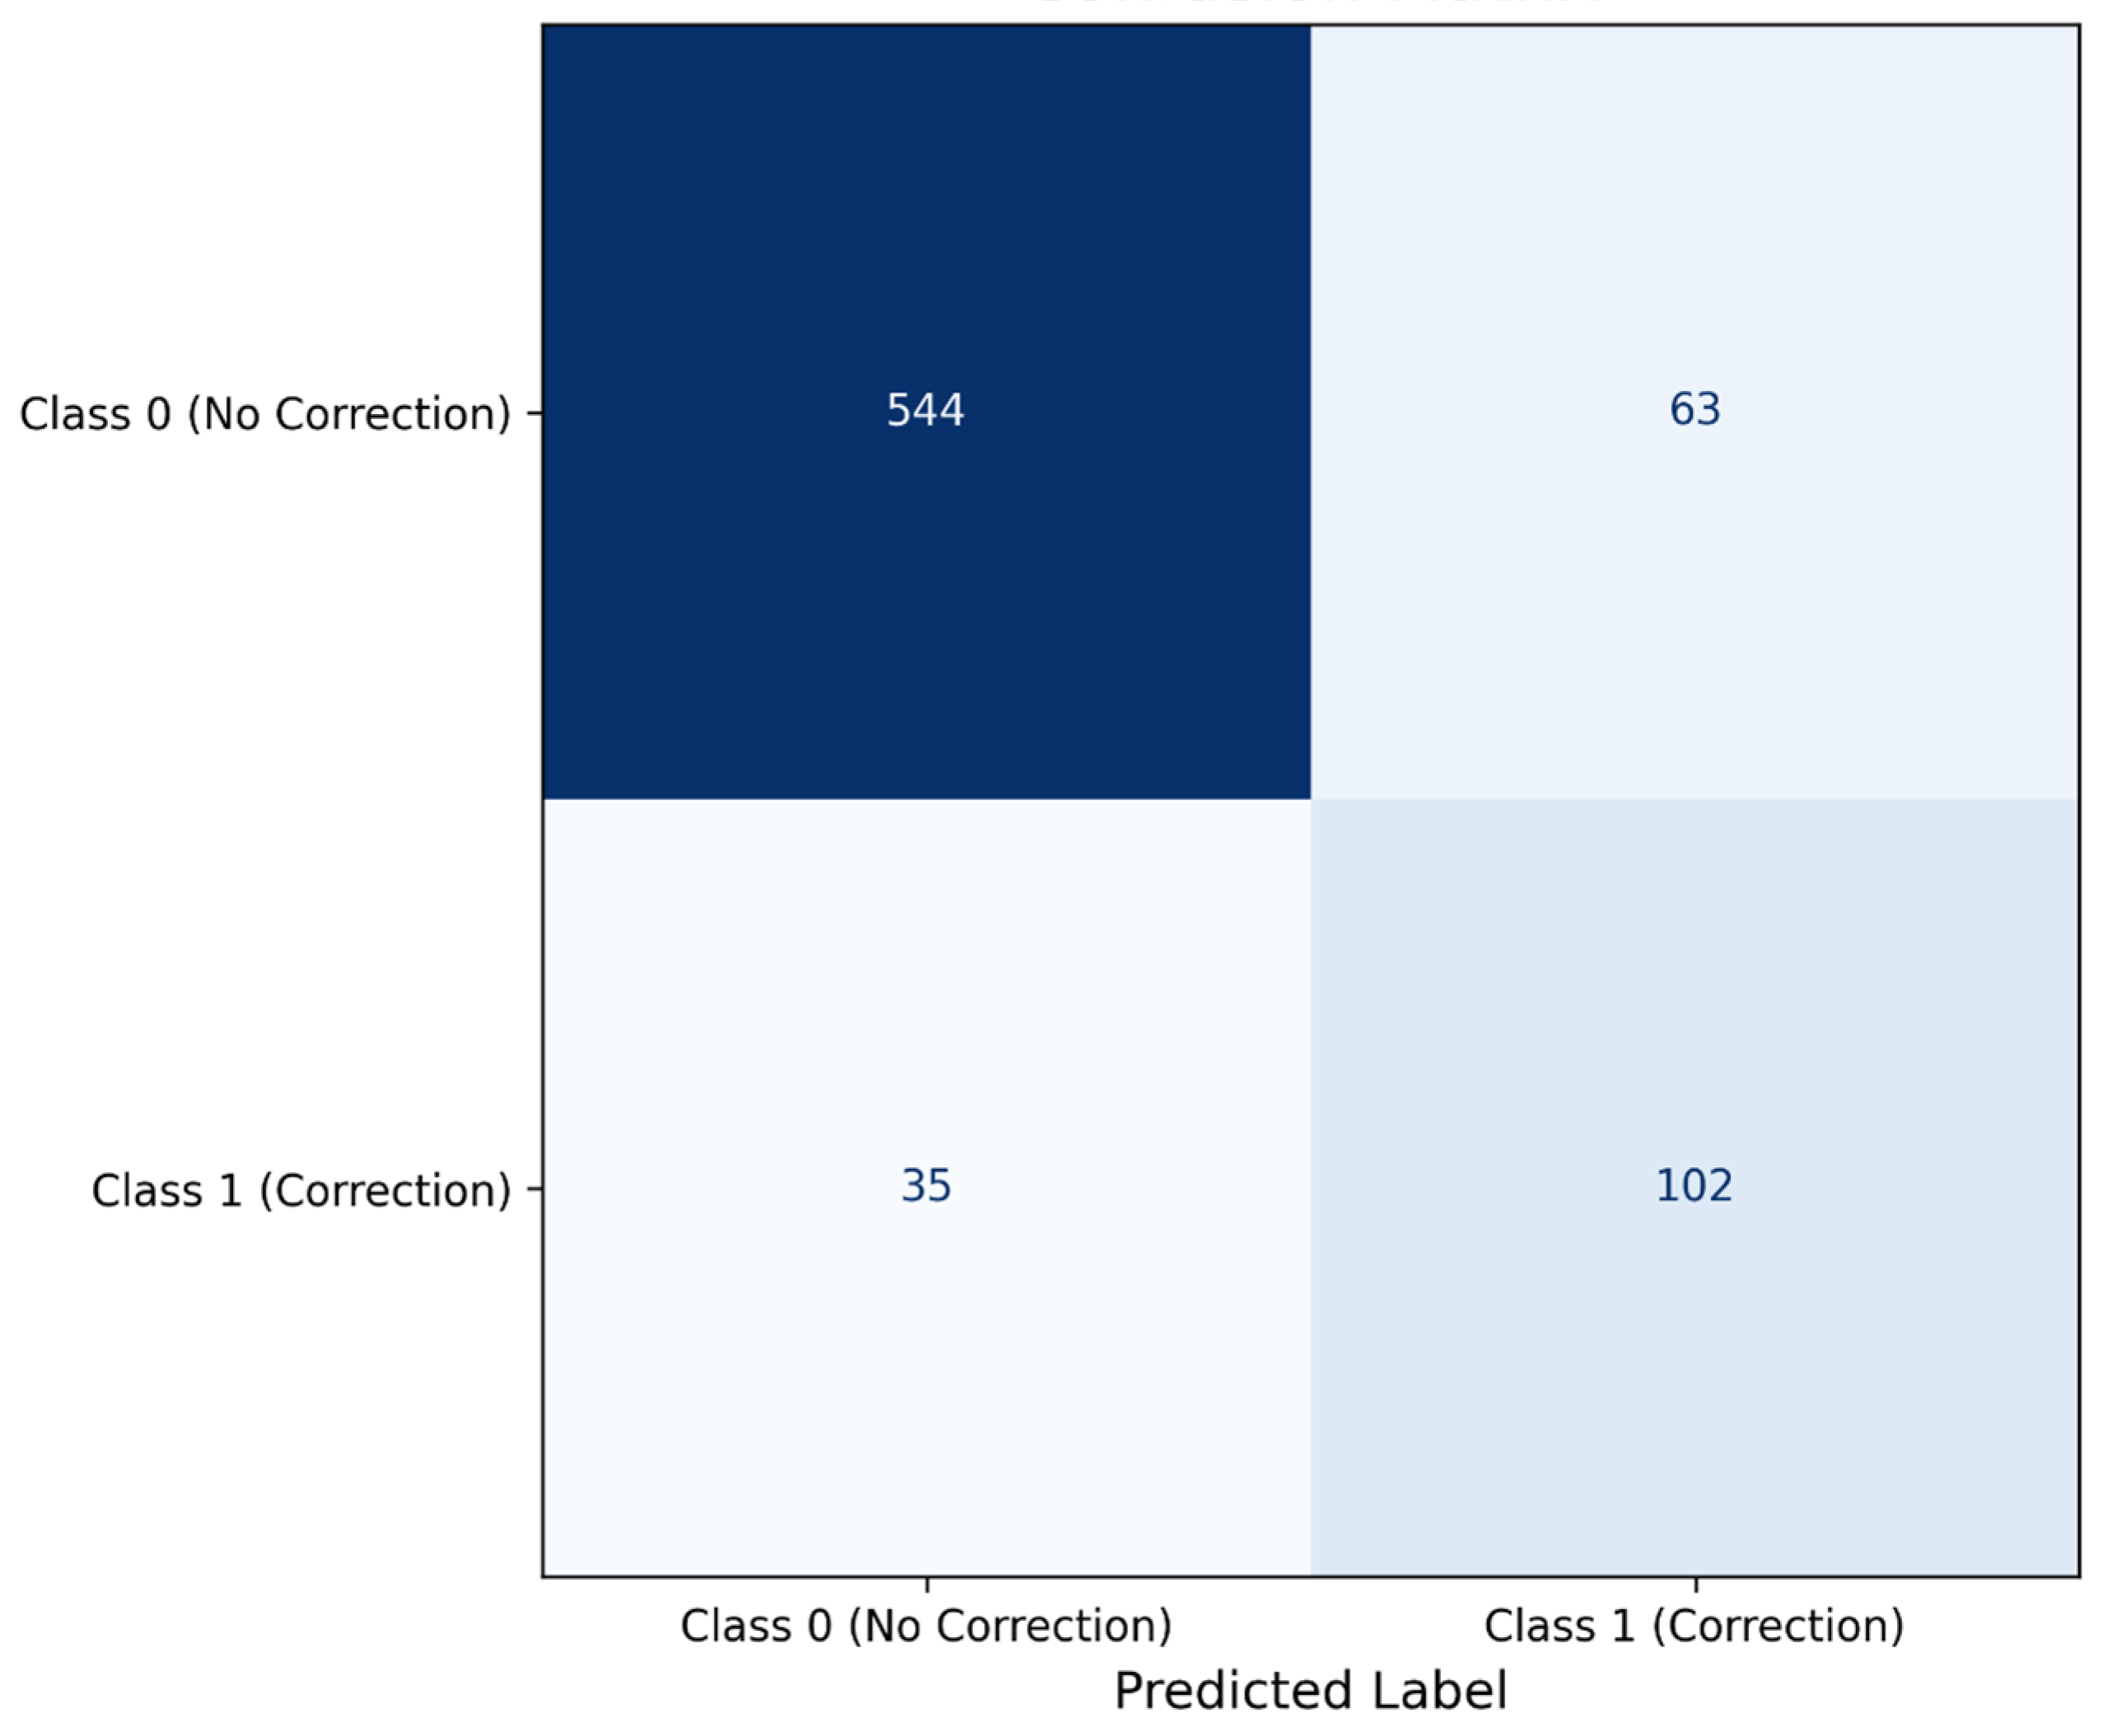
Figure 2), principal component analysis (PCA), and t-distributed stochastic neighbor embedding (t-SNE) of the feature space, and per-image probability heatmaps.
3. Results and Discussion
The results demonstrate the deep MLP model’s performance.
Figure 1 shows a high ROC AUC of 0.90 and a precision-recall AUC of 0.74.
Figure 2 (confusion matrix) indicates 544 true negatives, 63 false positives, 35 false negatives, and 102 true positives. The accuracy was 86.8%, the precision (damage) was 61.8%, and the recall (damage) was 74.5%. The high recall for the “Damage” class was crucial for disaster response.
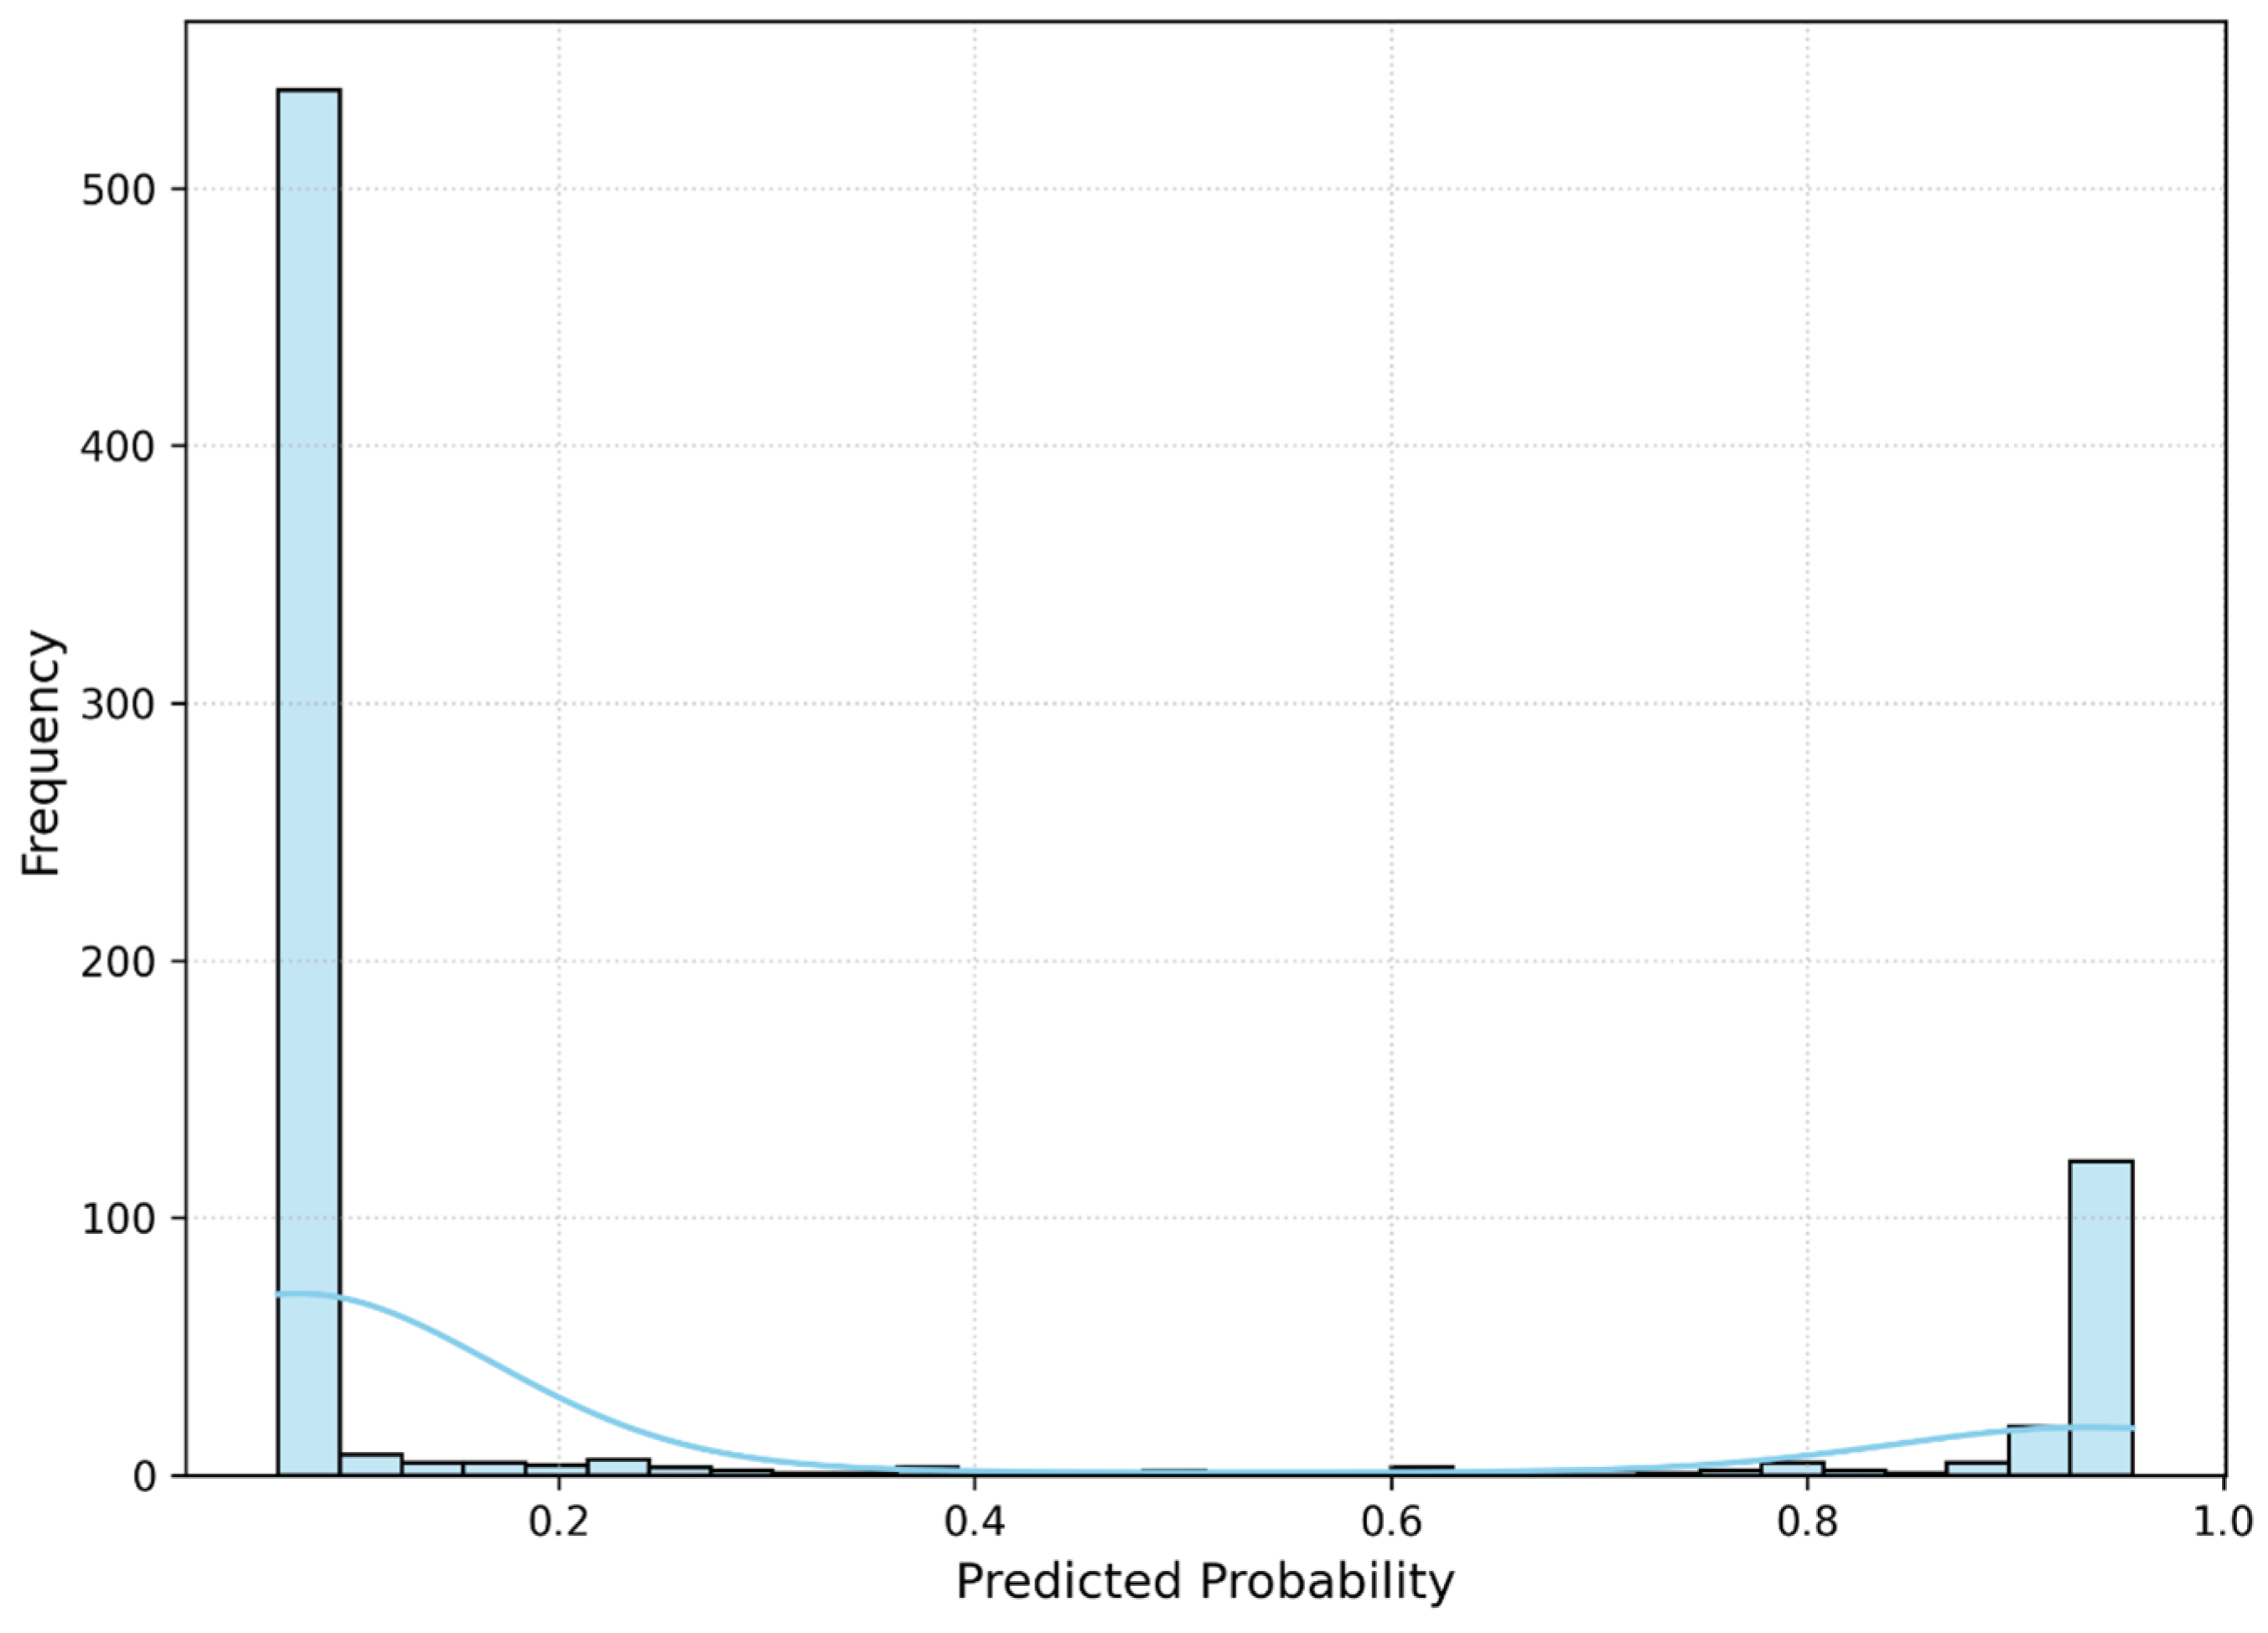
Figure 3 shows a bimodal distribution of predicted probabilities (peaks near 0 and 1).
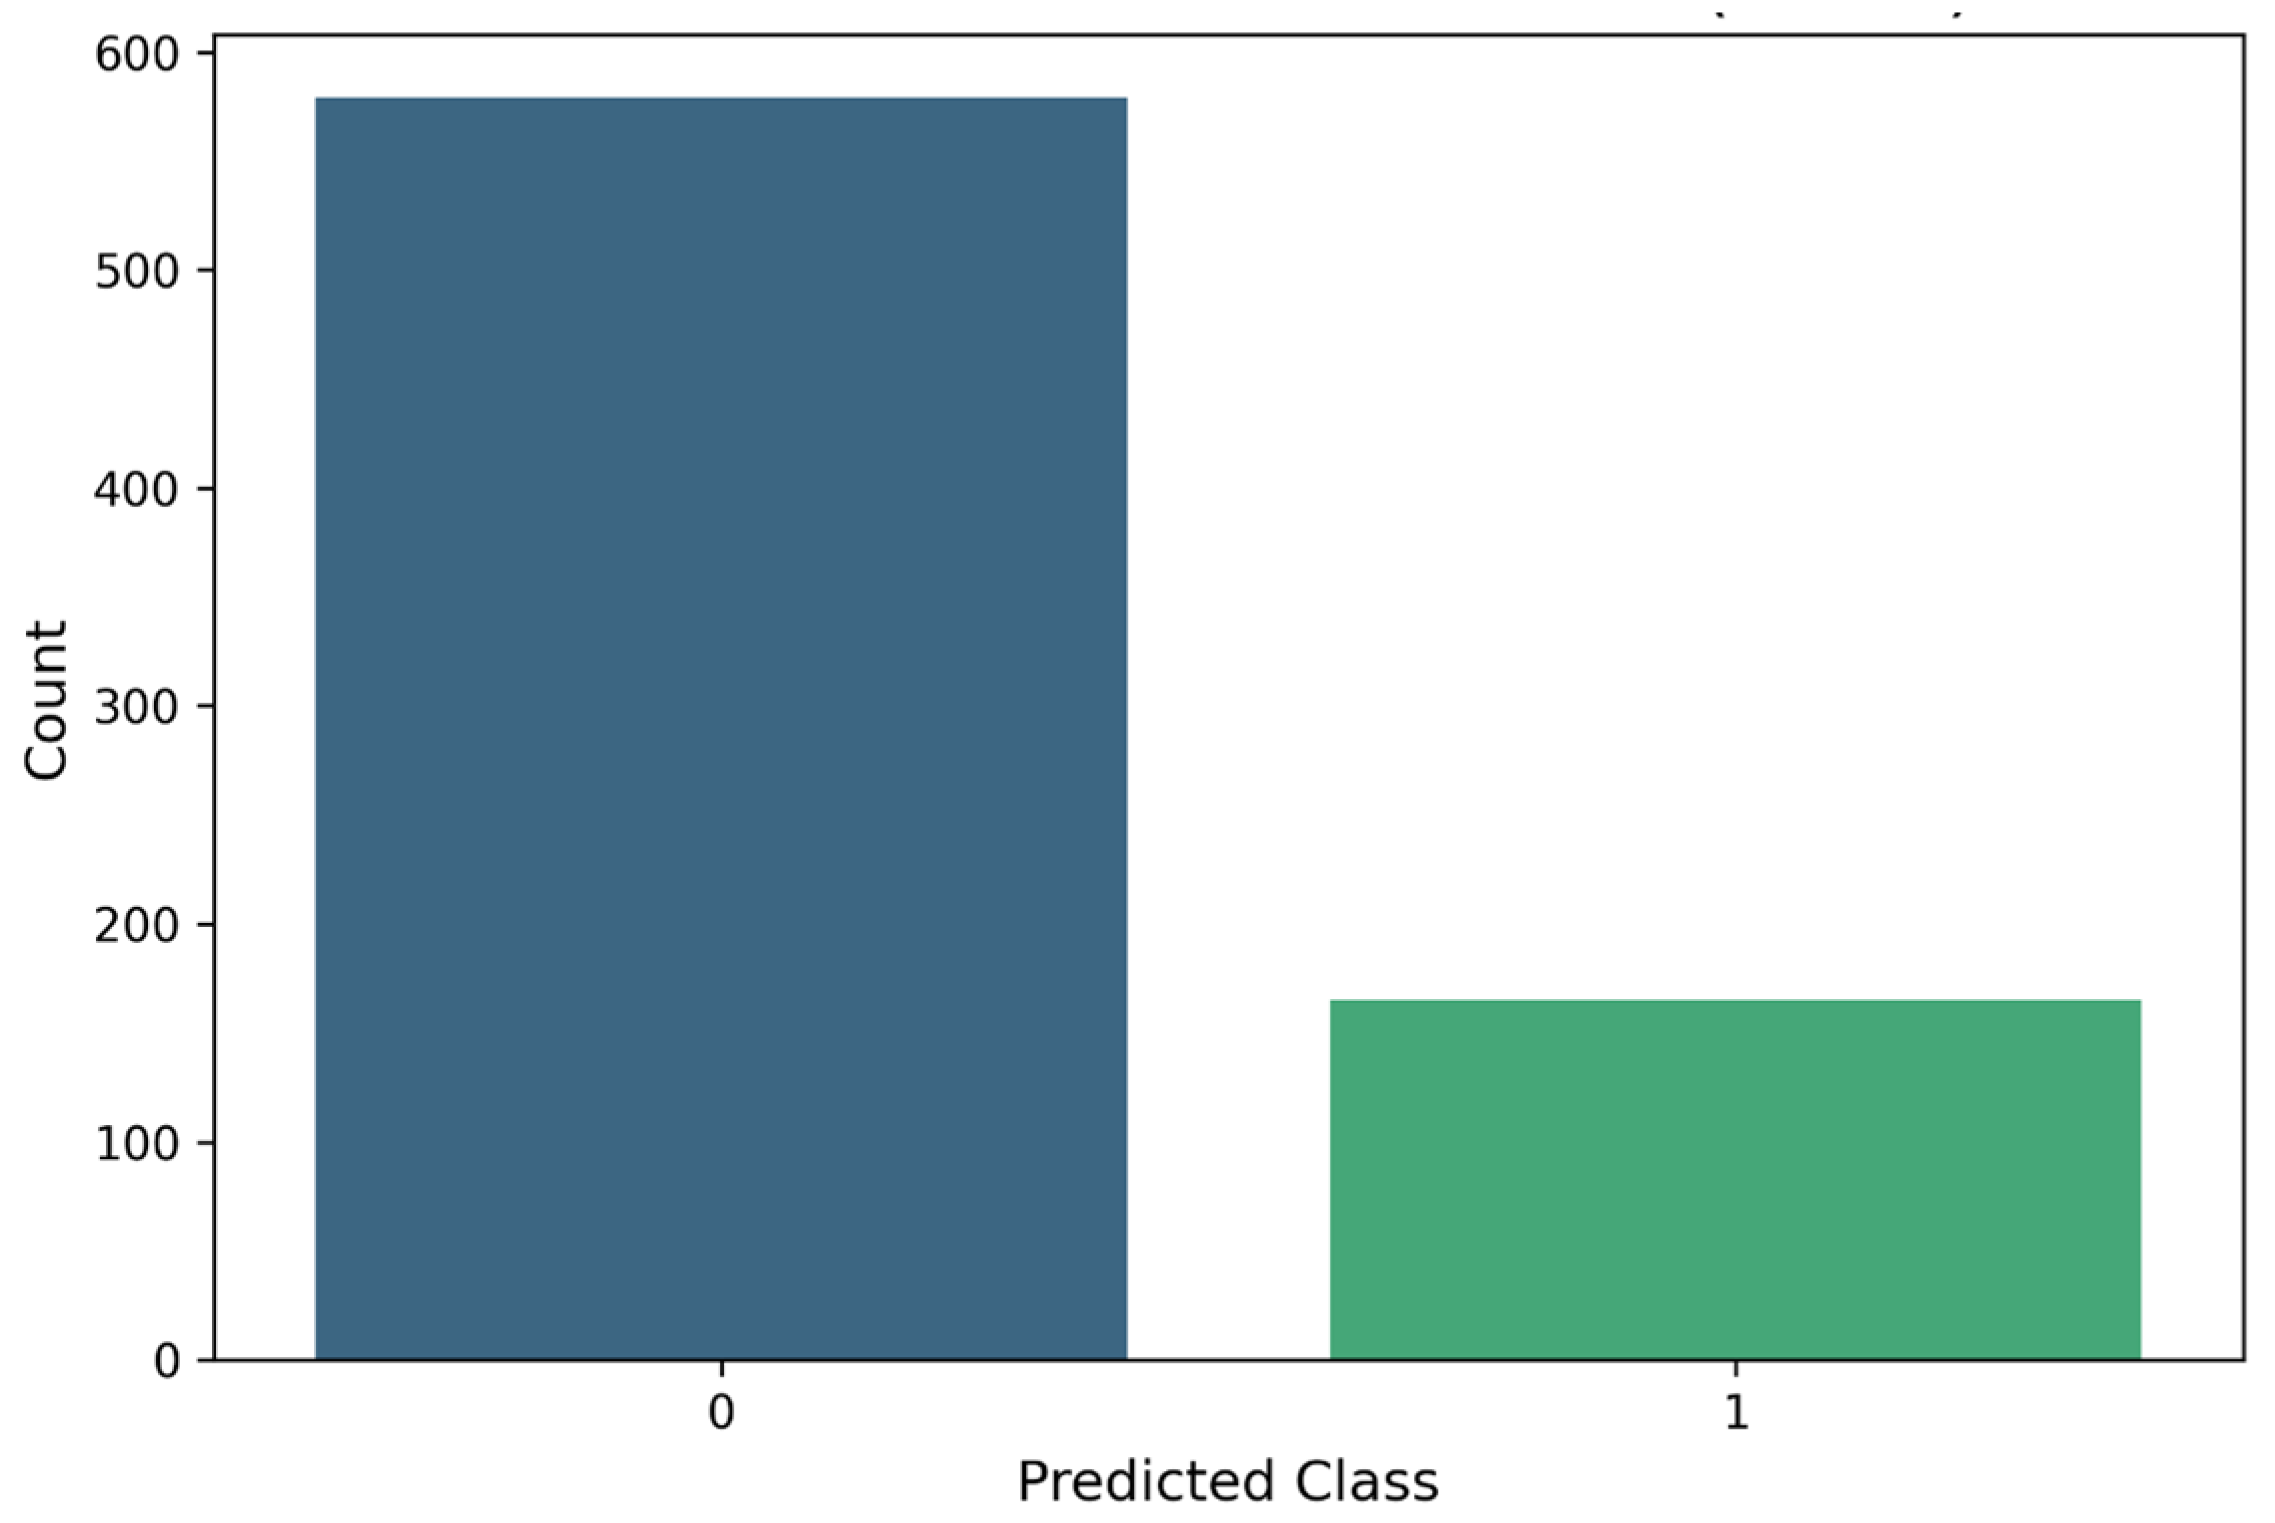
Figure 4 indicates more “No Damage” predictions, reflecting dataset imbalance.
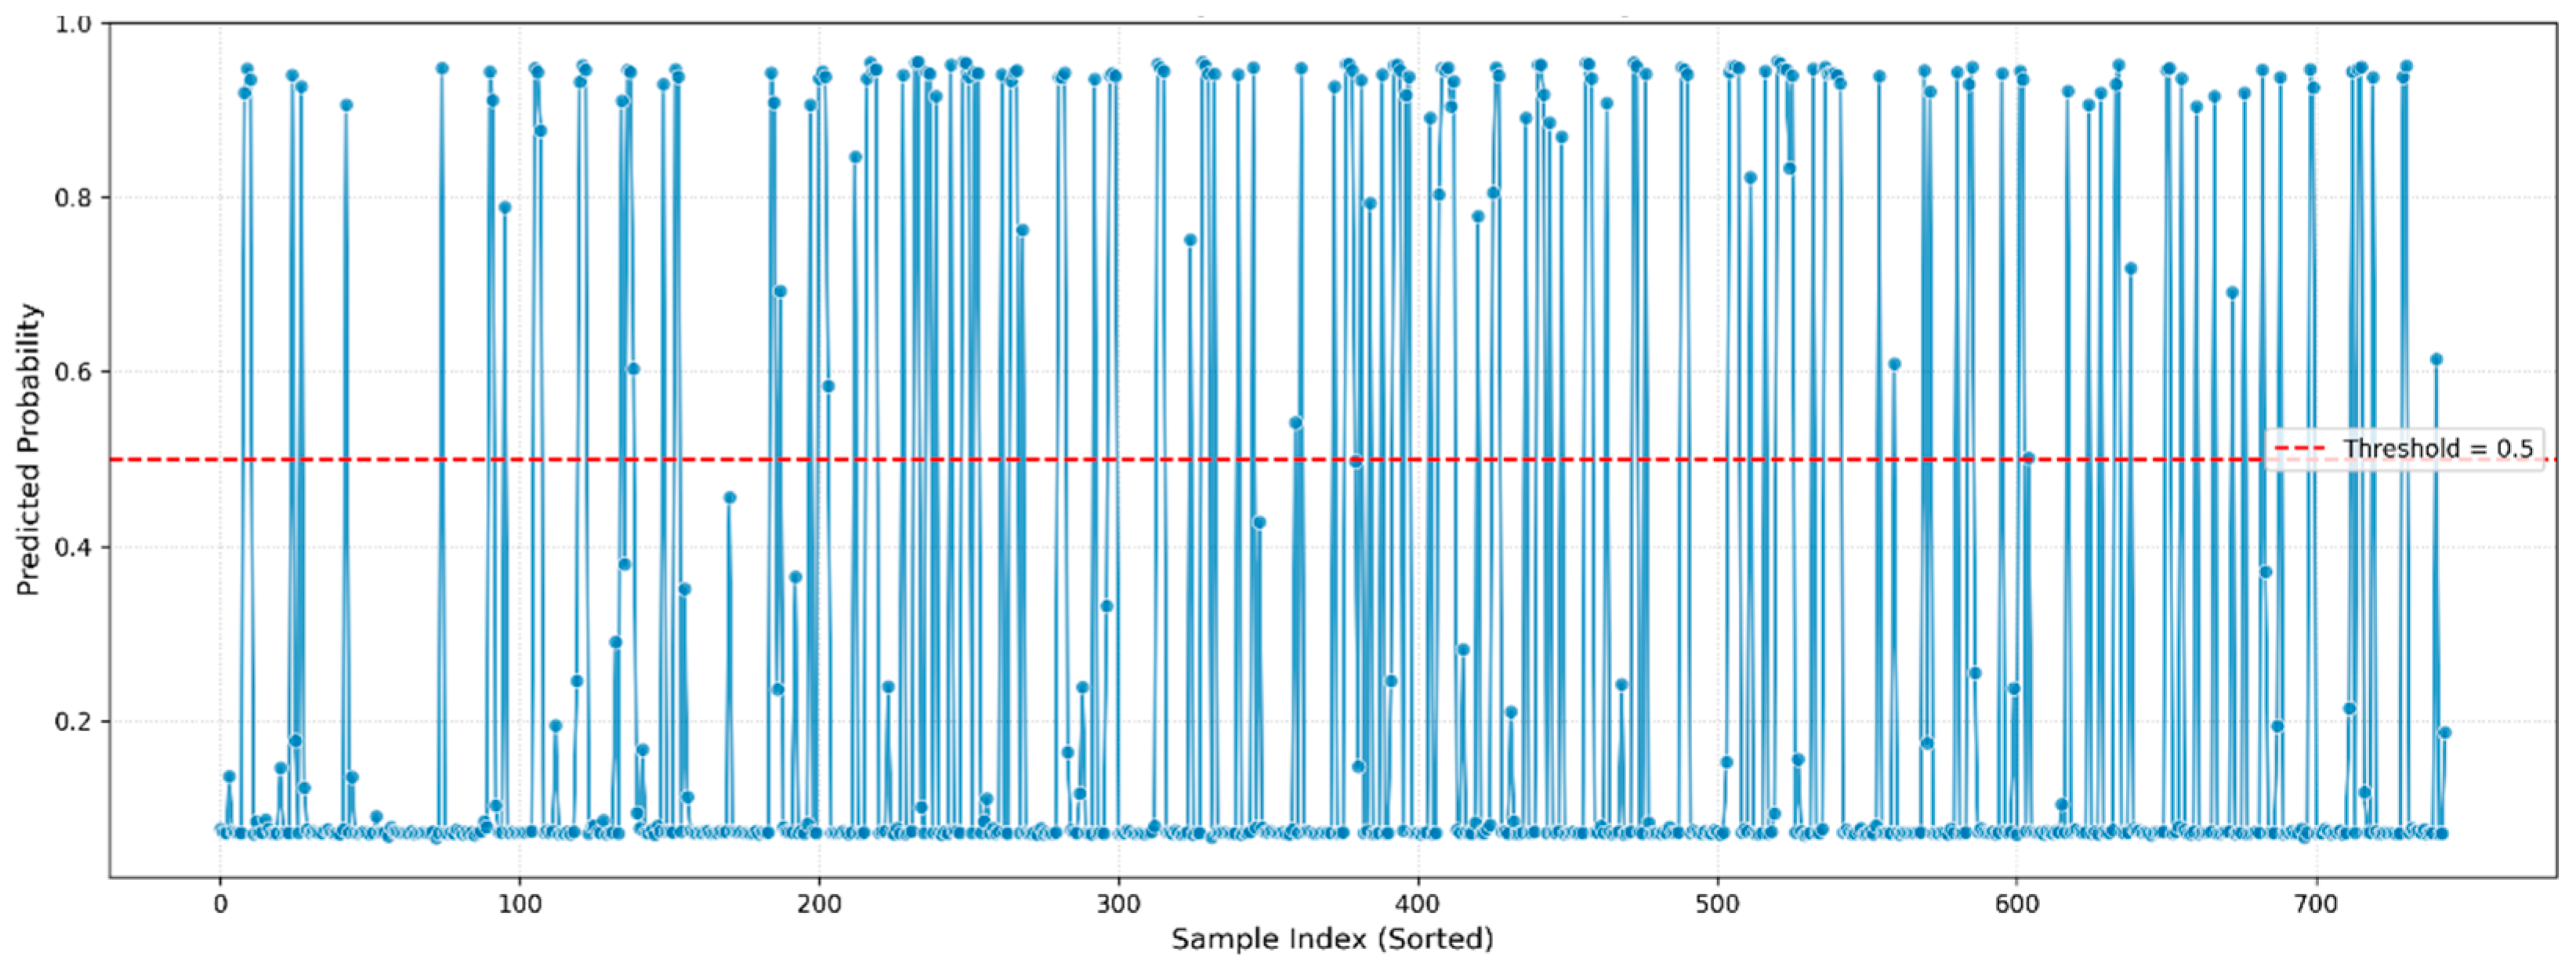
Figure 5 illustrates predicted probabilities over time, mostly near 0 or 1, with a 0.5 threshold.
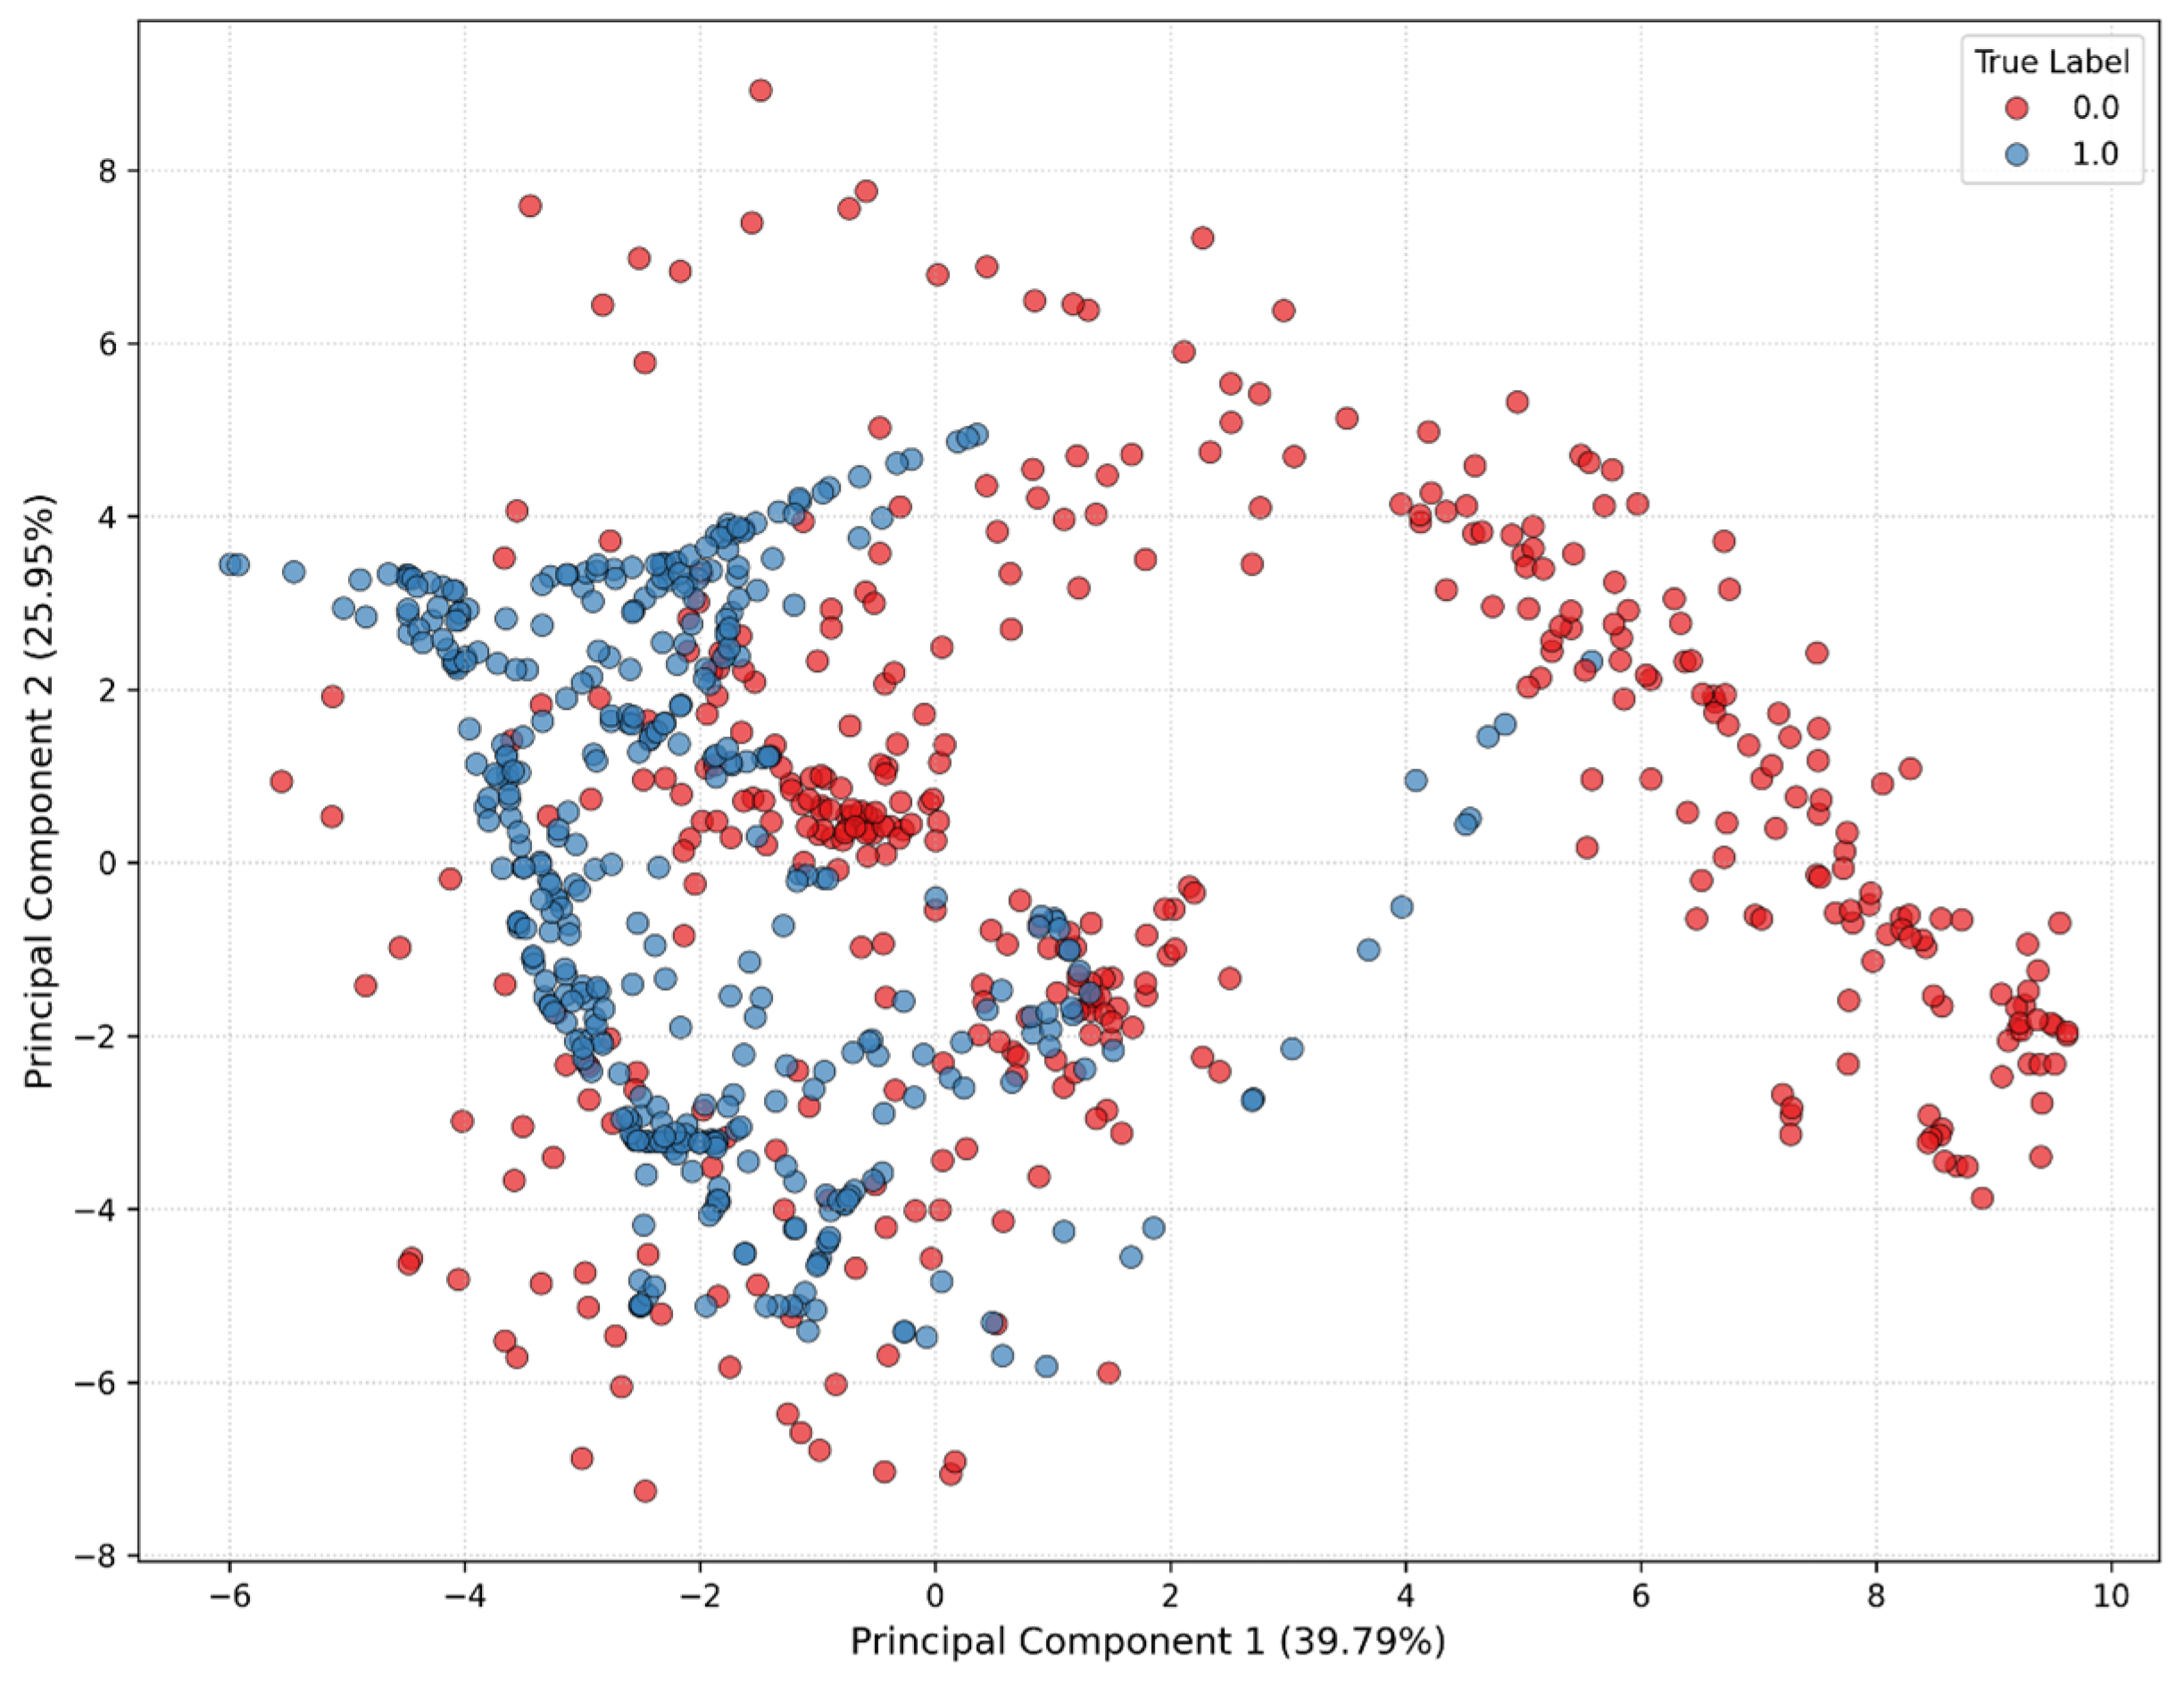
Figure 6 (PCA) shows considerable overlap, suggesting complex relationships.
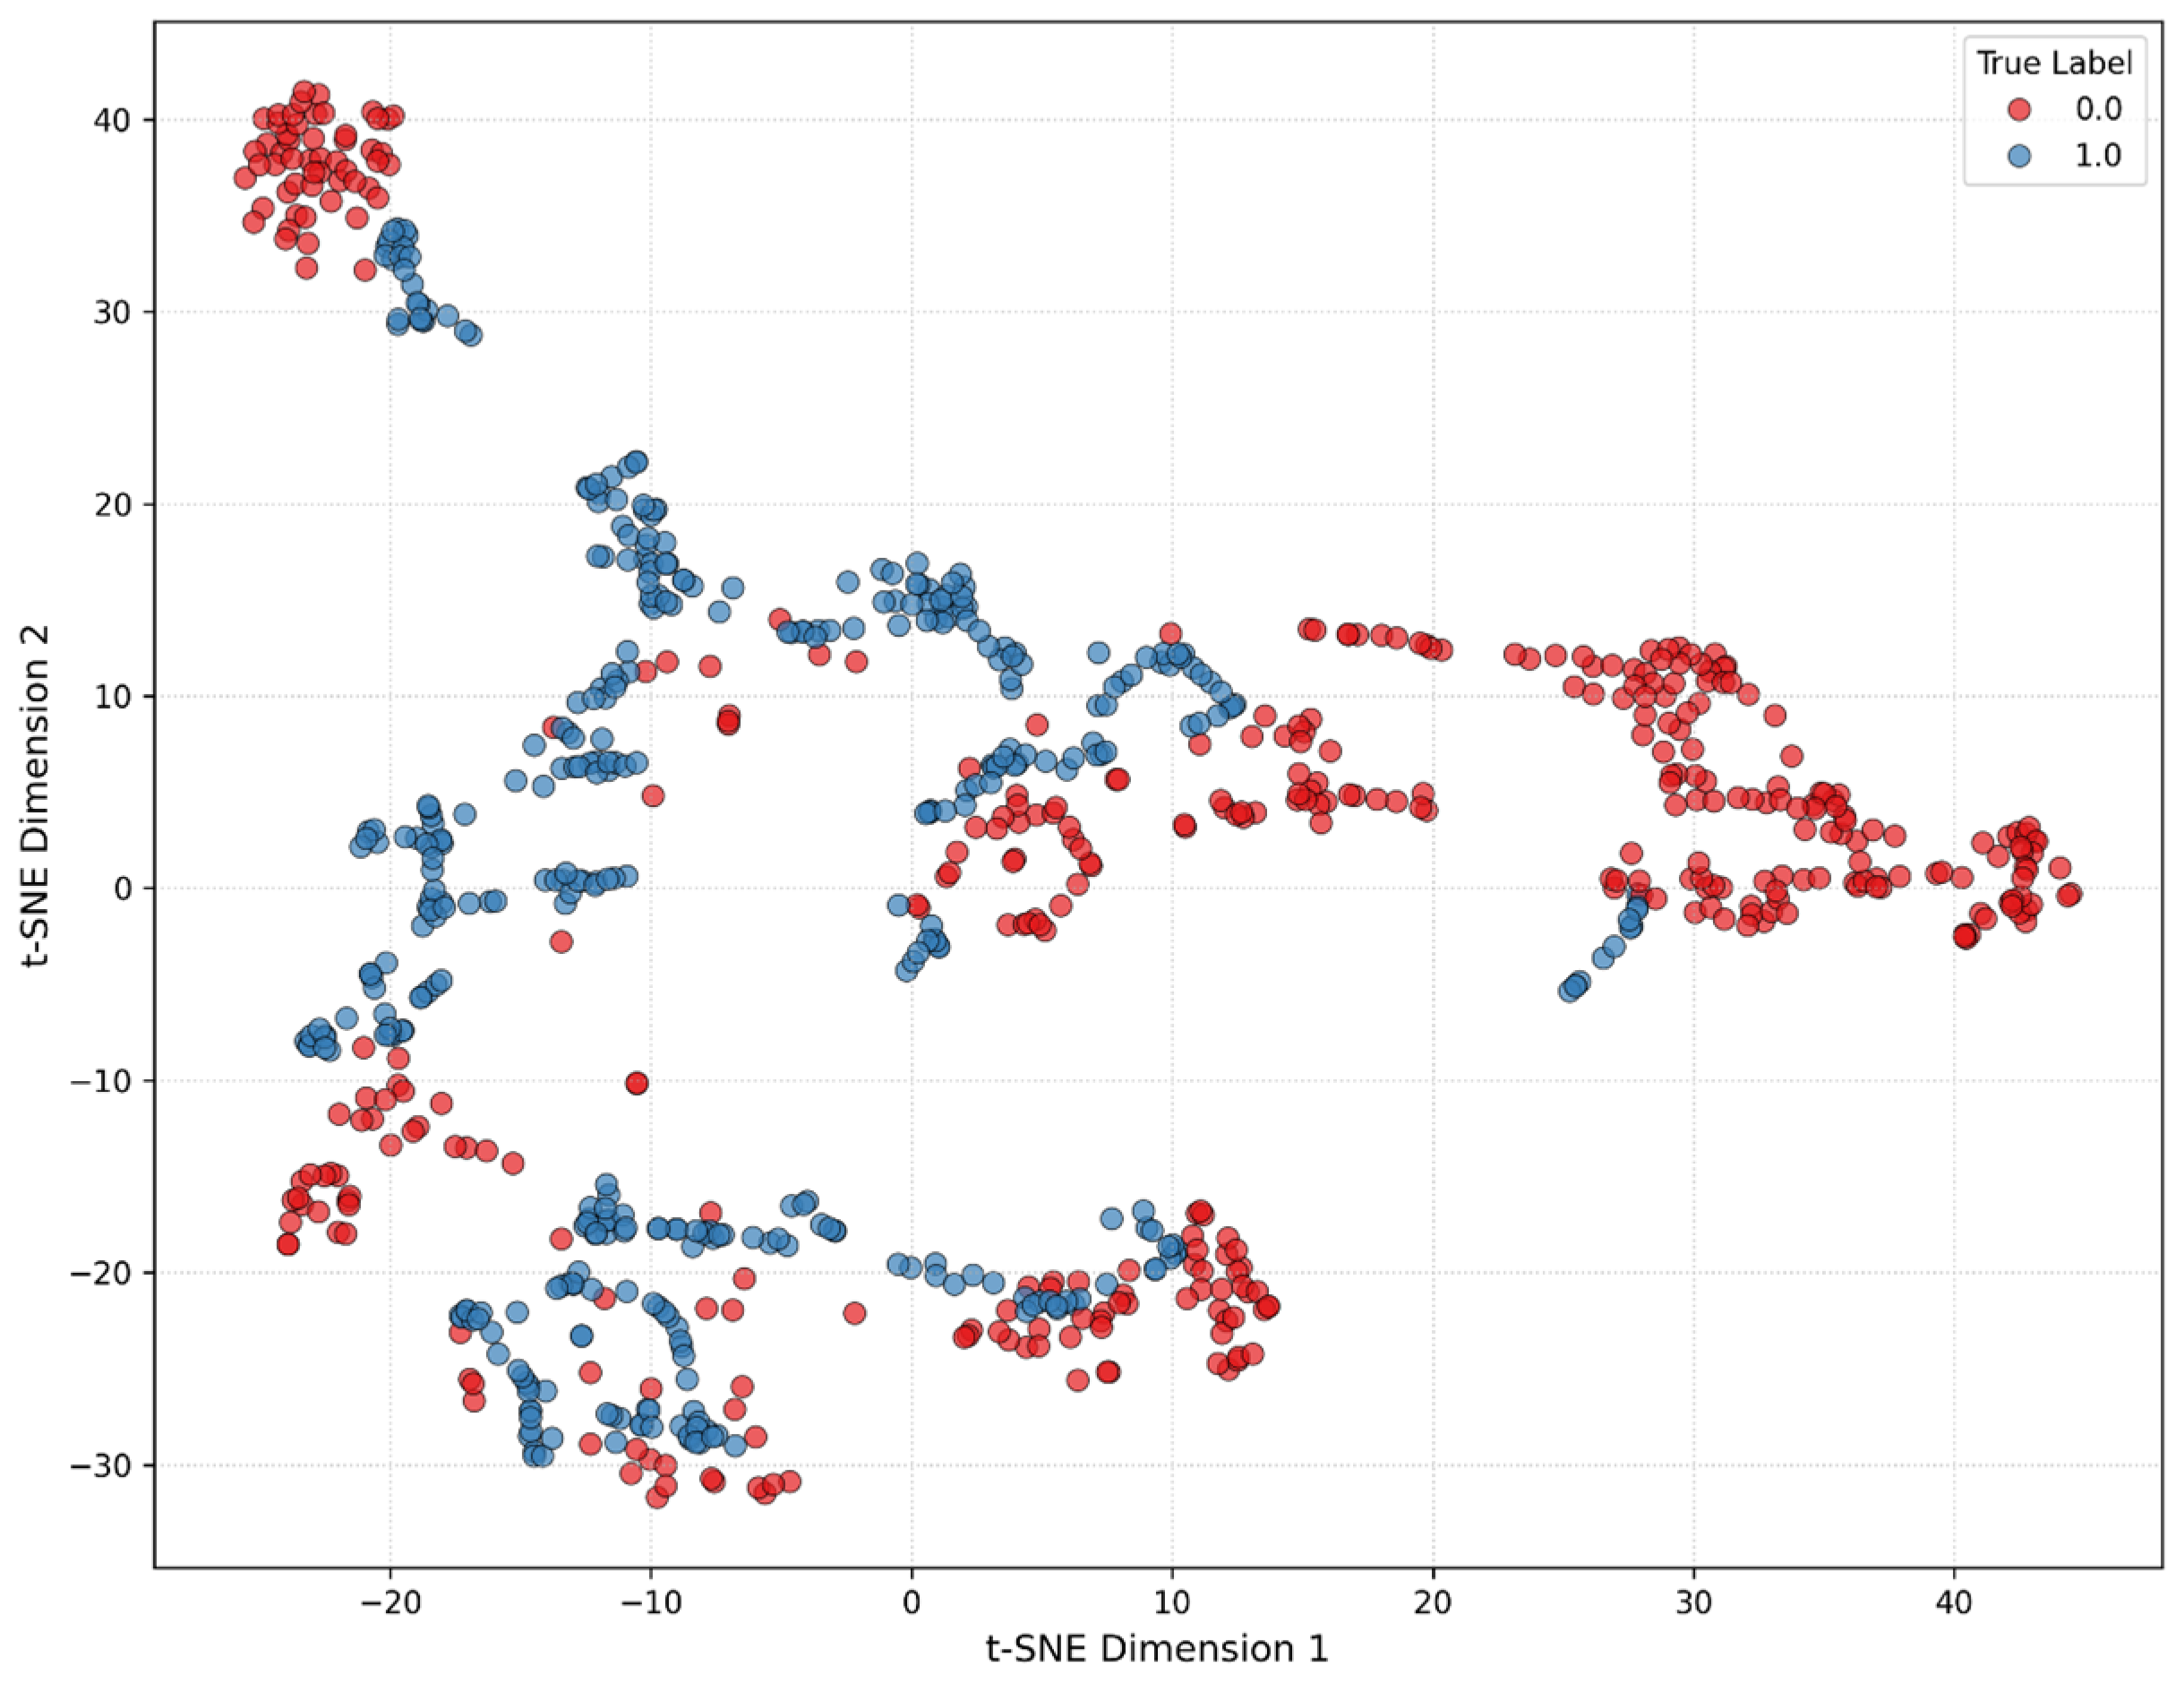
Figure 7 (t-SNE) reveals more distinct clustering, indicating the effectiveness of extracted features for classification despite non-linear separability challenges.
4. Damage Detection from Earthquake Images: Case Study
4.1. Visualization of Inference Results: Image with Damaged Areas Highlighted in Red
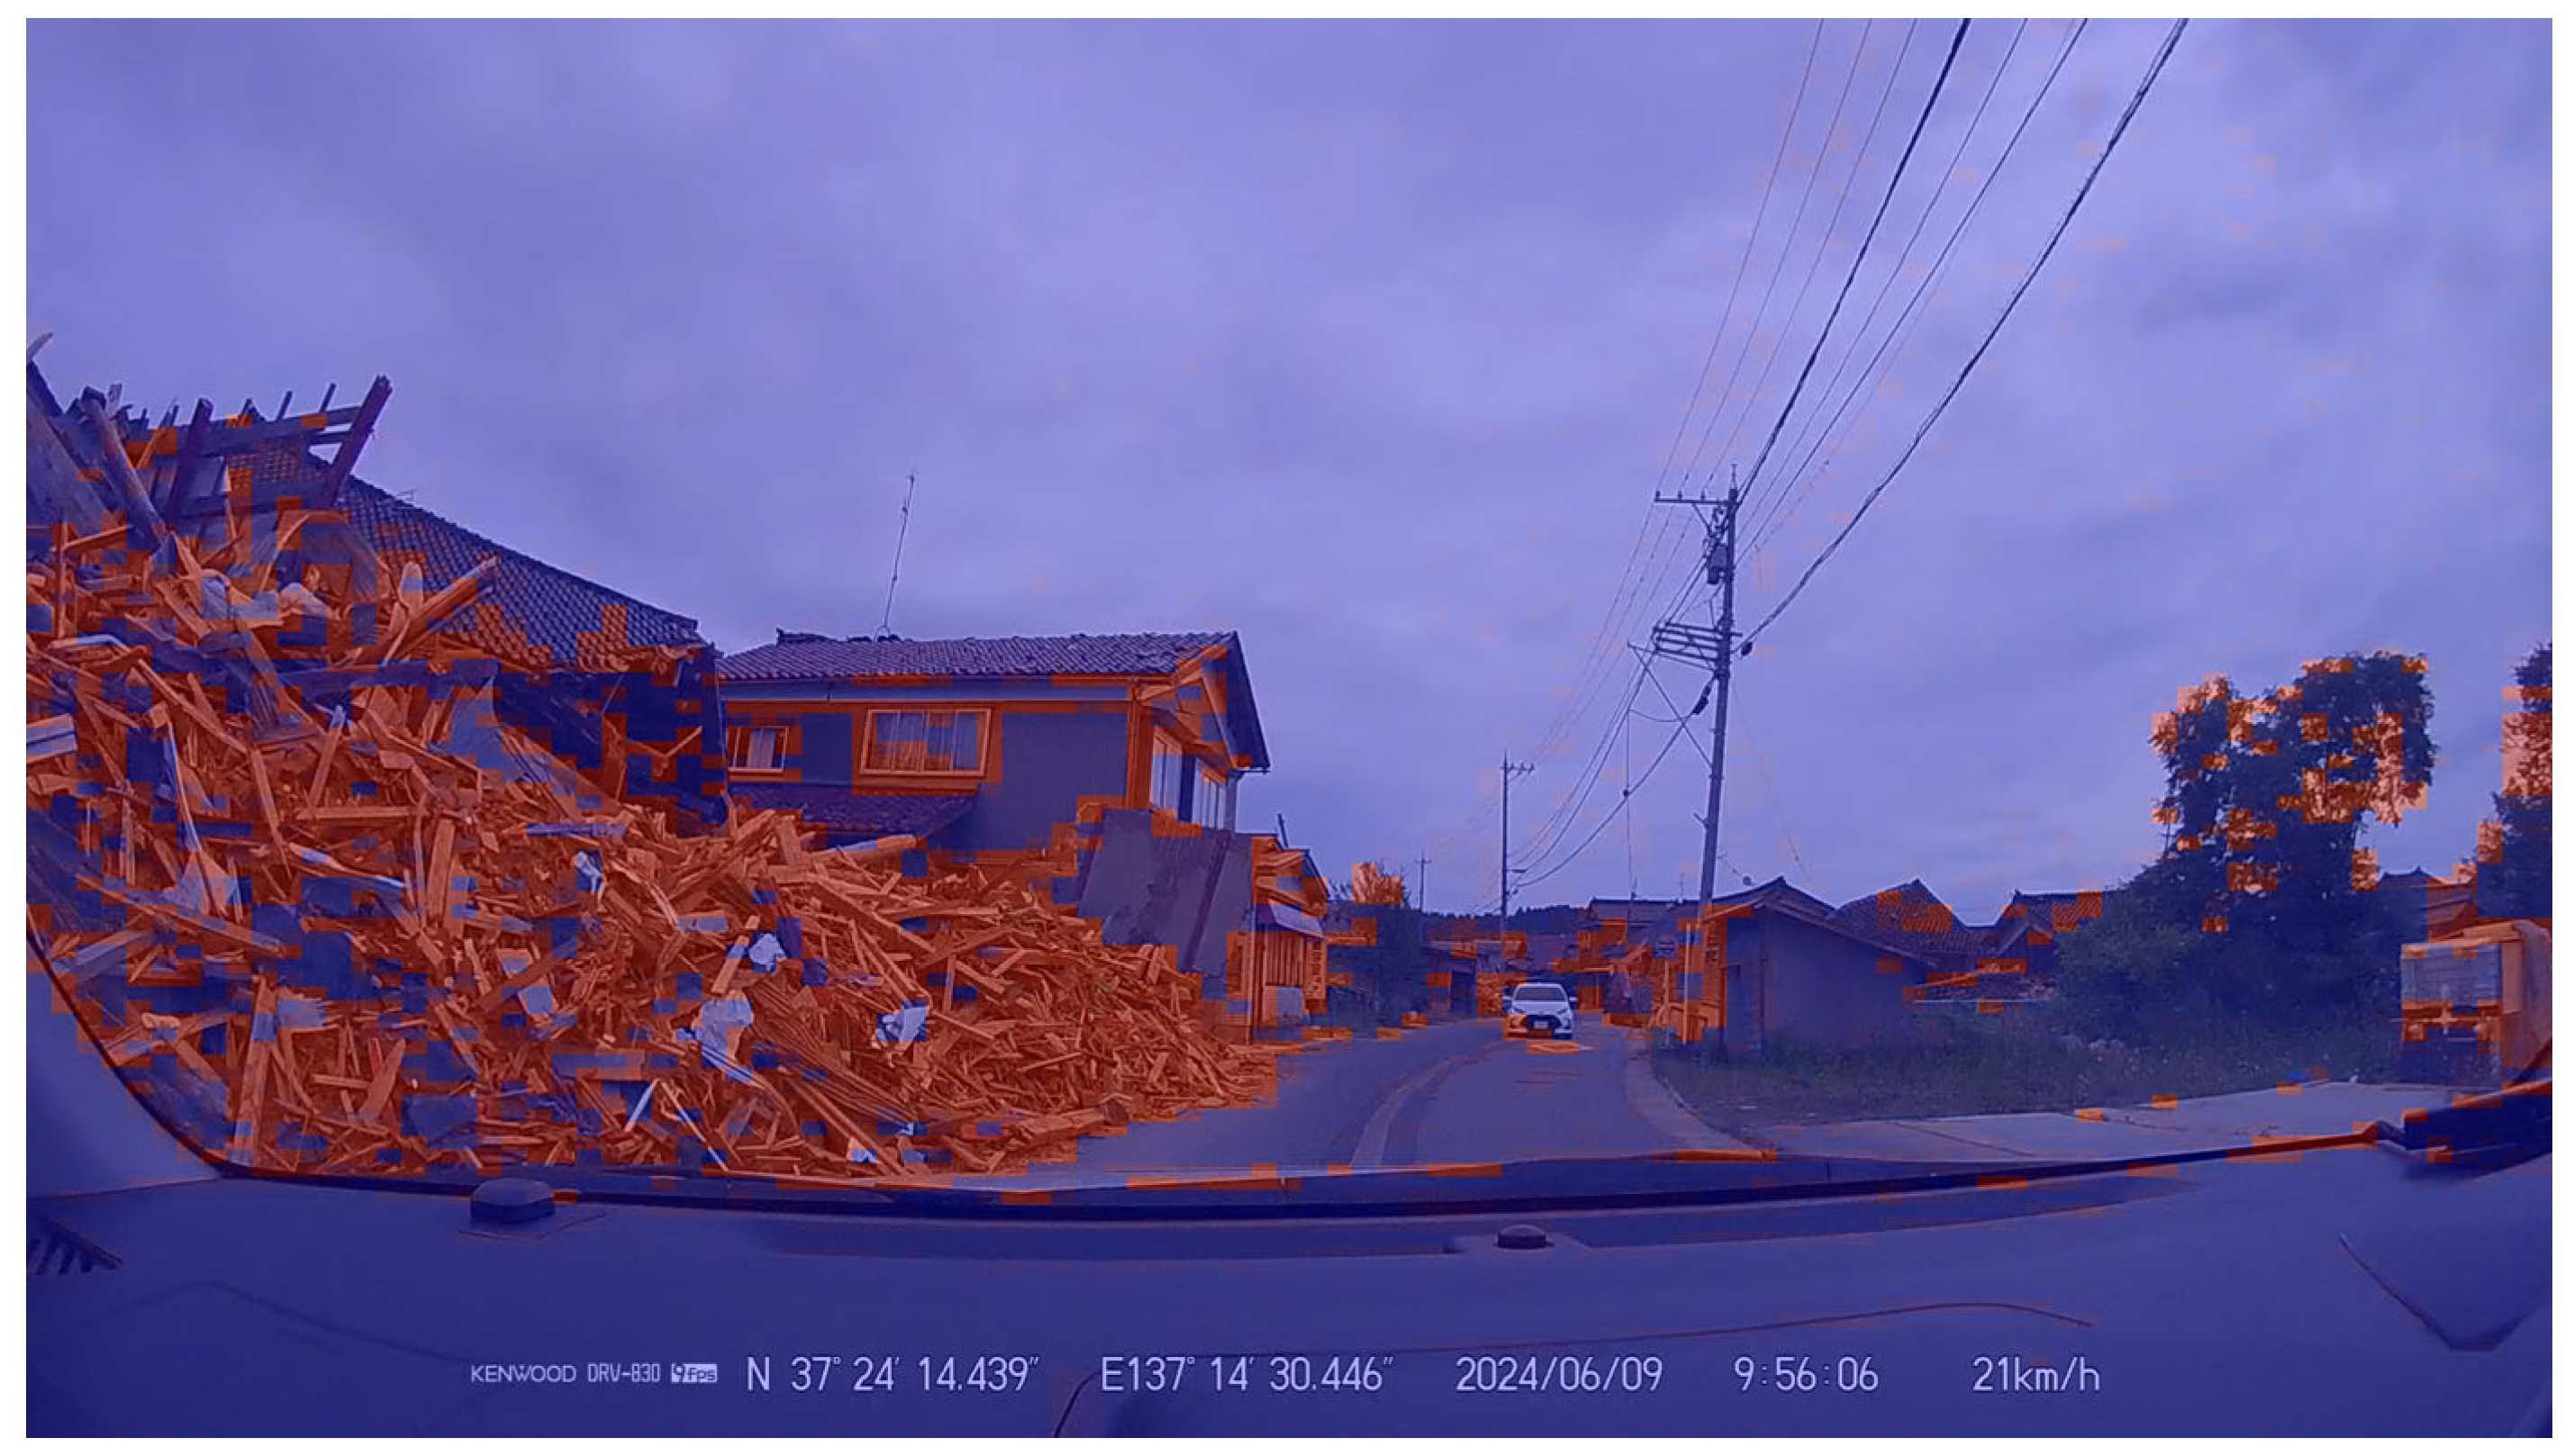
We analyzed the provided images as concrete examples of earthquake damage detection using a deep learning model. These images are crucial for intuitively understanding the data processing, model inference results, and the nature of the training data in this research. First, the first image shows the model’s inference results visually overlaid onto the original image (
Figure 8). In this image, regions identified by the model as “Damage” are indicated by a red, semi-transparent overlay. This allows for immediate visual confirmation of which buildings or structures the model estimated to be damaged. The varying intensity of the red color likely reflects the confidence level (probability) of the model’s damage estimation. For instance, a darker red might suggest a higher certainty of damage. Such a heatmap-like visualization is extremely useful for rapidly identifying damaged areas and providing concrete information to disaster response teams. This is an example of the damage mapping, which is a primary objective of this research, demonstrating the potential for automated systems to provide practical information.
4.2. Training Data: Example of No Damage (Class 0)
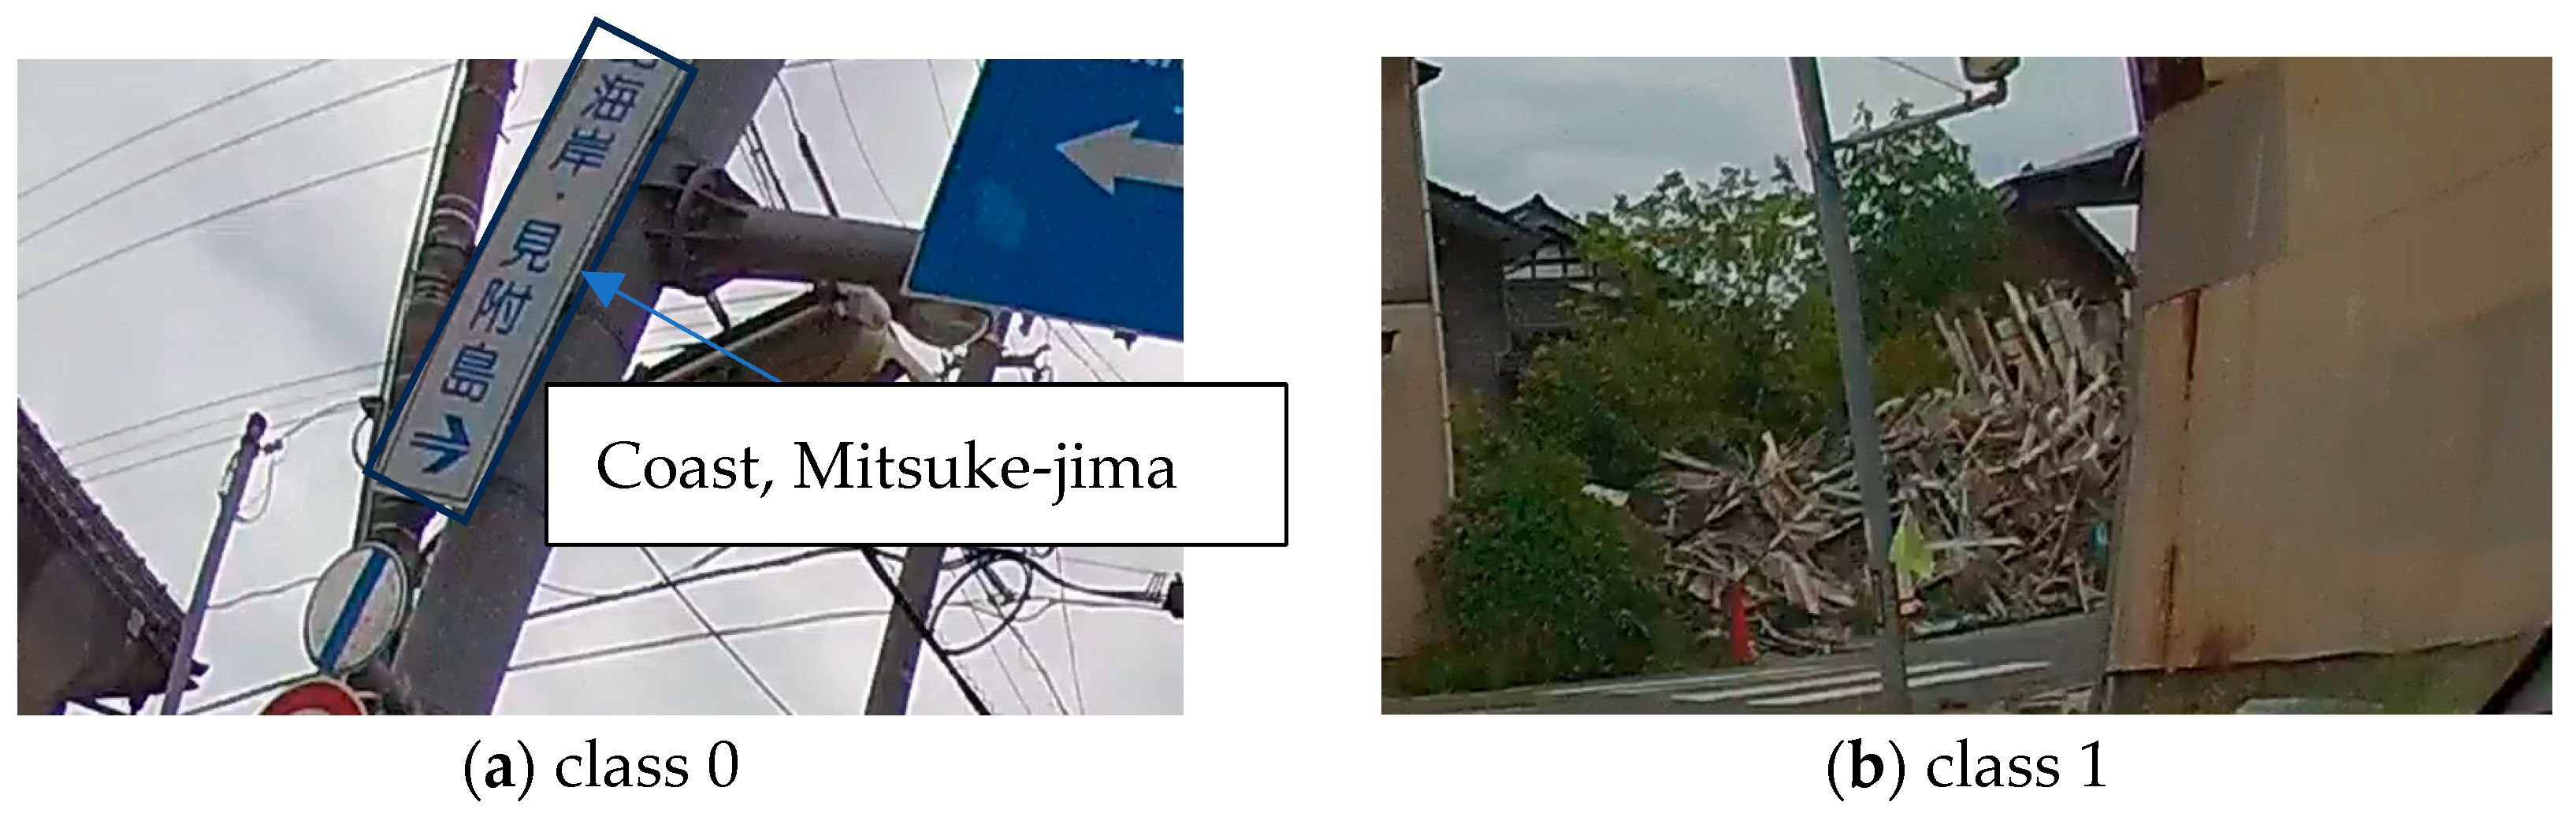
Figure 9a shows a typical example of a training image patch classified as “No Damage” (Class 0) used for model training. This image patch captures buildings and their surroundings that show no obvious signs of damage, such as structural deformation, abnormal changes, or scattered debris. This serves as the foundational data for the model to learn “normal” conditions, i.e., states requiring “No Correction.” By learning features like intact building shapes, uniform surfaces, and orderly surrounding environments, the model can then distinguish patches with different characteristics as “Damage.”
4.3. Training Data: Example of Damage (Class 1)
Figure 9b is a typical example of a training image patch classified as “Damage” (Class 1) used for model training. This image patch clearly shows explicit signs of earthquake damage, such as structural breakage of buildings, wall collapses, roof damage, and debris scattered in the surroundings. Such data is essential for the model to learn diverse damage patterns, including cracks, structural distortions, debris piles, or exposed internal structures. Importantly, providing a balanced representation of images with different damage types and degrees of severity is crucial for the model to achieve a high recall rate for the “Damage” class. Techniques like SMOTE oversampling likely contribute to enabling the model to learn the varied characteristics within this minority class.
Figure 8 and
Figure 9 illustrate the training process and inference results of the deep learning model in this study. The first visualization image demonstrates the potential for the model to function as a practical damage mapping tool, while the second and third training images provide specific examples of the visual features the model learns to differentiate between normal and abnormal (damaged) conditions. These images serve as valuable case studies for understanding how the model detects complex earthquake damage and visually represents its findings.
5. Conclusions
The research results demonstrate a highly effective deep learning model for automated earthquake damage assessment from ground-level imagery. The combination of enhanced feature extraction, a robust deep MLP model with batch normalization and dropout, and SMOTE for class imbalance mitigation yields excellent overall accuracy (86.8%) and, critically, high recall (74.5%) for the “Damage” class, minimizing oversight of damaged areas. The high ROC AUC (0.90) confirms strong discriminatory power. Future work includes integrating convolutional neural networks or multi-modal approaches and refining feature engineering and adaptive thresholding techniques for real-world deployment.
Author Contributions
Conceptualization, H.S.; methodology, H.S.; software, H.S.; validation, H.S. and H.S.; formal analysis, H.S.; investigation, H.S.; resources, H.S.; data curation, H.S.; writing—original draft preparation, H.S.; writing—review and editing, H.S.; visualization, H.S. and Y.U.; supervision, H.S. and Y.U.; project administration, H.S.; All authors have read and agreed to the published version of the manuscript.
Funding
This research received no external funding.
Institutional Review Board Statement
Not applicable.
Informed Consent Statement
Not applicable.
Data Availability Statement
Data will be available on request.
Conflicts of Interest
The authors declare no conflicts of interest.
References
- Dong, L.; Jie, S. A comprehensive review of earthquake-induced building damage detection with remote sensing techniques. ISPRS J. Photogramm. Remote Sens. 2013, 84, 85–99. [Google Scholar] [CrossRef]
- Kircher, C.A.; Nassar, A.A.; Kustu, O. Development of building damage functions for earthquake loss estimation. Earthq. Spectra 1997, 13, 663–682. [Google Scholar] [CrossRef]
- Inel, M.; Ozmen, H.B.; Bilgin, H. Re-evaluation of building damage during recent earthquakes in Turkey. Eng. Struct. 2008, 30, 412–427. [Google Scholar] [CrossRef]
- Lu, H.; Masayuki, K.; Kei, H.; Norio, M.; Haruo, H.; Satoshi, T. Building damage and casualties after an earthquake. Nat. Hazards 2003, 29, 387–403. [Google Scholar] [CrossRef]
| Disclaimer/Publisher’s Note: The statements, opinions and data contained in all publications are solely those of the individual author(s) and contributor(s) and not of MDPI and/or the editor(s). MDPI and/or the editor(s) disclaim responsibility for any injury to people or property resulting from any ideas, methods, instructions or products referred to in the content. |