1. Introduction
In recent years, Unmanned Aerial Vehicles (UAVs), commonly known as drones, have emerged as one of the most rapidly advancing technologies within engineering and applied sciences. Due to their rapid development, they have been increasingly deployed in everyday tasks across multiple domains. As their use has become more widespread, greater emphasis has been placed on the need for safe operation, efficient energy usage, and reliable performance, particularly in contexts where human intervention is reduced or replaced [
1,
2,
3].
A wide range of industrial sectors has incorporated UAVs into their workflows. In precision agriculture, drones have been utilized for crop monitoring and spraying [
4]; in logistics, delivery processes have been optimized using UAV-based solutions [
5]; and in disaster response, they have been deployed for situational awareness and rescue coordination [
6,
7]. The advantages of UAVs—such as low operating cost, rapid deployability, and flexible maneuverability—have been recognized as superior to traditional methods in many cases [
8,
9]. Besides civil usage, military and law enforcement applications have also been increasingly supported by UAV technologies [
10]. Numerous models have been made available, differing in payload capacity, autonomy, energy consumption, and onboard sensors, which has resulted in an almost unlimited scope of application. Efforts to integrate light unmanned systems—such as drones—into air traffic management further underscore the growing importance of environmental risk assessment in UAV operations [
11].
Accurate estimation of energy demand and flight-related risks is required to ensure the safe and efficient use of UAVs. Risks such as battery depletion, adverse weather conditions, or mechanical faults must be anticipated before the mission. Among environmental variables, wind is particularly impactful due to its direct influence on UAV stability, motor workload, and aerodynamic resistance. When flying against the wind, a UAV’s motors must generate greater thrust to overcome aerodynamic resistance, leading to a significant increase in power consumption. This observation is supported by findings in other areas of flight safety. For instance, in balloon flight research, wind-induced instability was also identified as a major contributor to in-flight anomalies and accidents [
12]. While several predictive models have been introduced in the literature to evaluate such risks [
10,
13,
14], these models have often relied on simulations or catalog specifications. While useful for initial assessments, simulations often provide overly optimistic results as they typically do not account for the complexities of real-world environments, such as sudden wind gusts, air density changes, or the non-linear behavior of batteries under dynamic load. Furthermore, their applicability under real operational conditions has not always been validated, and their reliability has remained uncertain.
Post-flight diagnostics have been proposed as a promising approach to evaluate UAV performance and flight safety by analyzing telemetry data (e.g., voltage, current, temperature, and GPS coordinates). This method can validate predictive risk models using empirical flight data, enabling real-world verification of theoretical results [
13]. This step is crucial for improving the accuracy of safety estimations and energy consumption forecasting, particularly when developing autonomous and self-adjusting control systems.
The fuzzy-based risk model used in this study was initially introduced in [
14], where it was proposed as a theoretical framework for estimating UAV operational risks under uncertain conditions. However, the reliability of this model under real-world operational conditions remained untested. Risk predictions, estimated battery runtime, and environmental effects calculated by the model are compared with flight data obtained from controlled UAV missions. The outcomes assess the model’s accuracy and identify deviations between theoretical predictions and empirical observations. This validation enhances UAV safety and fills a scientific gap by providing one of the few available studies that address model verification using measurement-based input [
15,
16]. As a result, this work serves as an important step toward building reliable, data-driven UAV planning and control frameworks.
2. Materials and Methods
This section presents a fuzzy-based risk assessment method that helps evaluate the safety of unmanned aerial vehicles (UAVs). The model consists of four basic modules, each of which calculates partial risks (Y
01–Y
05) based on specific parameters. The approach takes into account energy consumption, mission parameters, environmental impacts, and battery status, and integrates these into a single, comprehensive risk value (Y) as shown in
Figure 1.
Energy demand parameters: X1—Current [A]: The amount of electrical current required for the UAV to operate. This has a direct impact on the battery load; higher current consumption means greater risk. X2—Voltage [V]: The instantaneous voltage of the battery cell. The power value (W) obtained as the product of voltage and current directly determines the intensity of energy consumption and is used to calculate the risk of flight energy consumption; Y01—C-rate risk [0–1]: This risk is due to the actual load intensity of the battery. A high C-rate increases cell degradation, heat generation, and the probability of failure. A high value indicates a critical load, while a low value indicates a more optimal load. Y02—Consumption risk [0–1]: The risk value resulting from the instantaneous (average) energy consumption. The probability of flight energy reserves being depleted can be predicted based on the level of energy consumption. In this case, too, a higher value means higher energy consumption, which represents a high risk.
Mission parameters: X3—Time [s]: The total flight time or time for a specific section. This parameter is directly related to energy consumption, as longer flight times increase the risk of battery discharge; X4—Speed [km/h]: The current or average flight speed of the drone. Speed is a key factor because it affects energy consumption and stability; X5—Home distance [m]: The current distance from the takeoff or landing point. Energy reserves must always be evaluated, taking into account the requirements for returning home. The greater the return distance, the higher the flight risk; Y03—Flying distance risk [0–1]: The risk is due to the remaining flight distance, taking into account the current energy status and the energy requirements for the flight.
Environmental effects parameters: X6—Wind speed [km/h]: The current wind speed in the flight environment. It has a significant impact on the stability and maneuverability of the drone, while also increasing energy consumption. High wind speeds increase flight energy costs and stability risks; X7—Temperature [°C]: Ambient temperature, which indirectly affects battery performance and operating efficiency. Extremely low or high temperatures significantly reduce battery capacity.; X8—Humidity [%]: The moisture content of the air. High humidity can increase the likelihood of electrical faults and short circuits, which increases the risk of malfunction. The ambient temperature ranged between 21 and 24 °C, relative humidity remained between 45 and 55%, and battery health was above 96% throughout the tests, the conditions considered optimal for stable flight.; Y04—Wind resistance [0–1]: Flight risk due to wind speed and environmental conditions, which can cause significant increases in energy consumption and instability. In this study the wind effect was analyzed in more detail.
Battery state parameters: X9—Battery Capacity [Ah]: The maximum capacity of the battery. Reduced capacity (degradation) increases the risk of flight, especially during longer flights; X10—State of Charge, SoC [%]: The current charge level of the battery. A low charge level poses a greater flight risk because it limits the energy available to the drone; X11—State of Health, SoH [%]: The health status of the battery. A low SoH indicates significant degradation, which increases the probability of energy consumption problems and potential failures during flight. New batteries were used during testing; X12—Battery Temperature [°C]: The current operating temperature of the battery. High battery temperatures increase the risk of failure, while low temperatures can significantly reduce the usable capacity. Batteries at ideal temperatures were used during testing; X13—Cell Voltage Deviation, CelDec [V]: The maximum voltage difference between individual cells. A significant deviation is a clear indicator of state imbalance between battery cells and weaker cells in the system. No large deviations were observed during testing; Y05—Battery state risk [0–1]: Flight risk due to battery condition; during these measurements, this was considered ideal, with minimal risk.
The flight experiments were conducted using a commercially available DJI (Shenzhen DJI Technology Co. Ltd., Shenzhen, China) quadcopter UAV, selected for its robust telemetry capabilities, consistent flight behavior, and high-precision onboard sensors. The aircraft was powered by a high-capacity lithium-polymer (LiPo) battery, and its integrated telemetry system enabled real-time data logging with a frequency of 1 Hz [
17]. All essential flight and battery-related parameters were logged automatically by the onboard system. A total of four independent test flights were carried out between 2 April 2025 and 9 April 2025. These flights were performed under controlled outdoor conditions and designed to represent realistic UAV operational profiles. Each flight included various flight phases, such as takeoff, hovering, horizontal motion, and altitude changes. The telemetry data were exported from the DJI platform and processed into structured Excel tables. All telemetry data were preprocessed through cleaning, noise filtering, and normalization to remove sensor outliers and prepare for comparison. Each flight dataset was segmented into logical phases to allow for phase-specific analysis. The key variables—including battery voltage, current draw, SOC, SOH, and temperature trends—were extracted for comparative evaluation [
18,
19].
This approach enables the quantitative assessment of how accurately the theoretical model reflects real-world UAV operations and identified specific conditions where prediction errors occurred. The use of multiple flights enhanced the robustness of the validation by introducing variability across time, flight profiles, and environmental conditions. Although only one DJI UAV model was used, the findings are expected to generalize to other quadcopter-class platforms with similar powertrain and battery configurations.
The proposed risk estimation model integrates multiple input parameters, including environmental conditions, battery metrics, and dynamic flight variables, to generate a continuous risk index. While the model is capable of accounting for complex interactions between temperature, humidity, battery aging, and wind effects, this study focuses solely on external atmospheric factors, specifically wind conditions. During the analyzed missions, ambient temperature and humidity remained within optimal operational ranges throughout the flight durations. Based on the recorded values, their impact on overall flight risk was considered negligible; therefore, they were assigned a zero contribution in the risk computation. This assumption enabled a narrowed investigation into the effect of wind stress on energy consumption and risk formation. The telemetry data, recorded during controlled test flights, exhibited a consistent structure across all missions, with clear segmentation of flight phases, including takeoff, ascent, cruise, and descent. This segmentation supported flight-level aggregation and comparability.
The influence of wind, especially headwind versus tailwind, on the aircraft’s energy demand was evaluated through telemetry-derived current draw patterns. The relative wind orientation was classified using the logical flag (true, false), which enabled the separation of headwind and tailwind flight segments. To support this analysis, energy consumption trends were visualized using scatter plots and linear regression lines, where current draw (in amperes) was plotted as a function of wind speed (in kilometers per hour). These plots were generated separately for headwind and tailwind segments across four distinct flight missions, using structured and preprocessed telemetry data. Each trendline was used to estimate the relationship between opposing wind forces and electrical load.
To assess the relationship between headwind intensity and UAV current draw, a linear trendline was derived from scatter plot data for each flight mission. The analysis followed a consistent methodology using Microsoft Excel: X-axis: wind speed (in km/h), i.e., wind velocity; Y-axis: measured current draw of the UAV (in amperes), as recorded in the telemetry logs. Trendline model: A linear regression was applied to the data points using the least squares method. This yielded a line of best fit with the general equation:
where
m is the slope of the line, indicating the rate of increase in current per unit increase in headwind speed. The
b is the Y-intercept, representing the baseline current draw when no headwind is present.
In all four missions, the linear model demonstrated a direct correlation between wind velocity and power consumption. This reinforces the importance of considering real-time wind conditions in energy forecasting models, especially in UAV applications.
To quantify the aerodynamic and energetic stress induced by wind during UAV operation, a fuzzy logic-based Wind Resistance Risk Index (WRRI) was introduced. This index integrates three parameters: wind speed (WS), relative wind direction (headwind or tailwind), and electric current draw (I), which is a proxy for energy demand. The approach aims to model the increased load on the propulsion system under adverse environmental conditions. The Fuzzy Wind Resistance Risk Index is defined in two stages: Base wind risk, based on wind speed, and Final WRRI, based on energy demand and flight direction.
2.1. Base Wind Risk Based on Wind Speed
The wind-induced aerodynamic stress is expressed by normalizing the wind speed into a fuzzy scale [0, 1]:
where
WSmeasured is the measured wind speed at the time of flight,
WSmin is the minimum wind speed considered for risk modeling, and
WSmax is the maximum wind speed considered. The values of
WSmin and
WSmax are not arbitrarily chosen but derived from established fuzzy logic thresholds used in aeronautical systems. Based on a prior research [
18,
19], wind speeds can be grouped into fuzzy sets such as: Low Risk: 0–5 m/s (≅0–18 km/h); Moderate Risk: 3–13 m/s (≅10–47 km/h); High Risk: 10–30 m/s (≅36–120).
This overlapping classification allows a smooth transition between categories, which is essential for gradual risk assessment under changing environmental conditions. Accordingly, the present model uses
WSmin = 10 km/h and
WSmax = 40 km/h, which is consistent with fuzzy logic applications in aircraft and UAV control systems [
20,
21].
2.2. Final WRRI Based on Energy Demand and Flight Direction
To reflect the actual impact on the drone’s energy system, the base risk is modulated by the relative current draw and flight direction:
Then the adjusted fuzzy Wind Risk Index is computed as:
The tailwind factor of 0.5 was selected based on prior UAV energy studies [
22,
23], reflecting the reduced aerodynamic resistance and propulsion effort under supporting wind. While this specific value is not standardized in the literature, studies have demonstrated that tailwinds can decrease energy consumption by aiding forward motion and reducing required thrust [
22,
23]. This assumption provides a practical means to incorporate the beneficial effects of tailwinds into the fuzzy risk model, acknowledging the need for further empirical validation to refine this factor.
3. Results
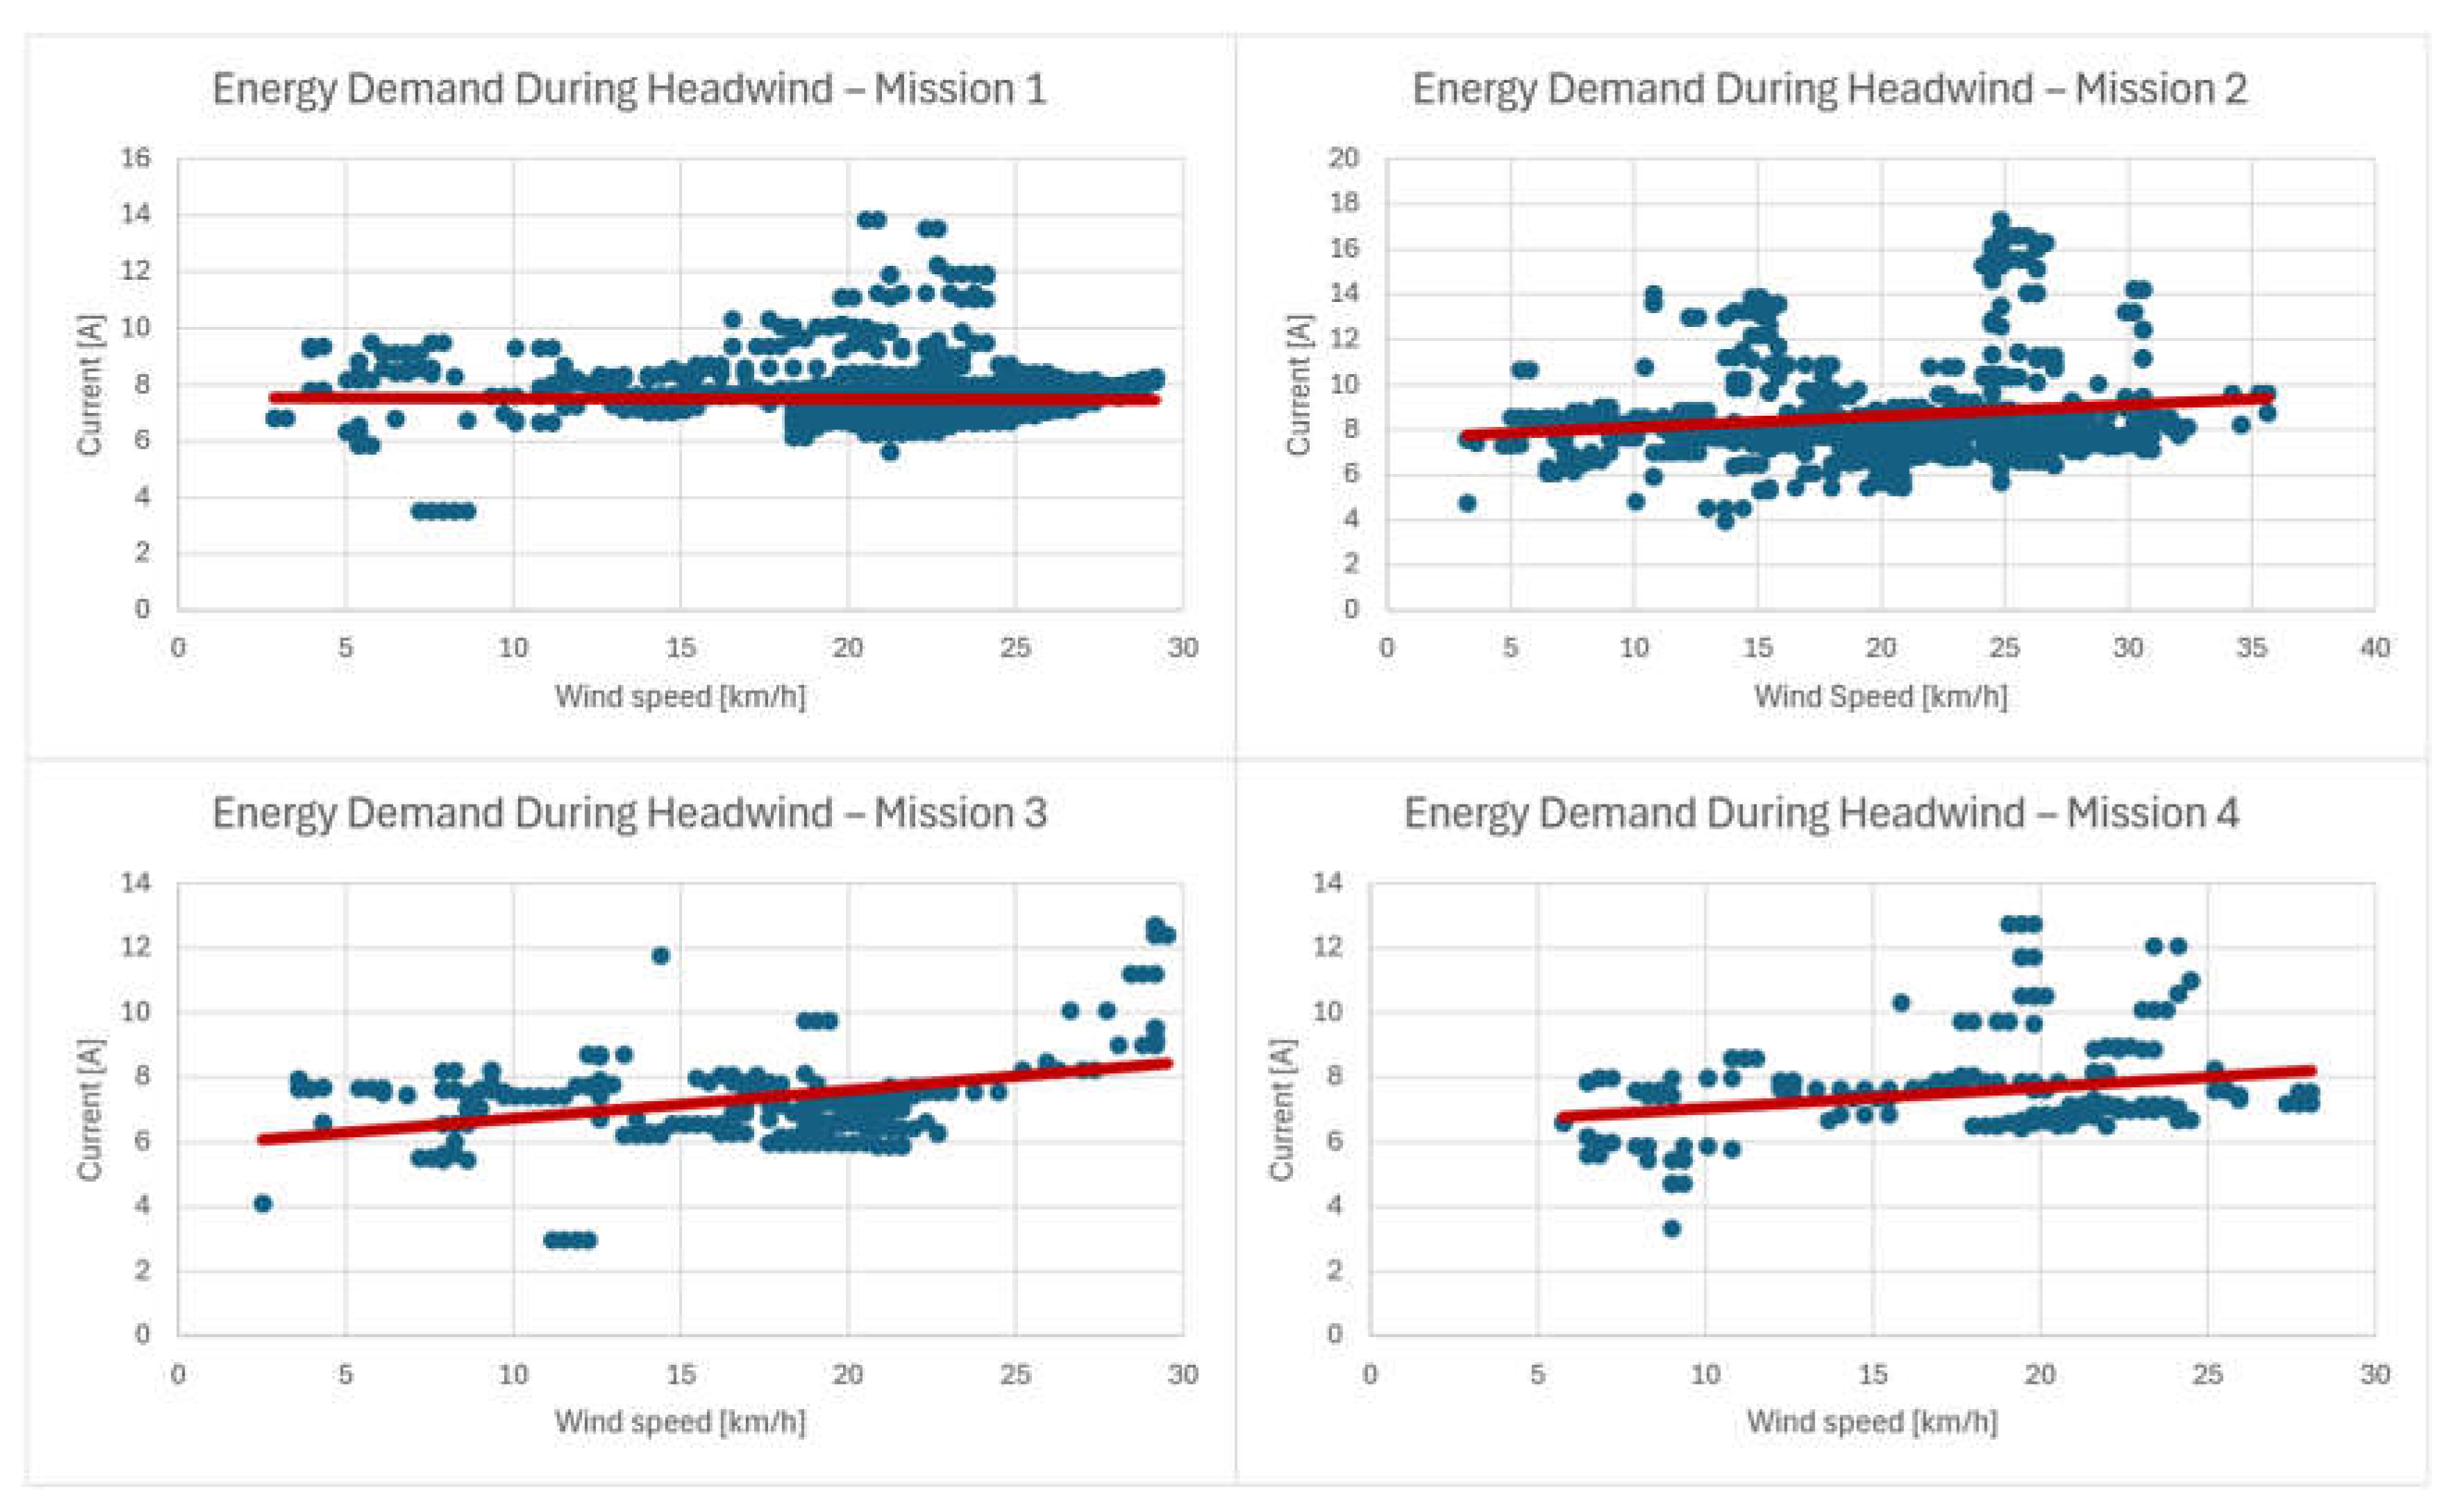
Figure 2 illustrates how headwind affects UAV current consumption across four missions. Mission 1 showed a marked increase above 12 A when wind exceeded 21 km/h. Mission 2 remained mostly stable (6–10 A), while Mission 3 demonstrated consistent performance with minimal variability. In contrast, Mission 4 exhibited erratic current spikes, possibly due to gusts or sudden maneuvers.
Overall, current draw generally increased with headwind speed, but sensitivity varied by mission. Mission 1 was most wind-affected, Mission 3 the least. These variations underscore the need to incorporate wind impact into UAV energy models. The overlapping content in
Figure 2 does not affect the scientific interpretation or clarity of the results.
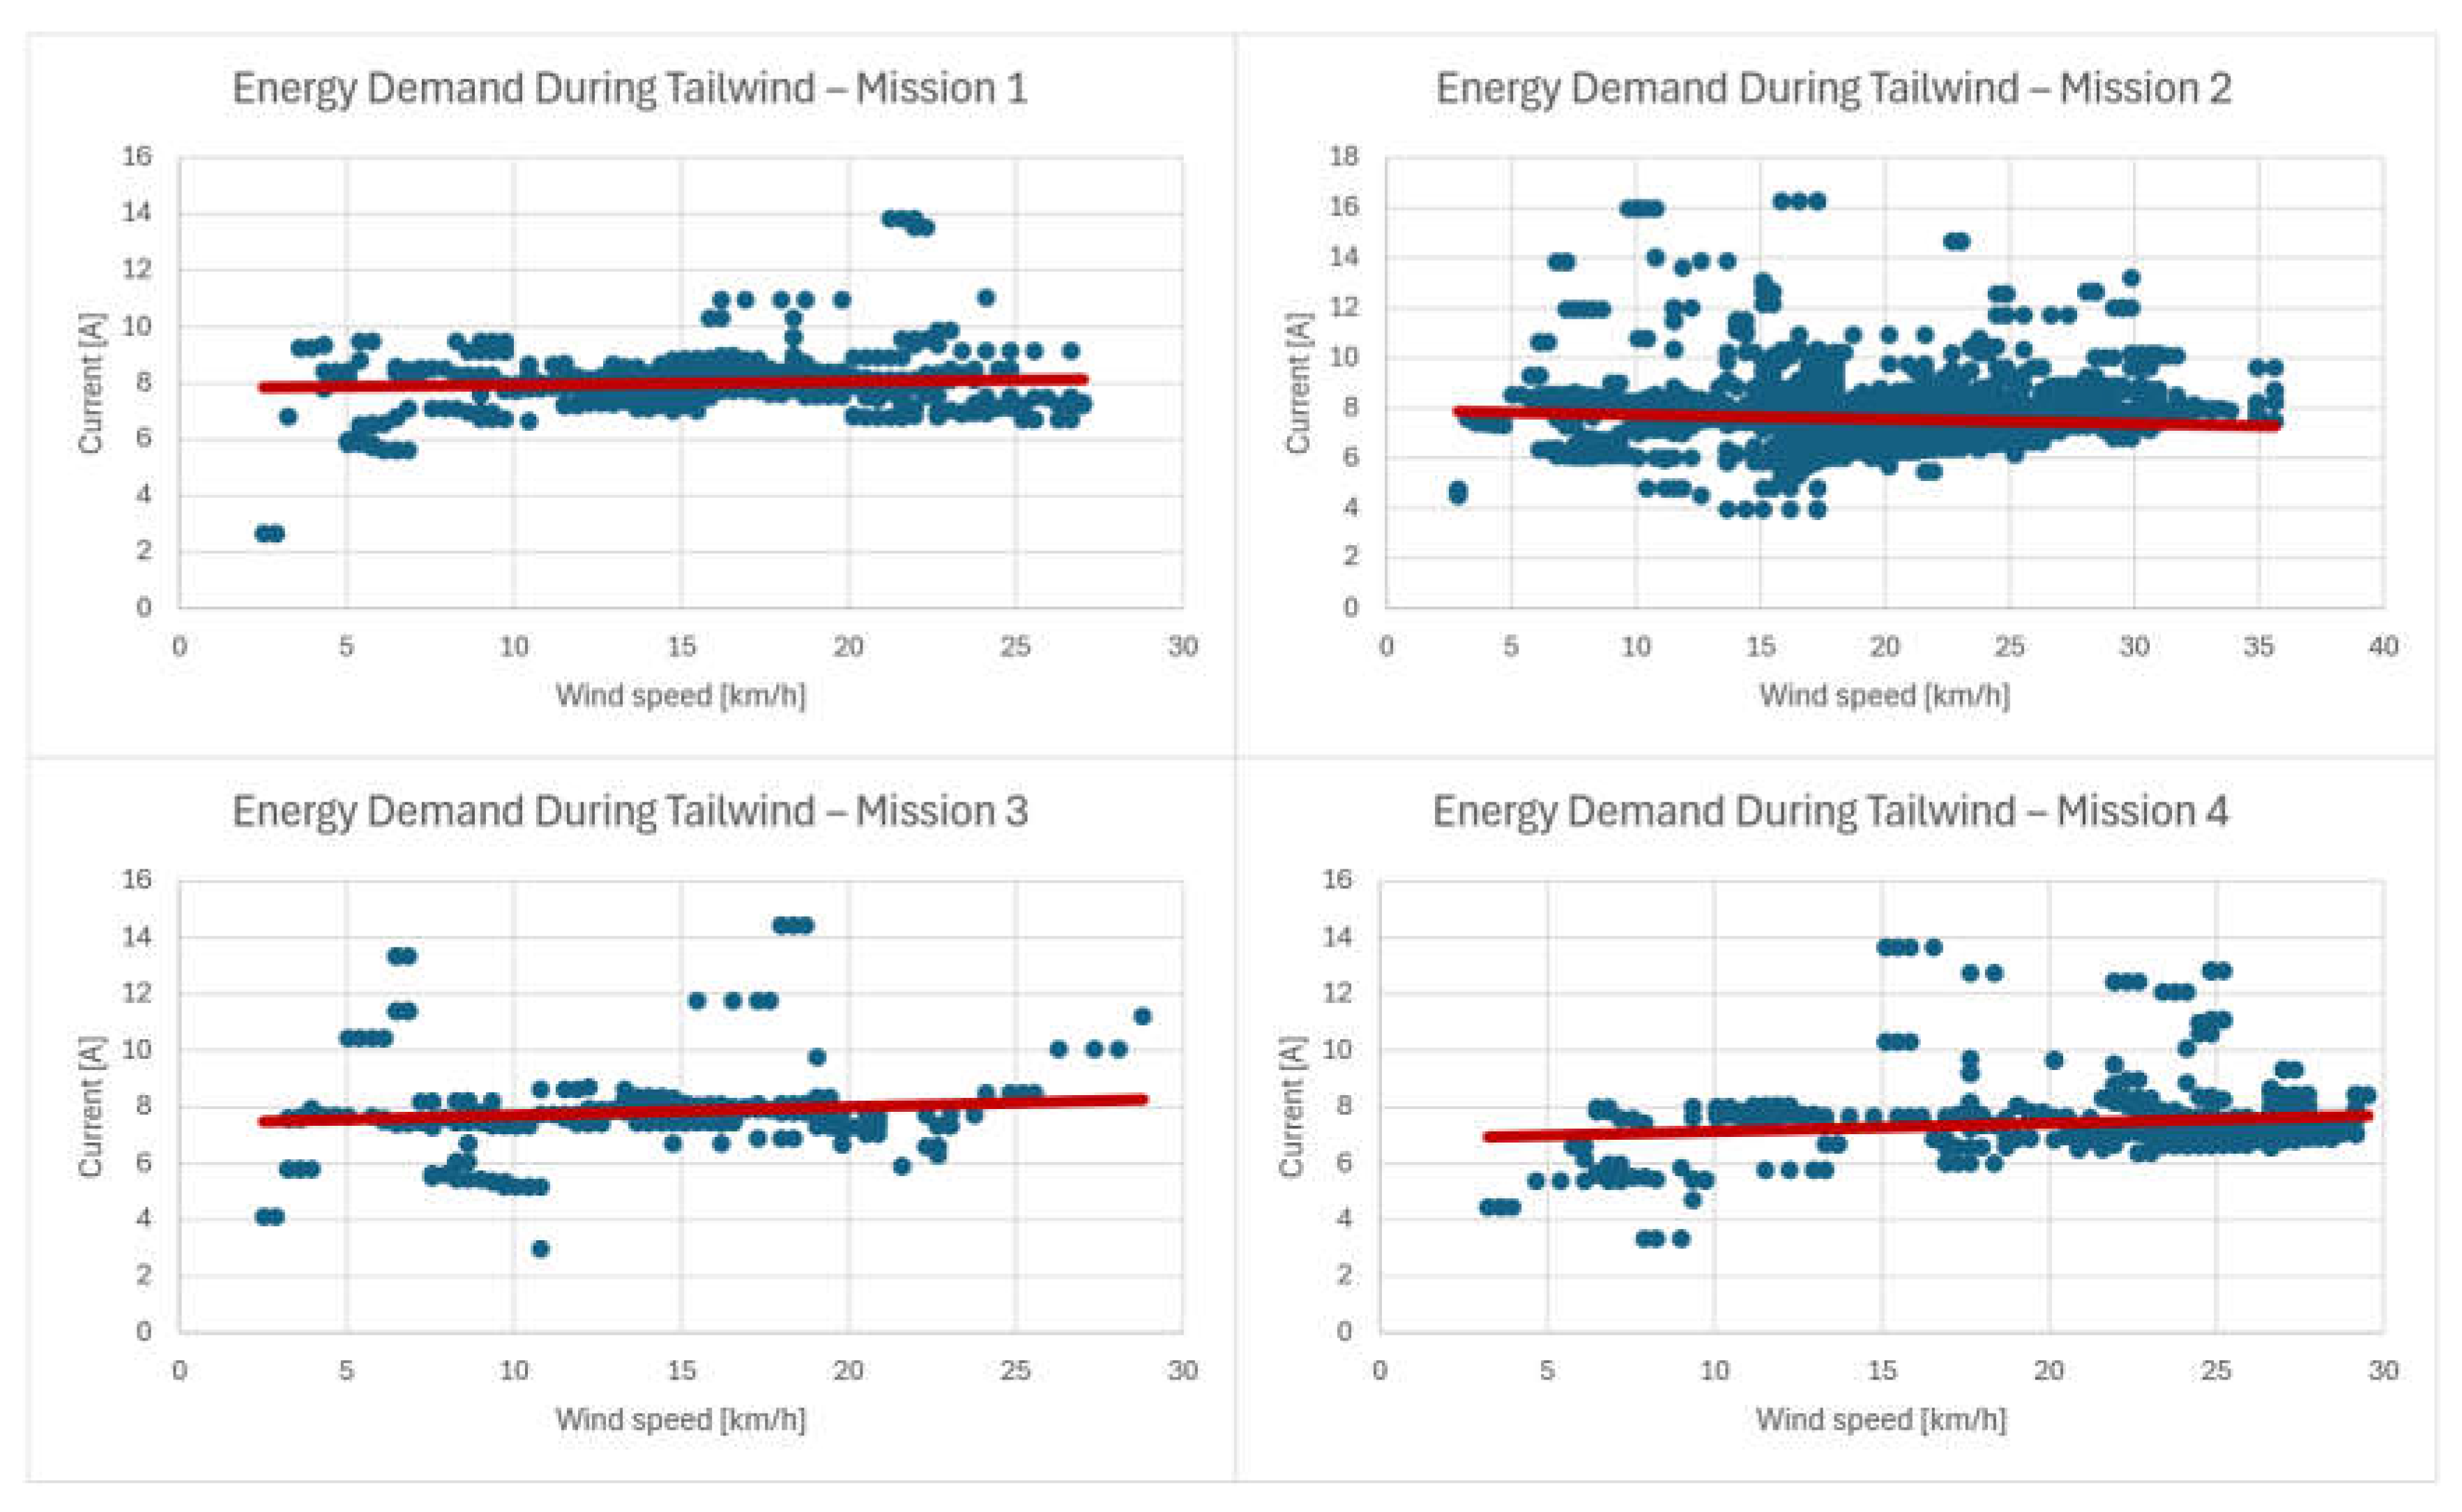
Figure 3 presents tailwind results. Missions 1–3 experienced energy savings, with Mission 3 showing the lowest current draw (<8 A). In Mission 3, the average current draw under headwind conditions was 7.8 A, compared to 5.3 A in tailwind segments, highlighting the model’s sensitivity to directional wind effects. However, Mission 4 showed inconsistent behavior. These irregularities may be attributed to sudden pilot inputs or brief wind gusts not captured in the logged environmental data.
Overall, tailwinds generally reduced energy demand, although their effectiveness varied depending on flight dynamics and maneuvers. The overlapping content in
Figure 2 does not affect the scientific understanding.
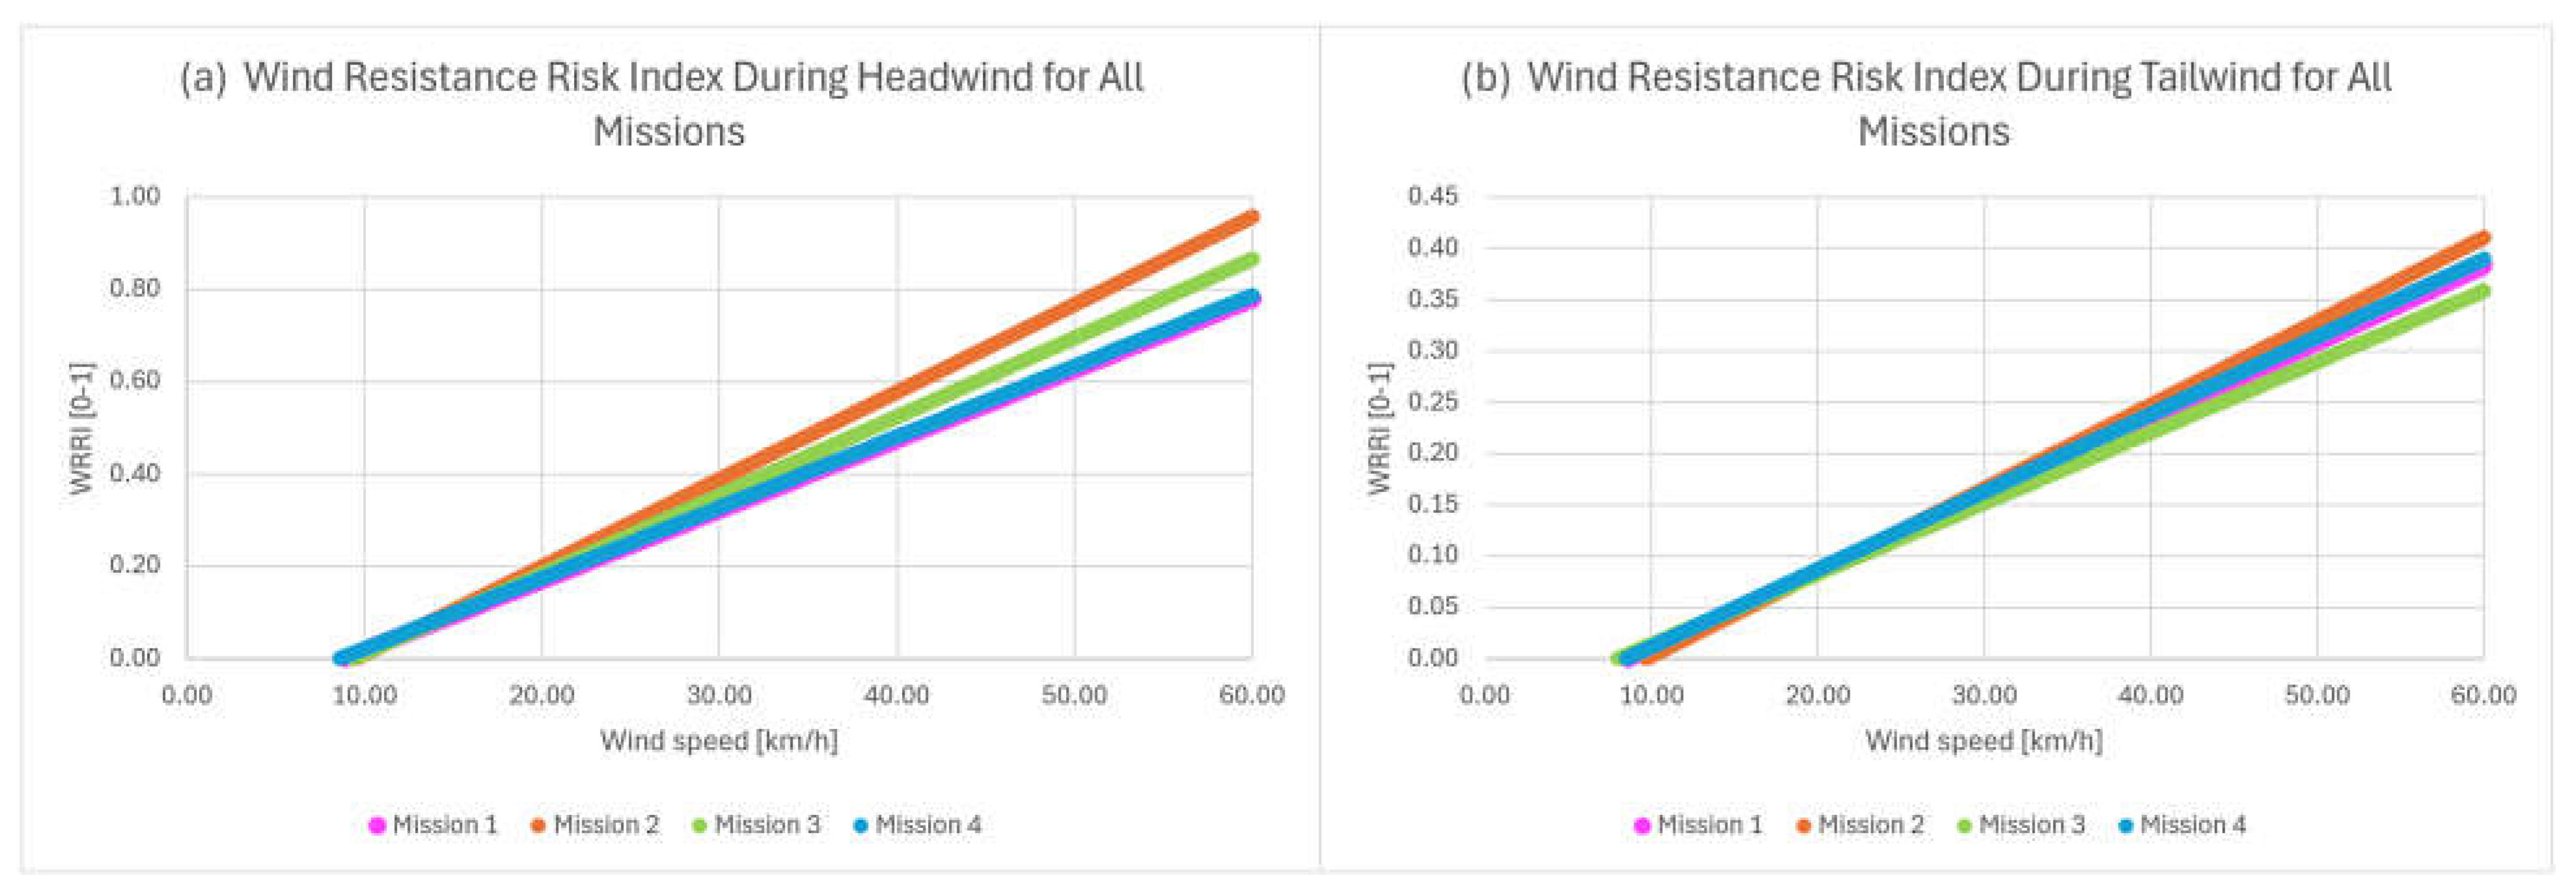
Figure 4 summarizes the Wind Resistance Risk Index across headwind and tailwind conditions. The WRRI analysis confirms that increasing headwind speeds proportionally elevate UAV energy demand across all missions. Mission 1 displayed a moderate linear correlation, whereas Mission 3 showed heightened sensitivity with steeper fluctuations. Mission 2 exhibited the highest overall WRRI due to sustained headwinds, indicating substantial propulsion demands. Mission 4, despite slightly lower wind speeds, maintained a clear upward trend. These observations reinforce the direct impact of headwind on power consumption and demonstrate the effectiveness of the fuzzy logic-based WRRI model for in-flight energy assessment and adaptive flight planning.
Evaluation under tailwind conditions revealed mission-specific variations in the WRRI. Each mission showed stable, low-risk profiles, indicating minimal influence of tailwind intensity on energy consumption. Mission 2 exhibited a slight positive trend, yet significantly lower than headwind scenarios. Mission 3 recorded the lowest WRRI values, highlighting substantial energy savings due to favorable wind conditions. Overall, these results confirm that tailwinds effectively reduce aerodynamic resistance and energy demand, validating the sensitivity and practical utility of the fuzzy-based WRRI framework in real-time mission analysis and planning.


