Proceeding Paper

Optimization of 3D Printing Parameters for Enhanced Mechanical Strength Using Taguchi Method †

Department of Design and Manufacturing Engineering (DME), School of Mechanical and Manufacturing Engineering (SMME), National University of Sciences and Technology (NUST), H-12, Islamabad 44000, Pakistan
*
Author to whom correspondence should be addressed.
Presented at the 5th International Conference on Advances in Mechanical Engineering (ICAME-25), Islamabad, Pakistan, 26 August 2025.
Eng. Proc. 2025, 111(1), 26; https://doi.org/10.3390/engproc2025111026
Published: 28 October 2025

Abstract

Stereolithography (SLA) is a 3D printing process in which liquid resin is cured selectively using ultraviolet light; it is dominantly used for rapid tooling and prototyping. This work aims to identify, investigate, and maximize the influence of process parameters such as layer thickness, build orientation, and exposure time on the mechanical performance of biomedical materials through the Taguchi method using masked stereolithography (MSLA). It was found that layer thickness has an inverse relationship with component strength, and the mechanical characteristics are most affected by the vertical build orientation. The improved parameter resulted in an increase of 9.26 percent in tensile, 5.93 percent in flexural, and 17.89 percent in impact strength compared to the average experimental strength. Additionally, an empirical regression model linking strength and process variables was developed.

1. Introduction

Additive manufacturing (AM), also known as three-dimensional (3D) printing, was established in the 1980s and has the capability of creating parts through sequential layering using a computer-aided design (CAD) model that involves complexity in geometry [1,2]. It has emerged as a rival to traditional manufacturing processes, particularly in the production of dental implants and other applications [3]. VAT photopolymerization is one of the popular 3D printing methods in which liquid resin is selectively cured by ultraviolet (UV) light to form a solid layer [4]. Polymers are the most widely used material in dental applications of additive manufacturing [5]. They come in various forms, including sheets, powder, and resins. Technologies that utilize photopolymerization are essential for curing these resins to create solid components [6] such as impression trays [7,8], dental base, and teeth [9,10,11]. The rationale for polymerization relies on the utilization of initiators, monomers, and oligomers that cure when exposed to specific wavelengths of light [12].
When there is complex part geometry and fierce market competition, stereolithography (SLA), which is based on photopolymerization, is a suitable option compared to other manufacturing technologies for prototypes [13]. It is more appropriate for biomedical applications because of its better surface finish and low stair-stepping effect, sensitivity, and part accuracy [14,15] compared to other AM processes, allowing for the creation of exact designs for fixed partial dentures, crowns, and surgical guides [16].
Many researchers are using this method to manufacture recently developed dental applications. For example, the California-based company Align Technology produces clear plastic aligner molds to correct the positioning of the teeth [17].
Strength plays a significant role in creating rapid tooling, allowing components to endure high pressure during fitting tests. The typical approach to creating a high-strength part is the full factorial method, which is only appropriate when a limited number of variables need to be investigated. In contrast, the fractional factorial approach, a more straightforward, effective, and systematic approach provided by the Taguchi design of experiments (DOE), reduces the number of experimental runs and helps to save time [18]. Consequently, the Taguchi method is a powerful tool for implementing DOE effectively [19,20].
Many researchers have carried out different studies to analyze the influential parameters of different materials, yet very few studies have been conducted on biomedical materials. This research focuses on evaluating the mechanical characteristics of Anycubic dental non-castable resin under varying process parameters, such as layer thickness, build orientation, and exposure time, aiming determine the optimized values and the percentage contribution of each factor to the tensile, flexural, and impact strength. Additionally, developing a process model linking influential factors to response variables is a major focus of this research.

2. Materials and Methods

The test specimens, designed according to ASTM standards, i.e., D638-IV [21], D790 [22], and D256 [23], were created using Autodesk Fusion 360. After the creation of the CAD model, layer thickness, build orientation, and exposure time were configured in the Chitubox program. Anycubic dental non-castable resin was used as the building material. Testing on the specimen was divided into three categories: tensile, flexural, and impact testing. Liquid resin was poured into the vat of the SLA apparatus, and the printer selectively polymerized the resin to 3D print the required CAD model by layer-by-layer deposition.

2.1. Additive Manufacturing of Samples

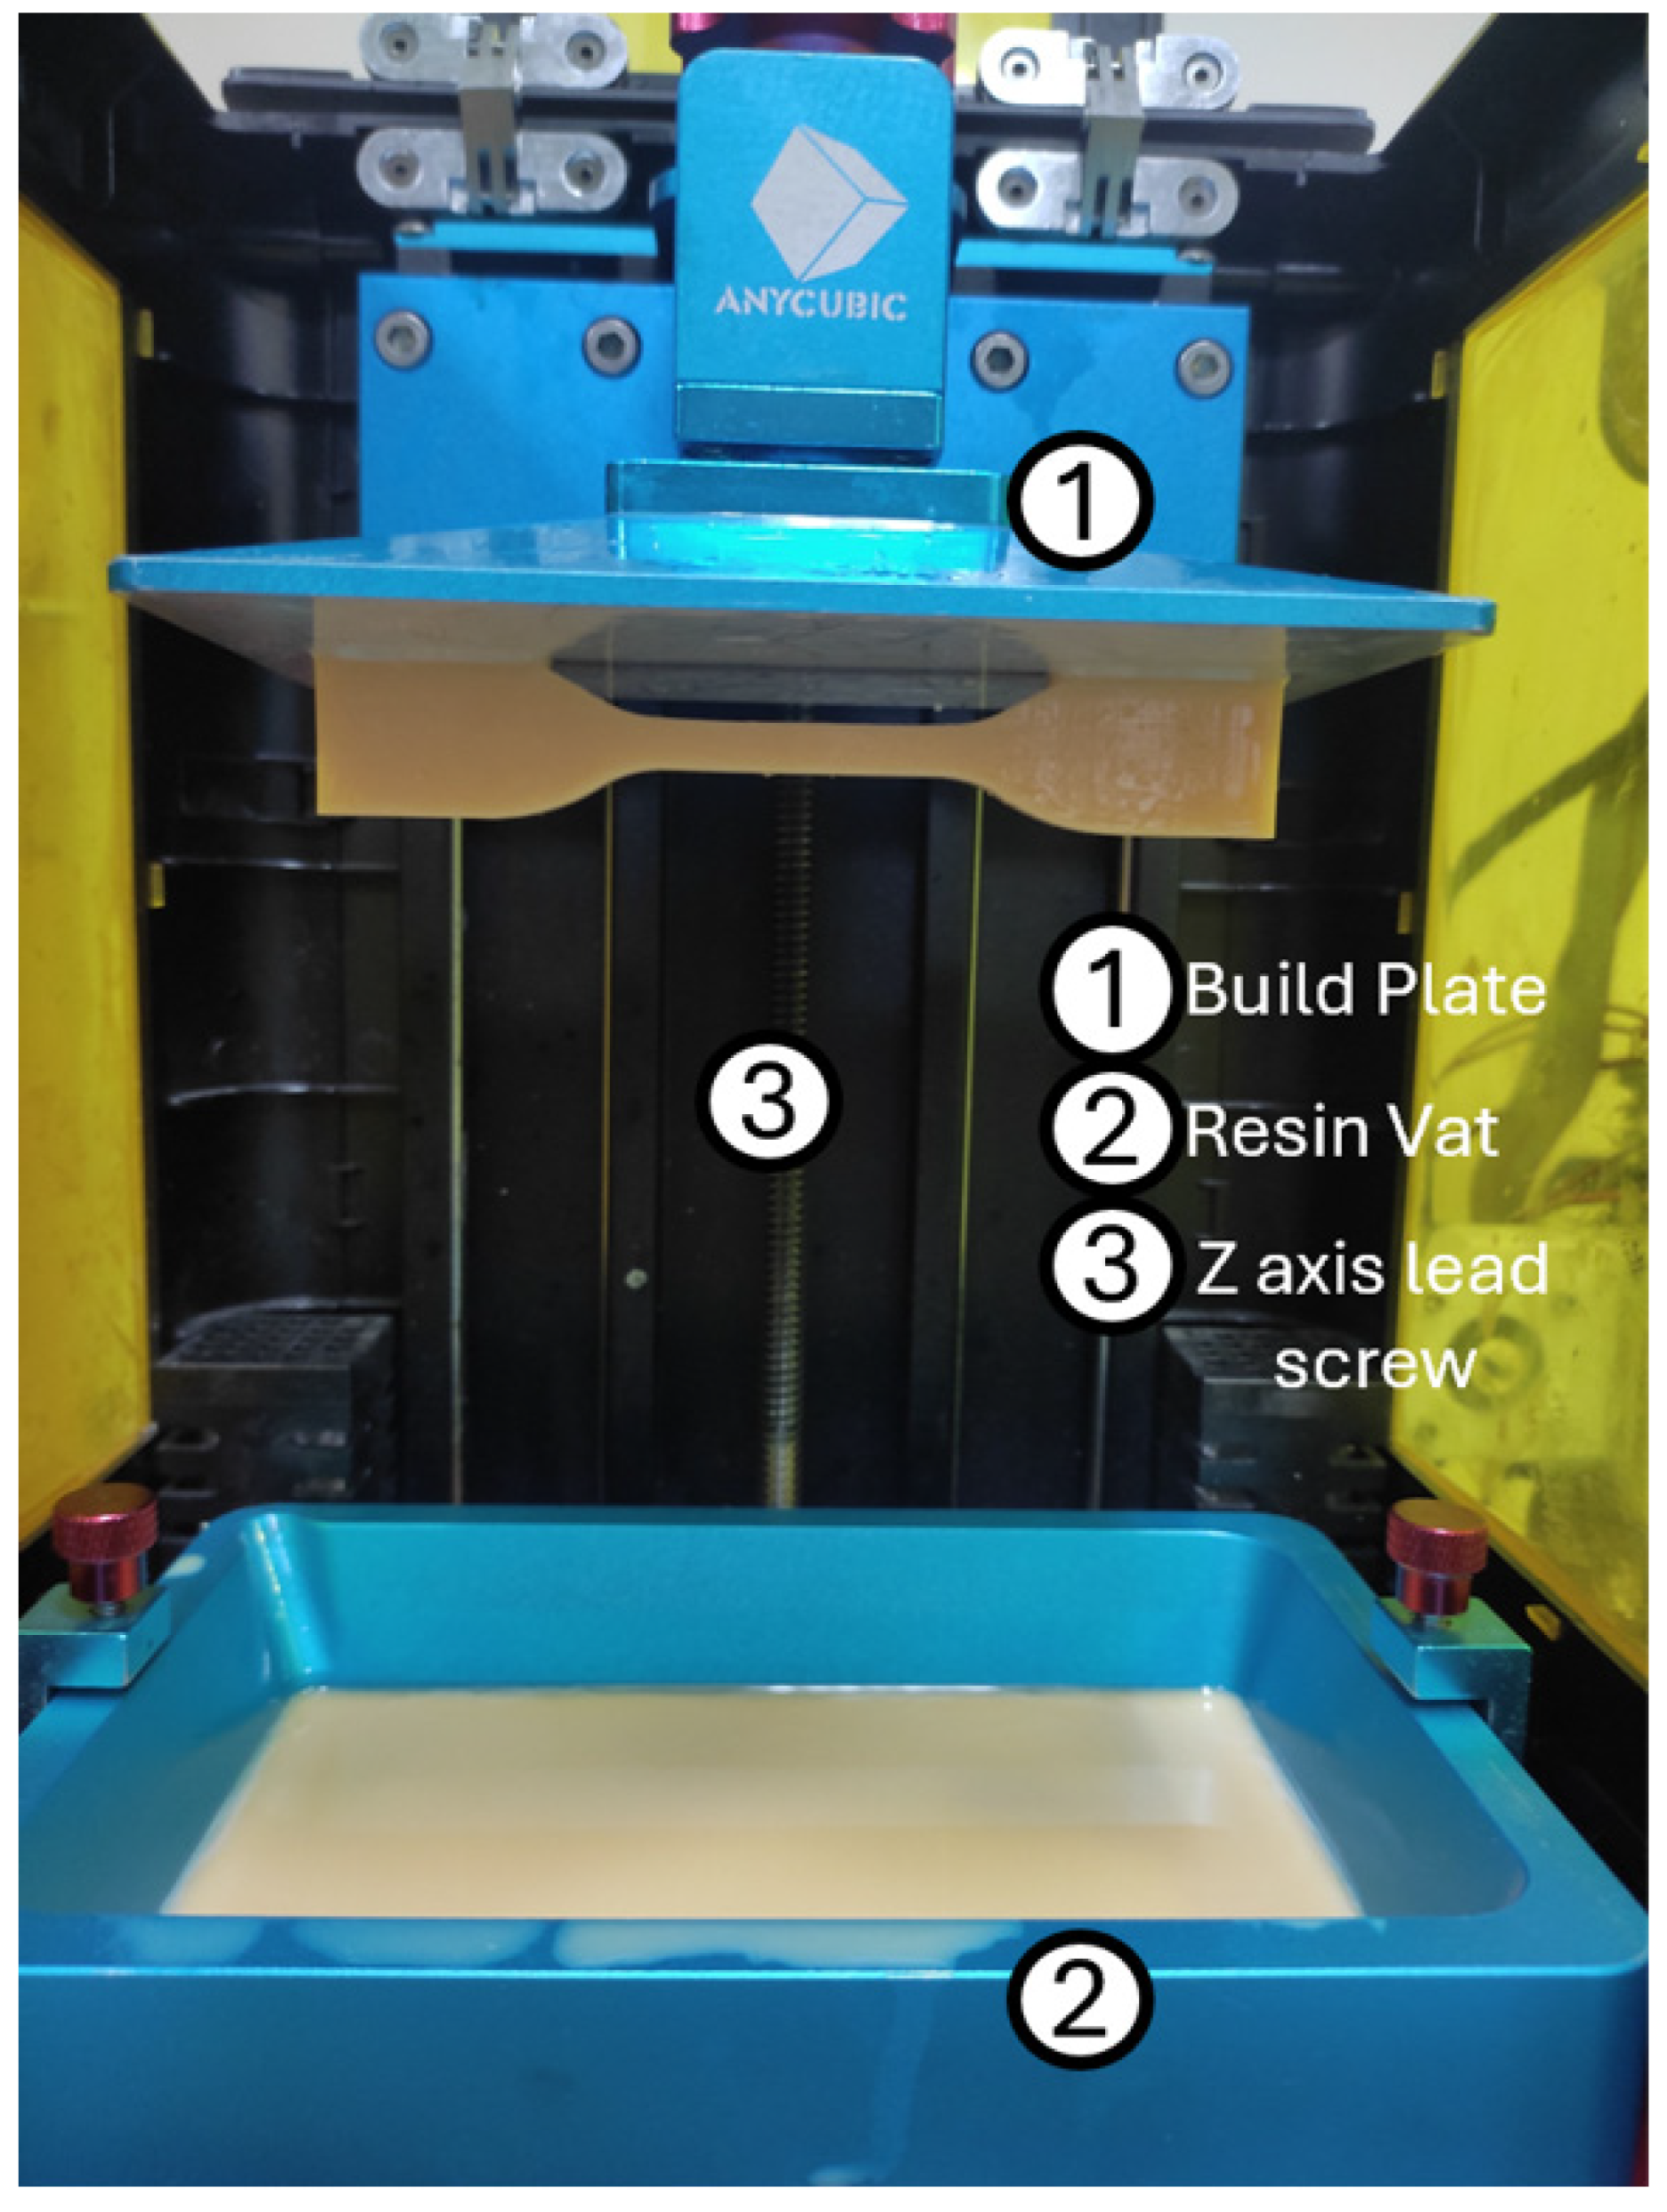
The Anycubic Photon S 3D printer, as shown in Figure 1, was used to print tensile, flexural, and impact specimens. The printer uses 2K UV light LCDs of 405 nm installed under the vat to selectively polymerize the resin. The base plate of the printer moves upward, allowing resin to be deposited in a successive layer to form 3D objects.
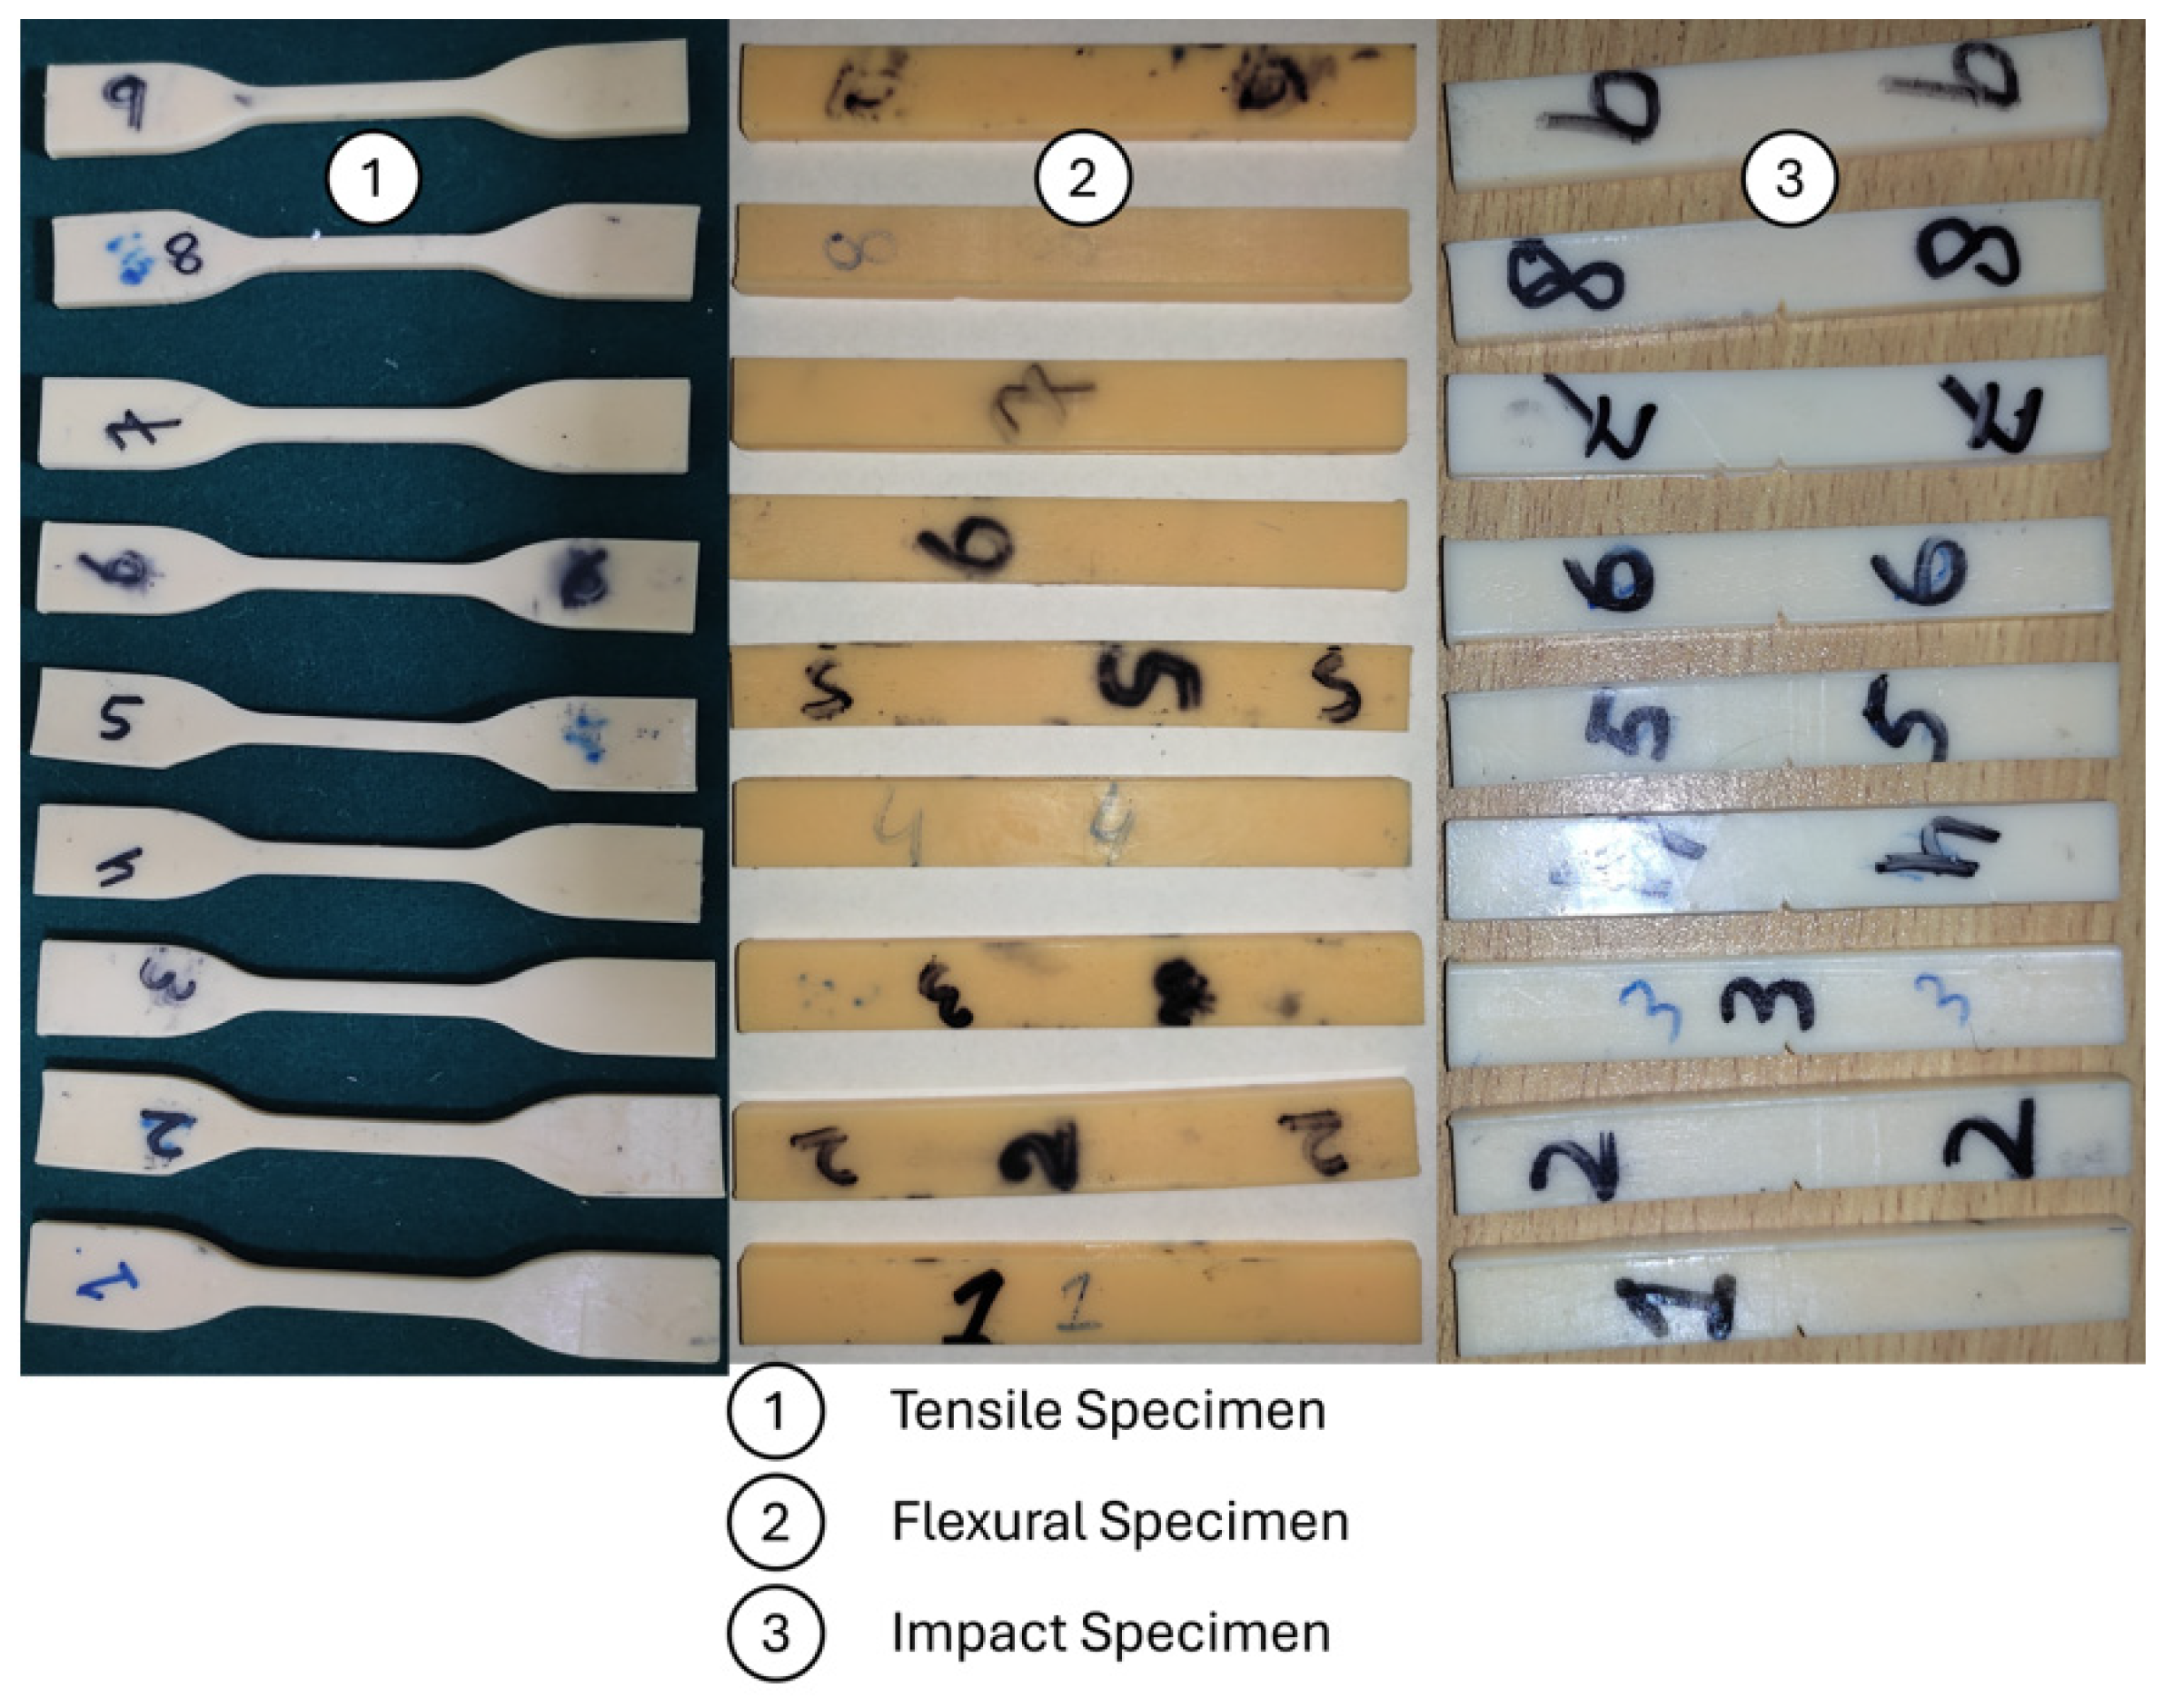
Three specimens for each setting in the L9 orthogonal array were printed at a temperature of 25 Celsius and a relative humidity of 69% for tensile, flexural, and impact studies. All specimens are tested in green conditions. Nine samples, printed with different settings according to the L9 orthogonal array, are shown in Figure 2.

2.2. Design of Experiments

To investigate the influence of parameters on mechanical properties, a DOE approach was devised using the Taguchi method which enables researchers and scientists to effectively study multiple parameters impacting a single output and facilitates the precise presentation of the response output [24].
Based on the literature [23,25], the process parameters and their levels were first identified as part of the research’s methodology. These include layer thickness (0.1, 0.125, 0.15 mm), build orientation comprising flat, side, and vertical configuration (F, S, V), and exposure time (7, 13, 14 s). The degree of freedom (DOF) was calculated from Equation (1), based on the number of process parameters and their corresponding levels. The L9 orthogonal array was chosen because the total DOF was 6, satisfying the requirement for more experiments than DOF, and can accommodate three parameters and three levels, as shown in Table 1.
DOF = ∑ (Li − 1)
where Li is the level of an individual parameter.
SN ratios were computed after experimental findings, and a confirmation test was conducted to validate the results. Minitab software version 21.2 was used to generate the SN curve, analyze variance, and calculate the percentage contribution of each factor to the response variable.
Taguchi proposes several types of characteristics, including “smaller the better,” “larger the better,” and “nominal the better.” Each characteristic is suited for different types of desirable responses, e.g., for defects and surface roughness, the smaller the better is used, while for responses that need to be maximized such as strength, speed, etc., the larger the better is preferred [26]. The larger the better was selected as the response variable for mechanical properties, and a regression model was created to establish the relationships between the process parameters and the response variables (tensile, flexural, and impact strength).

3. Results

For experiments, a Universal Testing Machine (UTM) was used to test the samples for tensile and flexural characteristics, while impact samples were evaluated using an impact tester to investigate the amount of absorbed energy.

3.1. Tensile Analysis

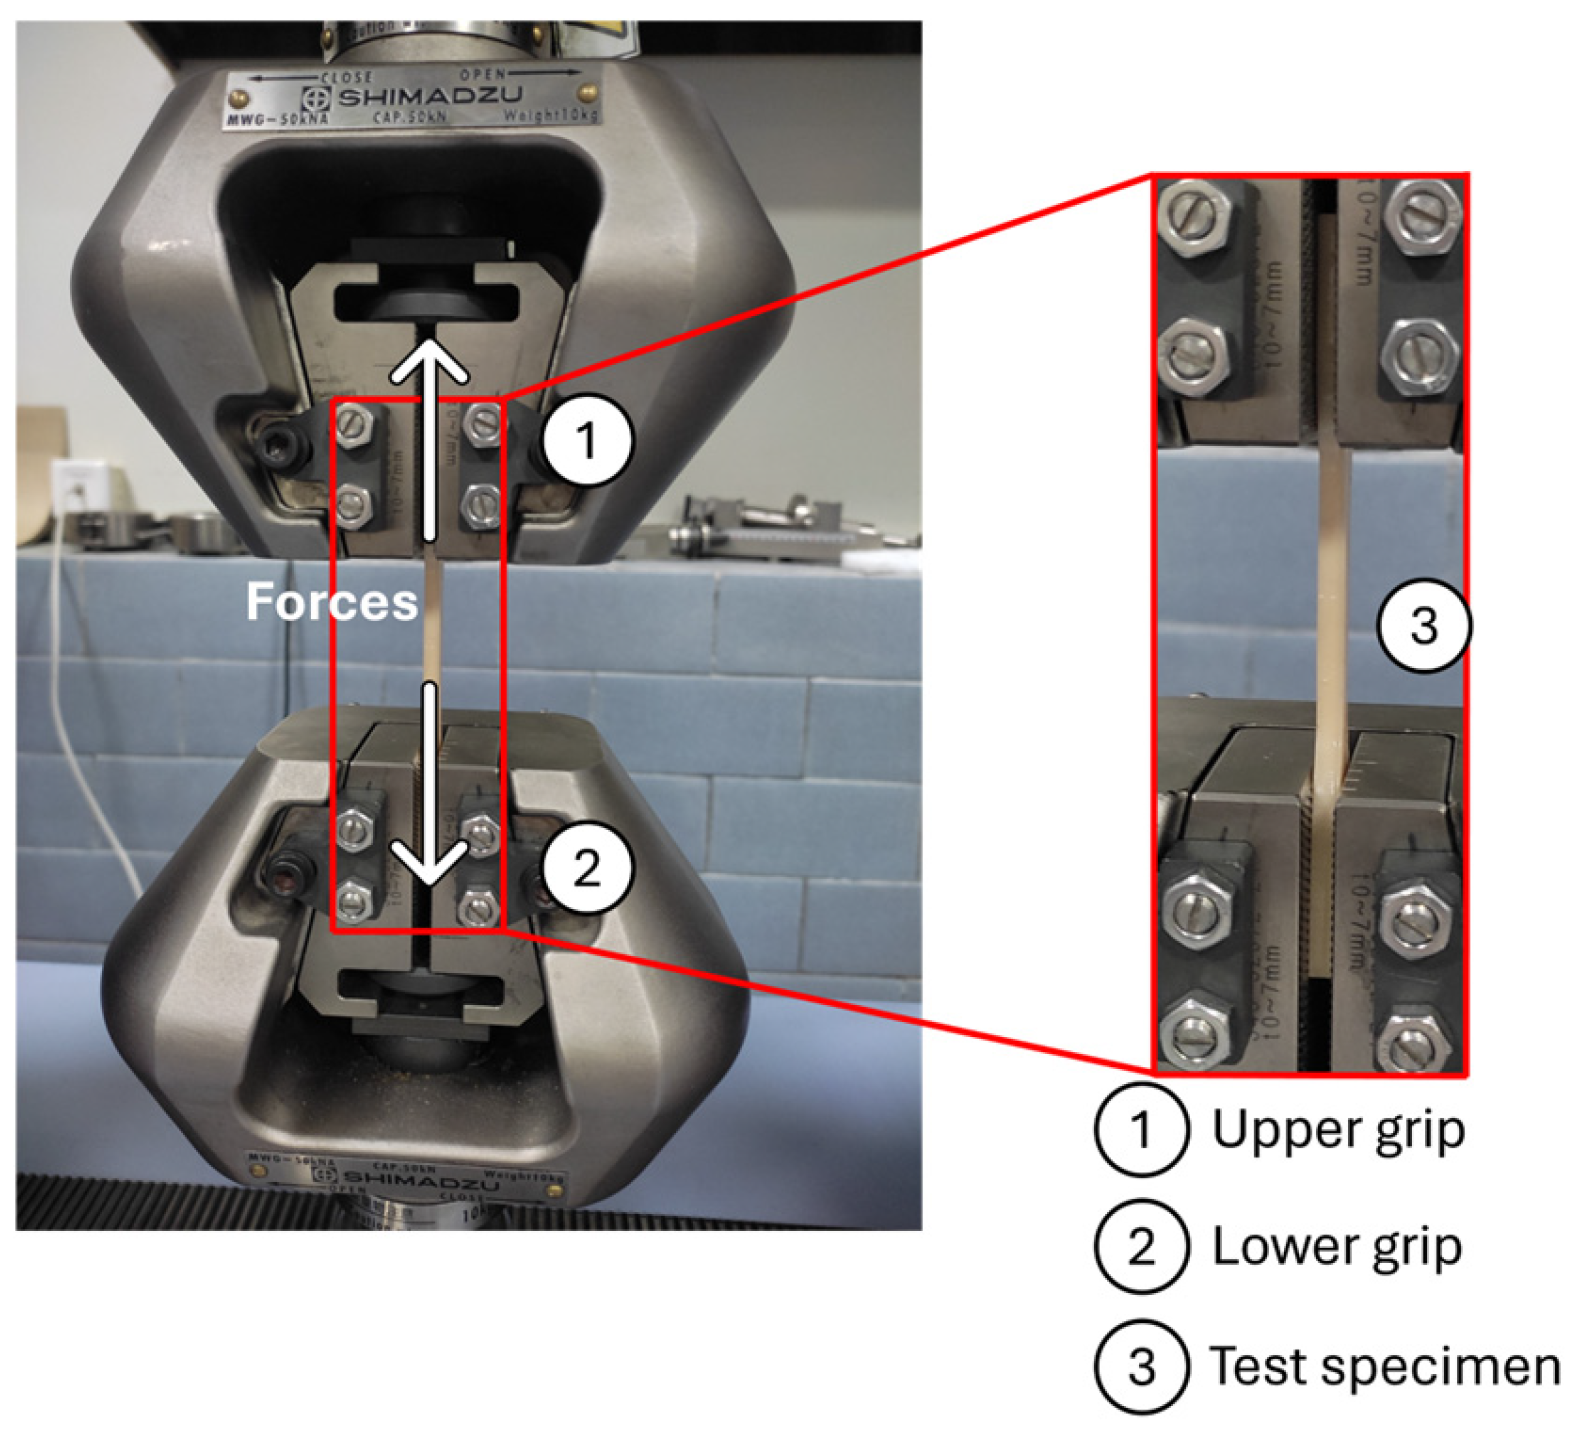
Nine tensile specimens as shown in Figure 2 were printed according to the L9 orthogonal array along with two replicas of each setting, resulting in a total of twenty-seven samples using dental non-castable resin. These were tested using a Shimadzu AGX-PLUS, Japan, Universal Testing Machine as shown in Figure 3.
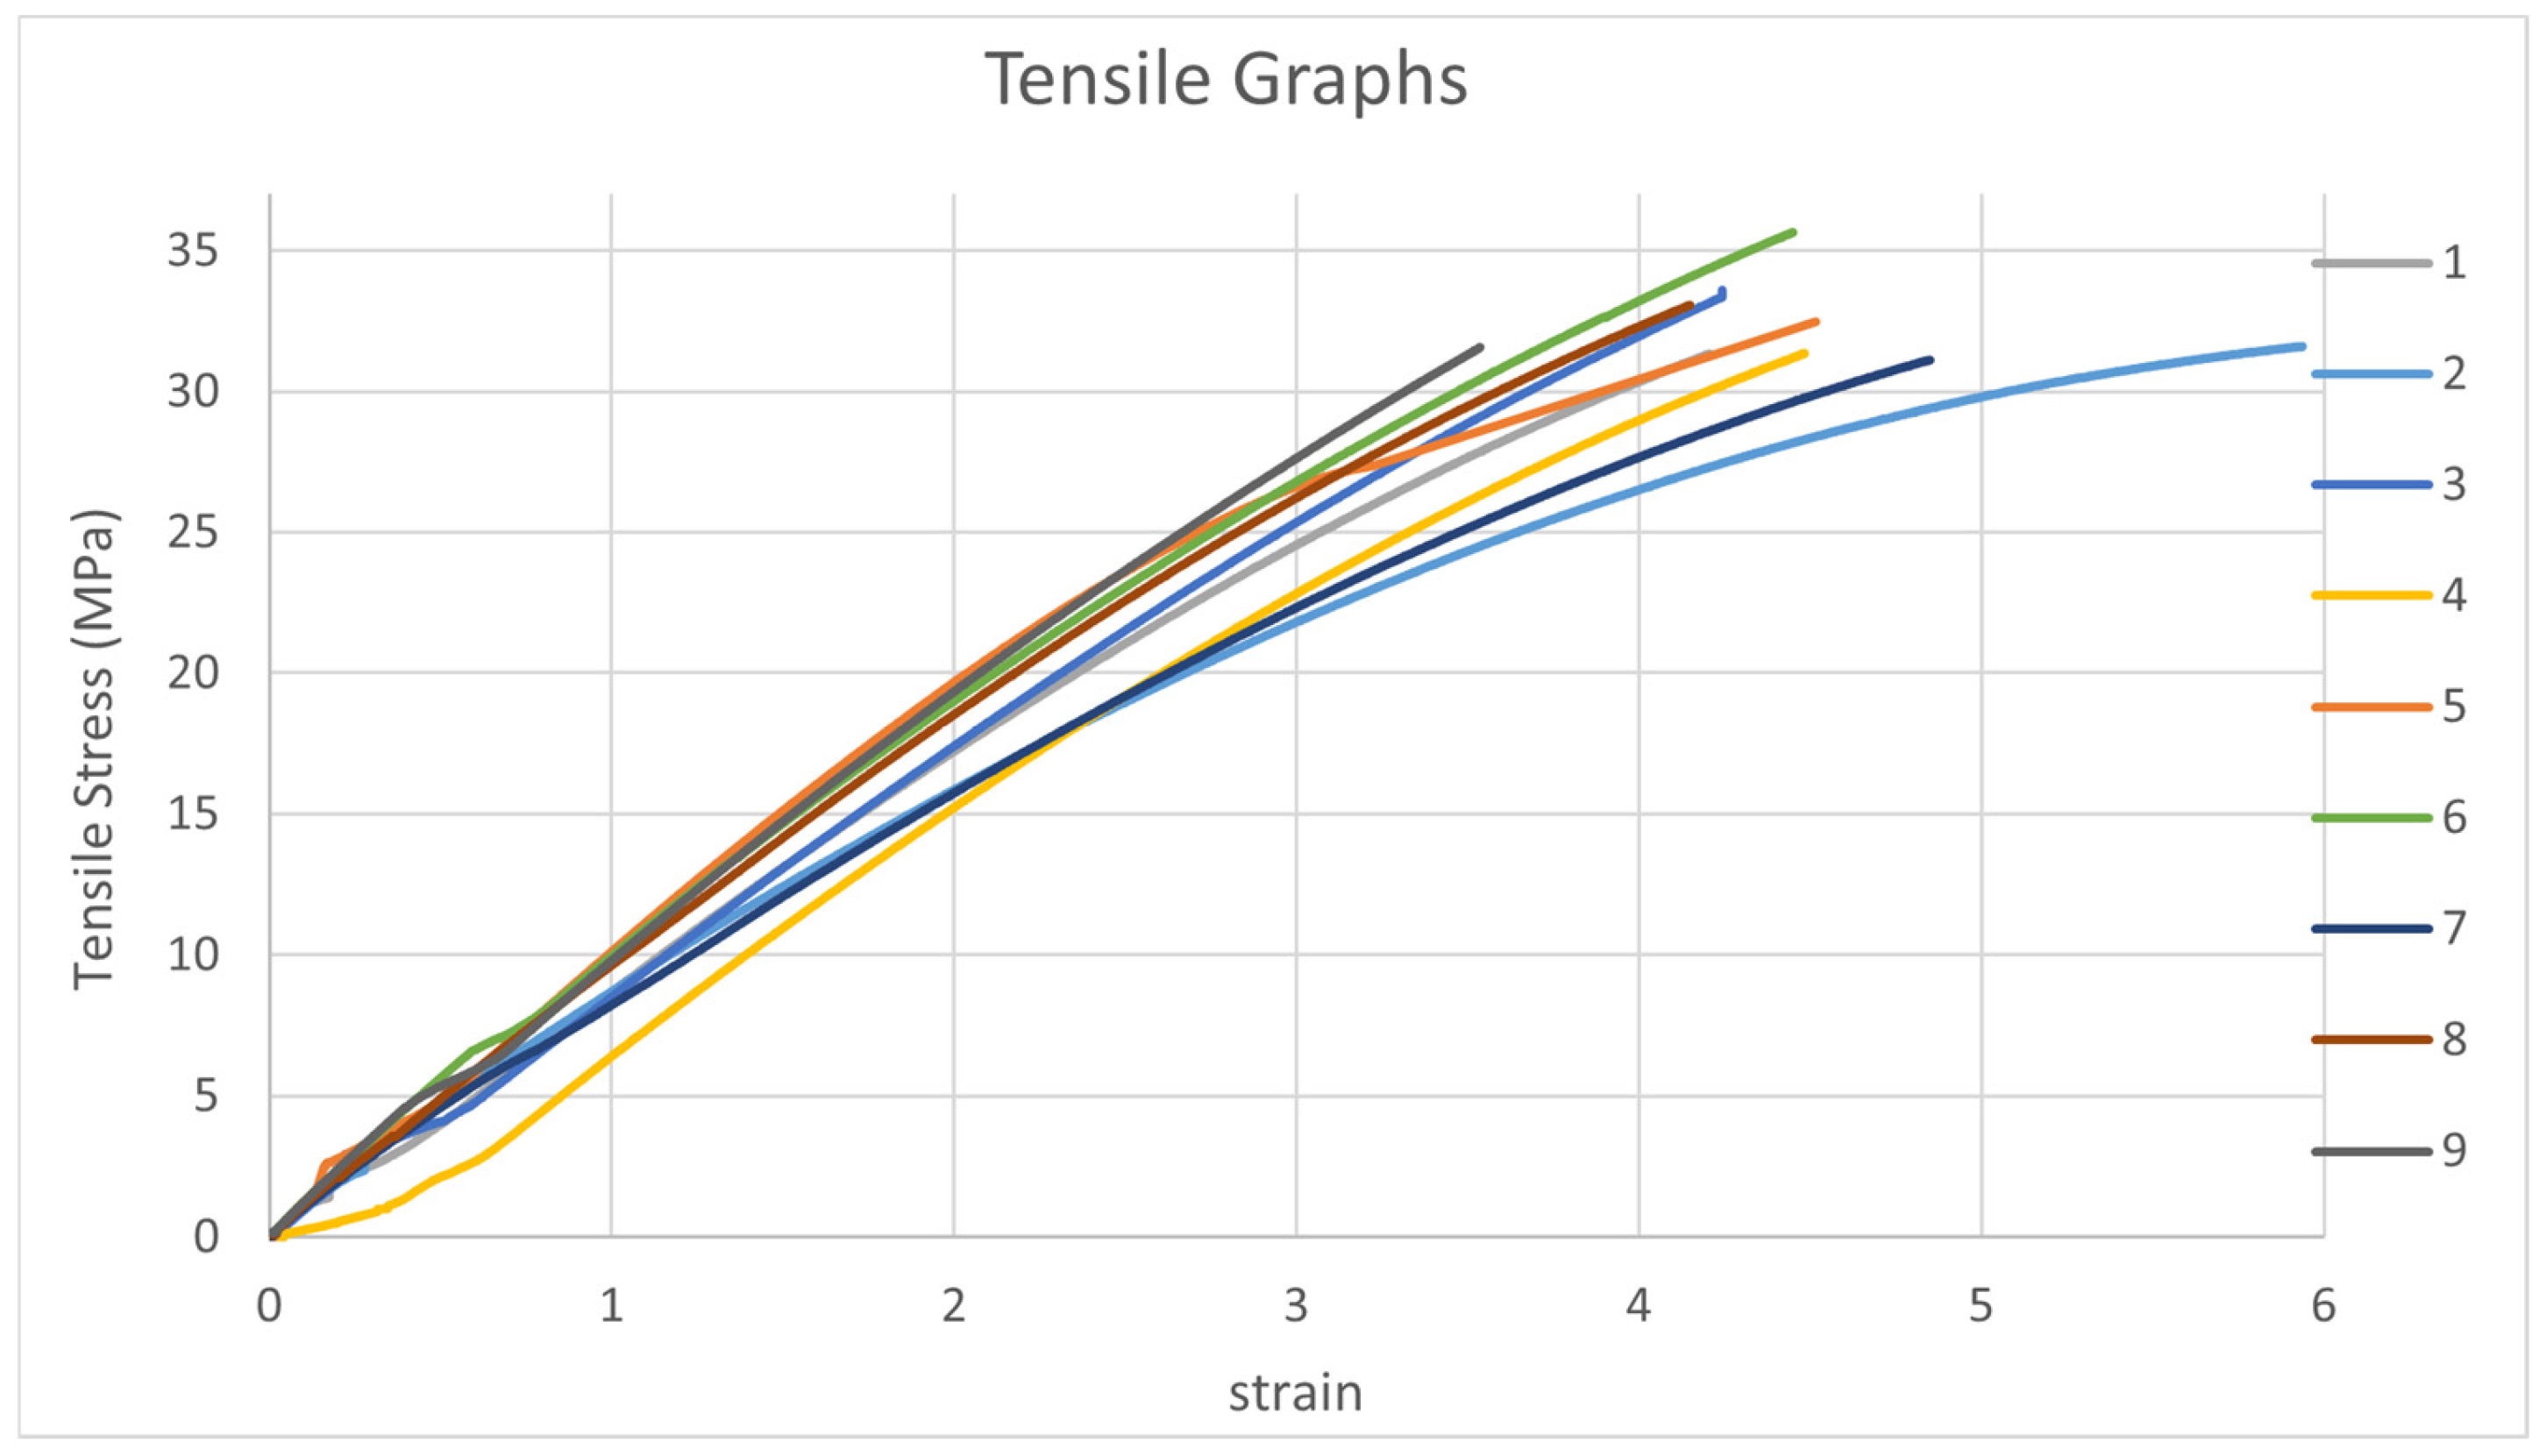
The average values of the test specimens are tabulated in Table 2. Each experimental run includes the average values of the three specimens. The tensile strength values differ as printing values change. The highest value is recorded during the sixth experimental run in the orthogonal array which includes 0.125 mm layer thickness, vertical build orientation, and 7 s exposure time.
The tensile stress–strain curves are illustrated in Figure 4. The legend to the right shows the experimentational run in an L9 orthogonal array. The highest value in the sixth experimental run is since in a vertical build orientation, large numbers of layers are required to print the part. In such orientations, layers are significantly bonded, creating a strong bond as compared to flat or side orientations. This means that the force must break through the bonds between each layer, which are usually the strongest part of the print. Furthermore, the force is evenly distributed between layers in the vertical orientation, reducing the possibility of a single layer experiencing a concentration of stress.

3.1.1. Optimal Process Parameters for Tensile Strength

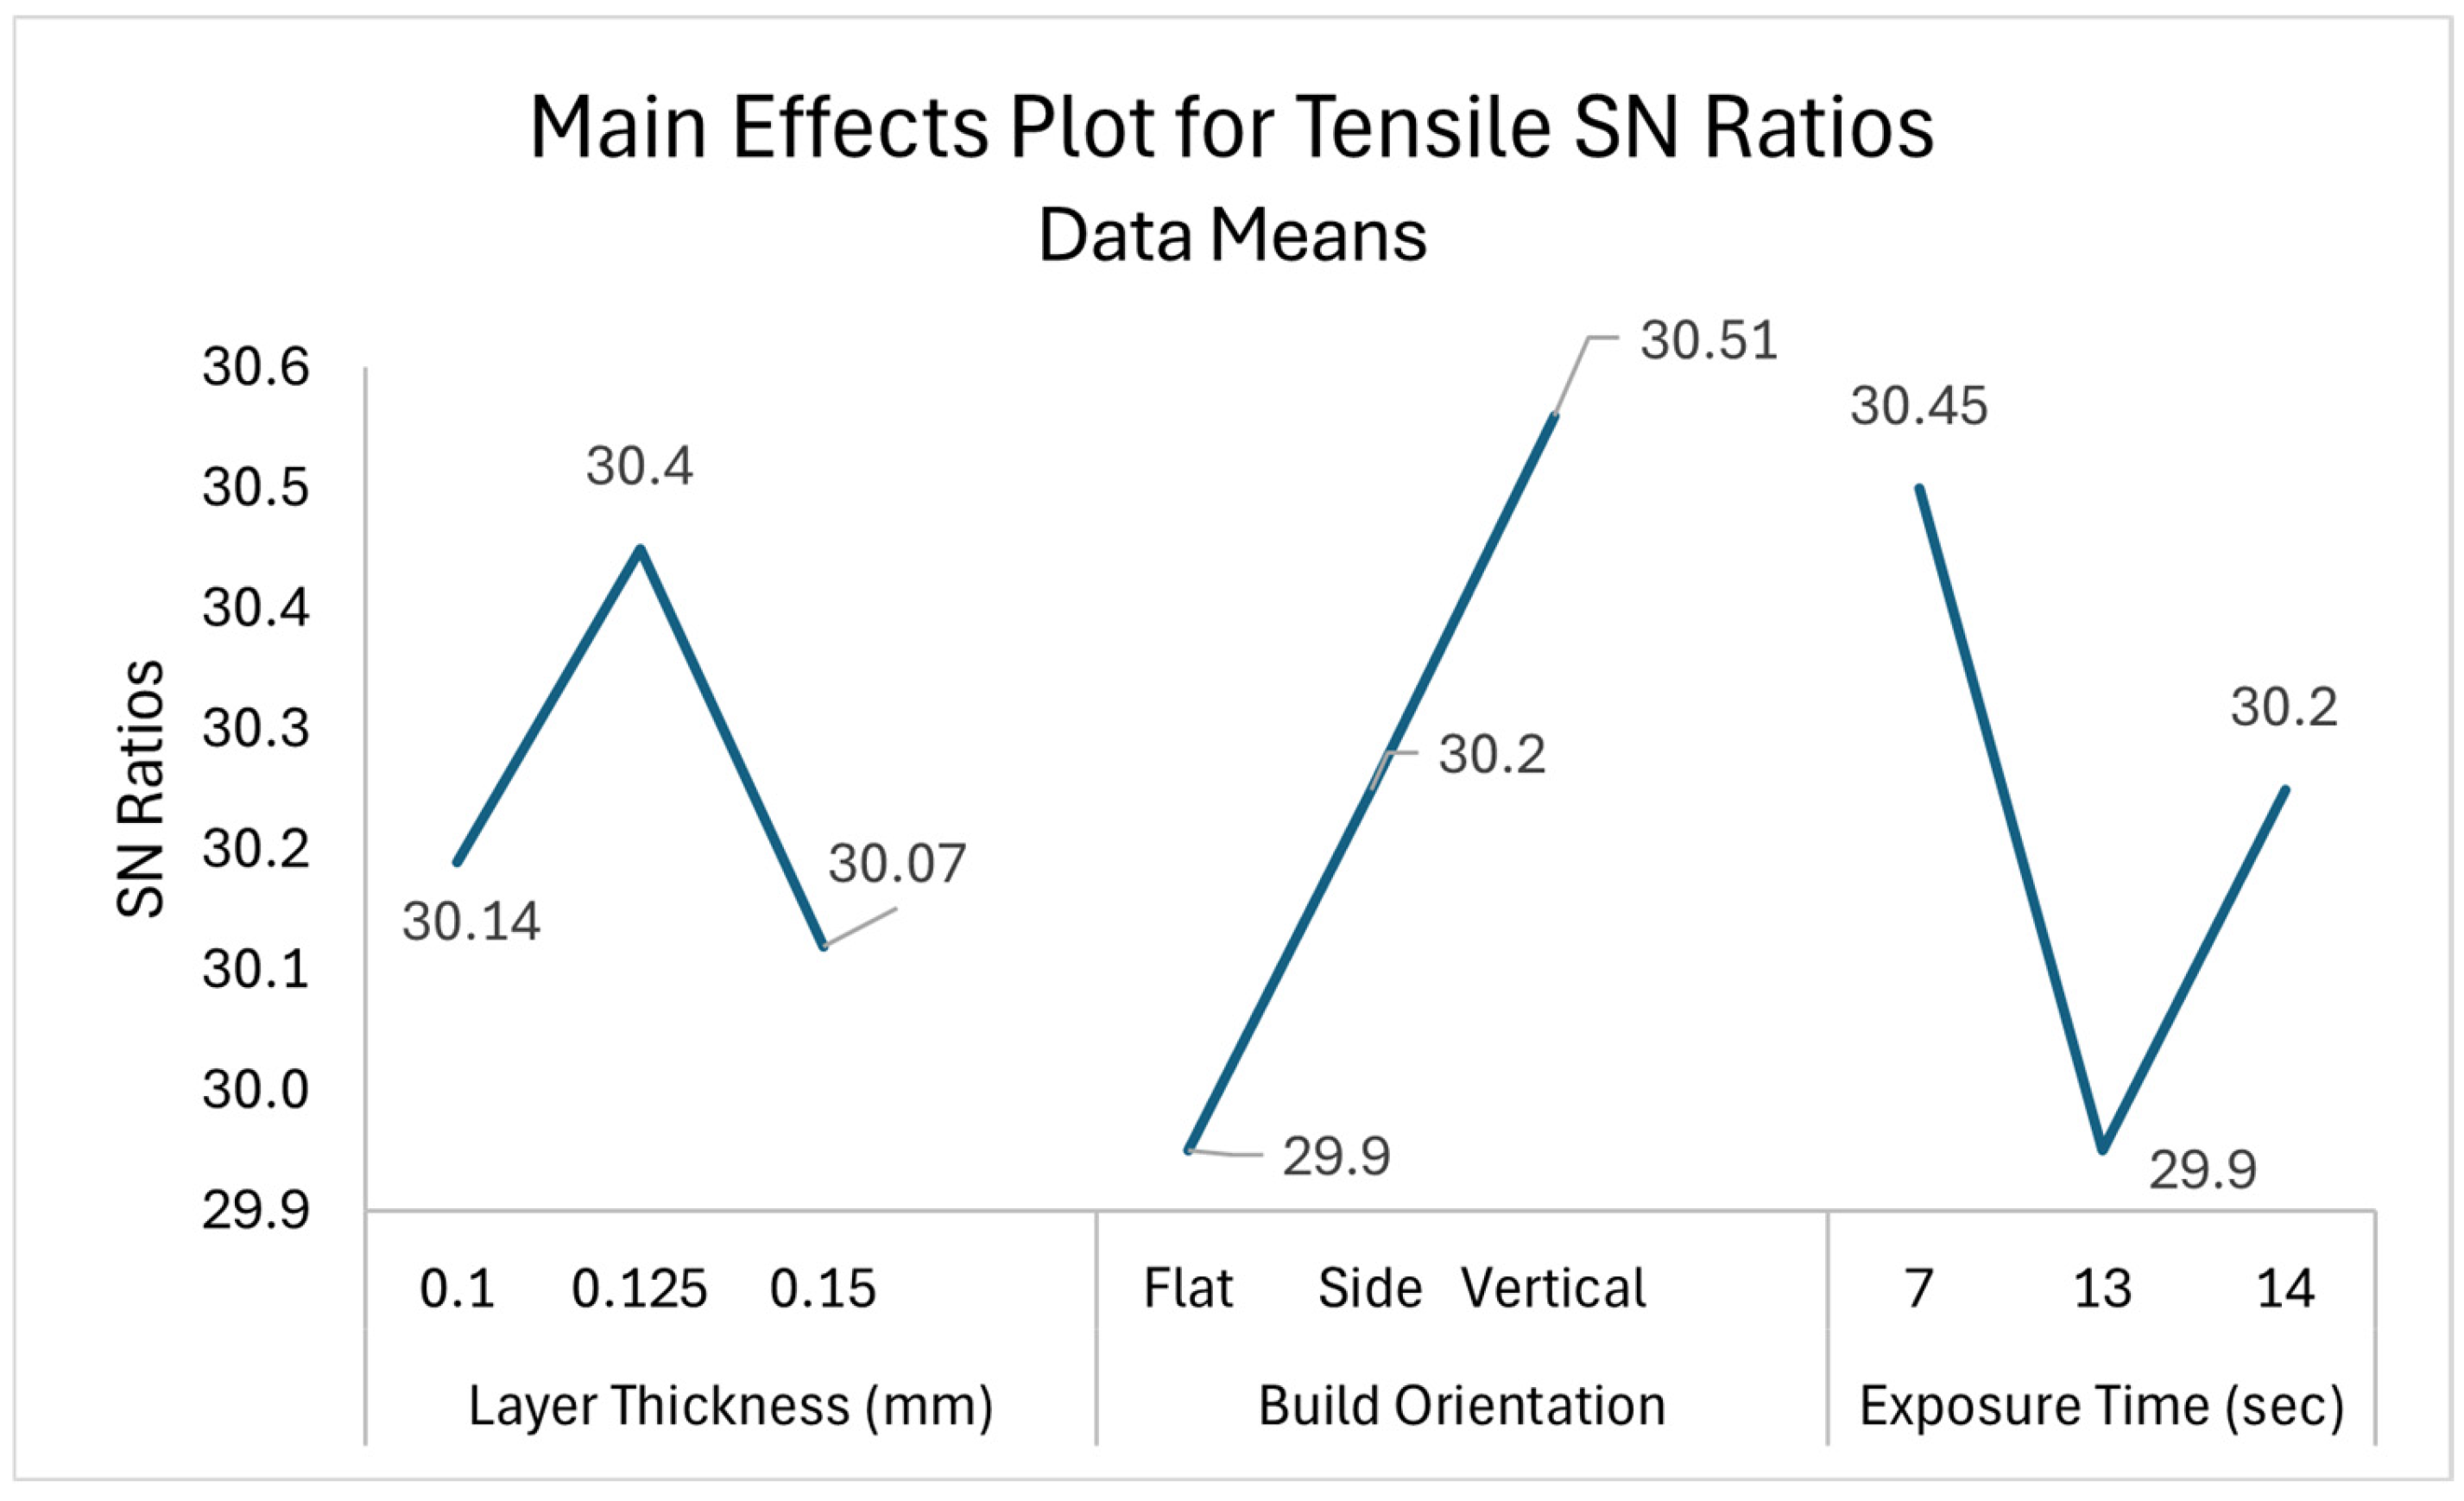
Figure 5 shows the variation in the SN ratio at three levels of process parameters for tensile strength. A higher SN ratio was chosen as the optimum level, as it contributes to higher strength in the part. For this characteristic, the optimum level of the parameters is as follows.
  • Layer thickness: 0.125 mm (level 2, S/N ratio: 30.40).
  • Build orientation: vertical (level 3, S/N ratio: 30.51).
  • Exposure time: 7 s (level 1, S/N ratio: 30.45).
Vertical build orientation shows a higher influence compare to other, thereby supporting the findings of D Ambrosio et al. [27] who reported a greater influence of vertical printing on mechanical properties. The mean plots for tensile strength are given in Figure 6.

3.1.2. ANOVA Analysis for Tensile Strength

ANOVA version 21.2 is used to determine the significance of an independent variable’s effect on the dependent variable, as well as the percentage contribution of each process parameter to the response variable. The process variables that contribute significantly to the response variable are identified and regarded as significant parameters [28,29,30,31]. The percentage contribution of each process parameter to tensile strength is shown in Table 3. This indicates that the measuring outcomes are dependent on the part’s printing orientation. Orientation contributed the most to strength because it determined the interaction of the layers with the applied force. Similarly, optimal orientations increase the bond strength between layers, which significantly enhances the part’s overall strength.

3.2. Flexural Analysis

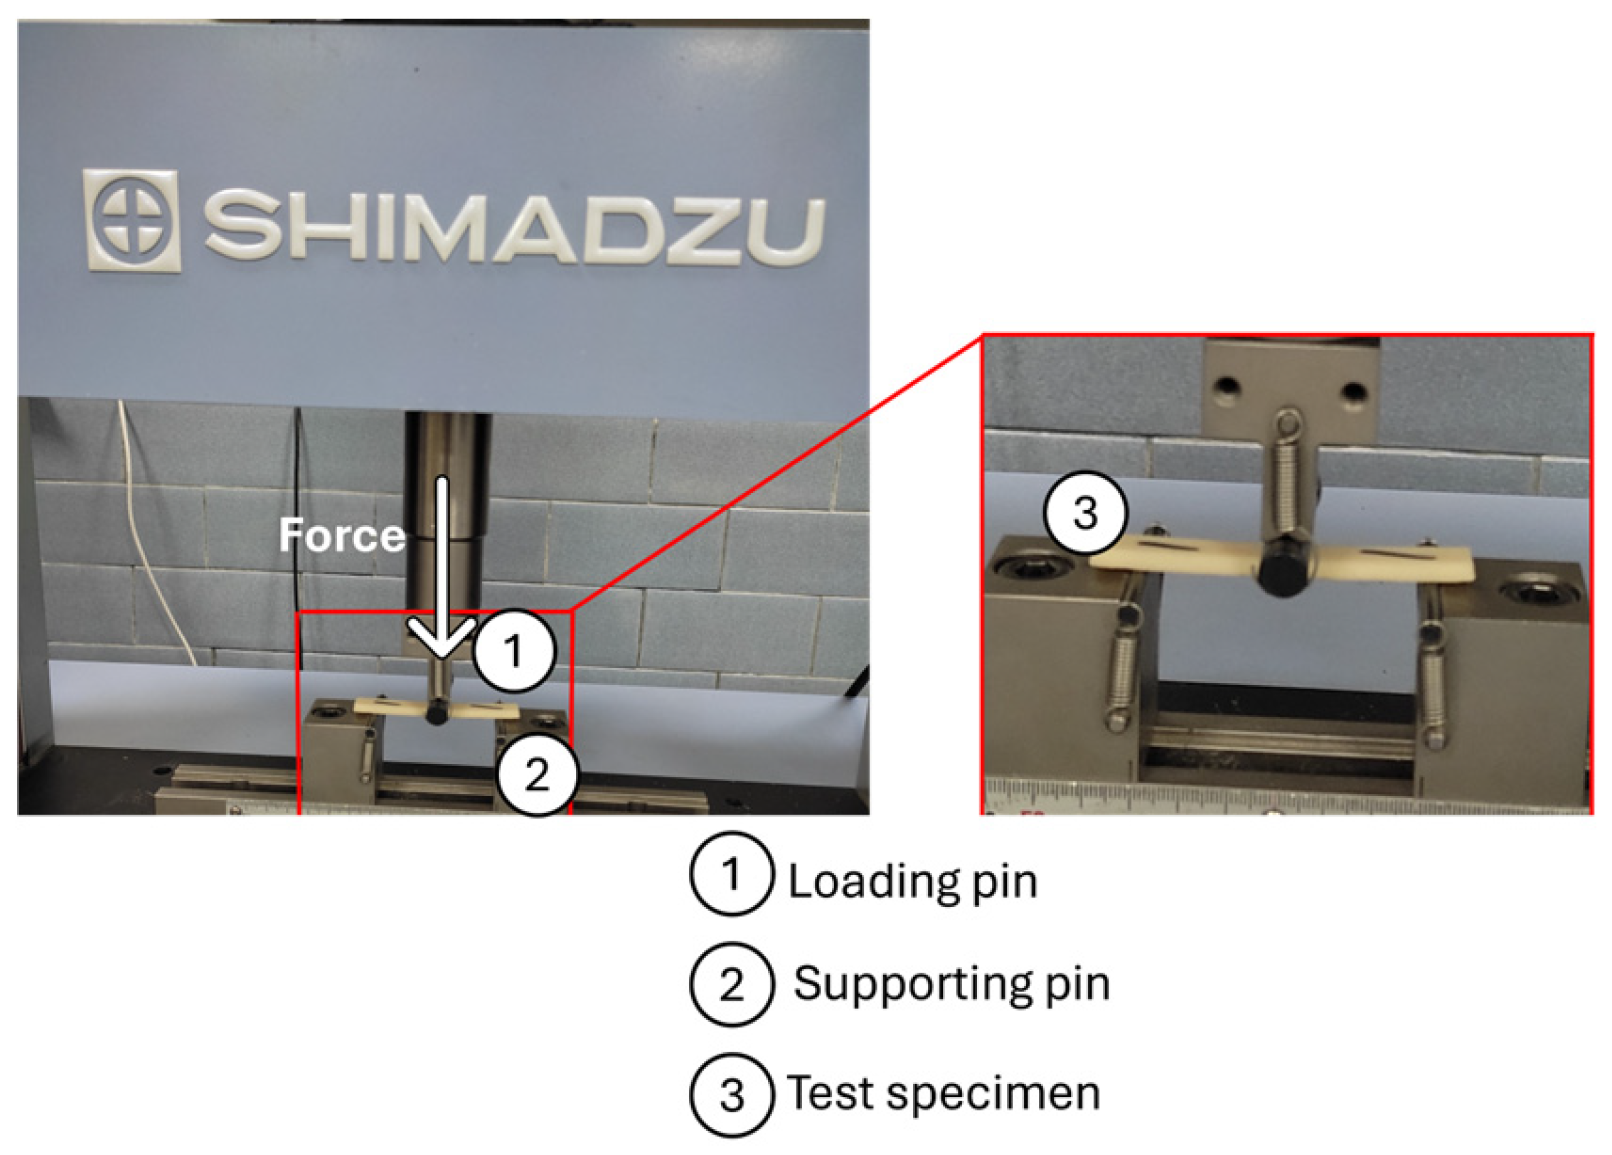
To analyze the flexural properties, nine specimens, as illustrated in Figure 2 (three specimens for each configuration) were tested using a Shimadzu AGX-PLUS, Japan, UTM as depicted in Figure 7.
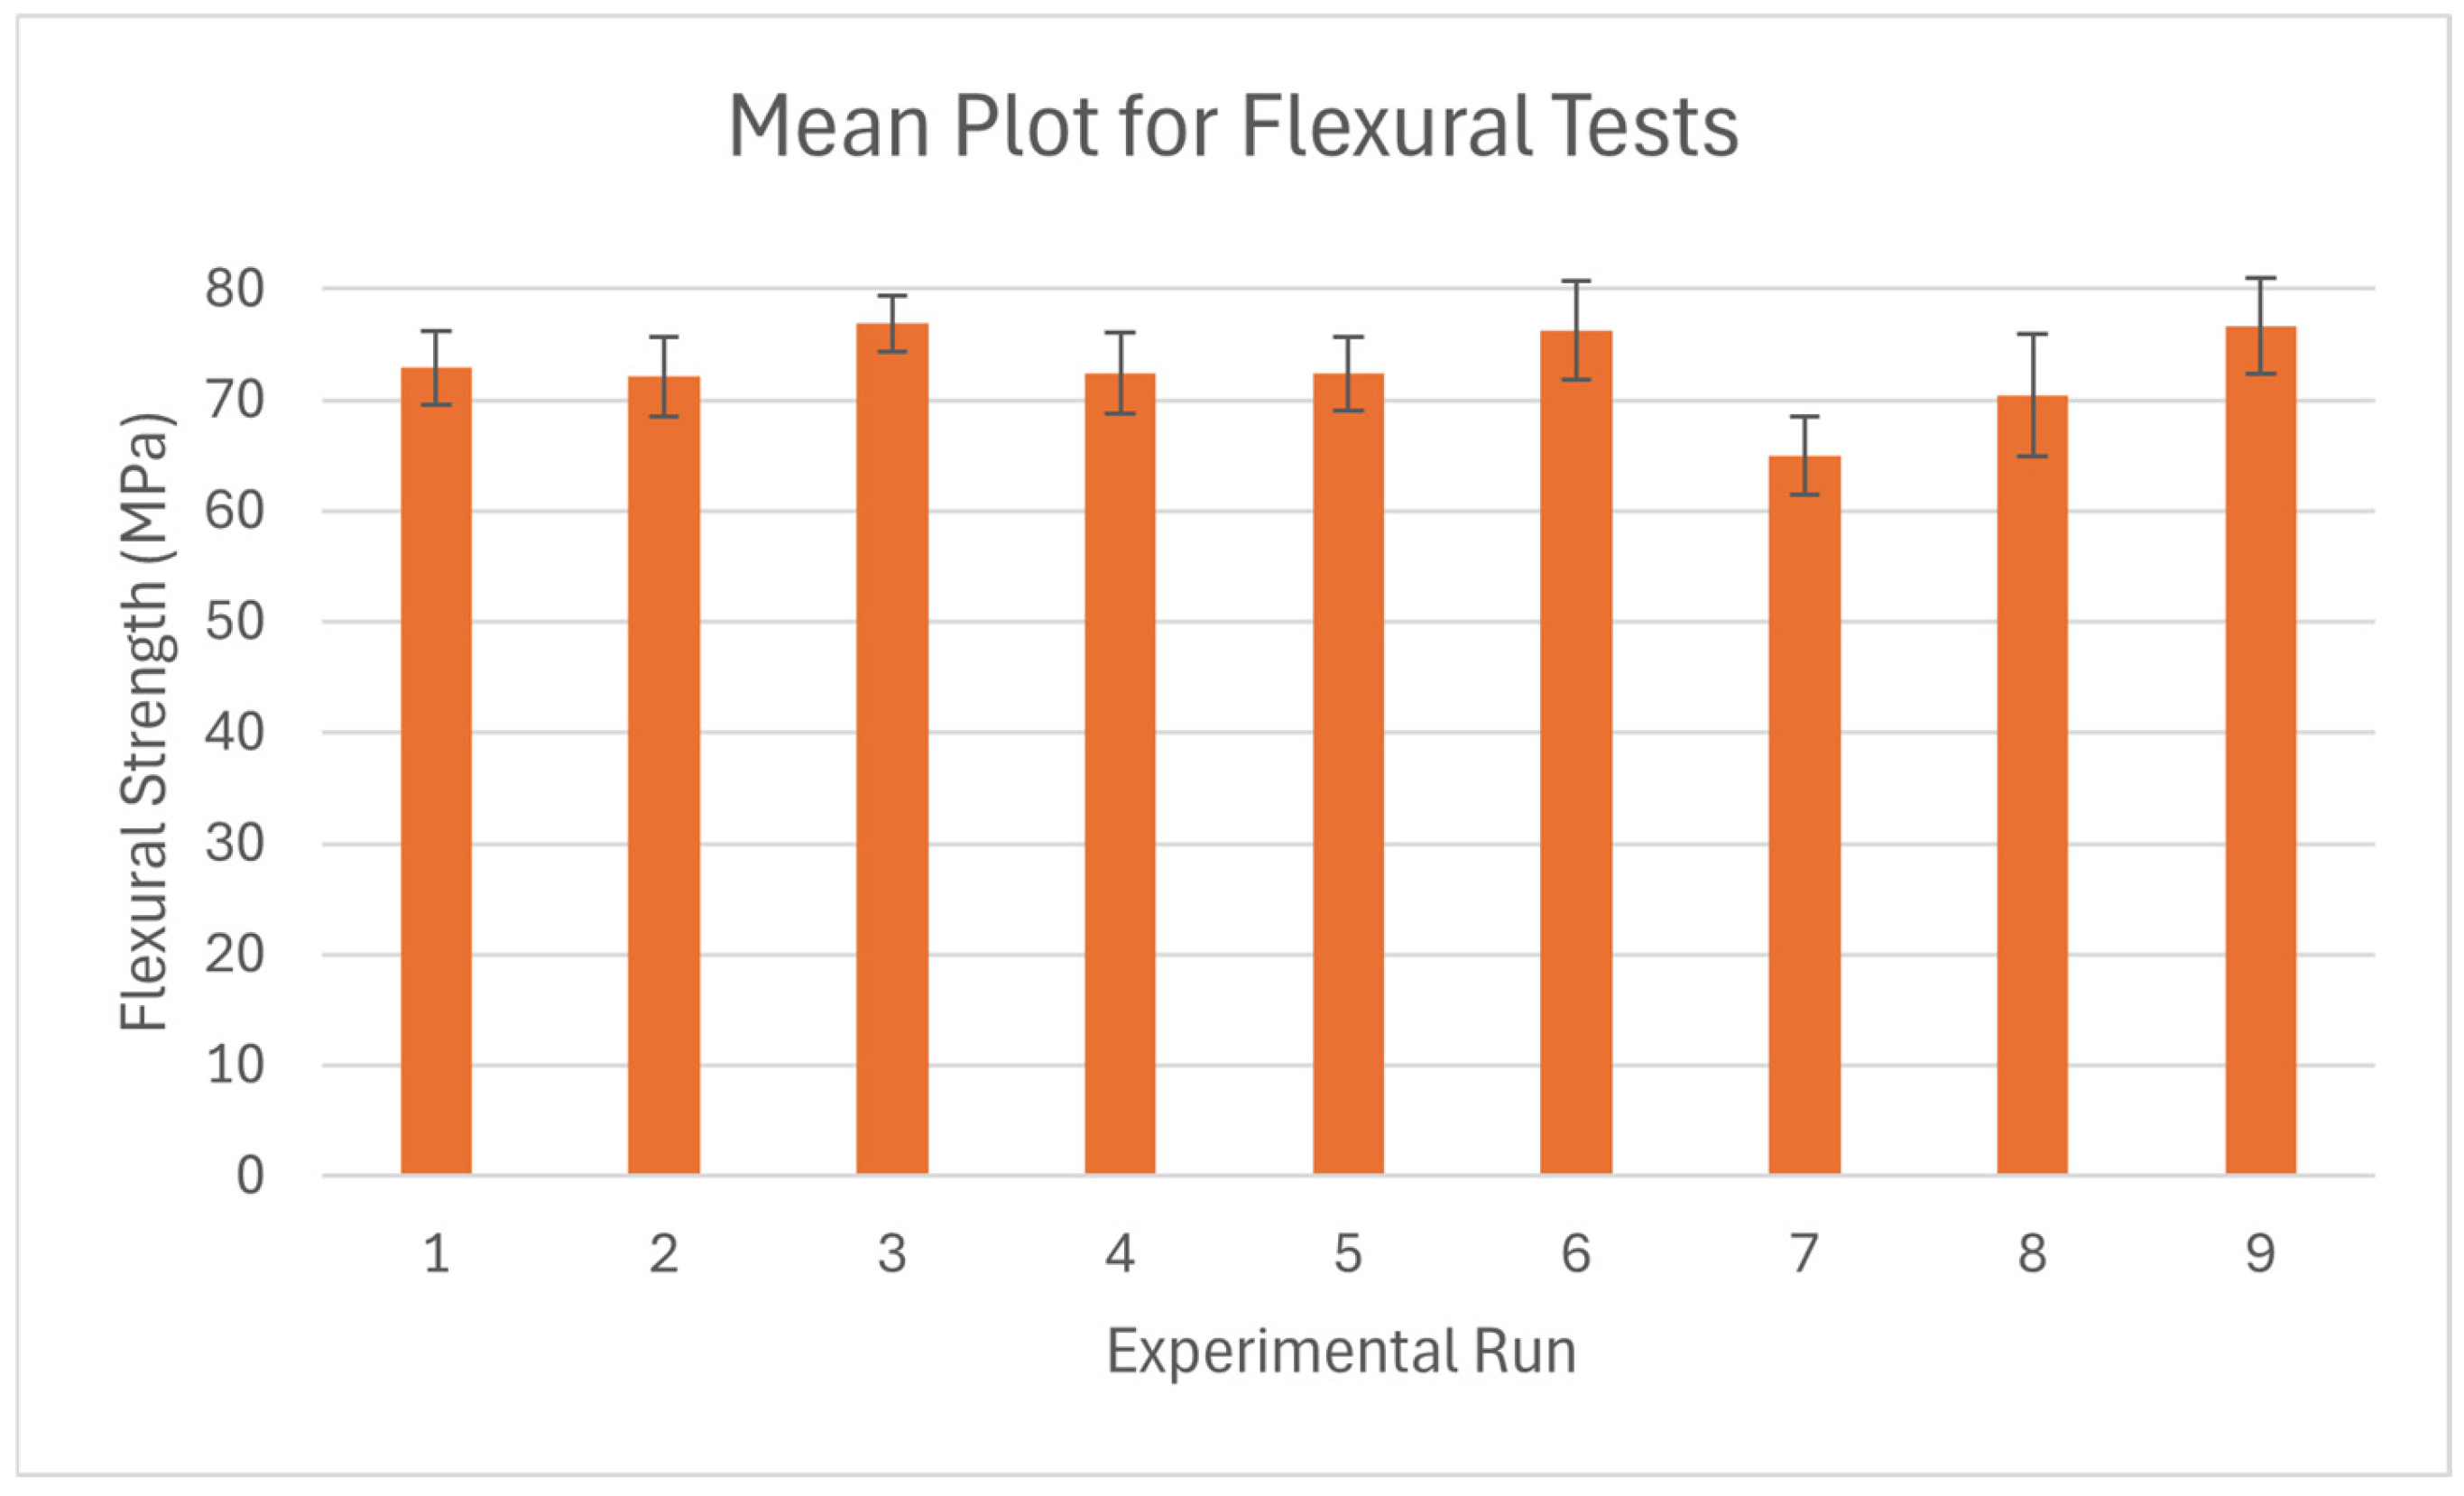
The average strengths are given in Table 4, and the highest value is recorded during the ninth experimental run in the orthogonal array which constitutes a strength of 77.30 MPa. Since vertical build orientation contributes the most to strength, experimental runs such as 3, 6, and 9 exhibit the highest strength.
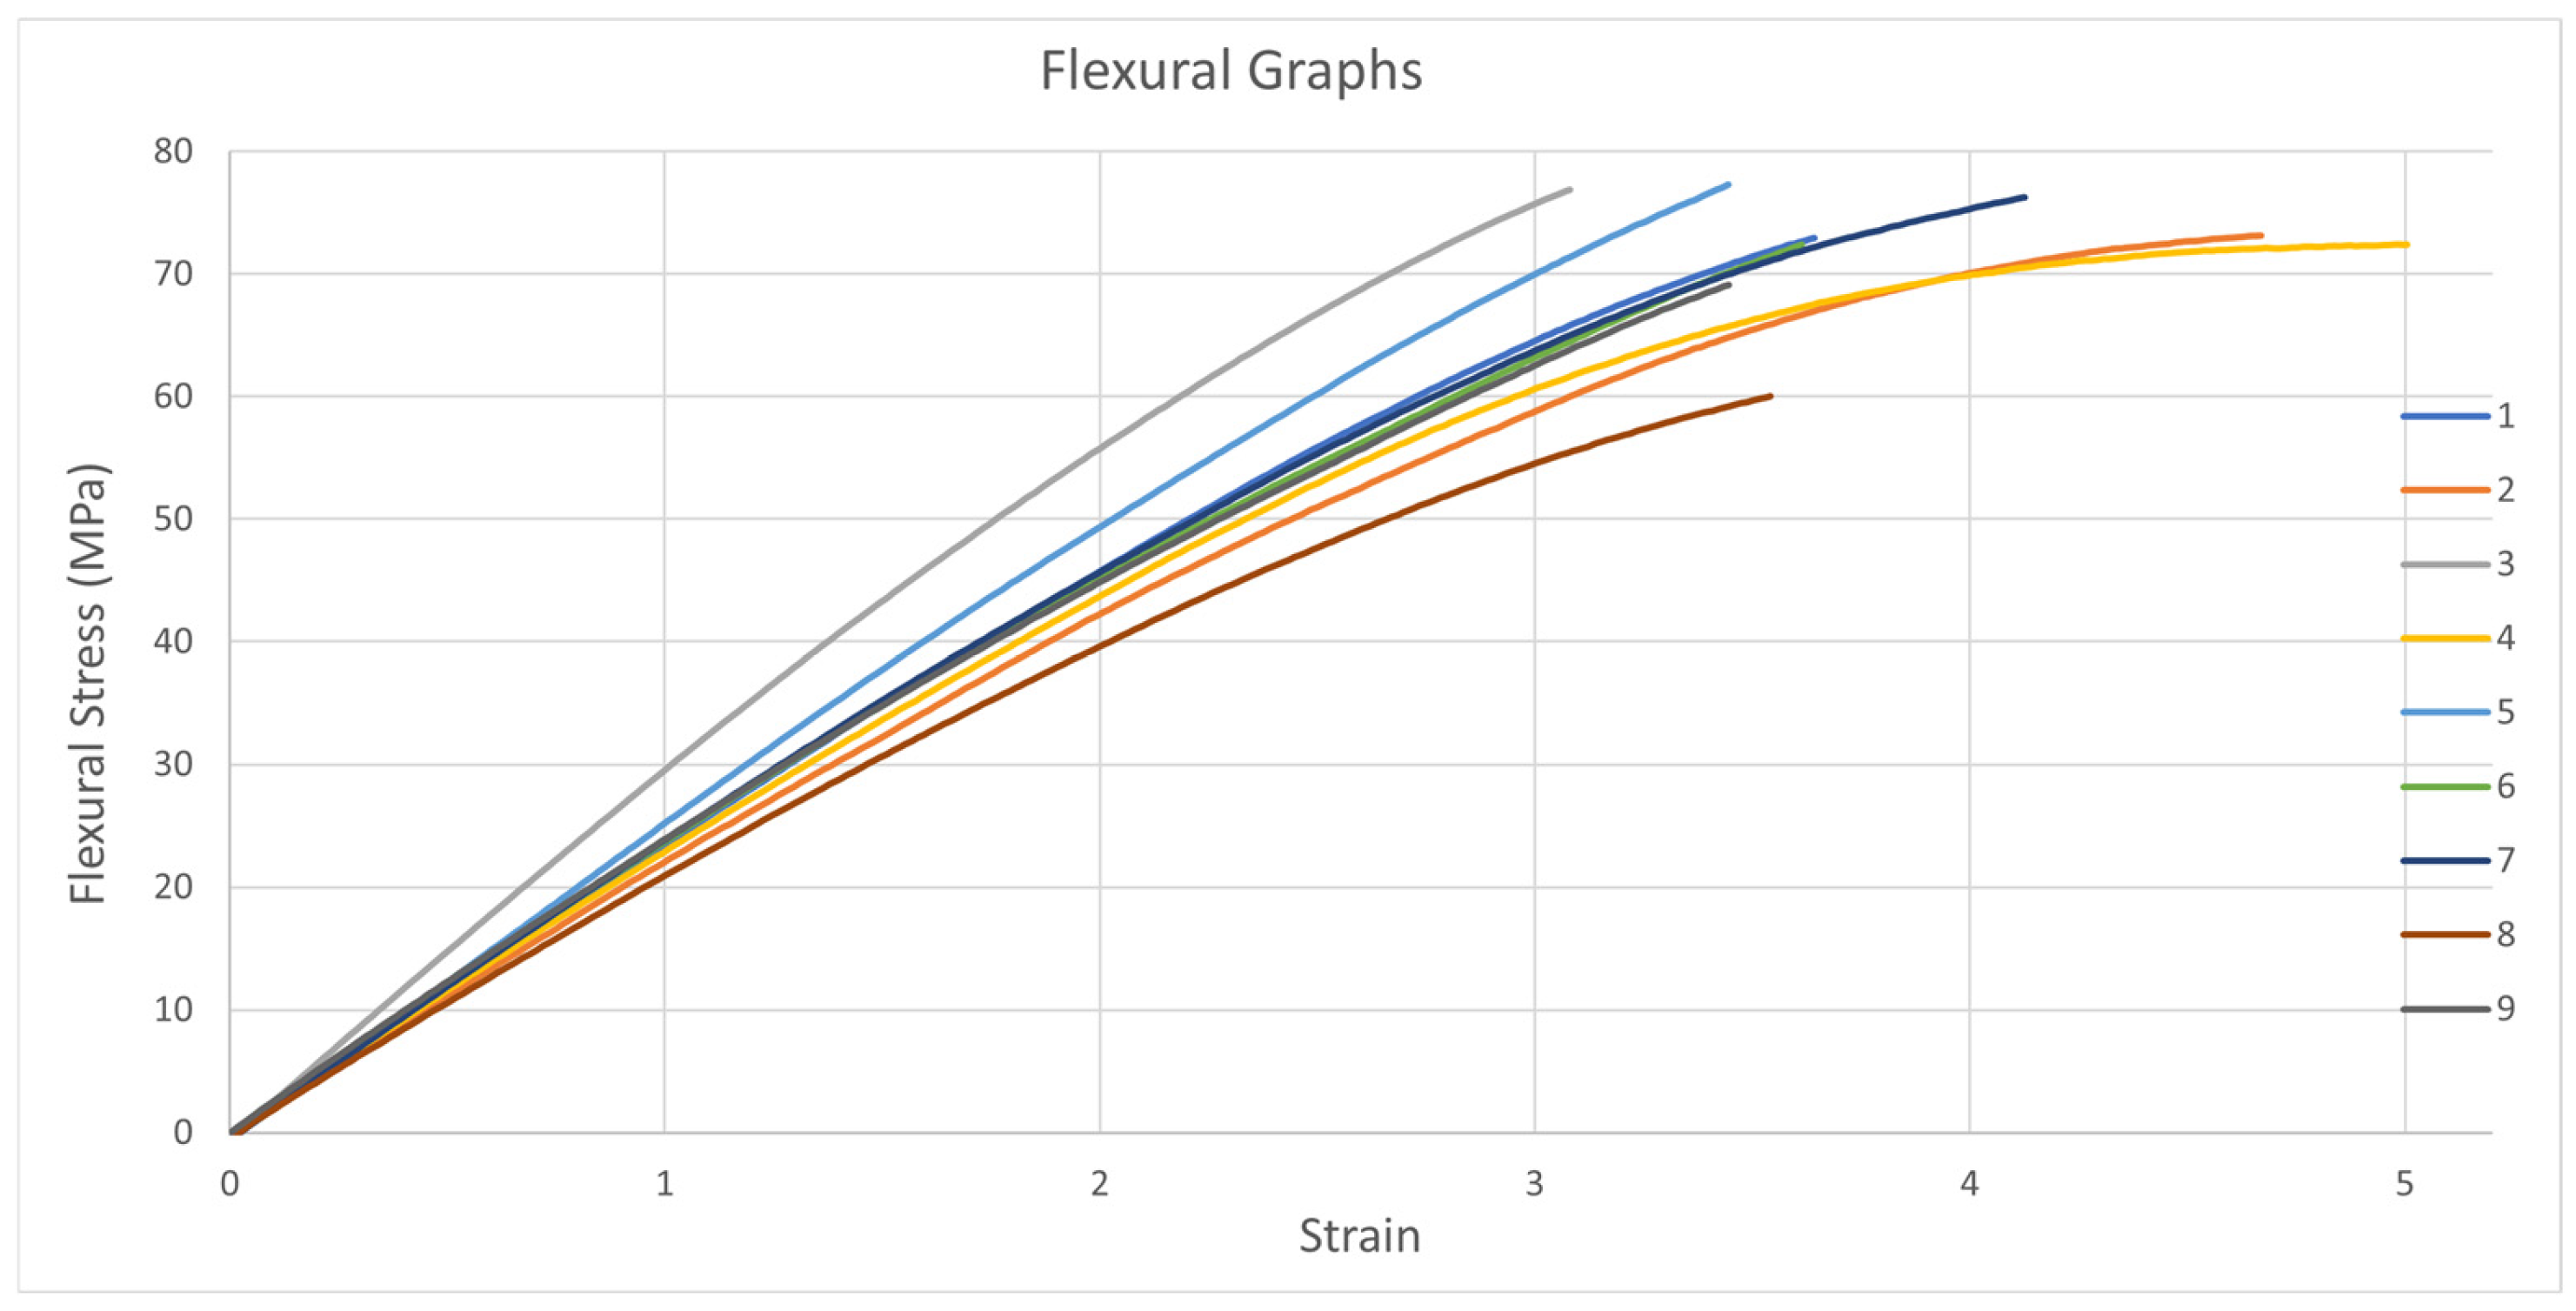
Figure 8 illustrates the bending behavior of the printed sample under flexural load, showing a nonlinear pattern of stress–strain curve. Sample 9 shows the maximum flexural strength, followed by 3 and 6.

3.2.1. Optimal Process Parameters for Flexural Strength

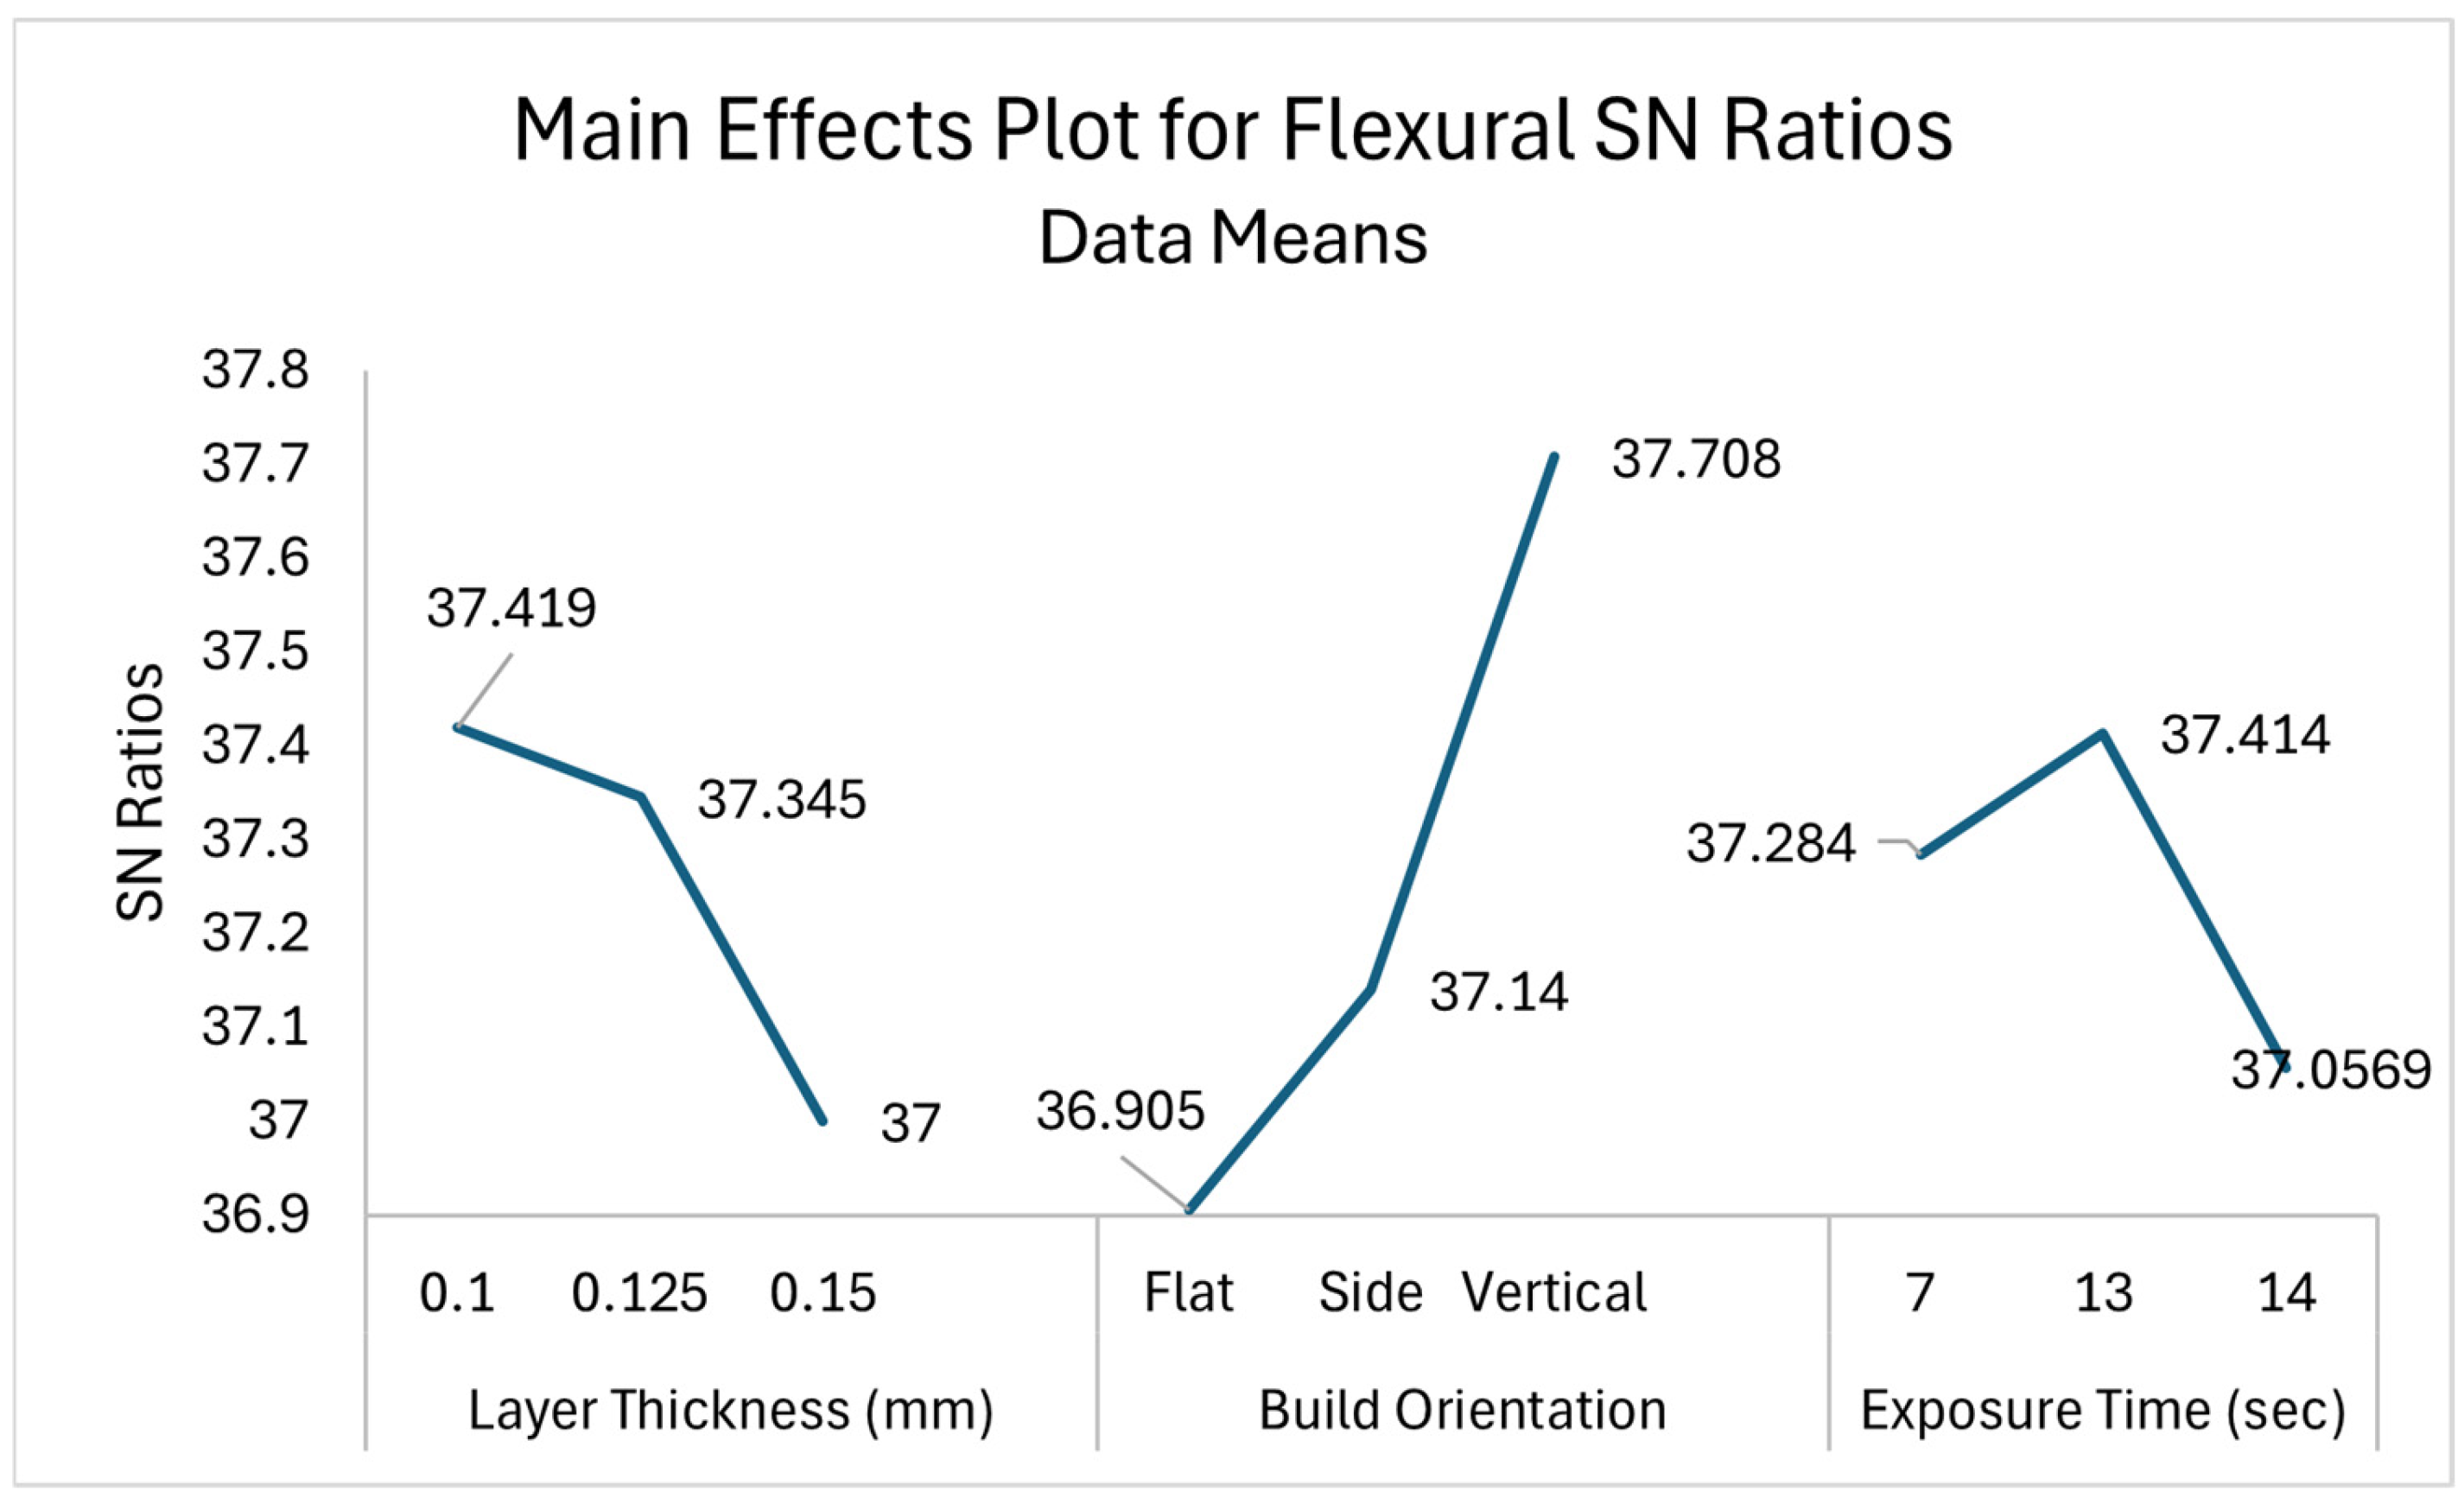
Figure 9 illustrates the variation in the S/N ratio across the three levels of process parameters. The optimum levels for achieving higher flexural strength of the part are as follows.
  • Layer thickness: 0.1 mm (level 1, S/N ratio: 37.419).
  • Build orientation: vertical (level 3, S/N ratio: 37.708).
  • Exposure time: 13 s (level 2, S/N ratio: 37.414).
The decrease in mechanical performance with the increase in layer thickness supports Chockalingam et al. [32]’s findings that suggest reduced mechanical properties with higher layer thickness. The mean plots for flexural strength are given in Figure 10.

3.2.2. ANOVA Analysis for Flexural Strength

Table 5 shows the contribution of each process parameter to the flexural strength. The highest contribution is from orientation, followed by layer thickness, and exposure time with 59.588, 18.367, and 11.44 percent, respectively.

3.3. Impact Analysis

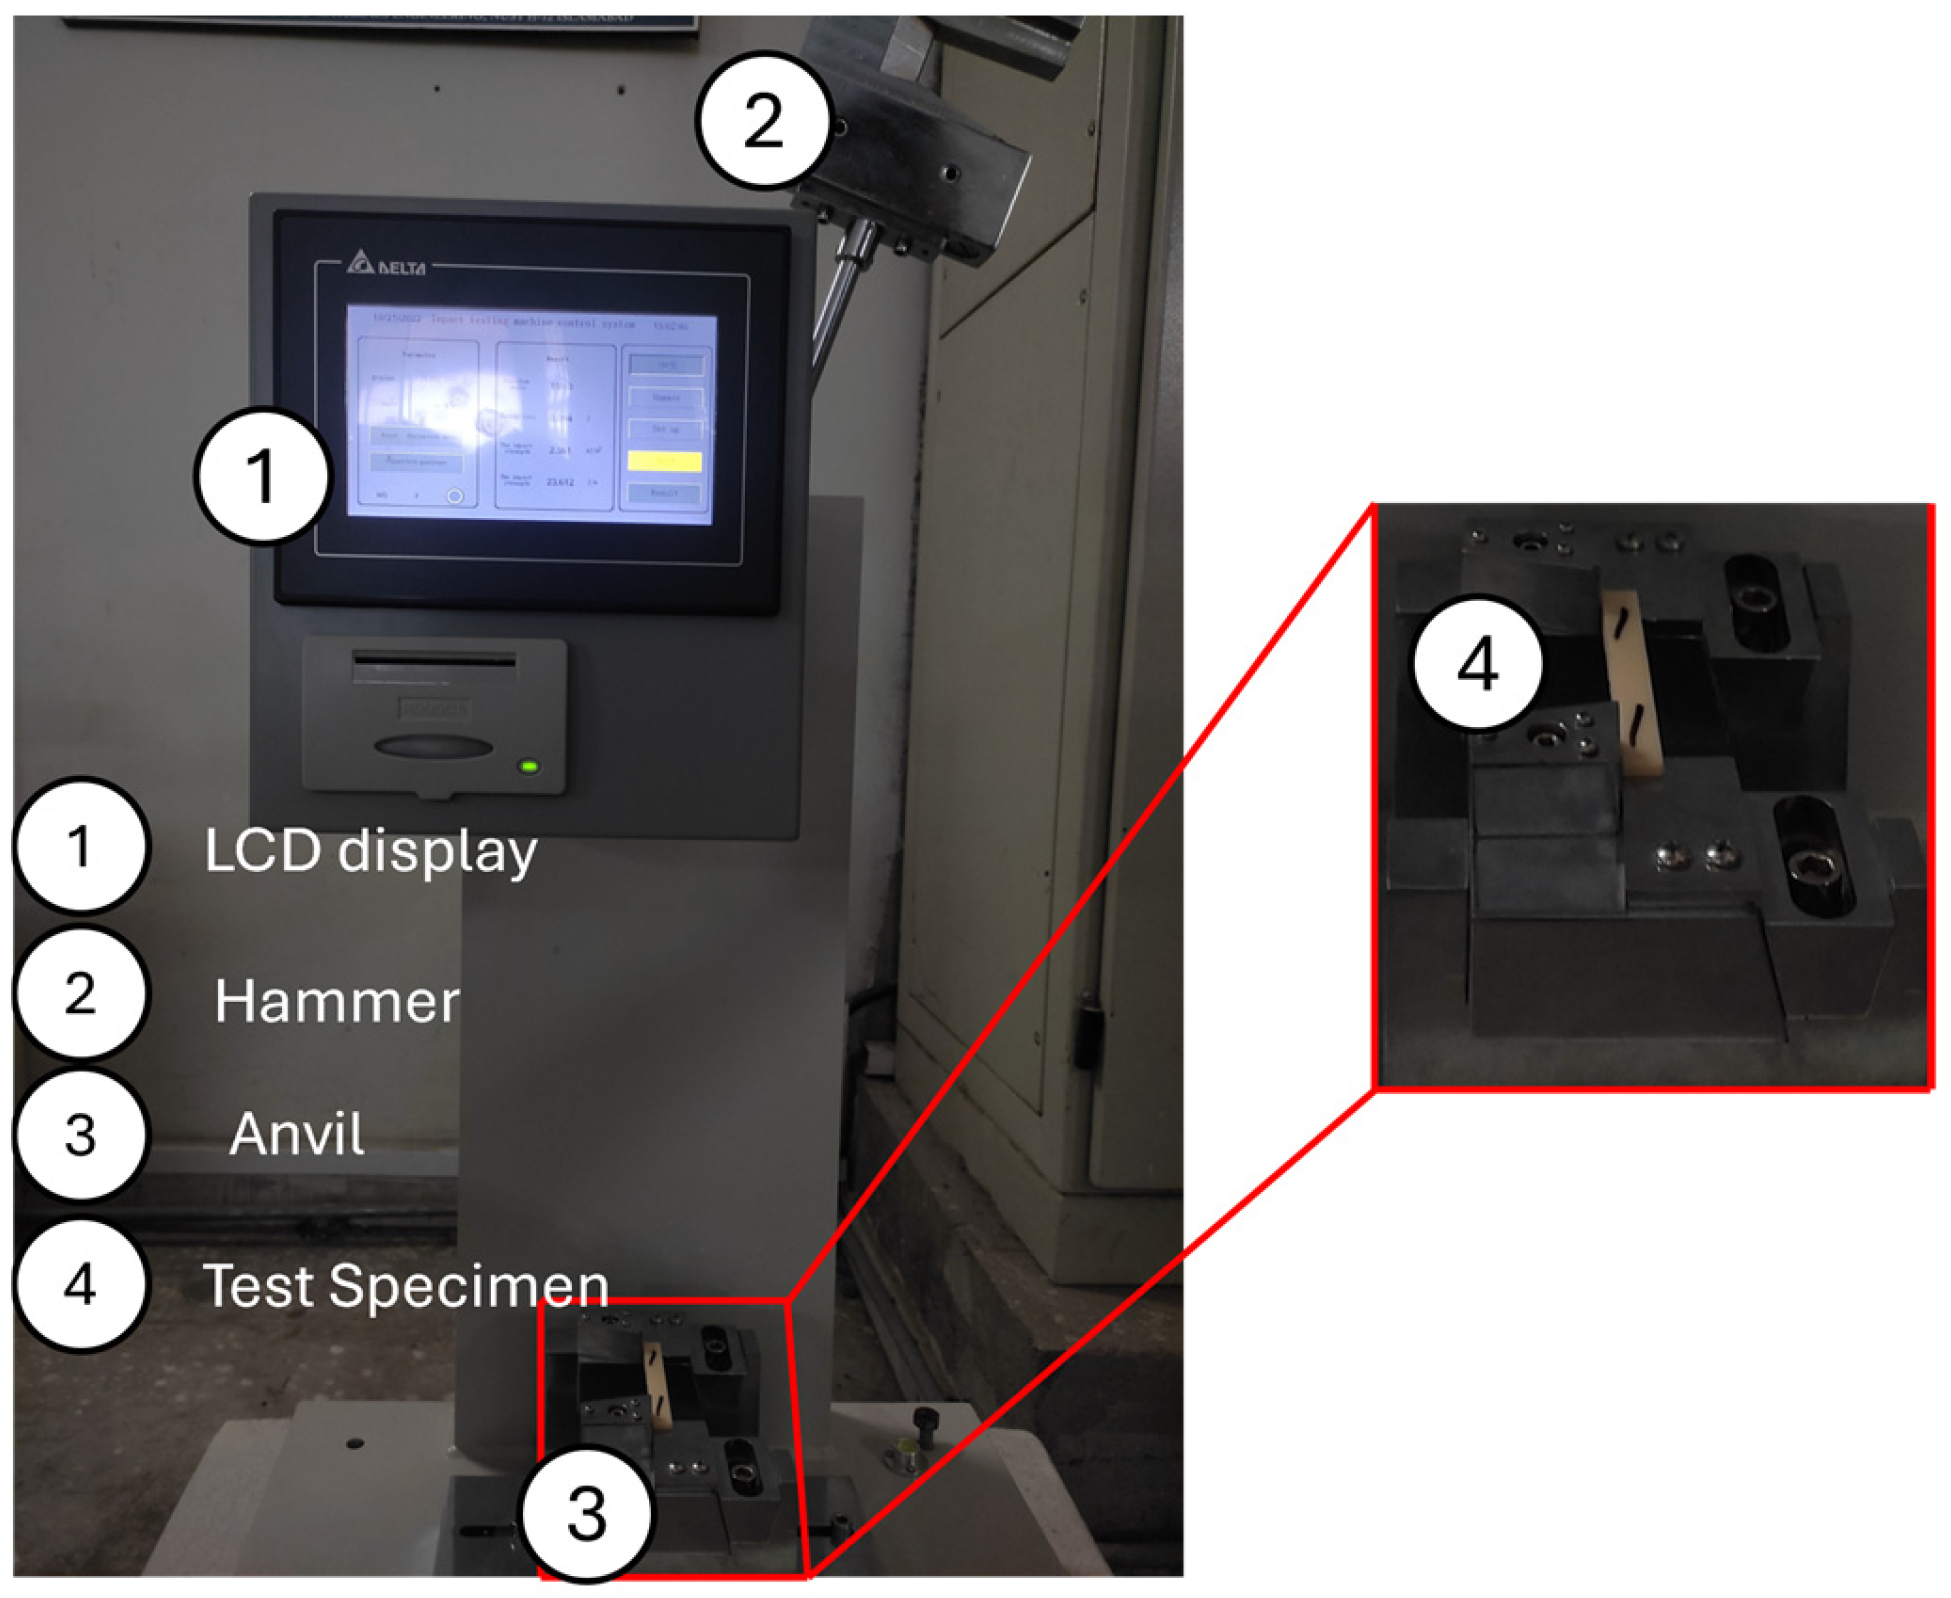
To examine the effect of the considered parameters on the impact strength, an XJJWD-50, China, Impact Tester was used as shown in Figure 11. The specimens were tested to determine how much energy the material absorbs before breaking or fracturing.
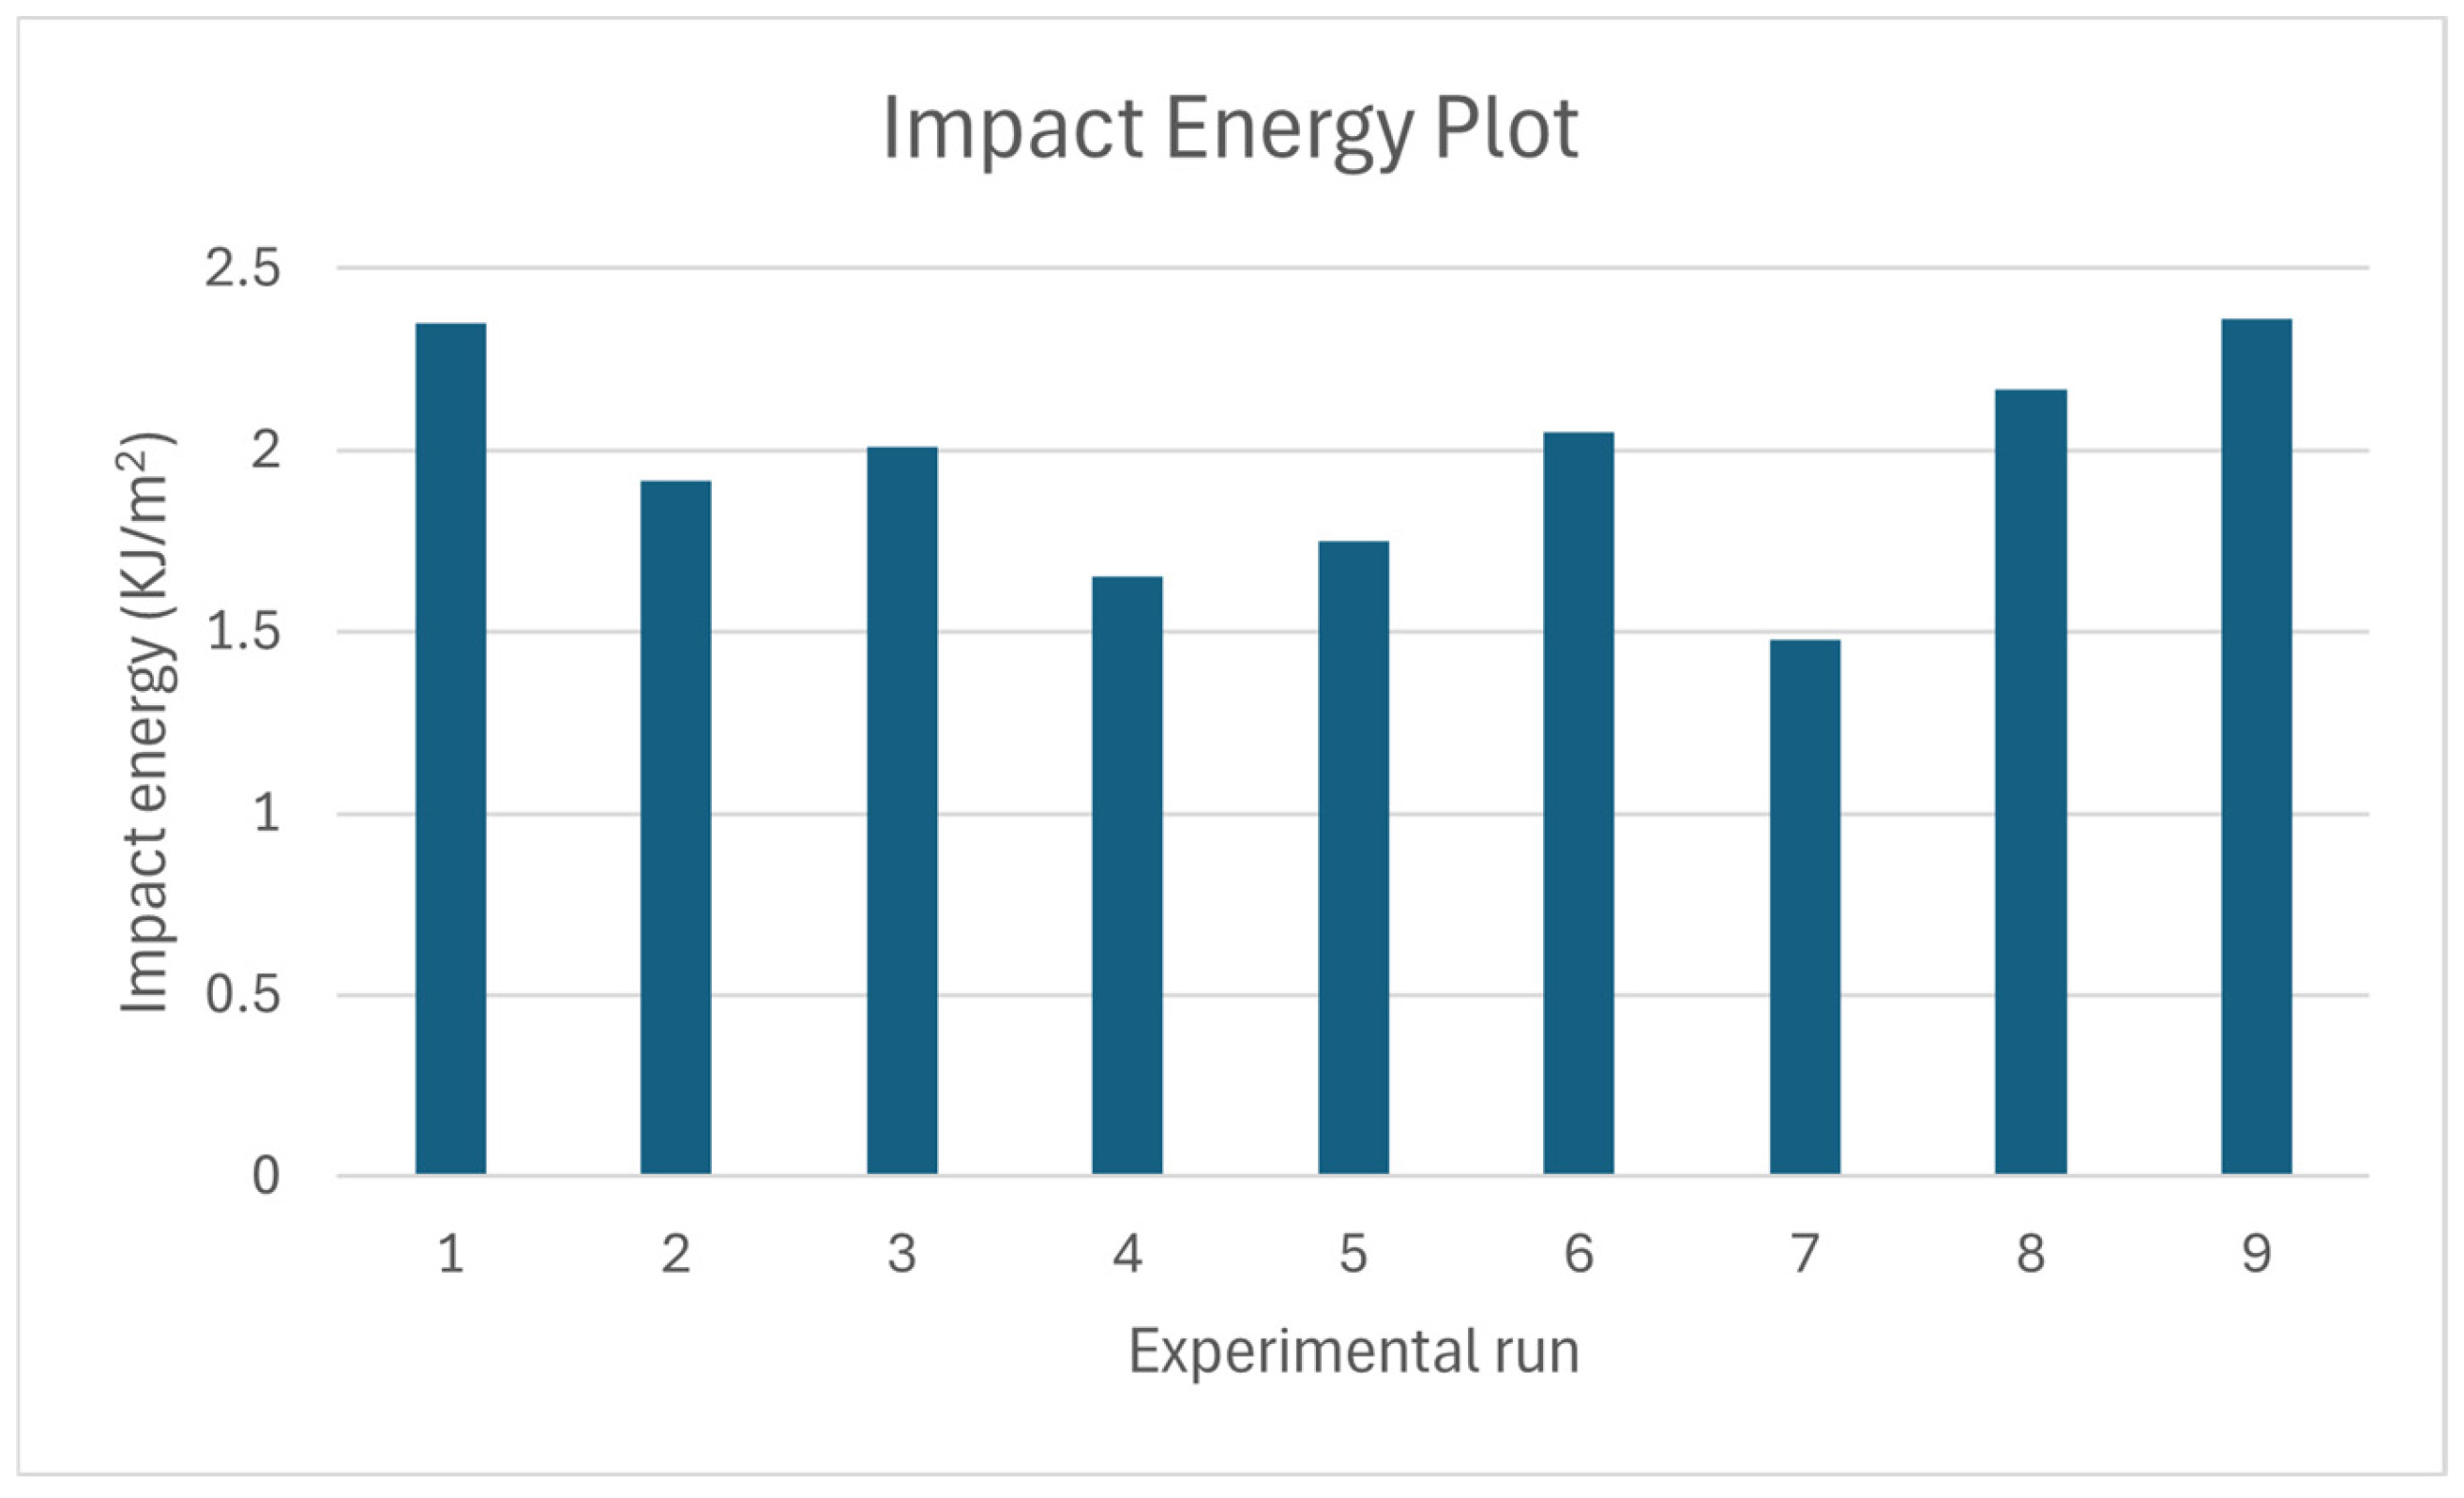
The average impact strengths of the tested specimens are shown in Table 6. The highest value observed at the third experimental run constitutes a 0.1 mm layer thickness and a vertical build orientation.
Figure 12 illustrates the impact energy absorbed per unit area for different experimental settings in the L9 orthogonal array. The variations across the samples are noticeable, showing the influence of different parameters on the material’s performance.

3.3.1. Optimal Process Parameters for Impact Strength

The variation in the S/N ratio at three levels of process parameters for impact strength is illustrated in Figure 13. The optimum levels for the impact tensile strength of the part are as follows.
  • Layer thickness: 0.1 mm (level 1, S/N ratio: 27.422).
  • Build orientation: vertical (level 3, S/N ratio: 27.574).
  • Exposure time: 7 s (level 1: S/N ratio: 27.229).
Similarly, Figure 14 shows the average impact strength for different experimental runs with varying process parameters. The thinner line illustrates the standard deviations for each experiment.

3.3.2. ANOVA Analysis for Impact Strength

The percentage of contribution of each process parameter to the impact strength was calculated, with build orientation having the largest share, followed by exposure time and layer thickness, as shown in Table 7.

3.4. Validation

To verify the SN ratios (optimized settings) for tensile, flexural, and impact strength, two specimens were printed for each test. The optimized settings are as follows: 0.125 mm layer thickness for tensile strength, 0.1 mm layer thickness for flexural and impact strength, vertical build orientation, 7 s exposure time for tensile and impact strength, and 13 s for flexural strength. Table 8 does not include build orientation, as vertical orientation was selected for all tests, and it provides an average result for validation. This test confirms that the parameter’s level with the highest SN ratio possesses the maximum strength.

4. Regression Model

In several disciplines, including finance, engineering, and the social sciences, regression models can be used to describe correlations between variables. Minitab software 21.2 was used to create a regression model between the response variable and independent variables. An L9 orthogonal array was first created in the software and then a dependent variable column was inserted which includes experimental values. The nonlinear regression model was selected to create a regression model for tensile, flexural, and impact tests by appointing layer thickness and exposure time as independent variables, and strength as a dependent variable.
Three regression models as shown in Equations (2)–(4) were created for tensile, flexural, and impact strength, respectively. Since vertical build orientation possesses a maximum contribution to strength, the regression model predicts values for vertical build orientation only. This model helps designers and engineers to predict the part strength before actual experimentation.
Tensile Strength = 10.64 − 1776 × LT2 + 0.17 × ET2 + 551.10 × LT − 2.48 × ET − 9.91 × LT × ET
Flexural Strength = 1.23 − 1730.6 × LT2 − 0.43 × ET2 + 471.9 × LT + 10.04 × ET − 9.50 × LT × ET
Impact Strength = 22.39 + 1922.4 × LT2 − 0.30 × ET2 − 453.3 × LT + 6.83 × ET − 7.58 × LT × ET
Residuals plot for tensile, flexural, and impact strength are given in Figure 15. These plots confirm the independent nature and a random distribution of residuals which suggest that the model is a good fit for predicting these strengths.
5. Performance Evaluation

To verify the proposed regression models, it is necessary to carry out a comparison analysis between experimental and regression values of the response variables at different experimental run values. Table 9 shows the percent deviation of the regression model from experimental values. Average deviations are given at the end of the table. An average percent deviation of 2.16, 3.66, and 7.16 was observed from the experimental values for tensile, flexural, and impact strength, respectively. Similarly, the models predict values closer to the validation test values, which include 4.6, 1.22, and 8.6 percent deviations, and prove to be a good fit for the future prediction of strength.

6. Conclusions

This paper offers a unique study analyzing different printing parameters on biomedical material using masked stereolithography. Taguchi’s design of experiments is used to conduct experimentation and analyze the influence of parameters on a part’s strength.
  • Among the three parameters, build orientation possesses a maximum contribution to tensile, flexural, and impact strength with a percentage of 47.03, 59.58, and 39.48, respectively, followed by layer thickness and exposure time.
  • The optimal values of the selected parameters within the level are 0.1 mm layer thickness, vertical build orientation, and 7 s exposure time, enhancing the tensile strength by 9.26 percent, flexural strength by 5.93 percent, and impact strength by 17.89 percent compared to the average experiment strength.
  • The proposed regression model shows only 2.16, 3.66, and 7.16 average percent deviation from the tensile, flexural, and impact experimental values, respectively. The regression model can be significantly important for predicting the strength of the part before printing through the SLA 3D printer.

7. Future Work

As this study does not propose interaction between parameters, future work should include interactions: conducting experiments for other mechanical properties like compressive strength and carrying out X-ray diffraction and scanning electron microscopy to understand the variation in the mechanical properties. Similarly, investigating the effect of aging and post curing (time and temperature) with exposure time will contribute to the advancement of vat polymerization.

Author Contributions

Conceptualization, M.A.; Methodology, M.A. and M.R.u.H.; Software, D.J.; Validation, M.A. and M.R.u.H.; formal analysis, M.R.u.H. and D.J.; investigation, M.A. and D.J.; resources, S.I.B.; data curation, M.A. and M.R.u.H.; writing—original draft preparation, M.A. and D.J.; writing—review and editing, M.R.u.H. and S.I.B.; visualization, S.I.B.; supervision, S.I.B.; project administration, S.I.B. and M.R.u.H.; funding acquisition, M.A. All authors have read and agreed to the published version of the manuscript.

Funding

This research received no external funding.

Institutional Review Board Statement

Not applicable.

Informed Consent Statement

Informed consent was obtained from all subjects involved in the study.

Data Availability Statement

The raw data supporting the conclusions of this article will be made available by the authors on request.

Conflicts of Interest

The authors declare no conflict of interest.

References

  1. Wallin, T.; Pikul, J.; Shepherd, R.F. 3D printing of soft robotic systems. Nat. Rev. Mater. 2018, 3, 84–100. [Google Scholar] [CrossRef]
  2. Wong, K.V.; Hernandez, A. A review of additive manufacturing. Int. Sch. Res. Not. 2012, 2012, 208760. [Google Scholar] [CrossRef]
  3. Pereira, V.B.; Goulart, M.E.P.; Beltrami, L.V.R.; Piazza, D.; de Oliveira Gamba, T.; Zattera, A.J. Dental Composites of Acrylic Resin and Nanoclay Developed by Additive Manufacturing. J. Mater. Eng. Perform. 2025, 34, 10470–10480. [Google Scholar] [CrossRef]
  4. Abbasnezhad, N. A Joining Strategy for the Stereolithography-Printed Parts: Thermal and Mechanical Characterization. J. Mater. Eng. Perform. 2025, 34, 9506–9515. [Google Scholar] [CrossRef]
  5. Da Silva, T.M.; Immich, F.; De Araujo, T.S.; Lund, R.G.; Da Silva, A.F.; Piva, E.; Da Rosa, W.L.D.O. Photosensitive resins used in additive manufacturing for oral application in dentistry: A scoping review from lab to clinic. J. Mech. Behav. Biomed. Mater. 2023, 141, 105732. [Google Scholar] [CrossRef] [PubMed]
  6. Revilla-León, M.; Umorin, M.; Özcan, M.; Piedra-Cascón, W. Color dimensions of additive manufactured interim restorative dental material. J. Prosthet. Dent. 2020, 123, 754–760. [Google Scholar] [CrossRef] [PubMed]
  7. Chen, H.; Yang, X.; Chen, L.; Wang, Y.; Sun, Y. Application of FDM three-dimensional printing technology in the digital manufacture of custom edentulous mandible trays. Sci. Rep. 2016, 6, 19207. [Google Scholar] [CrossRef]
  8. Kanazawa, M.; Iwaki, M.; Arakida, T.; Minakuchi, S. Digital impression and jaw relation record for the fabrication of CAD/CAM custom tray. J. Prosthodont. Res. 2018, 62, 509–513. [Google Scholar] [CrossRef]
  9. Yoshidome, K.; Torii, M.; Kawamura, N.; Shimpo, H.; Ohkubo, C. Trueness and fitting accuracy of maxillary 3D printed complete dentures. J. Prosthodont. Res. 2021, 65, 559–564. [Google Scholar] [CrossRef]
  10. Solaberrieta, E.; Minguez, R.; Barrenetxea, L.; Sierra, E.; Etxaniz, O. Computer-aided dental prostheses construction using reverse engineering. Comput. Methods Biomech. Biomed. Eng. 2014, 17, 1335–1346. [Google Scholar] [CrossRef]
  11. Inokoshi, M.; Kanazawa, M.; Minakuchi, S. Evaluation of a complete denture trial method applying rapid prototyping. Dent. Mater. J. 2012, 31, 40–46. [Google Scholar] [CrossRef]
  12. Javaid, M.; Haleem, A. Current status and applications of additive manufacturing in dentistry: A literature-based review. J. Oral Biol. Craniofacial Res. 2019, 9, 179–185. [Google Scholar] [CrossRef] [PubMed]
  13. Chockalingam, K.; Jawahar, N.; Ramanathan, K.; Banerjee, P. Optimization of stereolithography process parameters for part strength using design of experiments. Int. J. Adv. Manuf. Technol. 2006, 29, 79–88. [Google Scholar] [CrossRef]
  14. Grant, G.T.; Campbell, S.D.; Masri, R.M.; Andersen, M.R.; American College of Prosthodontists Digital Dentistry Glossary Development Task Force. Glossary of digital dental terms: American College of Prosthodontists. J. Prosthodont. 2016, 25, S2–S9. [Google Scholar] [CrossRef] [PubMed]
  15. da Costa, L.P.G.; Zamalloa, S.I.D.; Alves, F.A.M.; Spigolon, R.; Mano, L.Y.; Costa, C.; Mazzo, A. 3D printers in dentistry: A review of additive manufacturing techniques and materials. Clin. Lab. Res. Dent. 2021, 1–10. [Google Scholar] [CrossRef]
  16. Khorsandi, D.; Fahimipour, A.; Abasian, P.; Saber, S.S.; Seyedi, M.; Ghanavati, S.; Ahmad, A.; De Stephanis, A.A.; Taghavinezhaddilami, F.; Leonova, A.; et al. 3D and 4D printing in dentistry and maxillofacial surgery: Printing techniques, materials, and applications. Acta Biomater. 2021, 122, 26–49. [Google Scholar] [CrossRef]
  17. Saleh, N.; Mansour, S.; Hague, R. Investigation into the mechanical properties of Rapid Manufacturing materials. In Proceedings of the 2002 International Solid Freeform Fabrication Symposium, Austin, TX, USA, 5–7 August 2002. [Google Scholar]
  18. Choi, S.; Samavedam, S. Modelling and optimisation of rapid prototyping. Comput. Ind. 2002, 47, 39–53. [Google Scholar] [CrossRef]
  19. Luangvaranunt, T.; Dhadsanadhep, C.; Umeda, J.; Nisaratanaporn, E.; Kondoh, K. Aluminum-4 mass% copper/alumina composites produced from aluminum copper and rice husk ash silica powders by powder forging. Mater. Trans. 2010, 51, 756–761. [Google Scholar] [CrossRef]
  20. Prasad, D.S.; Krishna, A.R. Production and mechanical properties of A356. 2/RHA composites. Int. J. Adv. Sci. Technol. 2011, 33, 51–58. [Google Scholar]
  21. Kumar, S.A.; Narayan, Y.S. Tensile testing and evaluation of 3D-printed PLA specimens as per ASTM D638 type IV standard. In Innovative Design, Analysis and Development Practices in Aerospace and Automotive Engineering (I-DAD 2018); Springer: Berlin/Heidelberg, Germany, 2018; Volume 2, pp. 79–95. [Google Scholar]
  22. Dhinesh, S.; Arun, P.S.; Senthil, K.K.; Megalingam, A. Study on flexural and tensile behavior of PLA, ABS and PLA-ABS materials. Mater. Today Proc. 2021, 45, 1175–1180. [Google Scholar] [CrossRef]
  23. Chockalingam, K.; Jawahar, N.; Chandrasekar, U.; Ramanathan, K. Establishment of process model for part strength in stereolithography. J. Mater. Process. Technol. 2008, 208, 348–365. [Google Scholar] [CrossRef]
  24. Alzyod, H.; Ficzere, P. Optimizing fused filament fabrication process parameters for quality enhancement of PA12 parts using numerical modeling and taguchi method. Heliyon 2023, 9, e14445. [Google Scholar] [CrossRef] [PubMed]
  25. Shen, M.; Zhao, W.; Xing, B.; Sing, Y.; Gao, S.; Wang, C.; Zhao, Z. Effects of exposure time and printing angle on the curing characteristics and flexural strength of ceramic samples fabricated via digital light processing. Ceram. Int. 2020, 46, 24379–24384. [Google Scholar] [CrossRef]
  26. Alzyod, H.; Ficzere, P. Material-dependent effect of common printing parameters on residual stress and warpage deformation in 3D printing: A comprehensive finite element analysis study. Polymers 2023, 15, 2893. [Google Scholar] [CrossRef] [PubMed]
  27. Ambrosio, D.; Gabrion, X.; Malecot, P.; Amiot, F.; Thibaud, S. Influence of manufacturing parameters on the mechanical properties of projection stereolithography-manufactured specimens. Int. J. Adv. Manuf. Technol. 2019, 105, 1–13. [Google Scholar] [CrossRef]
  28. Yang, W.P.; Tarng, Y. Design optimization of cutting parameters for turning operations based on the Taguchi method. J. Mater. Process. Technol. 1998, 84, 122–129. [Google Scholar] [CrossRef]
  29. Tosun, N.; Cogun, C.; Tosun, G. A study on kerf and material removal rate in wire electrical discharge machining based on Taguchi method. J. Mater. Process. Technol. 2004, 152, 316–322. [Google Scholar] [CrossRef]
  30. Syrcos, G. Die casting process optimization using Taguchi methods. J. Mater. Process. Technol. 2003, 135, 68–74. [Google Scholar] [CrossRef]
  31. Ghani, J.A.; Choudhury, I.; Hassan, H. Application of Taguchi method in the optimization of end milling parameters. J. Mater. Process. Technol. 2004, 145, 84–92. [Google Scholar] [CrossRef]
  32. Chockalingam, K.; Jawahar, N.; Chandrasekhar, U. Influence of layer thickness on mechanical properties in stereolithography. Rapid Prototyp. J. 2006, 12, 106–113. [Google Scholar] [CrossRef]
Figure 1. The 3D printer utilized to print specimens using SLA.
Engproc 111 00026 g001
Figure 2. Additively manufactured test samples.
Engproc 111 00026 g002
Figure 3. Tensile specimen under testing.
Engproc 111 00026 g003
Figure 4. Tensile stress–strain curves.
Engproc 111 00026 g004
Figure 5. Tensile SN graph.
Engproc 111 00026 g005
Figure 6. Mean plots for tensile strength.
Engproc 111 00026 g006
Figure 7. Flexural specimen under test.
Engproc 111 00026 g007
Figure 8. Flexural stress–strain curves.
Engproc 111 00026 g008
Figure 9. Flexural SN graph.
Engproc 111 00026 g009
Figure 10. Mean plots for flexural strength.
Engproc 111 00026 g010
Figure 11. Impact specimen under test.
Engproc 111 00026 g011
Figure 12. Impact energy plot.
Engproc 111 00026 g012
Figure 13. Impact SN graph.
Engproc 111 00026 g013
Figure 14. Mean plot for impact strength.
Engproc 111 00026 g014
Figure 15. Residuals plots for tensile, flexural, and impact strength.
Engproc 111 00026 g015
Table 1. L9 orthogonal array used for DOE.
Experimental RunLayer Thickness (mm)Build OrientationExposure Time (sec)
10.1F7
20.1S13
30.1V14
40.125F13
50.125S14
60.125V7
70.15F14
80.15S7
90.15V13
Table 2. Tensile average strength.
Experimental Run123456789
Average Tensile Strength (MPa)31.3431.6133.6031.3632.4835.6531.1233.0731.57
Table 3. Percent contribution in tensile strength.
SourceDFSeq SSAdj SSAdj MSPercentage of Contribution
Layer Thickness20.17160.17160.0857914.23
Orientation20.56710.56710.2835347.03
Exposure Time20.34740.34740.1736928.8
Residual Error20.11960.11960.05981
Total81.2056
Table 4. Flexural average strength.
Experimental Run123456789
Average Flexural Strength (MPa)72.9473.1476.8872.4172.4076.2665.0170.3877.30
Table 5. Percent contribution in flexural strength.
ParametersDFSeq SSAdj SSAdj MSPercentage of Contribution
Layer Thickness (mm)20.31530.31530.1576418.367
Orientation21.02291.02290.5114359.588
Exposure Time (s)20.19640.19640.0981911.441
Residual Error20.18200.18200.09102
Total81.7166
Table 6. Impact average strength.
Experimental Run123456789
Average Impact Strength (J/m)23.5922.5524.3920.1418.6623.7516.4721.6623.625
Table 7. Percent contribution in impact strength.
ParametersDFSeq SSAdj SSAdj MSPercentage of Contribution
Layer Thickness22.76102.76101.380525.95
Orientation24.204.202.1039.48
Exposure Time23.15093.15091.575429.61
Residual Error20.52610.52610.2631
Total810.6379
Table 8. SN ratio validations.
TestsLayer Thickness (mm)Exposure Time (s)Strength
Tensile0.125735.73 (MPa)
Flexural0.101377.56 (MPa)
Impact0.10726.37 (J/m)
Table 9. Performance evaluation.
Tensile Data (MPa)Flexural Data (MPa)Impact Data (J/m)
Experimental RunExperimental ValueRegression ValueAbsolute Percent Deviation
( E V R V E V )
Experimental ValueRegression ValueAbsolute Percent DeviationExperimental ValueRegression ValueAbsolute Percent Deviation
131.3432.022.1672.9473.67123.61224.081.98
231.6131.590.06373.1476.614.7422.5524.528.73
333.60532.712.6676.8874.093.6224.3922.497.79
431.3632.162.5572.4175.584.3720.1421.536.9
532.4833.031.6972.472.830.5918.6619.323.53
635.6534.074.4376.2674.072.8723.7522.246.35
731.1231.130.03265.0169.46.7516.4718.5512.62
833.07533.912.5270.3872.312.7421.6622.85.26
931.5730.513.3577.372.46.3323.62520.9511.32
Average Strength32.42 72.96 21.65
Average Deviation 2.16 3.66 7.16
SN Validations
135.7334.074.677.5676.611.2226.3724.098.6
Disclaimer/Publisher’s Note: The statements, opinions and data contained in all publications are solely those of the individual author(s) and contributor(s) and not of MDPI and/or the editor(s). MDPI and/or the editor(s) disclaim responsibility for any injury to people or property resulting from any ideas, methods, instructions or products referred to in the content.