
Article

Life’s Essential 8 and Risk of Type 2 Diabetes in the Women’s Health Initiative †
by
Andrea J. Glenn
1,2,*,
Joseph C. Larson
3,
Ellie Hsu
1,
Hind A. Beydoun
4,5,
Michael J. LaMonte
6,
Lisa Warsinger Martin
7,
Anna C. Rivara
8,
Jean Wactawski-Wende
6,
Thomas E. Rohan
9,
Phyllis A. Richey
10,
Aladdin H. Shadyab
11,
Lauren Hale
12,
Su Yon Jung
13,
Cassandra N. Spracklen
14,
Mace Coday
10,
Thanh-Huyen T. Vu
15,
Eric T. Hyde
16,
Simin Liu
17,
JoAnn E. Manson
18,19 and
Lesley F. Tinker
3
1
Department of Nutrition and Food Studies, New York University, New York, NY 10003, USA
2
Department of Nutrition, Harvard T.H. Chan School of Public Health, Boston, MA 02115, USA
3
Division of Public Health Sciences, Fred Hutchinson Cancer Center, Seattle, WA 98109, USA
4
VA National Center on Homelessness Among Veterans, U.S. Department of Veterans Affairs, Washington, DC 20026, USA
5
Department of Management, Policy, and Community Health, School of Public Health, University of Texas Health Science Center at Houston, Houston, TX 77030, USA
6
Department of Epidemiology & Environmental Health, University at Buffalo—SUNY, Buffalo, NY 14214, USA
7
School of Medicine and Health Sciences, George Washington University, Washington, DC 20052, USA
8
Department of Social and Behavioral Sciences, Peter O’Donnell Jr. School of Public Health, University of Texas Southwestern Medical Center, Dallas, TX 753390, USA
9
Department of Epidemiology and Population Health, Albert Einstein College of Medicine, 1300 Morris Park Avenue, Bronx, NY 10461, USA
10
Department of Preventive Medicine, University of Tennessee Health Science Center, Memphis, TN 38163, USA
11
Herbert Wertheim School of Public Health and Human Longevity Science, University of California San Diego, La Jolla, CA 92093, USA
12
Program in Public Health, Department of Family, Population, and Preventive Medicine, Renaissance School of Medicine, Stony Brook University, Stony Brook, NY 11794, USA
13
Department of Epidemiology, School of Nursing, University of California Los Angeles, Los Angeles, CA 90095, USA
14
Department of Biostatistics and Epidemiology, University of Massachusetts Amherst, Amherst, MA 01002, USA
15
Department of Preventive Medicine, Northwestern University Feinberg School of Medicine, Chicago, IL 60611, USA
16
Division of Cancer Epidemiology and Genetics, National Cancer Institute, National Institutes of Health, Bethesda, MD 20892, USA
17
Department of Epidemiology and Biostatistics, Joe C. Wen School of Population & Public Health, University of California, Irvine, CA 92697, USA
18
Department of Medicine, Brigham and Women’s Hospital, Harvard Medical School, Boston, MA 02115, USA
19
Department of Epidemiology, Harvard T.H. Chan School of Public Health, Boston, MA 02115, USA
*
Author to whom correspondence should be addressed.
This paper is an extended version of our paper presented at the American Heart Association Epi Lifestyle Scientific Sessions, Boston, MA, USA, 17–20 March 2026.
Diabetology 2026, 7(5), 92; https://doi.org/10.3390/diabetology7050092
Submission received: 22 February 2026 / Revised: 31 March 2026 / Accepted: 23 April 2026 / Published: 6 May 2026

Abstract

Objective: To examine the association between Life Essential 8 (LE8) and incident T2D in the Women’s Health Initiative (WHI), and to assess whether associations varied by race and ethnicity. Research Design and Methods: Prospective cohort study of 19,403 postmenopausal women enrolled in the WHI without T2D at baseline. Data were analyzed from 1993 through 2024. The LE8 score (range, 0–100), comprising blood glucose, blood lipids, blood pressure, smoking, physical activity, diet, sleep, and body mass index (BMI), categorized as high (80–100), moderate (50–79), and low (0–49) according to AHA definitions. Incident treated T2D was self-reported during follow-up. Cox proportional hazards models estimated hazard ratios (HRs) and 95% CIs for LE8 categories and continuous scores. Results: During a mean follow-up of 16.3 years, 3921 women developed T2D. Compared with the lowest category, women in the highest LE8 category had a 57% lower risk of T2D (HR, 0.43; 95% CI, 0.38–0.49). A 20-point increase in LE8 score was associated with a 43% lower risk (HR, 0.57; 95% CI, 0.54–0.60). Among individual domains, BMI and glucose were most strongly associated with T2D. Subgroup analyses by 20-point increase in LE8 showed greater risk reduction among Hispanic/Latina women (HR, 0.46; 95% CI, 0.41–0.53) compared with non-Hispanic women (HR, 0.58; 95% CI, 0.55–0.62), but no significant association with race was observed. Conclusions: Higher LE8 scores are associated with a reduced risk of T2D in postmenopausal women, supporting LE8 as a useful framework for lifestyle-based diabetes prevention strategies.

1. Introduction

Diabetes affects 38.1 million U.S. adults (14.7%) and approximately 589 million adults worldwide (11.1%) [1,2]. According to the International Diabetes Federation, the global burden is projected to increase by 46%, reaching 853 million by 2050 [2]. Type 2 diabetes (T2D) accounts for more than 90% of all diabetes cases, with lifestyle factors serving as key contributors to its rising prevalence [2]. Cardiovascular disease (CVD) is the also leading cause of death among individuals living with diabetes, highlighting the importance of lifestyle factors for CVD prevention [3]. Furthermore, T2D is becoming more prevalent in individuals over 65 years of age, particularly in postmenopausal women, where the decrease in estrogen may increase insulin resistance and overall T2D risk [4]. T2D in older adults is linked to higher mortality, reduced functional status, and increased risk of institutionalization [5,6]. Racial and ethnic disparities also persist, with Hispanic/Latino and African American adults disproportionately experiencing both lower LE8 scores and higher prevalence of T2D compared to White adults [7,8].
In 2022, the American Heart Association updated Life’s Simple 7 (LS7) to better reflect lifestyle factors that can impact cardiovascular health [9]. The updated version, now called Life’s Essential 8 (LE8), added sleep duration health [10,11], defined as 7–9 h of sleep per night for adults, to the previously included components of diet [12,13], physical activity [14], body mass index (BMI) [15,16], smoking [17], blood lipids [18], blood glucose [19], and blood pressure [20]. Sleep duration health was added to create the LE8 as both too much and too little sleep have been shown to be associated with increased risk of CVD [21]. Too little sleep has also been associated with an increased risk of T2D [10,11]. Higher scores on the LE8, indicating healthier lifestyles, have been associated with a lower risk of chronic diseases, including CVD, chronic kidney disease, and mortality in several prospective cohort studies, although its association with T2D, has not been assessed [22,23,24,25]. Previous research has, however, shown that 91% of T2D cases can be attributed to inadequate exercise, a poor diet, current smoking, and alcohol consumption [26], highlighting the importance of these lifestyle factors in overall population health.
Therefore, the objective of this study was to evaluate the association of the LE8 with incident T2D in older postmenopausal women from the Women’s Health Initiative (WHI). Given the WHI’s more diverse population compared to previous studies [26], we further examined possible differences in risk by self-identified race and ethnicity.

2. Methods

2.1. Study Population

The WHI includes 161,808 postmenopausal women, aged 50–79 years, who were enrolled at more than 40 US clinical centers between 1993 and 1998 into one of three clinical trials (CT) or an observational study (OS). The design, recruitment, and baseline data collection were previously reported [27,28,29]. Written informed consent was obtained from all participants, and procedures were approved by institutional review boards at all participating institutions (Women’s Health Initiative—Clinical Coordinating Center. IR File #: FHIRB0003467. Approval Dates: 27 May 1992 (Initial IRB Approval)—27 May 2026). For the main LE8 analysis, we excluded participants who had missing data on diet, physical activity, smoking, sleep duration, and/or BMI (n = 11,288); those with a history of CVD (n = 28,028), history of cancer (n = 11,609), and/or a history of treated diabetes (n = 3992); those with a blood glucose ≥ 126 mg/dL at baseline (n = 1510); those with energy intake <600 or >5000 kcal/day (n = 2822); and those with no follow-up post enrollment (n = 477), missing covariate data (n = 2813), or missing blood lipid, blood glucose and blood pressure data (n = 79,866), leaving n = 19,403 for the LE8 analysis. We also examined five of the lifestyle factors from the LE8, “LE5” (diet, physical activity, smoking, sleep duration, BMI), that were available in a larger population of the cohort (n = 99,269) (Figure S1).

2.2. LE8 Assessment

The primary exposure was defined by the AHA LE8 measured at baseline [9]. The definitions, scoring criteria, and WHI variables used for each LE8 metric are described in Table S1. The LE8 score includes BMI, blood glucose, blood lipids (non-HDL-C), blood pressure, smoking, physical activity (PA), diet, and sleep duration. Each metric was scored on a scale of 0 to 100, with higher scores indicating more optimal levels and a healthier lifestyle, summed, and then divided by eight to provide an overall LE8 score (range, 0–100). The LE5 was divided by five. For behavioral metrics, diet was assessed using the HEI-2015 and scored according to percentile rankings (e.g., ≥95th percentile = 100; ≤25th percentile = 0). Physical activity was based on weekly minutes of moderate-to-vigorous activity (e.g., ≥150 min = 100; 0 min = 0). Smoking status was categorized as never (100), former (50), or current (0). Sleep was scored based on average nightly duration, with 7–9 h assigned the highest score (100) and shorter or longer durations assigned lower scores (e.g., <6 or ≥10 h = 40). Clinical metrics were scored using established thresholds. Individual metric scores were summed, and then divided by eight to provide an overall LE8 score (range, 0–100). The LE5 was divided by five. Consistent with the AHA definitions, we categorized LE8 and LE5 scores as high (80 to 100), moderate (50 to 79), or low (0 to 49) [9]. LE8 and LE5 sub-scores were calculated separately for each individual component.
Responses from self-reported questionnaires completed at enrollment were used to collect data on smoking status, recreational PA, and sleep health [30]. Dietary intake assessed by the WHI food frequency questionnaire was used to calculate the 2015 Healthy Eating Index (HEI-2015) score (range, 0 to 100), which measures overall dietary quality [31]. BMI (kg/m2), calculated from weight and height measurements, and blood pressure were assessed during in-person clinic visits using standard protocols. Data on fasting lipids and blood glucose were obtained from the biomarker sub-studies. Self-reported use of antihypertensive and cholesterol-lowering medication was also used in the scoring system.

2.3. Ascertainment of Type 2 Diabetes

The outcome of interest was incident T2D which was ascertained by self-report of physician-diagnosed diabetes treated with oral medication or insulin at the semiannual (WHI CT) or annual (WHI OS) contacts [32,33]. Validation studies of self-reported diabetes with the use of both medical records and biomarkers indicated high accuracy and reliability [34]. Time to diabetes was defined as the number of days from enrollment to the return of the questionnaire in which diabetes was first reported. The follow-up time for incident T2D was through 17 February 2024.

2.4. Covariate Assessment

Covariates were based on information collected from self-administered questionnaires completed at baseline, including age, region in the U.S, self-identified race and ethnicity, alcohol intake, personal history of hypertension and high cholesterol, family history of diabetes and CVD, education, marital status, and CT/study arm. Detailed descriptions of the validity and reproducibility of baseline measurements have previously been published [28].

2.5. Statistical Analysis

Baseline demographic characteristics, including the individual LE8 metrics, were tabulated following stratification by the three LE8 categories: low (<60), moderate (60 to <80), and high (≥80). Continuous variables were presented as means (standard deviations) and categorical variables were presented as percentages. We examined the LE5 using the same three categories. The lowest categories of LE8 and LE5, representing less healthy lifestyles, served as the reference group. For the primary analysis, we used Cox proportional hazard models to estimate hazard ratios (HRs) and 95% CIs for the association between LE8 and LE5 categories and incident T2D. Three multivariable models were used, and all models were stratified by WHI CT or OS, diet modification trial arm, and study period (WHI, extension 1, extension 2). Model 1 included adjustment for age (continuous), race (American Indian/Alaska Native, Asian/Pacific Islander, Black, White, more than one race, Unknown), ethnicity (Not Hispanic, Hispanic, Unknown), education (≤high school/GED, school after high school, ≥college degree), region (Northeast, South, Midwest, West), and marital status (presently married, other). Model 2 included model 1 adjustments plus family history of diabetes (yes, no), family history of CVD (yes, no, unknown), alcohol drinks/week (<1, 1–<7, ≥7), postmenopausal hormone use (never, past, current). Model 3, for LE5 only, included model 2 adjustments plus baseline treated hyperlipidemia (yes, no) and treated hypertension (yes, no). Tests for linear trend were conducted through assigning the median value to each category. We further examined associations with incident T2D per 20-point increase. Kaplan–Meier curves are presented to show treated diabetes incidence by LE5/LE8 groups over follow-up, with the events and number at risk presented at five-year intervals. We also assessed each LE8 and LE5 domain individually per 20 points, mutually adjusting for the other domains. We verified the proportional hazards model assumptions graphically as well as fitting an interaction term between LE8 and LE5 variables and follow-up time to verify proportionality. Using Schoenfeld residuals method, violations of the assumption were found as the LE8/LE5 groups converged at the tail end of follow-up. Therefore, we also conducted a sensitivity analysis based on different lengths of follow-up (10 years, 20 years, full follow-up).
We conducted several additional sensitivity and subgroup analyses. The sensitivity analyses included removing blood glucose from the LE8 metrics, excluding participants with blood glucose levels ≥ 100 mg/dL (pre-diabetes levels), and excluding women from the Dietary Modification Trial. In the subgroup analyses, we assessed associations between a 20-point increase in the LE8 and LE5 and incident T2D according to age (<60, 60–69, ≥70), race (American Indian/Alaskan Native, Asian/Pacific Islander, Black, White, more than once, unknown), ethnicity (Hispanic/Latina, Not Hispanic/Latina, unknown), and waist circumference (<31.5, ≥31.5 inches). The p for interaction was determined from a separate proportional hazards model with incident T2D as a function continuous LE8 or LE5, linear trend over subgroup of interest, and their interaction, with the same stratifications and adjustments. All statistical tests were two-sided, and p < 0.05 was considered statistically significant. Analyses were done in SAS for Windows v9.4. Kaplan–Meier plots were completed using R-Studio for Windows “Ghost Orchid”.

3. Results

3.1. LE8 Findings

Participant characteristics by the three LE8 categories are shown in Table 1. Overall, women with higher LE8 scores were more likely to have a higher education, be married, and have a lower BMI. There were 3921 cases of incident T2D reported over a mean follow-up of 16.3 (SD: 8.0) years in the 19,403 participants. Table S2 shows the characteristics of the primary LE8 analysis compared to the remaining WHI population. The LE8 sample was more racially and ethnically diverse and had a higher BMI, among other characteristics, compared to the larger WHI population. Figure S2 shows the distribution of the LE8 scores in the population. When comparing the high to low LE8 categories in the most adjusted model, we observed an inverse association with incident T2D (HR: 0.43 [95% CI 0.38, 0.49; p-trend < 0.001) (Table 2). In addition, a 20-point increase in the LE8 score was associated with a 43% lower risk of T2D (0.57 [0.54, 0.60]) (Table 2). We observed separation in the T2D Kaplan–Meier curves between LE8 groups throughout follow-up (Figure S2).

3.2. Individual LE8 Domains

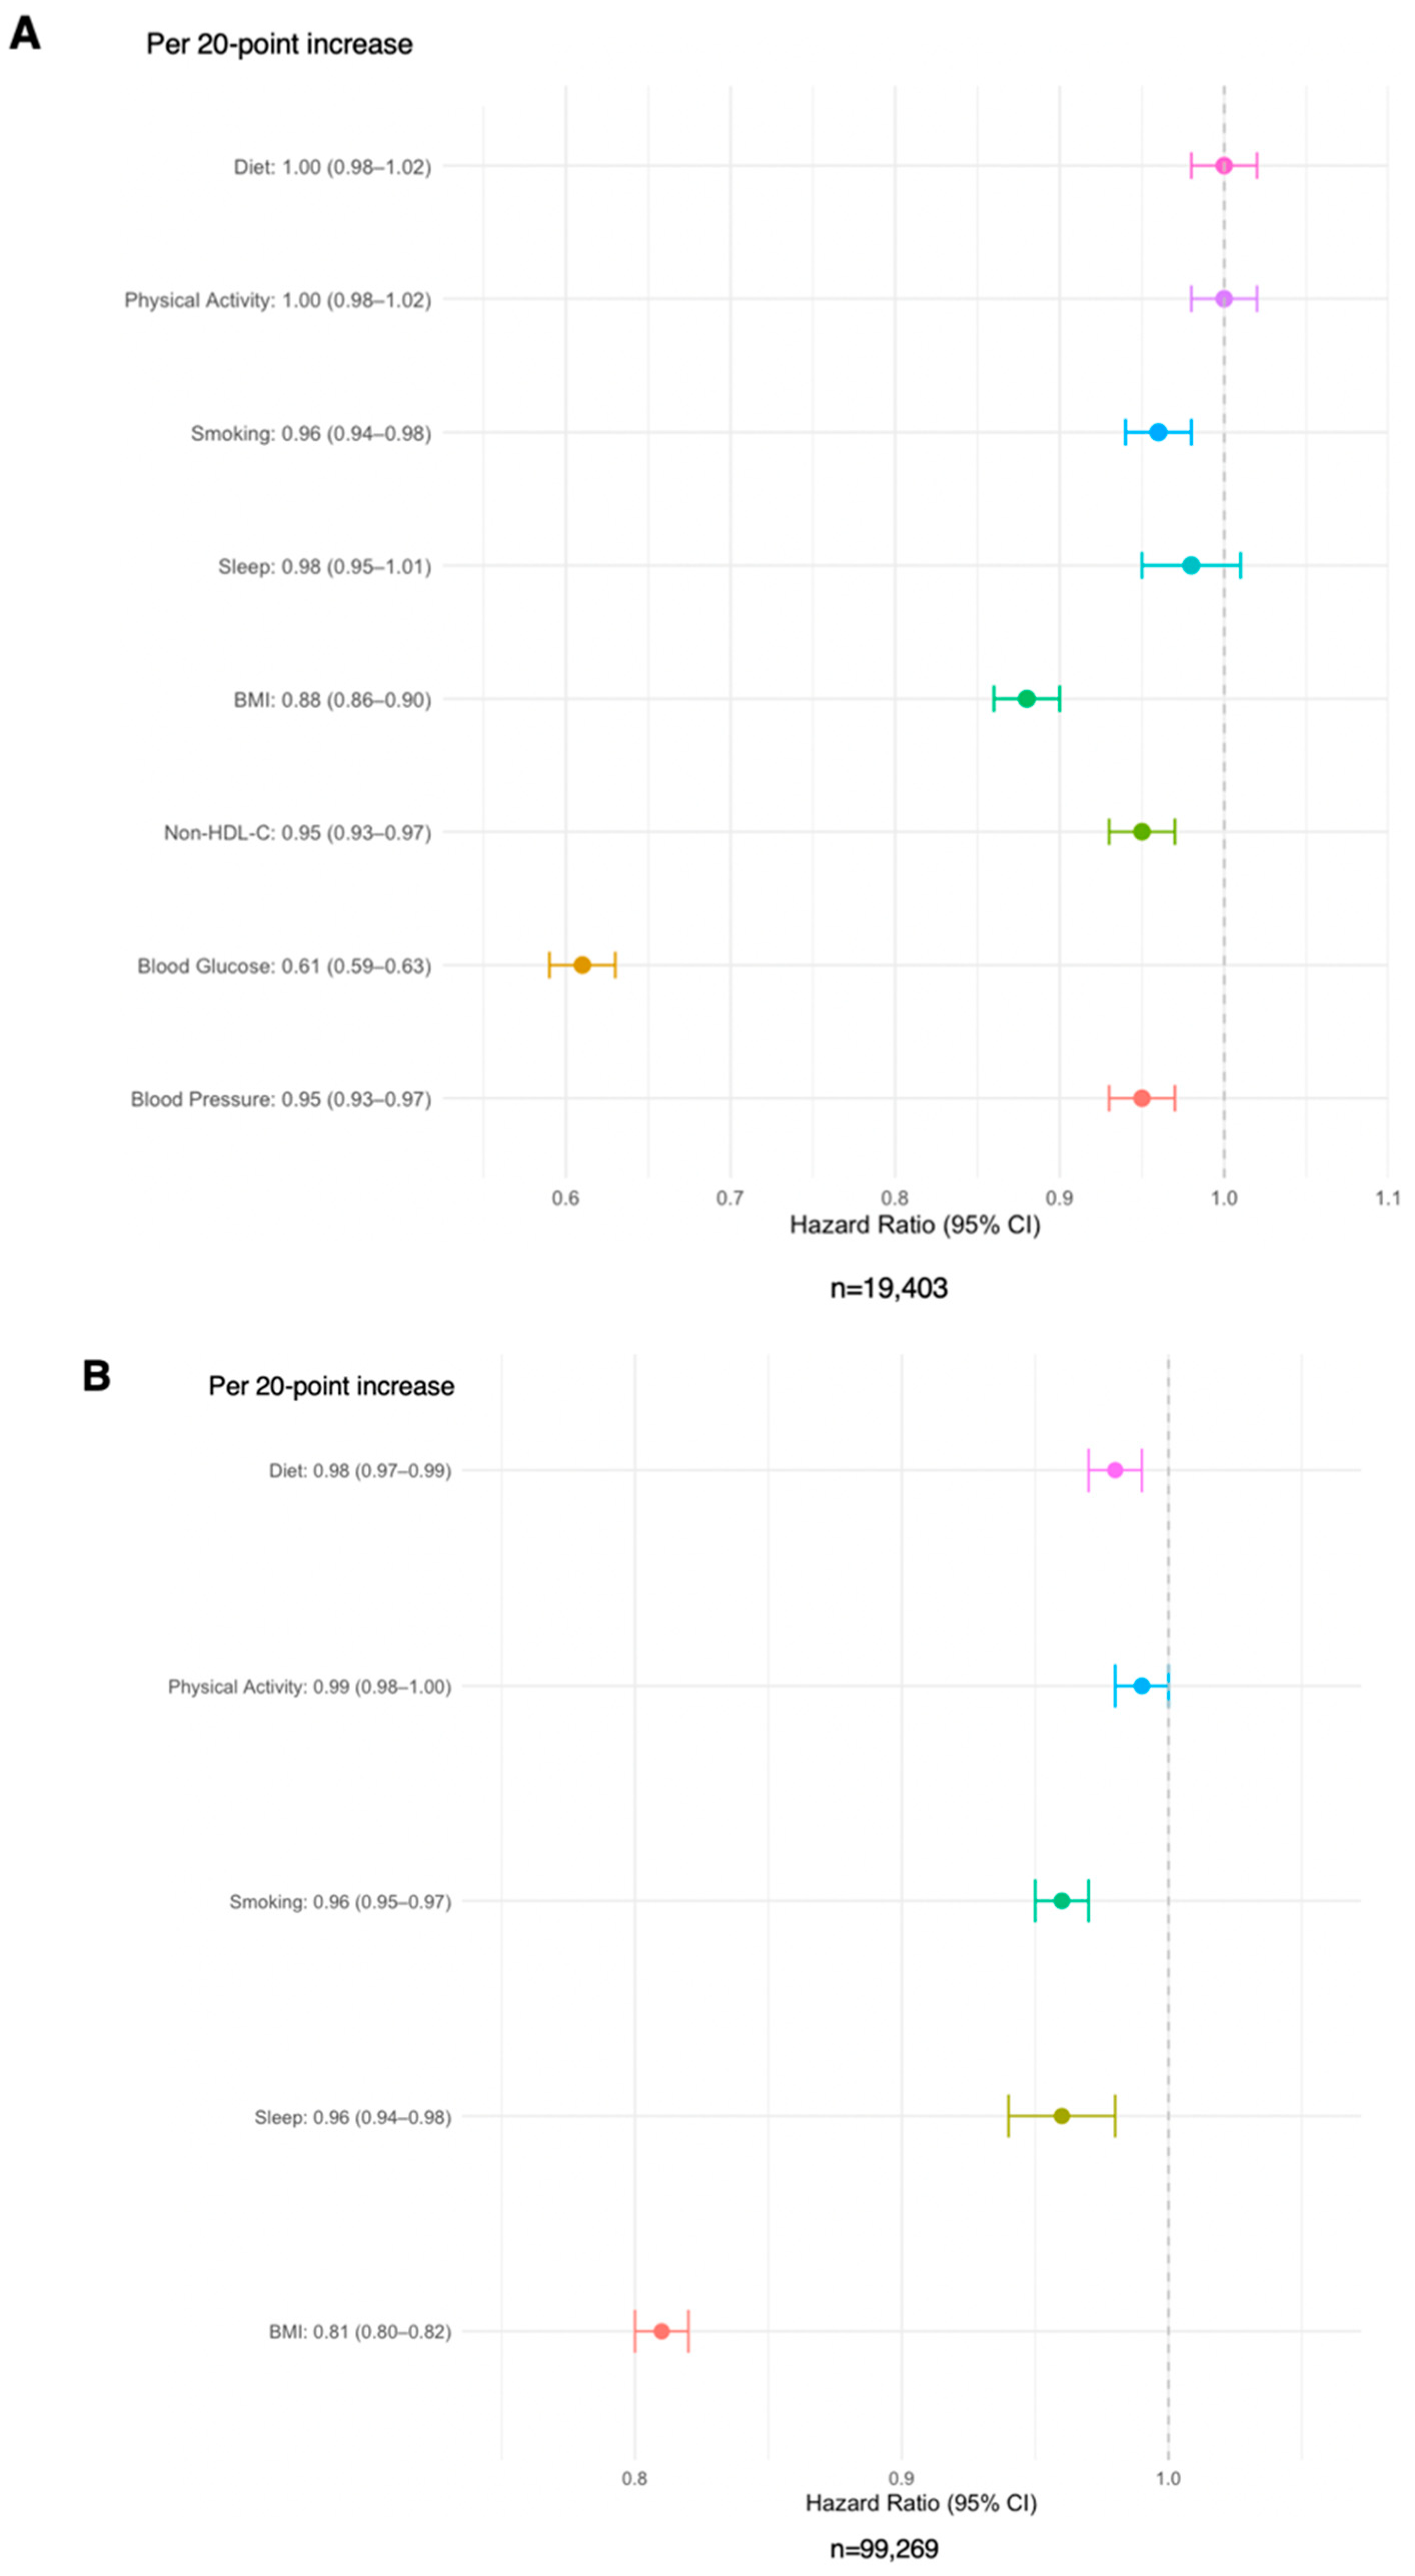
Figure 1A shows the association between the individual LE8 metrics with incident T2D by a 20-point increase in each domain. Glucose (0.61 [0.59, 0.63]), followed by BMI (0.88 [0.86, 0.90]), were most strongly associated with incident T2D. Smoking (0.96 [0.94, 0.98]), lipids (0.95 [0.93, 0.97]), and blood pressure (0.95 [0.93, 0.97]) domains were also associated with a lower risk of T2D, whereas diet, physical activity, and sleep domains were not significant.

3.3. LE8 Sensitivity Analyses

First, we assessed the association between the LE8 categories by follow-up time. Ten years of follow-up showed the lowest risk, comparing the high to low categories (0.24 [0.18, 0.32]; p-trend < 0.001), followed by 20 years (0.35 [0.29, 0.41]), compared to the full follow-up time of 29.3 years (Table S3); however, the associations were statistically significant at all time points, and patterns of decreasing risk with increasing LE8 score remained consistent. Next, we examined the LE8 excluding the blood glucose domain. Comparing the highest to lowest category, the results were attenuated but still significant (0.53 [0.45, 0.61]); p-trend < 0.001) (Table S3). We then excluded individuals with a glucose level ≥ 100 mg/dL at baseline (to exclude participants with pre-diabetes). Again, the results were attenuated but still significant, comparing the highest to the lowest LE8 category (0.60 [0.52, 0.70); p-trend < 0.001). Lastly, we excluded women from the Dietary Modification Trial, and the results were similar to the primary analysis (Table S3).
Figure 1. Association of individual LE8 and LE5 domains with incident treated diabetes. (A) LE8 population. (B) LE5 population. Hazard ratios, corresponding to 95% confidence intervals, and p-values from a proportional hazards model with incident treated diabetes as a function of all individual continuous LE8 and LE5 domains. All models are stratified within the model by the WHI study component (Clinical Trial/Observational Study), Dietary Modification Trial Arm (Intervention, Comparison, Not Randomized), and time-dependent WHI study period (WHI, Extension 1, Extension 2) and are adjusted for age, race/ethnicity, education, region, marital status, family history of diabetes, family history of CVD, alcohol use, estrogen use, and the other LE8/LE5 categories. LE5 models are additionally adjusted for hypertension and hyperlipidemia. BMI = body mass index.
Diabetology 07 00092 g001

3.4. LE8 Subgroup Analyses

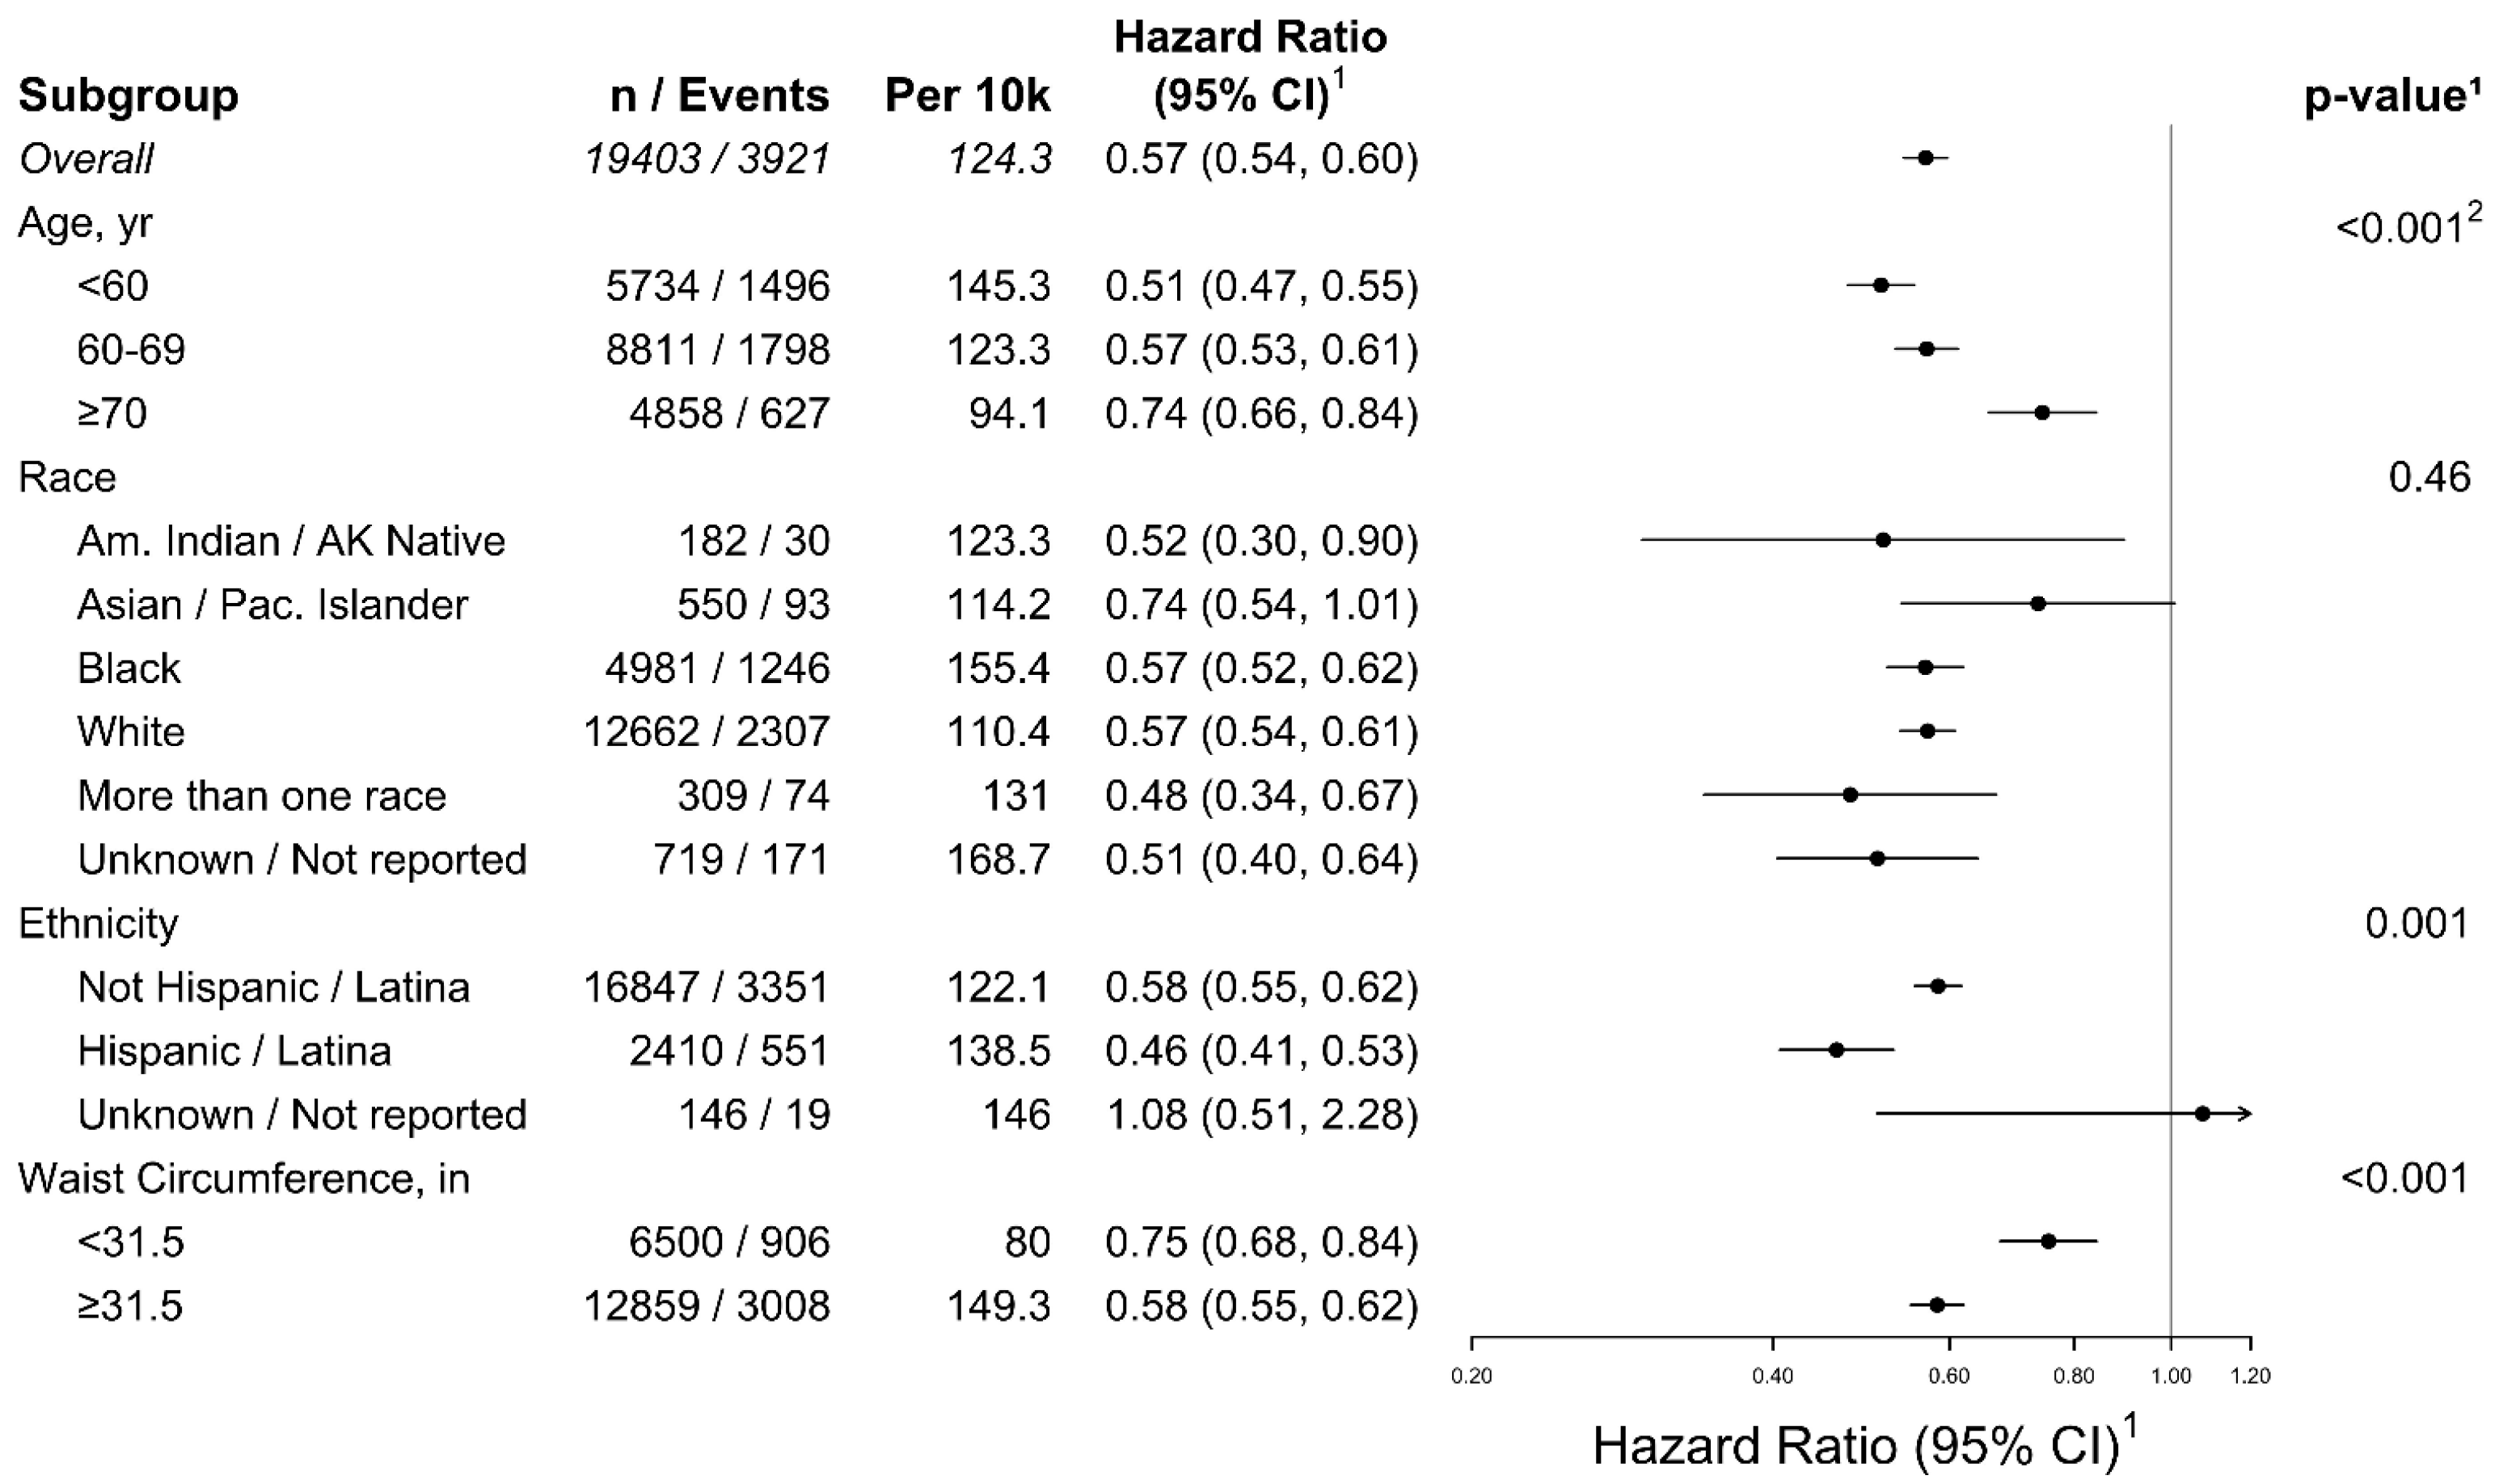
The results remained significant across each of the subgroups; however, there were significant interactions for age (p < 0.001), ethnicity (p = 0.001), and waist circumference (p < 0.001) (Figure 2). For age, youngest women (<60) had the lowest risk of T2D, with a 20-point increase in the LE8 (0.51 [0.47, 0.55]), followed by ages 60–69 (0.57 [0.53, 0.61]) and ≥70 years (0.74 [0.66, 0.84]). For ethnicity, Hispanic/Latina women (0.46 [0.41, 0.53]) had a greater risk reduction in T2D compared to non-Hispanic/Latina women (0.58 [0.55, 0.62]), for the 20-point increase in the LE8. Lastly, for waist circumference, those with ≥31.5 inches had the lowest risk with a 20-point increase in the LE8 (0.58 [0.55, 0.62), compared to those < 31.5 inches (0.75 [0.68, 0.84]) (Figure 2). p for interaction was not significant for race (p = 0.46)

3.5. LE5 Findings

Participant characteristics by the LE5 categories are shown in Table S4. Women with higher LE5 scores tended to be older, have more education, be married, and have a lower BMI, among other factors. In the 99,269 women included in the LE5 analysis, there were 17,602 cases reported of incident T2D over a mean follow-up of 16.9 (SD: 8.3) years. When comparing high to low LE5 categories in the most adjusted model, we observed an inverse association with incident T2D (0.60 [0.57, 0.63]; p-trend < 0.001) (Table 2). A 20-point increase in the LE5 was associated with a 26% lower risk of T2D (0.74 [0.73, 0.76]). We observed separation in the T2D Kaplan–Meier curves between LE5 groups throughout follow-up (Figure S3).
Figure 1B shows the association between the individual LE5 domains with incident T2D by a 20-point increase in each domain. BMI was most strongly associated with developing T2D (0.81 [0.80, 0.82]). The diet (0.98 [0.97, 0.99]), smoking (0.96 [0.95, 0.97]), and sleep domains (0.96 [0.94, 0.98]) were also significant, whereas physical activity (0.99 [0.98, 1.00]) was not significant. The sensitivity analysis by follow-up time was similar to the overall LE8 findings. Ten years of follow-up showed the lowest risk when comparing the high to low categories (0.44 [0.40, 0.48]; p-trend < 0.001), followed by 20 years (0.52 [0.49, 0.55]), compared to the full follow-up time of 29.3 years (Table S5); however, all time points were significant, and results remained consistent. In the subgroup analyses, similar patterns were observed to those in LE8 analyses. There were significant interactions for age (p < 0.001), ethnicity (p = 0.004), and waist circumference (p < 0.001) (Figure 2). For age, younger women (<60) also had the lowest risk of T2D for 20-point increase in the LE5 (0.71 [0.69, 0.73]), followed by ages 60–69 (0.75 [0.73, 0.77]), and ≥70 years (0.83 [0.79, 0.88]). For ethnicity, Hispanic/Latina women (0.66 [0.60, 0.71]) had a greater risk reduction in T2D compared to non-Hispanic/Latina women (0.75 [0.73, 0.76]), for a 20-point increase. Women with a waist circumference ≥ 31.5 inches had the lowest risk with a 20-point increase in the LE5 (0.79 [0.77, 0.81]), compared to <31.5 inches (0.94 [0.90, 0.97]) (Figure S4). p for interaction was not significant for race (p = 0.45).

4. Discussion

This study showed that higher LE8 scores were significantly associated with a reduced risk of incident T2D in postmenopausal women. Women in the highest LE8 category had a 57% lower risk of developing T2D compared to those in the lowest category. Additionally, each 20-point increase in the LE8 was also associated with a 43% reduction in T2D risk. Among the individual LE8 domains, normal fasting blood glucose and BMI were most strongly associated with lower T2D risk. In subgroup analyses, we observed that the association between LE8 and incident T2D varied significantly for age, waist circumference, and ethnicity, with Hispanic/Latina women experiencing a greater risk reduction than non-Hispanic/Latina women in the higher LE8 categories; however, the findings for the race subgroup were not significant. The LE8 was also more predictive of T2D risk compared to the LE5, even with the smaller sample size, highlighting the importance of tracking blood lipids, blood glucose, and blood pressure in an overall healthy lifestyle.
Previous research examining the association between the LE8 and the risk of T2D is limited. However, our findings are consistent with previous evidence supporting a strong inverse relationship between adherence to healthy lifestyle behaviors and T2D risk. A recent systematic review and meta-analysis reported an 80% reduction in T2D risk among individuals with the highest adherence to low-risk lifestyle behaviors compared to those with the lowest adherence [35]. These low-risk lifestyle behaviors included five factors: healthy body weight, healthy diet, regular physical activity, smoking abstinence or cessation, and light alcohol consumption. These behaviors overlap substantially with the LE8 health behaviors, except alcohol intake, which is not included in the LE8. As the LE8 incorporates additional metrics such as sleep health and physical measures (blood pressure) and metabolic biomarkers (blood levels of lipids and blood glucose), our study provides further insight into the role of overall lifestyle in T2D risk by considering a broader range of behavioral and clinical cardiovascular health metrics. Our findings also align with another meta-analysis that reported a strong inverse association between healthy lifestyle factors and incident T2D [36]. Researchers observed a 32% lower risk of T2D for each additional healthy lifestyle behavior, which supports a dose–response relationship consistent with the graded association we observed. While previous studies have generally observed a larger magnitude of risk reduction than we did [26,27,36,37], the consistent inverse association across various studies and populations supports the importance of lifestyle modification in T2D prevention.
Our findings examining the individual LE8 domains are also consistent with results from previous research. One study examined the association between adherence to LS7 and incident T2D among American Indians in the Strong Heart Family Study and also identified BMI and blood glucose as the strongest risk factors [37] and other cohort studies have identified healthy BMI as a key risk factor [26,37,38,39,40]. Additionally, a prospective cohort study that included sleep duration as a lifestyle factor found an additional reduction in T2D risk when a healthy sleep pattern was incorporated into their lifestyle score [38]. While we found a nonsignificant association between the sleep health domain and T2D risk in our LE8 sample, the sleep domain was significantly associated with lower T2D risk in the broader LE5 study population, potentially due to the larger sample size. An umbrella review on sleep also found that poor sleep quality was associated with an increased risk of T2D [10]. In addition to sleep quality, researchers observed a higher risk of T2D associated with short sleep duration, even among individuals following a healthy diet [11]. These findings emphasize the need for further research on the role of sleep health and its potential interactions with other lifestyle factors for T2D prevention. The larger sample size may also explain the discrepant results with the diet domain between the two study populations in our analysis.
Our observation that Hispanic/Latina women experienced the greatest T2D risk reduction with higher LE8 scores is an important finding given prior research demonstrating that Latino/Hispanic individuals tend to have lower LE8 domain scores for physical activity, BMI, and blood glucose compared to Non-Hispanic White individuals [8]. Furthermore, while we observed a stronger association among women younger at enrollment, the protective association remained significant across all age groups, suggesting that adoption of healthier lifestyle behaviors may be important for women at any age after 50 years. Similarly, the stronger association observed among women with higher waist circumference also highlights the importance of improving LE8 metrics for those already at elevated metabolic risk. These results suggest that targeted interventions in these populations could be beneficial.
The strengths of our study include its population-based prospective study design, the large racially and ethnically diverse sample of postmenopausal women, and long-term follow-up. The comprehensive evaluation of all LE8 metrics, including both health behaviors and health factors, along with multivariable adjustments for established T2D risk factors, also strengthens the validity of the findings. This study, however, has several limitations. The study population consisted of only postmenopausal women, which limits the generalizability of the results to other populations, such as men and younger adults. The LE8 analytic sample was also substantially smaller than the original WHI cohort, which may introduce selection bias and further limit generalizability. Additionally, many LE8 metrics, specifically diet, physical activity, smoking, and sleep duration, were self-reported, which may introduce recall bias and misclassification, measurement error. While T2D was measured through validated self-report methods [34], outcome misclassification is still possible and may lead to underestimation of true T2D incidence, as undiagnosed and untreated cases may not be captured. More accurate outcome ascertainment could be achieved by incorporating additional objective measures, such as HbA1c measurements, as well as medical record verification. Residual confounding also cannot be ruled out, given the observational nature of the study, particularly from covariates such as socioeconomic status, medication adherence, genetic predisposition, and environmental exposures. Since LE8 scores were only assessed at baseline, changes in lifestyle and clinical factors over the follow-up period may not be captured. The inclusion of blood glucose in the LE8 also represents a limitation, as it is directly linked to T2D risk. While sensitivity analyses excluding blood glucose remained statistically significant, the associations were attenuated, highlighting that part of the observed relationship was driven by blood glucose. Another limitation is the exclusion of alcohol consumption from the LE8 metrics. Although we adjusted for alcohol intake in our multivariable models, alcohol intake has been included in many previous studies assessing lifestyle and T2D risk [26,35,36,38,40], which may provide additional insight into the relationship between overall lifestyle and T2D risk. When assessing individual LE8 metrics, mutual adjustment for covariates that may lie on the causal pathway, such as hyperlipidemia and hypertension, may contribute to potential overadjustment and attenuated effect estimates. Future research should aim to examine these associations using objective exposure and outcome measurements, repeated assessments, and in more varied populations to strengthen causal inference and generalizability.

5. Conclusions

In this large, diverse cohort of postmenopausal women, higher LE8 scores were associated with lower risk of T2D. Blood glucose and BMI were the most strongly associated with T2D risk, emphasizing the importance of weight management and glycemic control in T2D prevention. The association between higher LE8 scores and lower T2D risk was also stronger among Hispanic/Latina women, highlighting a population that may particularly benefit from improvements in lifestyle and clinical factors. These findings support the LE8 as a practical framework for lifestyle-based risk assessment for T2D in aging women.

Supplementary Materials

The following supporting information can be downloaded at: https://www.mdpi.com/article/10.3390/diabetology7050092/s1, Figure S1. STROBE Diagram; Figure S2. Kaplan-Meier plot of Incident Treated Diabetes by LE8 Categories; Figure S3. Kaplan-Meier plot of Incident Treated Diabetes by LE5 Categories; Figure S4. Association of LE5 with incident treated diabetes by subgroups; Table S1. LE8 components; Table S2. Demographics by LE8 Data Availability; Table S3. Sensitivity analyses of the LE8 with incident treated diabetes; Table S4. Demographics Overall and by LE5 Categories; Table S5. Sensitivity analysis of the LE5: follow-up time; Supplemental Information: SHORT LIST OF WHI INVESTIGATORS.

Author Contributions

A.J.G., J.E.M. and L.F.T. designed the study. A.J.G. and E.H. wrote the first draft of the manuscript. J.C.L. conducted the statistical analysis. A.J.G. supervised the study, and all authors were responsible for acquisition, analysis, and interpretation of data and critical revision of the manuscript and approved the final version of the manuscript. A.J.G. and J.C.L. are the guarantors of this work and, as such, had full access to all the data in the study and take responsibility for the integrity of the data and the accuracy of the data analysis. All authors have read and agreed to the published version of the manuscript.

Funding

The WHI program is funded by the National Heart, Lung, and Blood Institute, National Institutes of Health (NIH), U.S. Department of Health and Human Services, through 75N92021D00001, 75N92021D00002, 75N92021D00003, and 75N92021D00004, 75N92021D00005. CNS was supported by the American Diabetes Association (11-22-JDFPM-06).

Institutional Review Board Statement

This study was approved by the Institutional Review Board for the Women’s Health Initiative—Clinical Coordinating Center under expedited review (Protocol ID: FHIRB0003467) as a study closed to accrual with interventions/interactions only. The IRB approval process complies with the ethical principles outlined in the Declaration of Helsinki. The initial approval was granted on 27 May 1992, and current approval extends through 27 May 2026, pending the next continuing review.

Informed Consent Statement

Written informed consent was obtained from all participants.

Data Availability Statement

The WHI data are accessible to researchers, and requests to access the data set may be sent to the WHI Publications and Presentations Committee. The analytic code used for the presented analyses will be made available up-on request.

Acknowledgments

The authors thank all participants, investigators, and staff from the WHI CTs and cohort for their invaluable contributions. The WHI investigator shortlist can be found in the Supplementary Material. During the preparation of this work, the authors used ChatGPT v5.5 for the purpose of editing the discussion/abstract to be more concise. Following the use of this tool/service, the authors formally reviewed the content for its accuracy and edited it as necessary. The authors take full responsibility for all the content of this publication.

Conflicts of Interest

A.J.G. has received research support from the Almond Board of California and the American Heart Association and travel funds/honorarium from the Good Food Institute and the American Diabetes Association. L.H. has received honoraria or consulting fees from the National Sleep Foundation, Children and Screens: Institute for Digital Media, Prosek, Hirezon, and is an expert witness in social media litigation, all outside the scope of this work. All other authors have no disclosures to report.

Disclaimer

This research was supported in part by the Intramural Research Program of the National Institutes of Health (NIH). The contributions of the NIH authors are considered Works of the United States Government. The findings and conclusions presented in this paper are those of the authors and do not necessarily reflect the views of the NIH or the U.S. Department of Health and Human Services. Dr. Hind A. Beydoun worked on this manuscript outside of her tour of duty in the US Department of Veterans Affairs.

References

  1. American Diabetes Association. Statistics About Diabetes. Available online: https://diabetes.org/about-diabetes/statistics/about-diabetes (accessed on 4 July 2025).
  2. International Diabetes Federation. IDF Diabetes Atlas, 11th ed.; International Diabetes Federation: Brussels, Belgium, 2025; Available online: https://diabetesatlas.org/ (accessed on 4 July 2025).
  3. Joseph, J.J.; Deedwania, P.; Acharya, T.; Aguilar, D.; Bhatt, D.L.; Chyun, D.A.; Di Palo, K.E.; Golden, S.H.; Sperling, L.S.; on behalf of the American Heart Association Diabetes Committee of the Council on Lifestyle and Cardiometabolic Health; et al. Comprehensive Management of Cardiovascular Risk Factors for Adults With Type 2 Diabetes: A Scientific Statement From the American Heart Association. Circulation 2022, 145, e722–e759. [Google Scholar] [CrossRef]
  4. De Paoli, M.; Zakharia, A.; Werstuck, G.H. The Role of Estrogen in Insulin Resistance: A Review of Clinical and Preclinical Data. Am. J. Pathol. 2021, 191, 1490–1498. [Google Scholar] [CrossRef]
  5. Kirkman, M.S.; Briscoe, V.J.; Clark, N.; Florez, H.; Haas, L.B.; Halter, J.B.; Huang, E.S.; Korytkowski, M.T.; Munshi, M.N.; Odegard, P.S.; et al. Diabetes in older adults. Diabetes Care 2012, 35, 2650–2664. [Google Scholar] [CrossRef]
  6. Brown, A.F.; Mangione, C.M.; Saliba, D.; Sarkisian, C.A.; California Healthcare Foundation/American Geriatrics Society Panel on Improving Care for Elders with Diabetes. Guidelines for improving the care of the older person with diabetes mellitus. J. Am. Geriatr. Soc. 2003, 51, S265–S280. [Google Scholar] [CrossRef]
  7. Rodriguez, J.E.; Campbell, K.M. Racial and Ethnic Disparities in Prevalence and Care of Patients With Type 2 Diabetes. Clin. Diabetes 2017, 35, 66–70. [Google Scholar] [CrossRef] [PubMed]
  8. Yang, H.; Huang, C.; Sawano, M.; Herrin, J.; Faridi, K.F.; Li, Z.; Spatz, E.; Krumholz, H.M.; Lu, Y. Trends and Key Factors Associated With Racial and Ethnic Differences in Life’s Essential 8 Scores. JAMA Netw. Open 2025, 8, e2516663. [Google Scholar] [CrossRef]
  9. Lloyd-Jones, D.M.; Allen, N.B.; Anderson, C.A.M.; Black, T.; Brewer, L.C.; Foraker, R.E.; Grandner, M.A.; Lavretsky, H.; Perak, A.M.; Sharma, G.; et al. Life’s Essential 8: Updating and Enhancing the American Heart Association’s Construct of Cardiovascular Health: A Presidential Advisory From the American Heart Association. Circulation 2022, 146, e18–e43. [Google Scholar] [CrossRef]
  10. Gao, C.; Guo, J.; Gong, T.T.; Lv, J.-L.; Li, X.-Y.; Liu, F.-H.; Zhang, M.; Shan, Y.-T.; Zhao, Y.-H.; Wu, Q.-J. Sleep Duration/Quality With Health Outcomes: An Umbrella Review of Meta-Analyses of Prospective Studies. Front. Med. 2021, 8, 813943. [Google Scholar] [CrossRef] [PubMed]
  11. Noga, D.A.; Meth, E.; Pacheco, A.P.; Tan, X.; Cedernaes, J.; van Egmond, L.T.; Xue, P.; Benedict, C. Habitual Short Sleep Duration, Diet, and Development of Type 2 Diabetes in Adults. JAMA Netw. Open 2024, 7, e241147. [Google Scholar] [CrossRef] [PubMed]
  12. Cespedes, E.M.; Hu, F.B.; Tinker, L.; Rosner, B.; Redline, S.; Garcia, L.; Hingle, M.; Van Horn, L.; Howard, B.V.; Levitan, E.B.; et al. Multiple Healthful Dietary Patterns and Type 2 Diabetes in the Women’s Health Initiative. Am. J. Epidemiol. 2016, 183, 622–633. [Google Scholar] [CrossRef]
  13. Glenn, A.J.; Li, J.; Lo, K.; Jenkins, D.J.; Boucher, B.A.; Hanley, A.J.; Kendall, C.W.; Shadyab, A.H.; Tinker, L.F.; Chessler, S.D.; et al. The Portfolio Diet and Incident Type 2 Diabetes: Findings From the Women’s Health Initiative Prospective Cohort Study. Diabetes Care 2023, 46, 28–37. [Google Scholar] [CrossRef] [PubMed]
  14. Folsom, A.R.; Kushi, L.H.; Hong, C.P. Physical activity and incident diabetes mellitus in postmenopausal women. Am. J. Public Health 2000, 90, 134–138. [Google Scholar] [CrossRef]
  15. Diabetes Prevention Program Research Group; Knowler, W.C.; Fowler, S.E.; Hamman, R.F.; Christophi, C.A.; Hoffman, H.J.; Brenneman, A.T.; rown-Friday, J.O.; Goldberg, R.; Venditti, E.; et al. 10-year follow-up of diabetes incidence and weight loss in the Diabetes Prevention Program Outcomes Study. Lancet 2009, 374, 1677–1686. [Google Scholar] [CrossRef]
  16. Yu, H.J.; Ho, M.; Liu, X.; Yang, J.; Chau, P.H.; Fong, D.Y.T. Association of weight status and the risks of diabetes in adults: A systematic review and meta-analysis of prospective cohort studies. Int. J. Obes. 2022, 46, 1101–1113. [Google Scholar] [CrossRef]
  17. Luo, J.; Rossouw, J.; Tong, E.; Giovino, G.A.; Lee, C.C.; Chen, C.; Ockene, J.K.; Qi, L.; Margolis, K.L. Smoking and diabetes: Does the increased risk ever go away? Am. J. Epidemiol. 2013, 178, 937–945. [Google Scholar] [CrossRef]
  18. Peng, J.; Zhao, F.; Yang, X.; Pan, X.; Xin, J.; Wu, M.; Peng, Y.G. Association between dyslipidemia and risk of type 2 diabetes mellitus in middle-aged and older Chinese adults: A secondary analysis of a nationwide cohort. BMJ Open 2021, 11, e042821. [Google Scholar] [CrossRef] [PubMed]
  19. Nichols, G.A.; Hillier, T.A.; Brown, J.B. Normal fasting plasma glucose and risk of type 2 diabetes diagnosis. Am. J. Med. 2008, 121, 519–524. [Google Scholar] [CrossRef] [PubMed]
  20. Aikens, R.C.; Zhao, W.; Saleheen, D.; Reilly, M.P.; Epstein, S.E.; Tikkanen, E.; Salomaa, V.; Voight, B.F. Systolic Blood Pressure and Risk of Type 2 Diabetes: A Mendelian Randomization Study. Diabetes 2017, 66, 543–550. [Google Scholar] [CrossRef]
  21. Yang, X.; Chen, H.; Li, S.; Pan, L.; Jia, C. Association of Sleep Duration with the Morbidity and Mortality of Coronary Artery Disease: A Meta-analysis of Prospective Studies. Heart Lung Circ. 2015, 24, 1180–1190. [Google Scholar] [CrossRef]
  22. Sun, J.; Li, Y.; Zhao, M.; Yu, X.; Zhang, C.; Magnussen, C.G.; Xi, B. Association of the American Heart Association’s new “Life’s Essential 8” with all-cause and cardiovascular disease-specific mortality: Prospective cohort study. BMC Med. 2023, 21, 116. [Google Scholar] [CrossRef]
  23. Ren, Y.; Cai, Z.; Guo, C.; Zhang, Y.; Xu, H.; Liu, L.; Wang, L.; Ba, Y.; Liu, S.; Zhang, G.; et al. Associations Between Life’s Essential 8 and Chronic Kidney Disease. J. Am. Heart Assoc. 2023, 12, e030564. [Google Scholar] [CrossRef]
  24. Petermann-Rocha, F.; Deo, S.; Celis-Morales, C.; Ho, F.K.; Bahuguna, P.; McAllister, D.; Sattar, N.; Pell, J.P. An Opportunity for Prevention: Associations Between the Life’s Essential 8 Score and Cardiovascular Incidence Using Prospective Data from UK Biobank. Curr. Probl. Cardiol. 2023, 48, 101540. [Google Scholar] [CrossRef] [PubMed]
  25. Isiozor, N.M.; Kunutsor, S.K.; Voutilainen, A.; Laukkanen, J.A. Life’s Essential 8 and the risk of cardiovascular disease death and all-cause mortality in Finnish men. Eur. J. Prev. Cardiol. 2023, 30, 658–667. [Google Scholar] [CrossRef]
  26. Hu, F.B.; Manson, J.E.; Stampfer, M.J.; Colditz, G.; Liu, S.; Solomon, C.G.; Willett, W.C. Diet, lifestyle, and the risk of type 2 diabetes mellitus in women. N. Engl. J. Med. 2001, 345, 790–797. [Google Scholar] [CrossRef]
  27. The Women’s Health Initiative Study Group. Design of the Women’s Health Initiative clinical trial and observational study. Control. Clin. Trials 1998, 19, 61–109. [Google Scholar] [CrossRef]
  28. Langer, R.D.; White, E.; Lewis, C.E.; Kotchen, J.M.; Hendrix, S.L.; Trevisan, M. The Women’s Health Initiative Observational Study: Baseline characteristics of participants and reliability of baseline measures. Ann. Epidemiol. 2003, 13, S107–S121. [Google Scholar] [CrossRef]
  29. Hays, J.; Hunt, J.R.; Hubbell, F.A.; Anderson, G.L.; Limacher, M.; Allen, C.; E Rossouw, J. The Women’s Health Initiative recruitment methods and results. Ann. Epidemiol. 2003, 13, S18–S77. [Google Scholar] [CrossRef]
  30. LaMonte, M.J. Physical Activity and Heart Failure: Taking Steps to Control a Major Public Health Burden. Am. J. Lifestyle Med. 2020, 14, 555–570. [Google Scholar] [CrossRef] [PubMed]
  31. Krebs-Smith, S.M.; Pannucci, T.E.; Subar, A.F.; Kirkpatrick, S.I.; Lerman, J.L.; Tooze, J.A.; Wilson, M.M.; Reedy, J. Update of the Healthy Eating Index: HEI-2015. J. Acad. Nutr. Diet. 2018, 118, 1591–1602. [Google Scholar] [CrossRef]
  32. de Boer, I.H.; Tinker, L.F.; Connelly, S.; Curb, J.D.; Howard, B.V.; Kestenbaum, B.; Larson, J.C.; Manson, J.E.; Margolis, K.L.; Siscovick, D.S.; et al. Calcium plus vitamin D supplementation and the risk of incident diabetes in the Women’s Health Initiative. Diabetes Care 2008, 31, 701–707. [Google Scholar] [CrossRef] [PubMed]
  33. Tinker, L.F.; Bonds, D.E.; Margolis, K.L.; Manson, J.E.; Howard, B.V.; Larson, J.; Perri, M.G.; Beresford, S.A.A.; Robinson, J.G.; Rodríguez, B.; et al. Low-fat dietary pattern and risk of treated diabetes mellitus in postmenopausal women: The Women’s Health Initiative randomized controlled dietary modification trial. Arch. Intern. Med. 2008, 168, 1500–1511. [Google Scholar] [CrossRef] [PubMed]
  34. Margolis, K.L.; Lihong, Q.; Brzyski, R.; E Bonds, D.; Howard, B.V.; Kempainen, S.; Liu, S.; Robinson, J.G.; Safford, M.M.; Tinker, L.T.; et al. Validity of diabetes self-reports in the Women’s Health Initiative: Comparison with medication inventories and fasting glucose measurements. Clin. Trials 2008, 5, 240–247. [Google Scholar] [CrossRef]
  35. Khan, T.A.; Field, D.; Chen, V.; Ahmad, S.; Mejia, S.B.; Kahleová, H.; Rahelić, D.; Salas-Salvadó, J.; Leiter, L.A.; Uusitupa, M.; et al. Combination of Multiple Low-Risk Lifestyle Behaviors and Incident Type 2 Diabetes: A Systematic Review and Dose-Response Meta-analysis of Prospective Cohort Studies. Diabetes Care 2023, 46, 643–656. [Google Scholar] [CrossRef]
  36. Schlesinger, S.; Neuenschwander, M.; Ballon, A.; Nothlings, U.; Barbaresko, J. Adherence to healthy lifestyles and incidence of diabetes and mortality among individuals with diabetes: A systematic review and meta-analysis of prospective studies. J. Epidemiol. Community Health 2020, 74, 481–487. [Google Scholar] [CrossRef]
  37. Fretts, A.M.; Howard, B.V.; McKnight, B.; Duncan, G.E.; Beresford, S.A.; Mete, M.; Zhang, Y.; Siscovick, D.S. Life’s Simple 7 and incidence of diabetes among American Indians: The Strong Heart Family Study. Diabetes Care 2014, 37, 2240–2245. [Google Scholar] [CrossRef]
  38. Song, Z.; Yang, R.; Wang, W.; Huang, N.; Zhuang, Z.; Han, Y.; Qi, L.; Xu, M.; Tang, Y.-D.; Huang, T. Association of healthy lifestyle including a healthy sleep pattern with incident type 2 diabetes mellitus among individuals with hypertension. Cardiovasc. Diabetol. 2021, 20, 239. [Google Scholar] [CrossRef] [PubMed]
  39. Yu, Y.; Sun, Y.; Yu, Y.; Wang, Y.; Chen, C.; Tan, X.; Lu, Y.; Wang, N. Life’s Essential 8 and risk of non-communicable chronic diseases: Outcome-wide analyses. Chin. Med. J. 2024, 137, 1553–1562. [Google Scholar] [CrossRef] [PubMed]
  40. Reis, J.P.; Loria, C.M.; Sorlie, P.D.; Park, Y.; Hollenbeck, A.; Schatzkin, A. Lifestyle factors and risk for new-onset diabetes: A population-based cohort study. Ann. Intern. Med. 2011, 155, 292–299. [Google Scholar] [CrossRef]
Figure 2. Association of LE8 with incident treated diabetes by subgroups. 1 Hazard Ratios for a 20 point increase and corresponding interaction p-values from a proportional hazards model with incident treated diabetes as a function of continuous LE8, the subgroup of interest, and their interaction. All models are stratified within the model by WHI study component (Clinical Trial/Observational Study), Dietary Modification Trial Arm (Intervention, Comparison, Not Randomized), and time-dependent WHI study period (WHI, Extension 1, Extension 2) and are adjusted for age, race/ethnicity, education, region, marital status, family history of diabetes, family history of CVD, alcohol use, and estrogen use. 2 Interaction p-value from a separate proportional hazards model with incident treated diabetes as a function continuous LE8, linear trend over subgroup of interest, and their interaction, with the same stratifications and adjustments. CI = confidence intervals.
Diabetology 07 00092 g002
Table 1. Demographics Overall and by LE8 Categories.
Low (<50)Moderate (50–79)High (≥80)
n = 19,403n = 9203n = 8434n = 1766
Characteristic
   Total LE860.7 (13.7)48.9 (7.6)68.4 (5.5)84.9 (4.2)
       Diet35.8 (32.5)21.2 (26.1)44.8 (31.5)68.7 (26.6)
       Physical Activity43.6 (43.1)20.2 (33.1)59.5 (41.2)89.6 (21.8)
       Smoking72.3 (32.2)64.4 (34.9)77.9 (28.3)87.3 (22.5)
       Sleep Duration83.9 (20.4)79.1 (22.1)87.3 (18.1)92.4 (14.7)
       Body Mass Index63.1 (31.9)47.3 (30.8)74.4 (26.2)91.5 (15.4)
       Lipids42.3 (29.9)33.1 (26.7)47.2 (29.4)66.7 (29.1)
       Diabetes/Glucose90.1 (17.3)85.1 (19.4)93.8 (14.5)98.4 (8.0)
       Blood Pressure54.6 (34.1)41.6 (31.4)62.6 (32.5)84.6 (23.2)
   Age, mean (SD)64.0 (7.3)63.8 (7.2)64.4 (7.4)63.4 (7.4)
       <605734 (29.6)2796 (30.4)2357 (27.9)581 (32.9)
       60–698811 (45.4)4254 (46.2)3778 (44.8)779 (44.1)
       ≥704858 (25.0)2153 (23.4)2299 (27.3)406 (23.0)
   Race, n (%)
       Am. Indian/AK Native182 (0.9)92 (1.0)71 (0.8)19 (1.1)
       Asian/Pac. Islander550 (2.8)180 (2.0)309 (3.7)61 (3.5)
       Black4981 (25.7)2946 (32.0)1782 (21.1)253 (14.3)
       White12,662 (65.3)5470 (59.4)5847 (69.3)1345 (76.2)
       More than one race309 (1.6)162 (1.8)120 (1.4)27 (1.5)
       Unknown/Not reported719 (3.7)353 (3.8)305 (3.6)61 (3.5)
   Ethnicity, n (%)
       Not Hispanic/Latina16,847 (86.8)7994 (86.9)7322 (86.8)1531 (86.7)
       Hispanic/Latina2410 (12.4)1149 (12.5)1039 (12.3)222 (12.6)
       Unknown/Not reported146 (0.8)60 (0.7)73 (0.9)13 (0.7)
   US Region, n (%)
       Northeast4075 (21.0)2103 (22.9)1667 (19.8)305 (17.3)
       South5794 (29.9)2935 (31.9)2380 (28.2)479 (27.1)
       Midwest4285 (22.1)2021 (22.0)1846 (21.9)418 (23.7)
       West5249 (27.1)2144 (23.3)2541 (30.1)564 (31.9)
   Education, n (%)
       ≤High school/GED4783 (24.7)2810 (30.5)1755 (20.8)218 (12.3)
       School after high school7615 (39.2)3772 (41.0)3231 (38.3)612 (34.7)
       ≥College degree7005 (36.1)2621 (28.5)3448 (40.9)936 (53.0)
   Married/Living as married11,161 (57.5)4861 (52.8)5155 (61.1)1145 (64.8)
   BMI, mean (SD)28.5 (5.9)31.2 (6.1)26.5 (4.4)23.6 (2.8)
       <255812 (30.0)1146 (12.5)3355 (39.8)1311 (74.2)
       25–<307123 (36.7)3047 (33.1)3653 (43.3)423 (24.0)
       ≥306468 (33.3)5010 (54.4)1426 (16.9)32 (1.8)
   Treated Hypertension5799 (29.9)3853 (41.9)1841 (21.8)105 (5.9)
   Treated Hyperlipidemia2378 (12.3)1410 (15.3)877 (10.4)91 (5.2)
   Family history of Diabetes, n (%)
       No11,655 (60.1)5204 (56.5)5260 (62.4)1191 (67.4)
       Yes6616 (34.1)3364 (36.6)2745 (32.5)507 (28.7)
       Unknown1132 (5.8)635 (6.9)429 (5.1)68 (3.9)
   Family history of CVD, n (%)
       No6041 (31.1)2738 (29.8)2693 (31.9)610 (34.5)
       Yes12,301 (63.4)5921 (64.3)5300 (62.8)1080 (61.2)
       Unknown1061 (5.5)544 (5.9)441 (5.2)76 (4.3)
   Alcohol Use, drinks/wk
       <18895 (45.8)4669 (50.7)3566 (42.3)660 (37.4)
       1–<78482 (43.7)3707 (40.3)3879 (46.0)896 (50.7)
       ≥72026 (10.4)827 (9.0)989 (11.7)210 (11.9)
WHI Study Components, n (%)
   Estrogen Use 1
       Never7555 (38.9)3883 (42.2)3092 (36.7)580 (32.8)
       Past2899 (14.9)1363 (14.8)1285 (15.2)251 (14.2)
       Current8949 (46.1)3957 (43.0)4057 (48.1)935 (52.9)
   DM Trial Assignment
       Not Randomized13,687 (70.5)5819 (63.2)6363 (75.4)1505 (85.2)
       Intervention2298 (11.8)1362 (14.8)831 (9.9)105 (5.9)
       Comparison3418 (17.6)2022 (22.0)1240 (14.7)156 (8.8)
   WHI Component
       Clinical Trial12,353 (63.7)6428 (69.8)5087 (60.3)838 (47.5)
       Observational Study7050 (36.3)2775 (30.2)3347 (39.7)928 (52.5)
p-value comparing demographics across LE8 groups from a t-test (continuous variables) or chi-square test (categorical) is <0.001 for all demographics except ethnicity (p = 0.59). 1 Estrogen use variable incorporates self-reported use at baseline as well as WHI Hormone Trial assignment (Active/Placebo/Not Randomized). CVD = cardiovascular diseases; DM = dietary modification; GED = general education development; LE8 = life’s essential 8; SD = standard deviation.
Table 2. Association of the LE8 and LE5 with incident treated diabetes.
LE8 (n = 19,403)Low (<49)Moderate (50–79)High (≥80)
Events (per 10k)2271 (166.4)1402 (96.7)248 (73.1) 20-point increase
ModelHR (95% CI) 1HR (95% CI) 1HR (95% CI) 1p-value 2HR (95% CI) 3p-value 3
  Model 11.00 (ref)0.57 (0.53, 0.61)0.42 (0.36, 0.48)<0.0010.56 (0.53, 0.59)<0.001
  Model 21.00 (ref)0.58 (0.54, 0.62)0.43 (0.38, 0.49)<0.0010.57 (0.54, 0.60)<0.001
LE5 (n = 99,269)Low (<49)Moderate (50–79)High (≥80)
Events (per 10k)8805 (135.3)6100 (91.8)2697 (74.9) 20-point increase
ModelHR (95% CI) 1HR (95% CI) 1HR (95% CI) 1p-value 2HR (95% CI) 3p-value 3
  Model 11.00 (ref)0.67 (0.65, 0.70)0.55 (0.53, 0.58)<0.0010.71 (0.70, 0.72)<0.001
  Model 21.00 (ref)0.69 (0.67, 0.72)0.57 (0.54, 0.60)<0.0010.72 (0.71, 0.74)<0.001
  Model 31.00 (ref)0.71 (0.69, 0.74)0.60 (0.57, 0.63)<0.0010.74 (0.73, 0.76)<0.001
All Models are stratified within the model by WHI study component (Clinical Trial/Observational Study), Dietary Modification Trial Arm (Intervention, Comparison, Not Randomized), and time dependent WHI study period (WHI, Extension 1, Extension 2). CI = confidence intervals; HR = hazard ratio. Model 1: Adjusted for age, race, ethnicity, education, region, and marital status. Model 2: Model 1 + family history of diabetes, family history of CVD, alcohol use, and estrogen use. Model 3 (LE5 only): Model 2 + hypertension, hyperlipidemia. 1 Hazard ratios and corresponding 95% confidence intervals from a proportional hazards model with incident treated diabetes as a function of categorical LE8. 2 Trend p-value from a proportional hazards model with incident treated diabetes as a function of linear trend across LE8 group median values. 3 Hazard ratios, corresponding 95% confidence intervals, and p-values from a proportional hazards model with incident treated diabetes as a function of continuous LE8 score.
Disclaimer/Publisher’s Note: The statements, opinions and data contained in all publications are solely those of the individual author(s) and contributor(s) and not of MDPI and/or the editor(s). MDPI and/or the editor(s) disclaim responsibility for any injury to people or property resulting from any ideas, methods, instructions or products referred to in the content.