Article

Multimorbidity Burden in Veterans with and Without Type 2 Diabetes Mellitus: A Comparative Retrospective Cohort Study

by
Lewis J. Frey
1,*,†,
Mulugeta Gebregziabher
2,3,†,
Kinfe G. Bishu
3,4,*,
Brianna Youngblood
3,
Jihad S. Obeid
4,
Jianlin Shi
5,6,
Patrick R. Alba
5,6,
Scott L. DuVall
5,6,
Christopher D. Blasy
7 and
Chanita Hughes Halbert
8
1
Department of Internal Medicine, Division of Gastroenterology and Hepatology, Saint Louis University, Saint Louis, MO 63103, USA
2
Department of Public Health Sciences, Medical University of South Carolina, Charleston, SC 29425, USA
3
Health Equity and Rural Outreach Innovation Center (HEROIC), Ralph H. Johnson VAMC, Charleston, SC 29403, USA
4
Department of Medicine, Medical University of South Carolina, Charleston, SC 29425, USA
5
VA Informatics and Computing Infrastructure, George E. Wahlen VAMC, Salt Lake City, UT 84148, USA
6
Division of Epidemiology, Department of Medicine, University of Utah School of Medicine, Salt Lake City, UT 84148, USA
7
VA Tampa Health Care, Tampa, FL 33612, USA
8
Department of Population and Public Health Sciences, University of Southern California, Los Angeles, CA 90089, USA
*
Authors to whom correspondence should be addressed.
These authors contributed equally to this work.
Diabetology 2025, 6(9), 88; https://doi.org/10.3390/diabetology6090088
Submission received: 29 April 2025 / Revised: 25 July 2025 / Accepted: 11 August 2025 / Published: 1 September 2025

Abstract

Background/Objectives: Multimorbidity, where patients have ≥2 comorbidities, is recognized as a major challenge for health systems worldwide, driving up morbidity and cost. The differences in multimorbidity burden between those with and without type-2 diabetes mellitus (T2DM) in the Veteran population are not well studied. This large retrospective cohort study fills the existing gap. Methods: Using a retrospective cohort of adult Veterans with and without T2DM, we examined 29 comorbidities defined by Elixhauser criteria for 10,499,394 Veterans from 1 January 2008 to 31 December 2009. We then ascertained diabetes status for 10 years of follow-up from 1 January 2010 to 31 December 2019. Multimorbidity status was categorized using the Elixhauser comorbidity index (0, 1, ≥2) and logistic regression was used to estimate the odds ratio (OR) for its association with risk of diabetes, adjusting for covariates. Results: Compared to those with zero comorbidities, the odds of having diabetes were more than doubled (2.53, CI: 2.51–2.54) for those with ≥2 comorbidities. Conclusions: The doubling of the odds of T2DM among those with more than one comorbidity is typical of Veterans with T2DM. In addition, the odds were significantly higher for Hispanics compared to other groups when adjusting for covariates. This calls for more attention to reduce the risk of T2DM through improved management and effective use of treatments informed by disparities that exist in the VHA.

1. Introduction

Multimorbidity, where patients have ≥2 comorbidities, is recognized as a major challenge for health systems worldwide, driving up morbidity and cost [1,2]. The United States (US) has similar patterns to other countries of increasing burden from multimorbid chronic conditions [3,4]. High-cost morbidities are observed in the US Veterans Health Administration (VHA), where Veterans with ≥3 comorbidities account for at least 65% of VHA health care costs, with 5% of the population of high-cost multimorbid patients accounting for 47% of VHA costs [5,6].
A common comorbidity in these costly groups is type 2 diabetes mellitus (T2DM), which is a chronic condition that affected 37 million US adults older than 18 years of age in 2019 [7]. A recent study found that Whites had the lowest rate of complications overall, except for arthropathy/oral complications and foot/skin ulcers, while Black/African Americans had the highest rates of hyperosmolarity, ketoacidosis, neurological complications, and hyperglycemia [8]. In the VHA, T2DM has a higher prevalence of multimorbidity with higher costs of care, frequently occurring in multimorbid combinations [5,6], with the VHA spending over USD 1.5 billion in 2017 on diabetes treatment annually [9]. US Veterans are 2.5 times more likely than the general population to develop diabetes, with approximately 25% of Veterans having T2DM [9]. The prevalence of T2DM in US Veterans is higher in Hispanic (26%) and Non-Hispanic Blacks (NHBs) (23%) compared with Non-Hispanic Whites (NHWs) (20%) [10]. There are significant racial and ethnic disparities in clinical outcomes for the US Veteran population, with NHB having a higher mortality rate with a diagnosis of diabetes and having an increased risk of multimorbid cardiovascular-related mortality [11,12].
In order to better understand the contributing factors leading to multimorbid progression to T2DM, our study examined disparities in the prevalence and incidence of T2DM with multimorbidity, where multimorbidity was defined as two or more Elixhauser morbidities [13]. We examined Elixhauser morbidities to determine their prevalence and associated risk of T2DM. Previous studies have investigated the relationship between race/ethnicity and multimorbidity across various populations, including the general population [4], individuals with diabetes [8], dementia [14], CKD, diabetes, and TBI [15]. However, there is a knowledge gap regarding racial disparities in the association between individual comorbidities, multimorbidity scores, and risk of diabetes, utilizing the most recent large-scale cohort studies with extended follow-up periods. Understanding the impact of individual comorbidities and multimorbidity on diabetes risk can inform national-level recommendations, ultimately enhancing diabetes care and mitigating the overall health burden. The goal of this study is to identify patterns that could be used to potentially reduce the risk of T2DM through improved management and effective use of treatments informed by disparities that exist in the VHA.
Despite the VHA Medical Centers being part of an equal access health care system, racial disparities continue to exist [11,12]. To examine disparities in T2DM with multimorbidity, we used national data gathered in VHA, the largest US health care system, which provides medical care to more than nine million Veterans annually. The data generated from the care of millions of Veterans enabled the development of risk models to inform decisions for those at a higher risk of multimorbid disease burden. Such models can be used to support the VHA’s commitment to understanding and eliminating racial disparities and achieving equity across all vulnerable groups [16].

2. Materials and Methods

2.1. Data Source

This was a retrospective cohort study of national clinical and administrative data in adult veterans with and without type 2 diabetes. The cohort was extracted from the VHA Corporate Data Warehouse (CDW). The Veterans Health Information Systems and Technology Architecture (VistA) was the primary source for the CDW data extracts, which included diagnostic codes, prescription data, and demographic information embedded in outpatient visit and inpatient admission domains. The Ralph H. Johnson VA Research and Development Committee and the Medical University of South Carolina institutional review board approved this study. The authors report no potential conflicts of interest relevant to this article. This article represents the views of the authors and not those of the VHA.

2.2. Study Population

We created a new 2-group cohort of primary care patients across the national VA population specifically for this project, covering a two-year window from 1 January 2008 to 31 December 2009, excluding patients who died before 1 January 2010. The first group included primary care patients who had a personal history of type 2 diabetes (T2DM) of two or more ICD9/10 codes (250.x0, 250.x2, 357.2, 362.0, or 366.41, E11*) in a follow-up window between 1 January 2010 and 31 December 2019. The second group (Non-T2DM) included non-diabetes patients who had any ICD9/10 code occurring in a follow-up window between 1 January 2010 and 31 December 2019, did not have a record of receiving insulin, and had no complicated or uncomplicated diabetes ICD9/10 diagnosis codes during the time period [17]. These groups were established using our previous experience developing T2DM cohorts in the VA [15]. We used data for the two-year analysis window between 1 January 2008 and 31 December 2009 to exclude individuals who received insulin from the Non-T2DM group, and/or who had evidence of uncomplicated and complicated diabetes. This study involved 10,499,394 participants (2,418,345 T2DM and 8,081,049 no diabetes) (see Figure 1).

2.3. Exposure and Covariates

The primary exposure variable was comorbidity burden categories measured by the Elixhauser comorbidity index (ECI): 0 (reference group), 1, and ≥2. Elixhauser comorbidities were based on International Classification of Disease, Ninth Revision, Clinical Modification (ICD-CM-9) obtained from the CDW between 1 January 2008 and 31 December 2009. ICD codes were summarized by the ECI definitions [13]. Covariates included demographic and clinical variables. Sex was categorized as male (reference group) and female. Age was categorized into three groups: <50 years, 50–64 years, and ≥65 years. Race and ethnicity, defined based on VA and CMS sources, were classified as NHW (reference group), NHB, Hispanic, and other. We used the VA’s three groups classifications to define rurality: ‘Urban’, census defined urbanized areas; ‘highly rural’, counties with fewer than 7 persons per square mile; and ‘rural’, areas not considered urban or highly rural; the location of residence was grouped into urban (reference group) and rural (combined highly rural and rural). Smoking status was classified as non-smoker (reference group) and smoker. Marital status was classified as non-married (reference group) and married. Percentage service-connectedness, representing the degree of disability related to military service, was dichotomized at <50% (reference group) and ≥50%. Annual primary care visit was dichotomized as ‘no’ (reference group) and ‘yes’. The primary outcome was diabetes status (the presence of T2DM diagnosis as defined above). It was coded as a binary variable—no diabetes = 0 (reference group) and 1 = diabetes.

2.4. Statistical Analysis

Means for continuous variables were compared using t-tests, while proportions for categorical variables were compared using chi-square tests for demographic characteristics. Comorbidities, including subsets of comorbidities, were separately compared for diabetes and non-diabetes using chi-square tests. We used a generalized estimating equation (GEE) [18] with an exchangeable structure for estimating the association between the outcome (prevalence of diabetes vs. non-diabetes status) and the primary exposure (comorbidity burden) with and without adjustment for covariates. In addition, we fitted a GEE with an exchangeable structure to estimate the association between outcomes (incidence of diabetes vs. non-diabetes status) and exposure (individual comorbidities) and adjusted for covariates after excluding diabetes from the baseline two-year data.
For the adjusted analyses, we used a staged modeling approach with domains of covariates included in the model. The domains included socio-demographics, comorbidities, clinical characteristics, and behavioral characteristics. We also assessed whether this association varies by race and ethnicity. Odds ratios (ORs) and associated 95% confidence intervals (CIs) were computed with adjustment for intra-correlation due to clustering by Veterans Integrated Services Networks (VISNs). Each model was assessed for collinearity using variance inflation (VIF) and goodness of fit using a quasi-likelihood information criterion (QIC) [18]. Statistical significance was based on a p-value of less than 0.05. All analyses were conducted in Stata (ver. 17) using the xtgee procedure.

3. Results

The cohort demographic characteristics from 2008 to 2009 by diabetes status are presented in Table 1. Of the total population sample 10,499,394 were aged ≥ 18 years, 2,418,345 (23.0%) were diabetic, and the remaining 77.0% were non-diabetic. Across both cohorts, there are higher percentages of men, 87%, who make up 96% of diabetes patients. Women (13%) make up 4% of diabetic cases and 15% of the non-diabetic cases. Married patients make up 59% of the diabetes cohort compared with 49% of non-diabetic cases. Diabetic patients were older on average at 63.8 years compared to 53.2 years for non-diabetic patients. Annual primary care visits were higher for diabetic compared to non-diabetic cases (67% vs. 36%). In comparing the rural and urban populations with and without diabetes, the relative rates were higher for rural diabetic patients at 36% in relation to 31% of non-diabetic cases.
Figure 2 presents the results from the GEE logistic regression models showing whether diabetes status differs in ECI for the full model after controlling for demographic and clinical characteristics. In the unadjusted base model, the outcome of diabetes was three times (OR = 3.08; CI: 3.07, 3.09) as likely to be prevalent for patients with one Elixhauser comorbidity and about 4.8 times (OR = 4.75; CI: 4.73, 4.76) as likely in patients with two or more Elixhauser comorbidities compared to patients with no comorbidity (see Supplemental Table S1). The full prevalence model in Figure 2 was adjusted for race and ethnicity, sex, rural versus urban, age, marital status, primary care visit, service-connected disability, and smoking status. Diabetes was 1.80 times (OR = 1.83; CI: 1.82, 1.84) more likely for patients with one Elixhauser comorbidity and 2.5 times (OR = 2.53; CI: 2.51, 2.54) as likely to occur for patients with two or more Elixhauser comorbidities compared with no comorbidities. NHBs were 1.60 times (OR = 1.61; CI: 1.61, 1.62) and Hispanics were 1.60 times (OR = 1.61; CI: 1.60, 1.61) more likely to develop diabetes compared with 1.40 times for other races (OR = 1.38; CI: 1.36, 1.39), all in reference to NHWs. Married were 1.20 times (OR = 1.15; CI: 1.14–1.15) more likely, having primary care visits was 1.20 times (OR = 1.21; CI: 1.20–1.21) more likely, and service-connected disability was 1.30 times (OR = 1.25; CI: 1.24–1.27) more likely, but smokers were 0.96 times (OR = 0.96; CI: 0.95–0.96) less likely to develop diabetes compared to their counterparts.
Figure 2 for NHWs, NHBs, and Hispanics depicts the GEE logistic regression models showing how diabetes status differs in Elixhauser comorbidities by race and ethnicity after controlling for demographic and clinical characteristics. Comparing the likelihood of developing diabetes for patients with one Elixhauser comorbidity compared to no comorbidity, NHWs were at 1.83, NHBs were 1.85 times, and Hispanics were 1.81 times. For patients with two or more Elixhauser comorbidities, NHWs were 2.52 times as likely to develop diabetes, with NHBs 2.56 times as likely and Hispanics 2.69 times as likely compared to no comorbidities. For age 50–64 years compared to <50 years, NHWs, NHBs, and Hispanics were 3.92, 2.62, and 4.83 times as likely to develop diabetes, respectively.
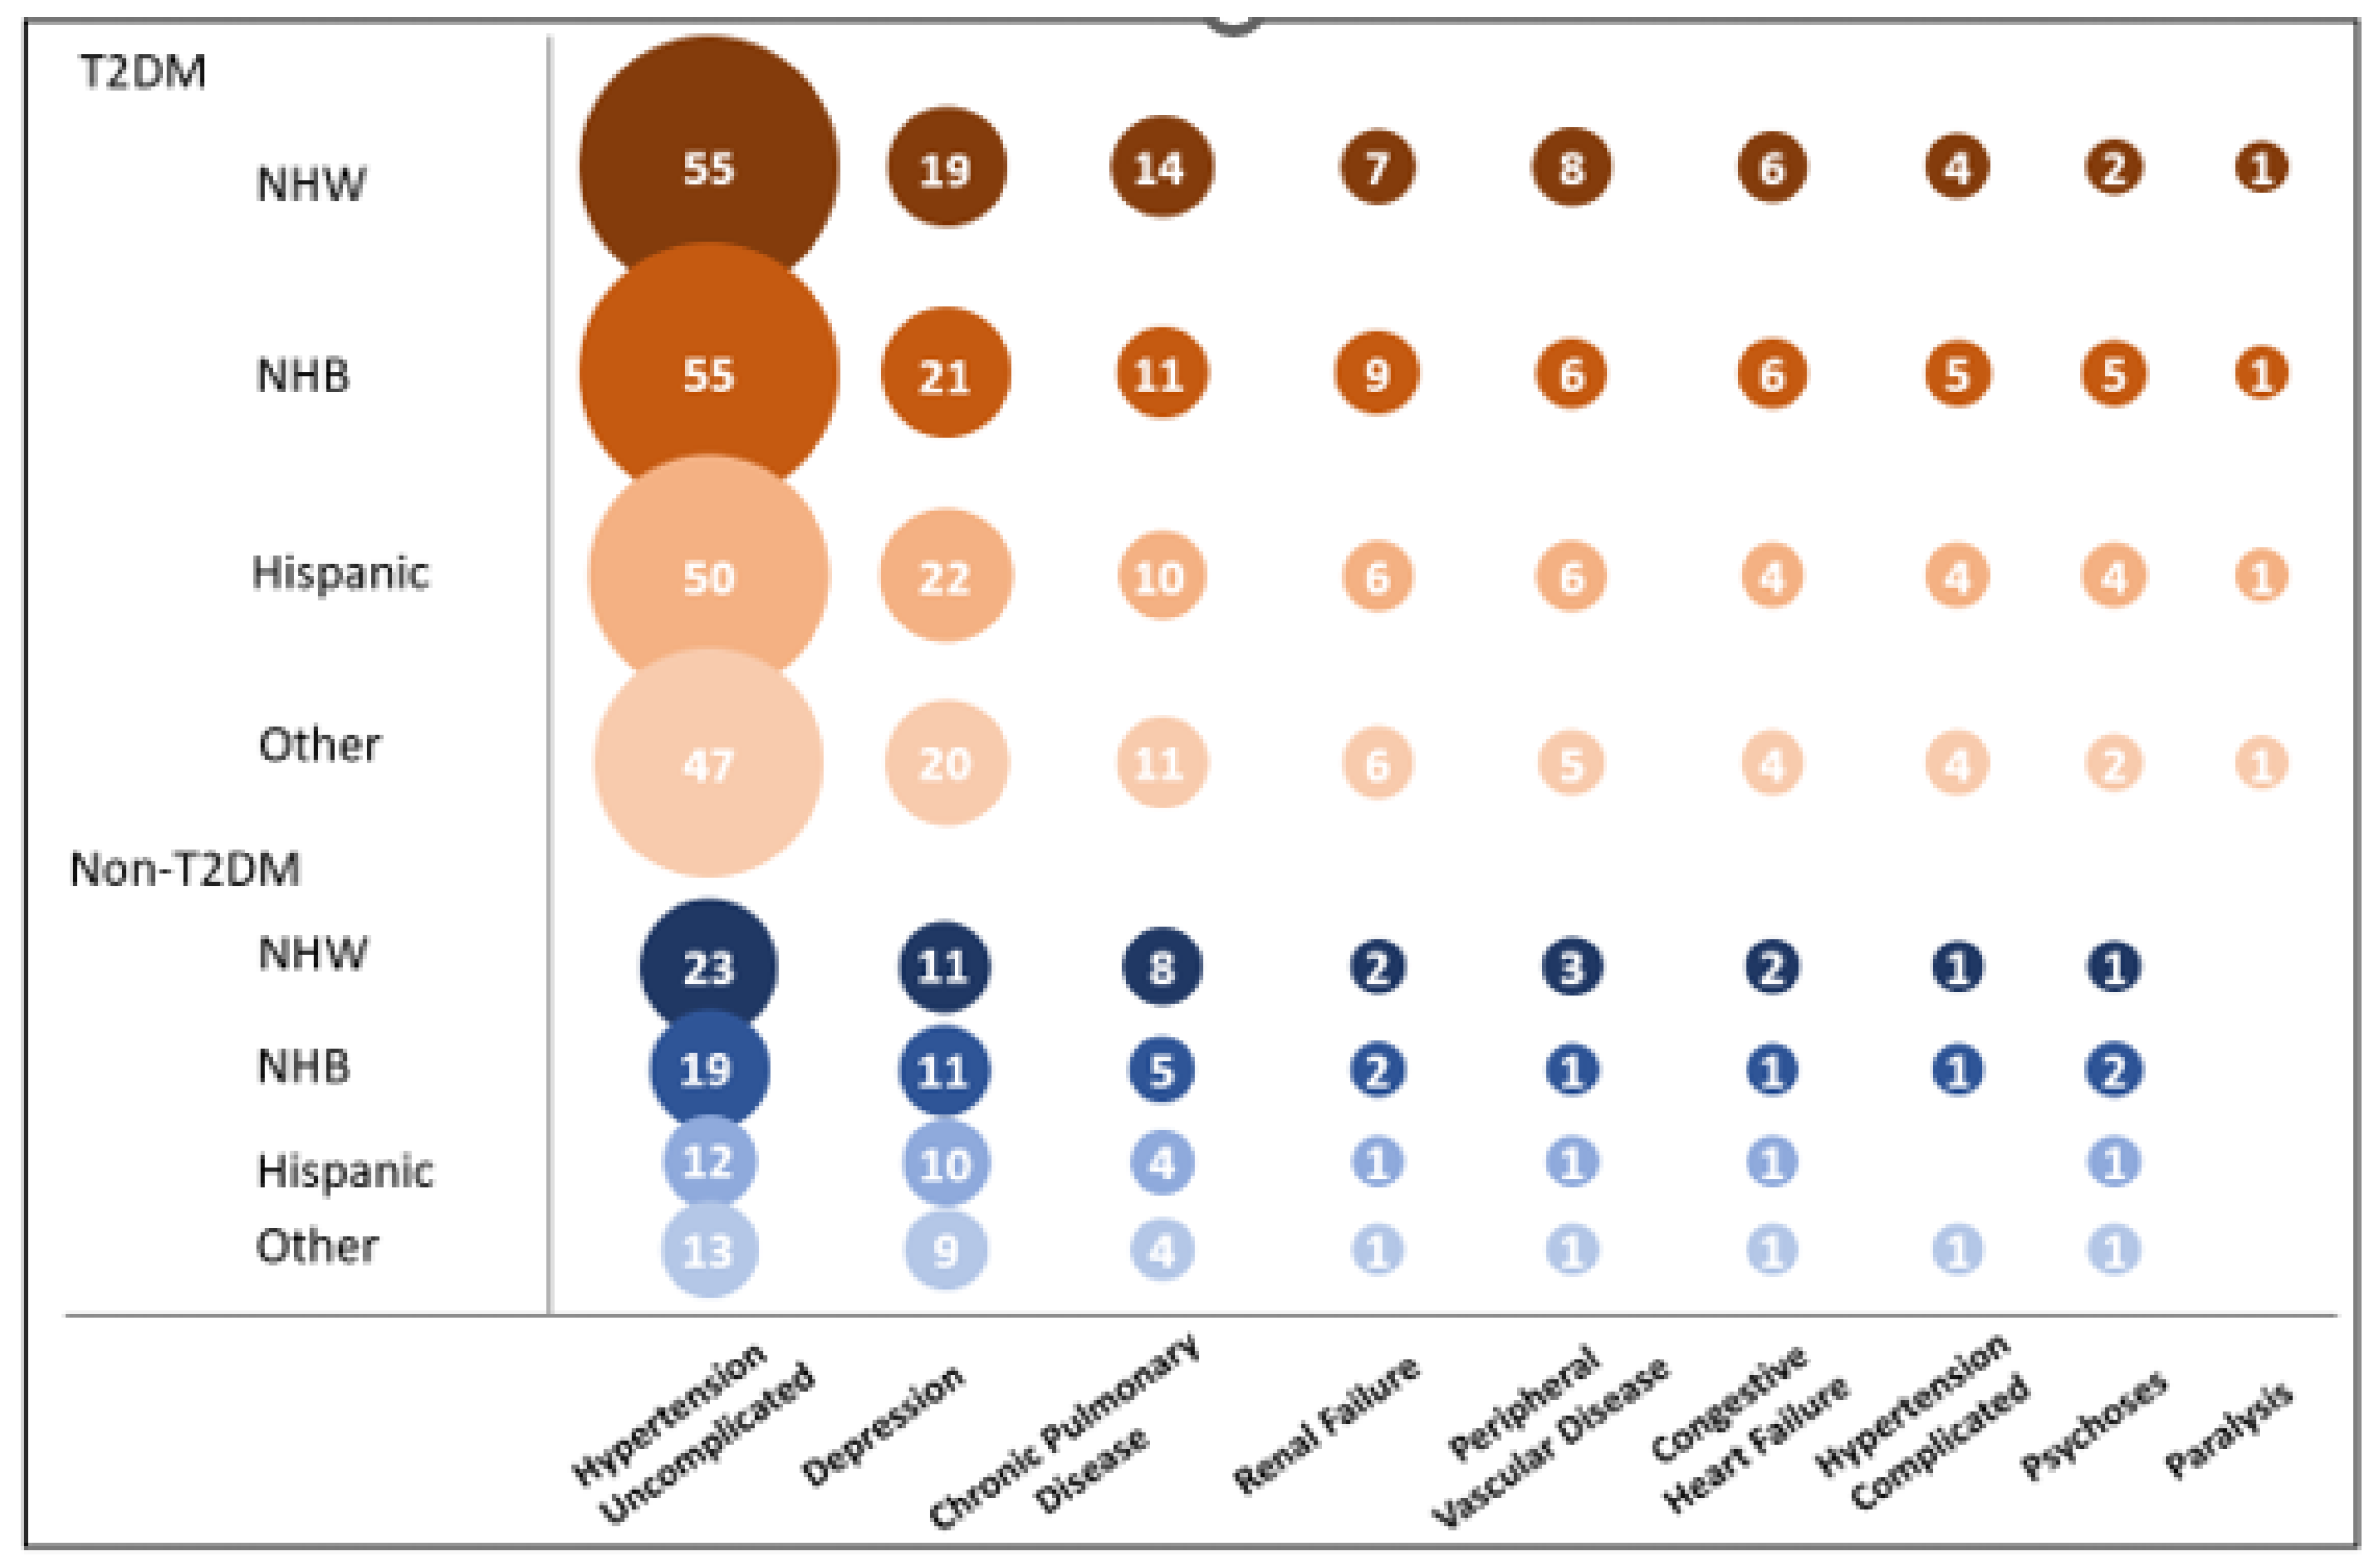
Figure 3 presents the frequency of occurrence for a subset of Elixhauser comorbidities that are approximations of the conditions in Yoon et al. [5] that are part of the “Most Costly Condition Triads” for young < 65 and old ≥ 65 Veterans. The mapping is an approximation, with Elixhauser comorbidities of diabetes, depression, and peripheral vascular disease directly mapping to the same comorbidity names, renal failure to chronic renal failure, complicated and uncomplicated hypertension to hypertension, congestive heart failure to chronic heart failure, chronic pulmonary disease to chronic obstructive pulmonary disease, psychosis to other psychiatric condition, and paralysis to spinal cord injury. The occurrences are encoded as binary, and their frequencies are rounded to whole numbers and indexed by race and ethnicity as well as by diabetes status (see supplemental material for full table of Elixhauser comorbidities in Supplemental Table S2). NHBs had the highest multimorbid renal failure, hypertension-complicated, and psychoses. Hispanics had the highest rate of multimorbid diabetes with depression. The costly conditions in Figure 3 all occurred with higher frequencies in diabetes across all racial and ethnic groups.

Sensitivity Analysis Using Subset of Incident T2DM Cases

In order to model the incidence of diabetes, we filtered those who have uncomplicated or complicated diabetes in the two-year (2008–2009) window (n = 1,160,022), leaving those who are diagnosed as having diabetes for the first time in the 10-year follow-up window. The findings are reported in Supplemental Table S3, showing whether the incidence of diabetes differs by Elixhauser comorbidities and race/ethnicity after controlling for demographic and clinical characteristics.
For the Elixhauser comorbidities that are part of the “Most Costly Condition Triads,” hypertension-uncomplicated, depression, chronic pulmonary disease, congestive heart failure, hypertension-complicated, and psychoses all increased the odds of T2DM. In the case of hypertension-uncomplicated, there was an odds ratio of a 1.38 times higher risk of diabetes, and in depression, there were 1.23 times higher odds of diabetes. Peripheral vascular disease did not change the odds of T2DM, and renal failure had lower odds of diabetes by 0.79 times. The full set of Elixhauser comorbidities is included in Supplemental Table S3.

4. Discussion

Multimorbidity has emerged as a major challenge to health care systems [19,20]. To effectively address this issue, radical changes are required in how health care systems are organized and funded [19]. To contribute to this effort, we conducted a national cohort study to investigate the association between multimorbidity and the risk of diabetes, stratified by race and ethnicity, using the national cohort database with 10 years of follow-up. The logistic regression prevalence models showed the odds of T2DM more than doubling for multimorbid patients and being significantly higher for Hispanics over other groups when adjusting for covariates (See Figure 2). For smoking Veterans, there are differences across race and ethnicity in relation to the cumulative effects of multimorbidity on the odds of diabetes. The NHW and NHB groups who smoke have decreased odds of diabetes of 0.98 and 0.85, respectively, while Hispanic patients have increased odds of 1.04. When individual Elixhauser comorbidities are examined, smoking is not significant for NHWs and Hispanics, while NHB patients are 0.89 times less likely to develop diabetes (see Supplemental Table S3).
In the most costly condition triads discussed in Yoon et al. [5], 48% of the patients were ≥65 years. In our study 44% were ≥65 years in the diabetes group, while 28% were ≥ 65 years in the non-diabetes group. The difference in age between the two groups highlights the importance of age in diabetes care, with diabetes being 3.62 times as likely for the 50–64 years range compared to under 50 years and 3.01 times as likely in the ≥65 years range. The result points to utilizing interventions starting at age 50 to reduce costly multimorbid diabetes.
Multimorbidity is known to exacerbate poor communication and a lack of trust between patients and providers [21,22]. Using social workers to help build trust with consistent communication around multimorbid diabetes risk could build on existing efforts in the VHA. Multi-professional Patient Aligned Care Teams (PACTs) include social workers to deliver primary care in the VHA and have been shown to decrease acute hospital admissions by 4.4% and emergency department visits by 3.0% through care coordination when social workers are embedded in rural PACTs [23]. People-centered, integrated care with skilled multi-professional teams coordinated through primary care has been proposed as a solution to the difficulties posed by poor communication associated with multimorbidity [1,3]. The VHA could use the expertise of PACTs, including social workers, to address issues of distrust, communication, and disparities that exist in the costly treatment of multimorbid T2DM [5].
Strengths of this study include the use of a national cohort with a large sample size, with an extended follow-up period, and the scale of the cohort, which provides new information on multimorbid T2DM. Limitations of this study are that the population is primarily male and that ICD9/10 codes are used to characterize comorbidities. There are known biases in the use of ICD billing codes [17], and the VHA does not use ICD9/10 codes for billing, potentially introducing more bias. The modeling is based on these administrative codes assigned during the specified time windows and does not account for care given outside of the VHA. Medication and lab data were not used in the analysis and are beyond the scope of this paper.
Through identifying the factors that impact disparities in T2DM multimorbid disease progression, efforts to understand and eliminate racial and ethnic inequalities in the VHA can be better informed. Given the large Veteran cohort of patients, we present the prevalence of Elixhauser comorbidities in patients with and without T2DM and show that two or more comorbidities doubled the odds of diabetes. Disparities exist in racial and ethnic groups in terms of the prevalence of comorbidities and the associated odds ratios for the occurrence of diabetes. Of interest were the higher frequency of comorbidities in diabetes patients and the higher odds of diabetes in patients in the age range of 50–64. With the challenge to health systems posed by multimorbidity, this study provides context on the burden of multimorbidity and highlights the importance of slowing progression, especially to multimorbid diabetes. Our study calls for more attention to reduce the risk of T2DM through improved management and effective use of treatments informed by disparities that exist in the VHA.

Supplementary Materials

The following supporting information can be downloaded at https://www.mdpi.com/article/10.3390/diabetology6090088/s1, Table S1: Prevalence Models for odds of occurrence of diabetes between 2008 and 2019 (two-year window plus 10-year follow up)—95% confidence intervals for xtgee (GEE Logistic Models): Outcome—diabetes, exposure—Elixhauser comorbidity index; Table S2: Elixhauser comorbidities by race/ethnicity and diabetes status within two-year window (2008–2009). All cells are significant with p-value <0.001.; Table S3: Odds Ratios (95% Confidence Intervals). Models for odds of diabetes—95% confidence intervals for xtgee (GEE Logistic Models): Outcome—diabetes, exposure—Elixhauser comorbidity by race/ethnicity adjusted for covariates.

Author Contributions

Conceptualization, L.J.F., M.G. and C.H.H.; methodology, K.G.B., M.G. and L.J.F.; formal analysis, K.G.B. and M.G.; investigation, L.J.F., B.Y. and M.G.; writing—original draft preparation, L.J.F., B.Y., M.G., K.G.B. and C.H.H.; writing—review and editing, C.H.H., M.G., J.S.O., J.S., P.R.A., S.L.D. and C.D.B.; supervision, L.J.F., C.D.B. and S.L.D.; visualization, L.J.F. and K.G.B.; funding acquisition, L.J.F. All authors have read and agreed to the published version of the manuscript.

Funding

The work was supported by the Veterans Affairs Health Services Research & Development Merit Grant 1I01HX003379.

Data Availability Statement

Veterans Affairs policy does not allow the data for the study to be shared publicly. The data is available with the VINCI system and can be accessed with appropriate approvals.

Conflicts of Interest

The authors declare no conflicts of interest.

References

  1. World Health Organization. WHO Global Strategy on People-Centred and Integrated Health Services: Interim Report; World Health Organization: Geneva, Switzerland, 2015; Available online: https://apps.who.int/iris/bitstream/handle/10665/155002/WHO_HIS_SDS_2015.6_eng.pdf (accessed on 12 August 2025).
  2. Pearson-Stuttard, J.; Ezzati, M.; Gregg, E.W. Multimorbidity—A defining challenge for health systems. Lancet Public Health 2019, 4, e599–e600. [Google Scholar] [CrossRef] [PubMed]
  3. Barnett, K.; Mercer, S.W.; Norbury, M.; Watt, G.; Wyke, S.; Guthrie, B. Epidemiology of multimorbidity and implications for health care, research, and medical education: A cross-sectional study. Lancet 2012, 380, 37–43. [Google Scholar] [CrossRef] [PubMed]
  4. Caraballo, C.; Herrin, J.; Mahajan, S.; Massey, D.; Lu, Y.; Ndumele, C.D.; Drye, E.E.; Krumholz, H.M. Temporal trends in racial and ethnic disparities in multimorbidity prevalence in the United States, 1999–2018. Am. J. Med. 2022, 135, 1083–1092.e14. [Google Scholar] [CrossRef] [PubMed]
  5. Yoon, J.; Zulman, D.; Scott, J.Y.; Maciejewski, M.L. Costs associated with multimorbidity among VA patients. Med. Care 2014, 52, S31–S36. [Google Scholar] [CrossRef] [PubMed]
  6. Zulman, D.M.; Chee, C.P.; Wagner, T.H.; Yoon, J.; Cohen, D.M.; Holmes, T.H.; Ritchie, C.; Asch, S.M. Multimorbidity and healthcare utilisation among high-cost patients in the US Veterans Affairs Health Care System. BMJ Open 2015, 5, e007771. [Google Scholar] [CrossRef] [PubMed]
  7. National Diabetes Statistics Report Estimates of Diabetes and Its Burden in the United States; Department of Health and Human Services: Washington, DC, USA, 2019.
  8. Burress, L.A.; Clements, J.M. Racial and Ethnic Disparities in Type 2 Diabetes Complications and In-Hospital Mortality in the United States: A Retrospective Cohort Study. Diabetology 2025, 6, 15. [Google Scholar] [CrossRef]
  9. Federal Practitioner. Diabetes Mellitus Federal Health Data Trends. Available online: https://www.mdedge.com/fedprac/article/152642/diabetes/diabetes-mellitus-federal-health-data-trends-full (accessed on 12 August 2025).
  10. Liu, Y.; Sayam, S.; Shao, X.; Wang, K.; Zheng, S.; Wang, L. Prevalence of and Trends in Diabetes Among Veterans, United States, 2005–2014. Prev. Chronic Dis. 2017, 14, E135. [Google Scholar] [CrossRef] [PubMed]
  11. Peterson, K.; Anderson, J.; Boundy, E.; Ferguson, L.; McCleery, E.; Waldrip, K. Mortality Disparities in Racial/Ethnic Minority Groups in the Veterans Health Administration: An Evidence Review and Map. Am. J. Public Health 2018, 108, e1–e11. [Google Scholar] [CrossRef] [PubMed]
  12. Wong, M.S.; Hoggatt, K.J.; Steers, W.N.; Frayne, S.M.; Huynh, A.K.; Yano, E.M.; Saechao, F.S.; Ziaeian, B.; Washington, D.L. Racial/Ethnic Disparities in Mortality Across the Veterans Health Administration. Health Equity 2019, 3, 99–108. [Google Scholar] [CrossRef] [PubMed]
  13. Elixhauser, A.; Steiner, C.; Harris, D.R.; Coffey, R.M. Comorbidity measures for use with administrative data. Med. Care 1998, 36, 8–27. [Google Scholar] [CrossRef] [PubMed]
  14. Habibzadeh, P.; Albrecht, J. Association between race and comorbid conditions among older adults with dementia. J. Clin. Med. 2024, 13, 6368. [Google Scholar] [CrossRef] [PubMed]
  15. Gebregziabher, M.; Ward, R.C.; Taber, D.J.; Walker, R.J.; Ozieh, M.; Dismuke, C.E.; Axon, R.N.; Egede, L.E. Ethnic and geographic variations in multimorbidty: Evidence from three large cohorts. Soc. Sci. Med. 2018, 211, 198–206. [Google Scholar] [CrossRef] [PubMed]
  16. Department of Veterans Affairs & Office of Health Equity (U.S.). National Veteran Health Equity Report-FY 2013; Government Printing Office: Washington, DC, USA, 2017.
  17. van Walraven, C. A comparison of methods to correct for misclassification bias from administrative database diagnostic codes. Int. J. Epidemiol. 2018, 47, 605–616. [Google Scholar] [CrossRef] [PubMed]
  18. Cui, J. QIC Program and Model Selection in GEE Analyses. Stata J. 2007, 7, 209–220. [Google Scholar] [CrossRef]
  19. Moffat, K.; Mercer, S.W. Challenges of managing people with multimorbidity in today’s healthcare systems. BMC Fam. Pract. 2015, 16, 129. [Google Scholar] [CrossRef] [PubMed]
  20. Chowdhury, S.R.; Chandra Das, D.; Sunna, T.C.; Beyene, J.; Hossain, A. Global and regional prevalence of multimorbidity in the adult population in community settings: A systematic review and meta-analysis. EClinicalMedicine 2023, 57, 101860. [Google Scholar] [CrossRef] [PubMed]
  21. Halbert, C.H.; Armstrong, K.; Gandy, O.H.J.; Shaker, L. Racial differences in trust in health care providers. Arch. Intern. Med. 2006, 166, 896–901. [Google Scholar] [CrossRef] [PubMed]
  22. Perry, R.G.; Mitchell, J.A.; Hawkins, J.; Johnson-Lawrence, V. The role of age and multimorbidity in shaping older African American men’s experiences with Patient–Provider communication. Geriatrics 2018, 3, 74. [Google Scholar] [CrossRef] [PubMed]
  23. Cornell, P.Y.; Halladay, C.W.; Ader, J.; Halaszynski, J.; Hogue, M.; McClain, C.E.; Silva, J.W.; Taylor, L.D.; Rudolph, J.L. Embedding Social Workers In Veterans Health Administration Primary Care Teams Reduces Emergency Department Visits. Health Aff. 2020, 39, 603–612. [Google Scholar] [CrossRef] [PubMed]
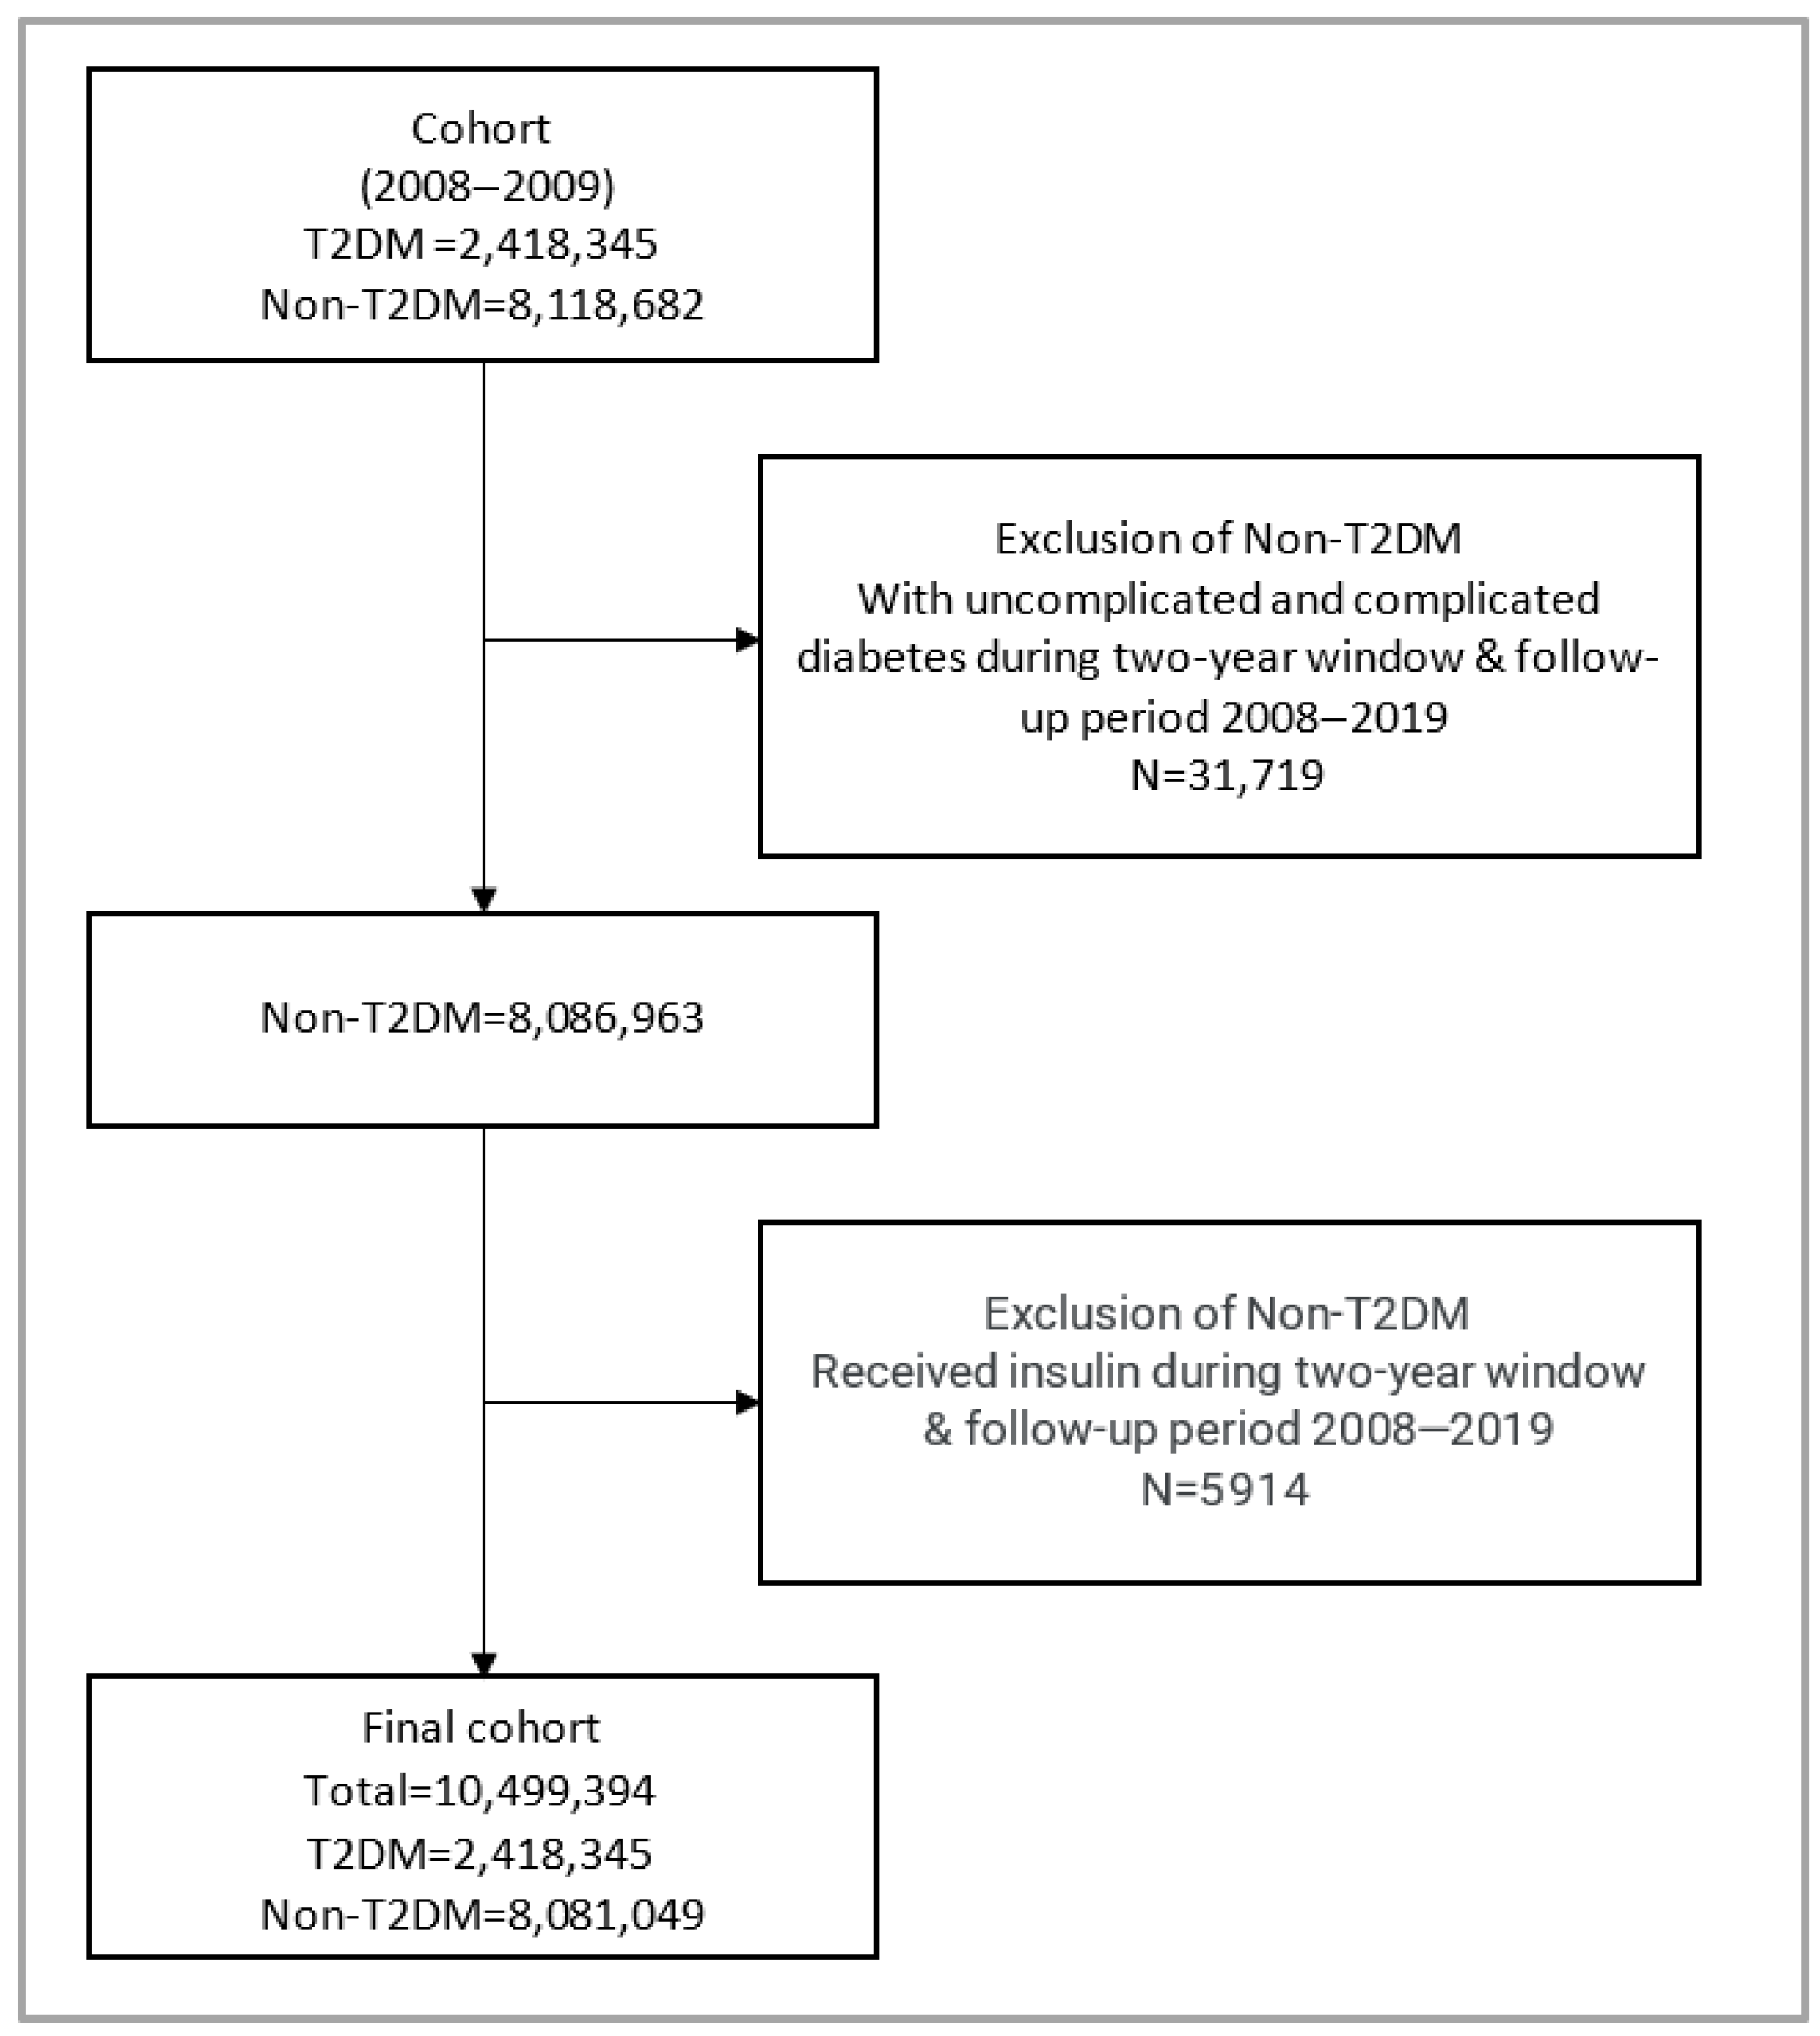
Figure 1. Flow chart for Veterans with and without type 2 diabetes mellitus.
Diabetology 06 00088 g001
Figure 2. Prevalence models for odds of occurrence of diabetes between 2008 and 2019 (two-year window plus 10-year follow-up)—95% confidence intervals (GEE Logistic Models): Outcome—diabetes; exposure—Elixhauser comorbidity index (ECI *: 0, 1, ≥2), primary covariates (race/ethnicity, sex, rurality), and secondary covariates (age categories, married, † annual primary care visit, ‡ service-connected disability, § smoking status). Models of NHWs, NHBs, and Hispanics are odds of diabetes by race/ethnicity adjusted for covariates.
Diabetology 06 00088 g002
Figure 3. Prevalence of a subset of Elixhauser comorbidities that approximate the comorbidities in Yoon et al. [5] for the costliest three-way disease combinations contributing to 65% of VHA annual cost across race/ethnicity and diabetes status within a two-year window (2008–2009) rounded to whole number percentages. The full data is in the supplemental material. The differences among race and ethnicity for diabetes and non-diabetes are significant with a p-value < 0.001.
Diabetology 06 00088 g003
Table 1. Diabetes cohort versus non-diabetes cohort at baseline.
TotalDiabetesNon-Diabetesp-Value
Patients (n)10,499,3942,418,3458,081,049
Sex (%) <0.001
Male87.4095.7784.88
Female12.604.2315.12
Age, years (%) <0.001
<5033.8411.8040.43
50–6432.2144.0928.65
≥6531.7444.0928.04
Missing2.220.022.87
Race/ethnicity (%) <0.001
NHW67.7371.8066.51
NHB14.7718.1313.76
Hispanic5.686.275.50
Other2.913.002.88
Missing8.910.7911.34
ECI (%) <0.001
062.6336.7970.37
113.6419.2811.95
≥223.7343.9317.68
Rurality (%) <0.001
Urban67.4963.5768.65
Rural32.2336.2031.04
Missing0.280.220.30
Marital status (%) <0.001
Non-Married41.1540.1941.44
Married51.4559.3849.08
Missing7.400.439.48
PCV (%)
No56.8332.9263.98
Yes43.1767.0836.02
SCD (≥50%) <0.001
No98.4297.4198.72
Yes1.582.591.28
Smoking status (%) <0.001
Non-smoker77.1063.7181.11
Smoker22.9036.2918.89
Disclaimer/Publisher’s Note: The statements, opinions and data contained in all publications are solely those of the individual author(s) and contributor(s) and not of MDPI and/or the editor(s). MDPI and/or the editor(s) disclaim responsibility for any injury to people or property resulting from any ideas, methods, instructions or products referred to in the content.