Article

Investigating the Protective Effects of a Rhenium (V) Compound with Uracil-Derived Ligands on Liver Damage Associated with Prediabetes in Diet-Induced Prediabetic Rats

by
Angezwa Siboto
1,*,
Akinjide Moses Akinnuga
1,
Muhammed Bilaal Ismail
2,
Irvin Noel Booysen
2,
Ntethelelo Hopewell Sibiya
3,
Phikelelani Ngubane
1 and
Andile Khathi
1
1
School of Laboratory Medicine and Medical Sciences, College of Health Sciences, University of KwaZulu-Natal, Durban 4000, South Africa
2
School of Chemistry and Physics, College of Agriculture, Engineering Sciences, University of KwaZulu-Natal, Pietermaritzburg 3209, South Africa
3
Pharmacology Division, Rhodes University, Grahamstown 6140, South Africa
*
Author to whom correspondence should be addressed.
Diabetology 2022, 3(4), 524-538; https://doi.org/10.3390/diabetology3040040
Submission received: 1 August 2022 / Revised: 2 October 2022 / Accepted: 8 October 2022 / Published: 17 October 2022
(This article belongs to the Special Issue Diabetology: Feature Papers 2022)

Abstract

:
Non-alcoholic fatty liver disease (NAFLD) is associated with prediabetes and can be treated by using a combination of metformin and dietary modification. However, people often fail to adhere to dietary modifications and become more dependent on pharmaceutical intervention, and this affects the effectiveness of the drug. In this study, we investigated the effects of rhenium (V) compound with uracil-derived ligands on liver health in diet-induced prediabetic rats in both the presence and absence of dietary modification. Prediabetic male Sprague Dawley rats were treated with the rhenium (V) compound for 12 weeks in both the presence and absence of dietary modification while monitoring fasting blood glucose levels. Antioxidant enzyme activity, inflammation markers and liver enzymes were measured together with liver glycogen and plasma triglycerides after sacrificing. The administration of rhenium (V) compound to prediabetic rats in both the presence and absence of dietary modification resulted in reduced concentrations of fasting blood glucose and triglycerides. There was also reduced liver glycogen, oxidative stress and liver enzymes while increasing antioxidant enzymes. Altogether, the rhenium (V) compound ameliorated liver injury and prevented hepatotoxicity.

1. Introduction

Non-alcoholic fatty liver disease (NAFLD) has recently become the most frequent chronic liver disease that occurs across all age groups due to the growing prevalence of obesity and prediabetes [1,2]. NAFLD is strongly associated with insulin resistance, dyslipidemia and hypertriglyceridemia. Diets that are high in carbohydrates and saturated fats have been shown to predispose individuals to developing both prediabetes and NAFLD [3,4]. Additionally, fizzy drinks that are high in fructose activate lipogenesis in the hepatocytes, resulting in a fatty liver [5,6,7]. Prediabetes is linked with moderate levels of insulin resistance and has been shown to play a primary role in the pathogenesis of NAFLD [8,9]. Liver dysfunction is associated with hepatic insulin resistance and an increase in hepatic glycogen production, whereas liver injury is shown by abnormal liver enzymes such as alanine transaminase (ALT), aspartate transaminase (AST) and lactic dehydrogenase [10,11]. These may be due to alternations in the permeability of the cell membrane and damage in the liver tissue [5,12].
The treatment of NAFLD involves a combination of dietary modification to enhance weight loss, along with the use of different insulin-sensitizing agents such as metformin [13,14,15,16]. However, studies have shown that patients become more dependent on the pharmaceutical interventions while neglecting the lifestyle modification, resulting in a reduction in the efficacy of metformin [17,18]. Therefore, there exists a need for novel pharmacological compounds that can work in both the presence and absence of lifestyle modifications. Transition metals have been used to try and manage diabetes and other metabolic conditions, but they have been shown to disrupt lipid and protein metabolism as well as induce oxidative stress in the liver [5]. However, recent studies from our laboratory have shown that the incorporation of organic ligands to the transition metals results in reduced cellular toxicity [19,20]. We have previously shown that our novel rhenium (V) compound with uracil-derived ligands improves glucose homeostasis in high-fat–high-carbohydrate diet-induced prediabetic animals in both the absence and presence of dietary modifications [20,21]. In this study, we sought to further investigate the effects of the rhenium (V) compound on selected liver function markers in diet-induced prediabetic rats.

2. Methods and Materials

2.1. Animals

Thirty-six (36) male Sprague Dawley rats (150–180 g) obtained from Biomedical Research Unit, University of KwaZulu-Natal (UKZN), were kept under standard environmental conditions, i.e., constant humidity (55 ± 5%), temperature (22 ± 2 °C), 12 h day:12 h night cycle. The animals were acclimatized for 2 weeks with free access to a standard rat chow (Meadow Feeds, South Africa) and water ad libitum before being fed on the experimental high-fat–high-carbohydrate (HFHC) diet (AVI Products (Pty) Ltd., Waterfall, South Africa) to induce prediabetes. The HFHC diet consists of carbohydrates (55% kcal/g), fats (30% kcal/g) and proteins (15% kcal/g), as described in our previous study [3,20]. All the experimental designs and procedures were carried out according to the ethics and guidelines of the Animal Research Ethics Committee (AREC, ethical clearance code: AREC/039/018M) of the UKZN, Durban, South Africa.

2.1.1. Induction of Prediabetes on Male Sprague Dawley Rats

Sprague Dawley rats (n = 6 per group) were divided into groups based on the diet they received: a standard rat chow with normal drinking water (ND + H2O), high-fat–high-carbohydrate diet with drinking water supplemented with fructose (HFHC + fructose). Prediabetes induction took 20 weeks using a previously established protocol [3,22]. Rats with fasting blood levels that were higher than 5.6 mmol/L were considered prediabetic and grouped further for pharmacological studies [23,24]. The treatment commenced on the subsequent day, and this was considered as day 1 of treatment.

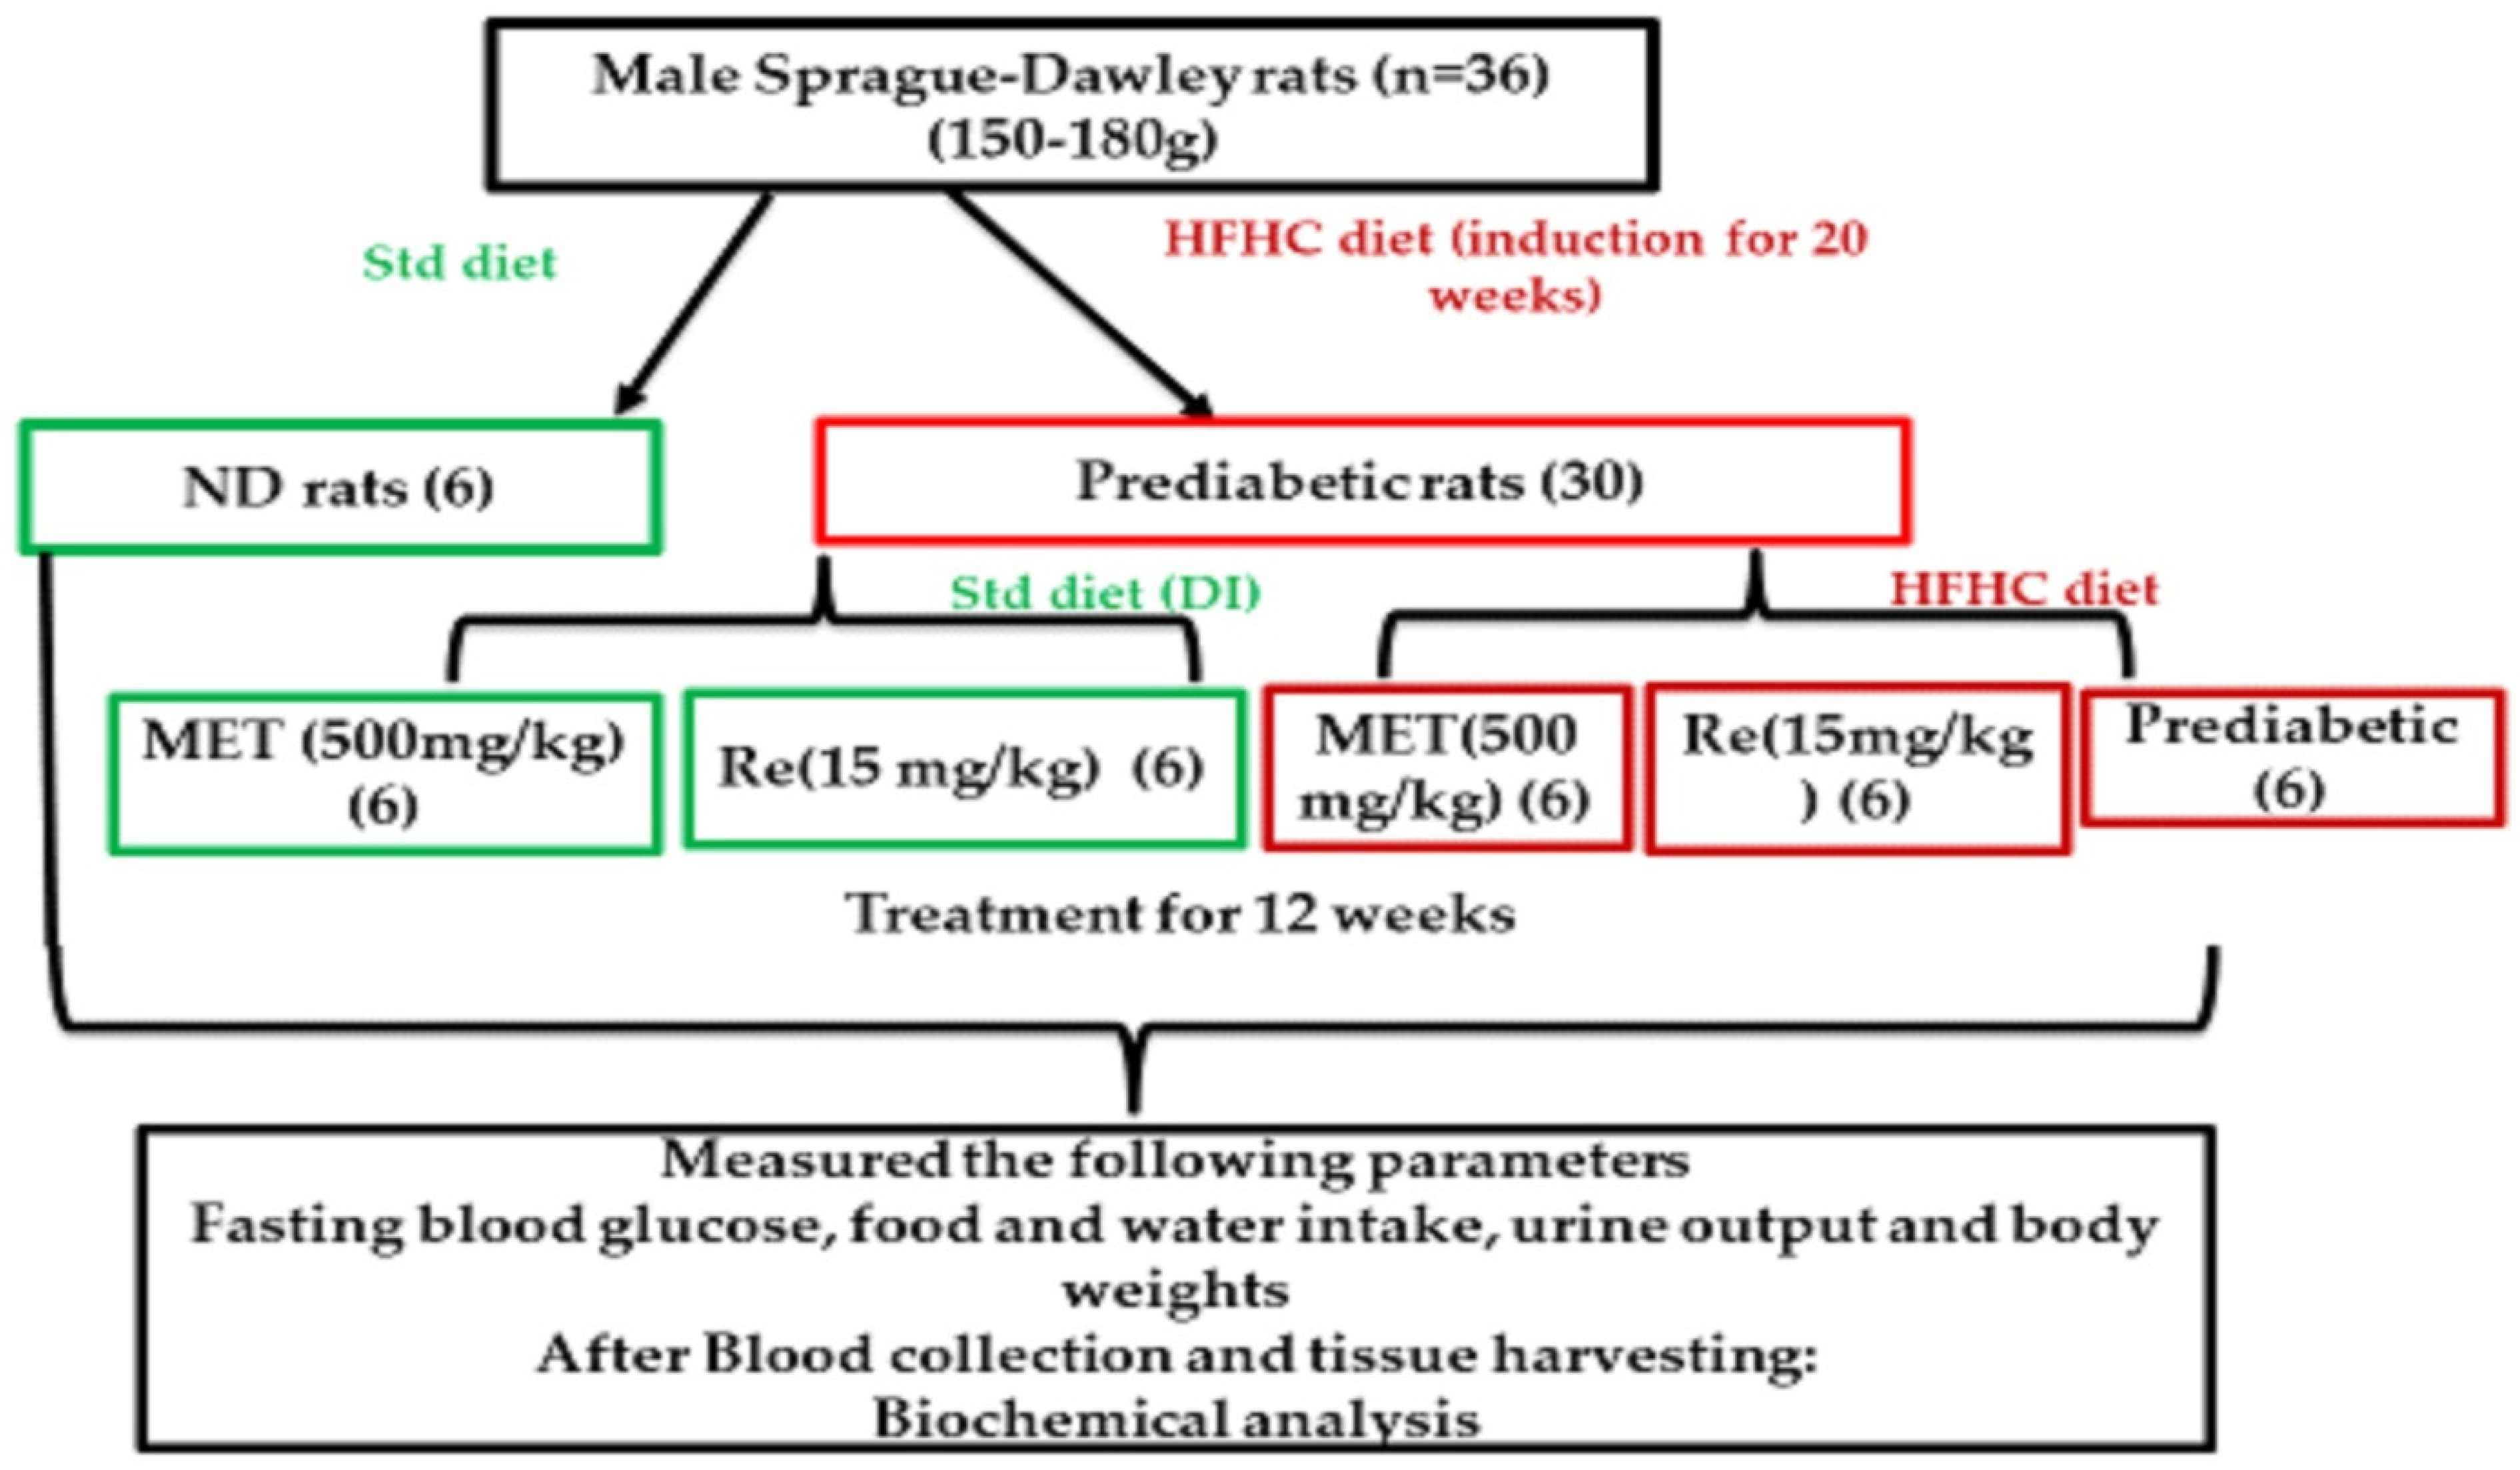
2.1.2. Study Design for Experiments

In this study, rats were randomly divided into 6 groups of 6 animals in each (30 prediabetic persisting, 6 normal). Group 1: normal healthy control rats received vehicle (NC); Group 2: prediabetic control rats continued with HFHC diet and received vehicle (PD); Group 3: prediabetic treated rats switched to the STD diet and received metformin (MET + DI); Group 4: prediabetic treated rats continued with HFHC diet received metformin (MET + HFHC); Group 5: prediabetic rats switched to the STD diet and received rhenium (V) compound (Re + DI); Group 6: prediabetic treated rats continued with diet received rhenium (V) compound (Re + HFHC). See Figure 1.

2.1.3. Treatment of Prediabetic Animals

After 20 weeks of inducing prediabetes, the treatment period started and lasted an additional 12 weeks. During the treatment period, the animals were treated once every third day at 9:00 a.m., where metformin (500 mg/kg) was given through oral dosing to the MET + HFHC and MET + DI, while rhenium (V) compound (15 mg/kg) was given via subcutaneous injection to the Re + HFHC and Re + DI groups. Parameters including fasting blood glucose (FBG) concentration, food intake and body weights were monitored every 4 weeks during the treatment period. See Figure 1.

2.1.4. Blood Collection and Tissue Harvesting

For blood collection, all animals were anesthetized with Isofor (100 mg/kg) (Safeline Pharmaceuticals (Pty) Ltd., Roodeport, South Africa) via a gas anesthetic chamber (Biomedical Resource Unit, UKZN, Durban, South Africa) for 3 min in line with the guidelines for use of anesthesia. While the rats were unconscious, blood was collected by cardiac puncture into individual pre-cooled heparinized containers. The blood was then centrifuged (Eppendorf centrifuge 5403, Germany) at 4 °C, 503× g for 15 min. Plasma was collected and stored at −80 °C in a Bio Ultra freezer (Snijers Scientific, Holland, Netherlands) until ready for biochemical analysis. Thereafter, liver tissue was removed, weighed and rinsed with cold normal saline solution and snap frozen in liquid nitrogen before storage in a BioUltra freezer (Snijers Scientific, Tilburg, Netherlands) at −80 °C until biochemical analysis.

2.1.5. Relative Liver Weight

The relative liver weights of all the animals in each experimental group were determined from the percentage of the ratio of liver weight to the body weight using the formula below:
Relative   liver   weight = liver   weight   body   weight   ×   100 %  

2.2. Biochemical Analysis

2.2.1. Quantification of Hepatic Glycogen, Plasma Triglycerides, TNF α and Liver Function Enzymes

Glycogen concentration analysis was performed in liver tissues. The glycogen assay was conducted using a well-established laboratory protocol [20].
Triglycerides (TGs) were measured using a colorimetric assay kit (catalog No: E-BC-K238; Manufacturer: Elabscience), single reagent, GPO-PAP method. Briefly, 50 mg of liver tissue was homogenized on 0.9% saline in a ratio of 9:1. The tissue was homogenized on ice for 2 min, and then the sample was centrifuged at 1000× g for 5–10 min. After centrifugation, the aqueous phase extraction was used in the assay. The protein quantification was conducted using Bradford assay. The assay was carried out according to the manufacturer’s instructions. Furthermore, for TNF α measurements, 50 mg of liver tissue was homogenized, and the concentration was determined using an ELISA kit following the manufacturer’s instructions (catalog no.: E-EL-R2856; manufacturer: Elabscience). Liver AST and ALT concentrations were measured using the Catalyst One Chemistry Analyzer (IDEXX Laboratories, Westbrook, ME, USA).

2.2.2. Antioxidant Activity Profile

Antioxidant activity in the liver was measured on selected antioxidant markers. Glutathione peroxidase (GPx) (catalog no.: E-EL-R2491; manufacturer: Elabscience) and superoxide dismutase (SOD) (catalog no.: E-EL-R1424; manufacturer: Elabscience) concentrations were determined using assay kits as per manufacturer’s instructions.

2.3. Statistical Analysis

All data are expressed as means ± SD. Statistical comparisons were performed with GraphPad InStat Software (version 5.00, GraphPad Software, Inc., San Diego, CA, USA) using two-way analysis of variance (ANOVA) followed by Tukey–Kramer multiple comparison test. A value of p < 0.05 was considered statistically significant.

3. Results

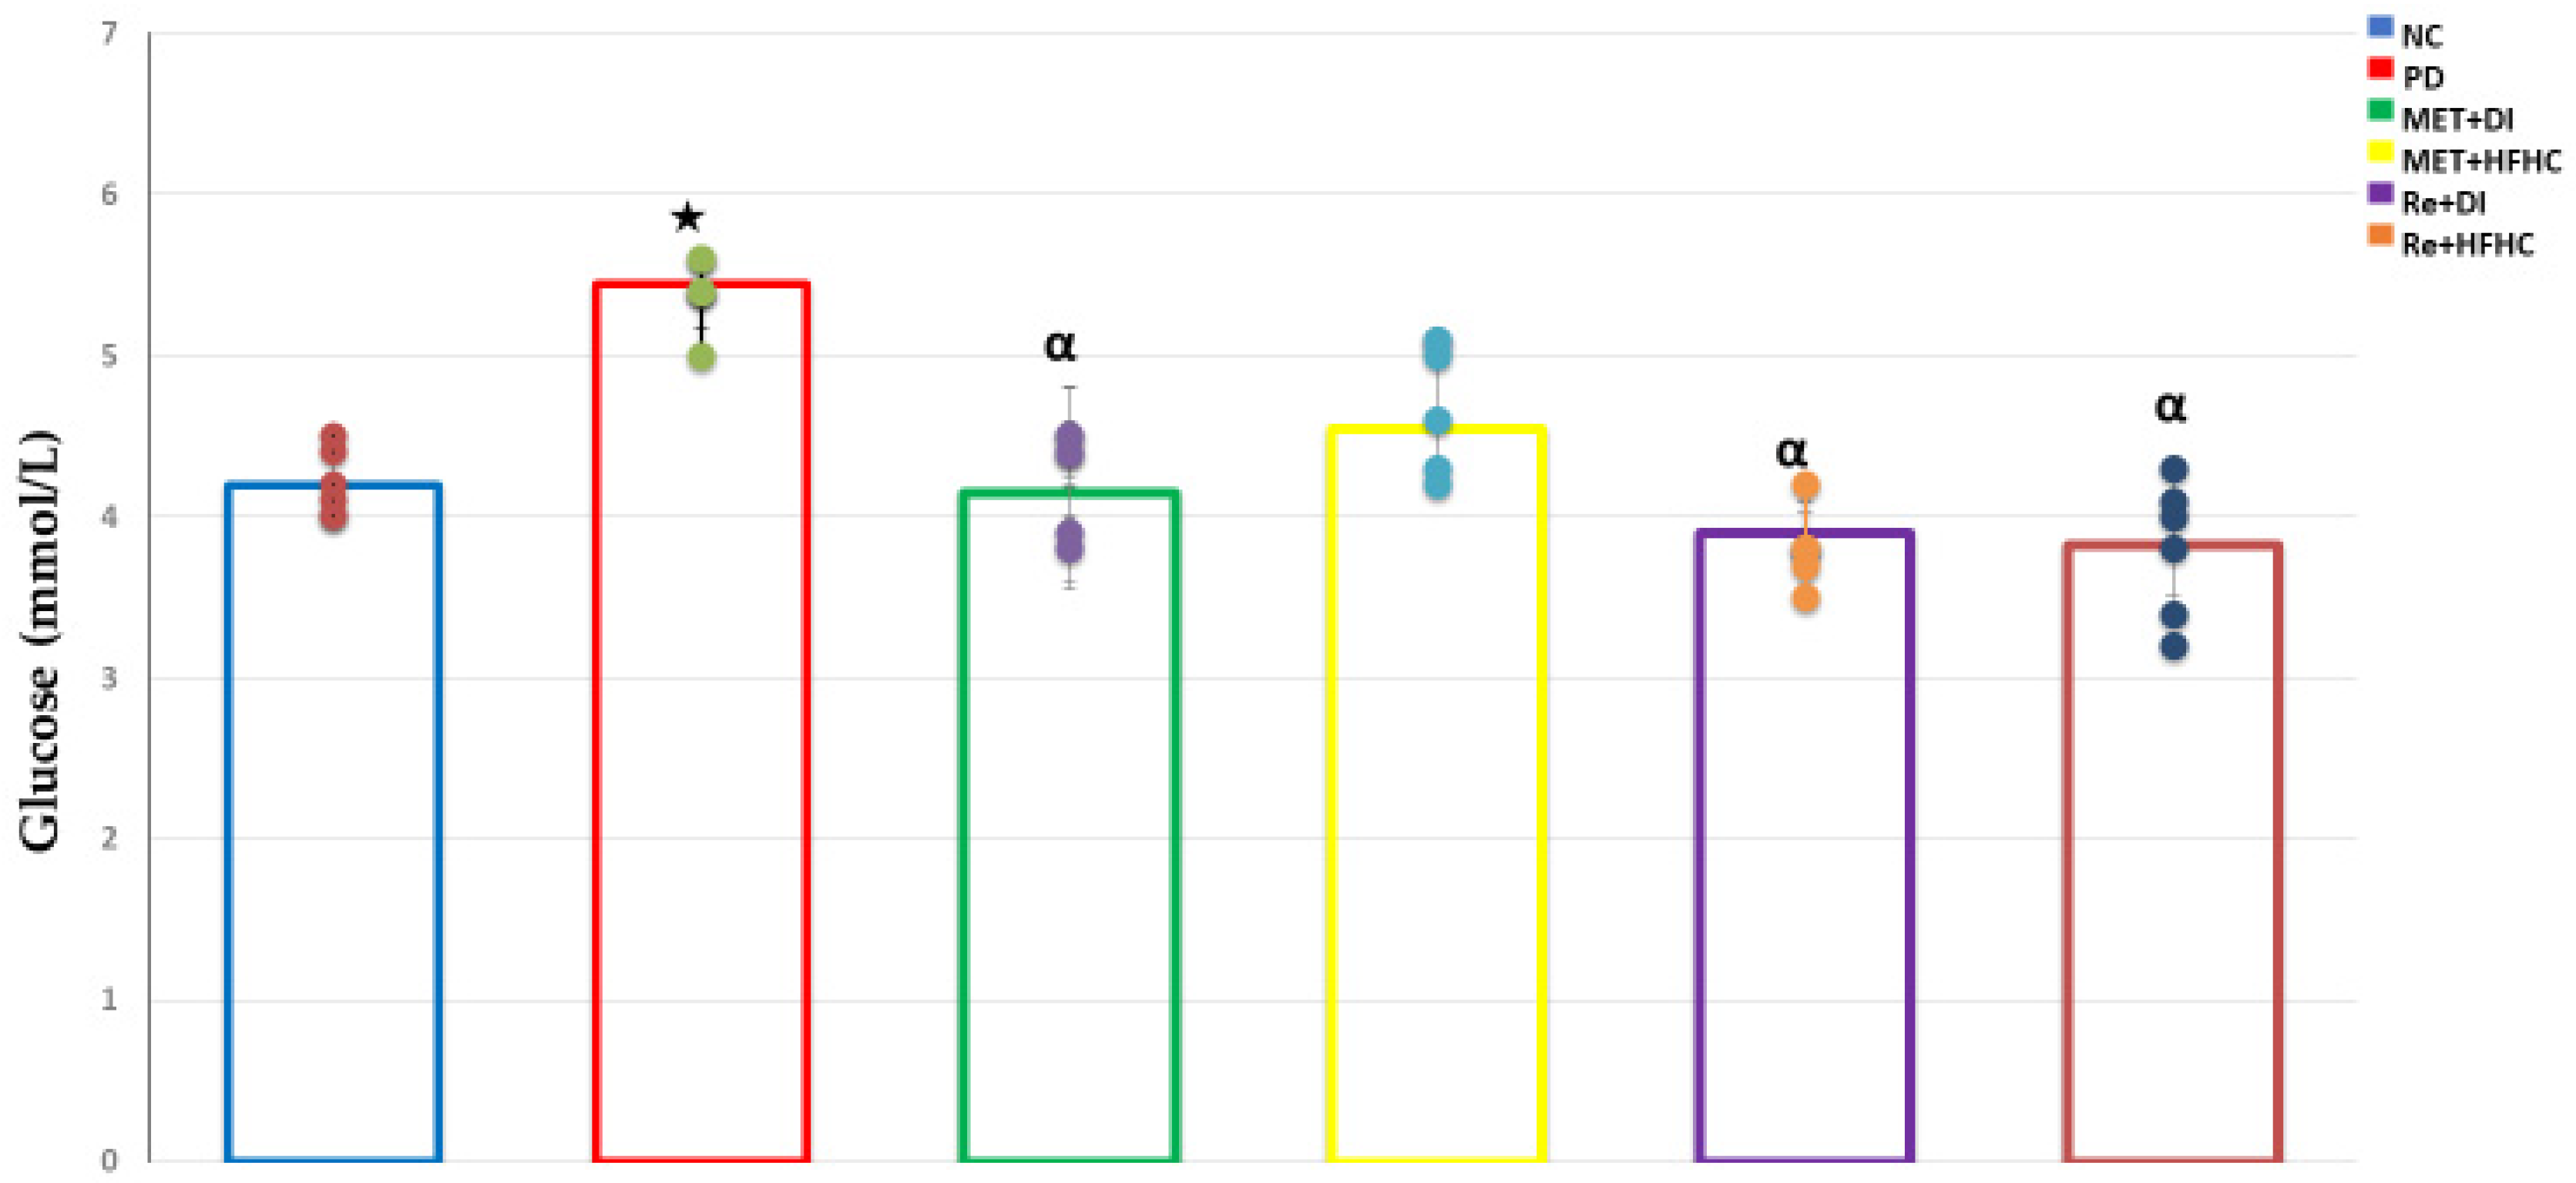
3.1. Fasting Blood Glucose Concentration

Figure 2 shows fasting blood glucose concentrations in the normal control (NC), prediabetic control (PD), metformin and diet intervention (MET + DI), metformin and high fat–high carbohydrate (MET + HFHC), rhenium (V) compound and diet intervention (Re + DI) and rhenium (V) compound and high fat–high carbohydrate (Re + HFHC) groups after 12 weeks of treatment. By comparison with the NC, there was a significant increase in fasting blood glucose concentration in the PD group (p < 0.05, Figure 2). The administration of the rhenium (V) compound in both the HFHC and diet intervention groups resulted in significant reduction in fasting blood glucose concentration by comparison to PD (p < 0.05, Figure 1). A similar observation was shown by the MET + DI treated group as compared to the PD group (see Figure 2).

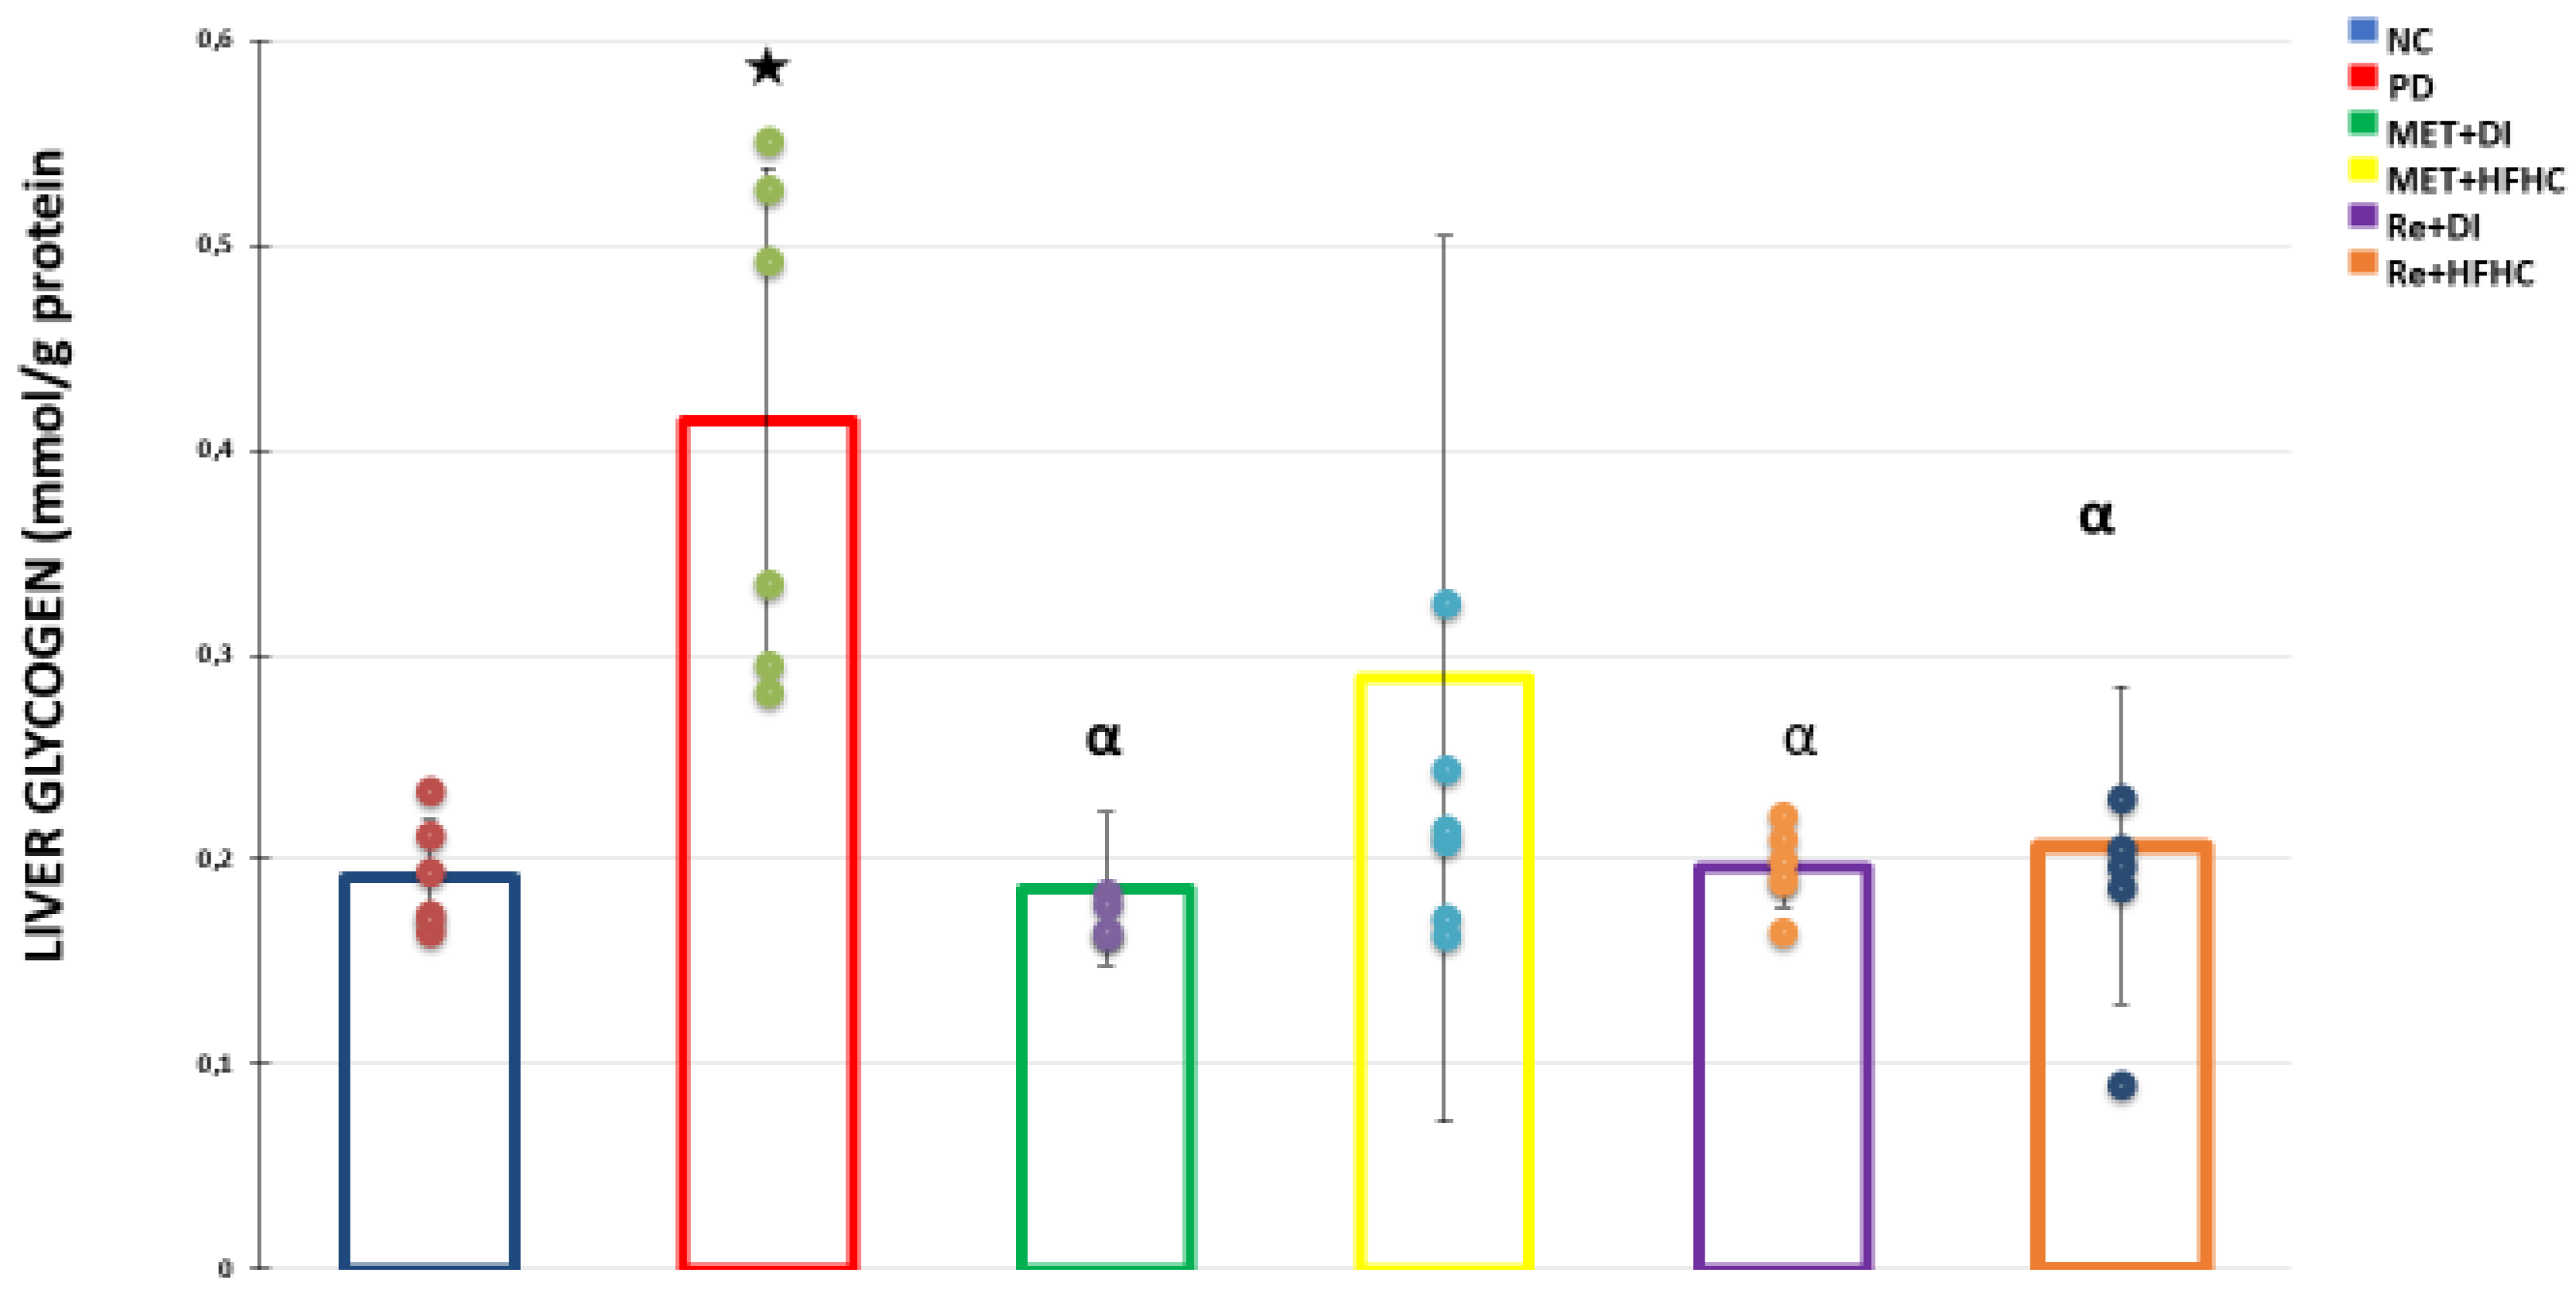
3.2. Liver Glycogen Concentration

Figure 3 shows liver glycogen levels in the normal control (NC), prediabetic control (PD), metformin and diet intervention (MET + DI), metformin and high fat–high carbohydrate (MET + HFHC), rhenium (V) compound and diet intervention (Re + DI) and rhenium (V) compound and high fat–high carbohydrate (Re + HFHC) groups after 12 weeks of treatment. By comparison with the NC group, the PD group showed a significant increase in liver glycogen concentration (p < 0.05) (Figure 3). The administration of rhenium (V) compound in both diet intervention and high fat–high carbohydrate groups resulted in a significant decrease of liver glycogen concentration when compared with the PD group (p < 0.05). A similar effect was observed with the MET + DI treated group when compared with the PD group (p < 0.05) (see Figure 3).

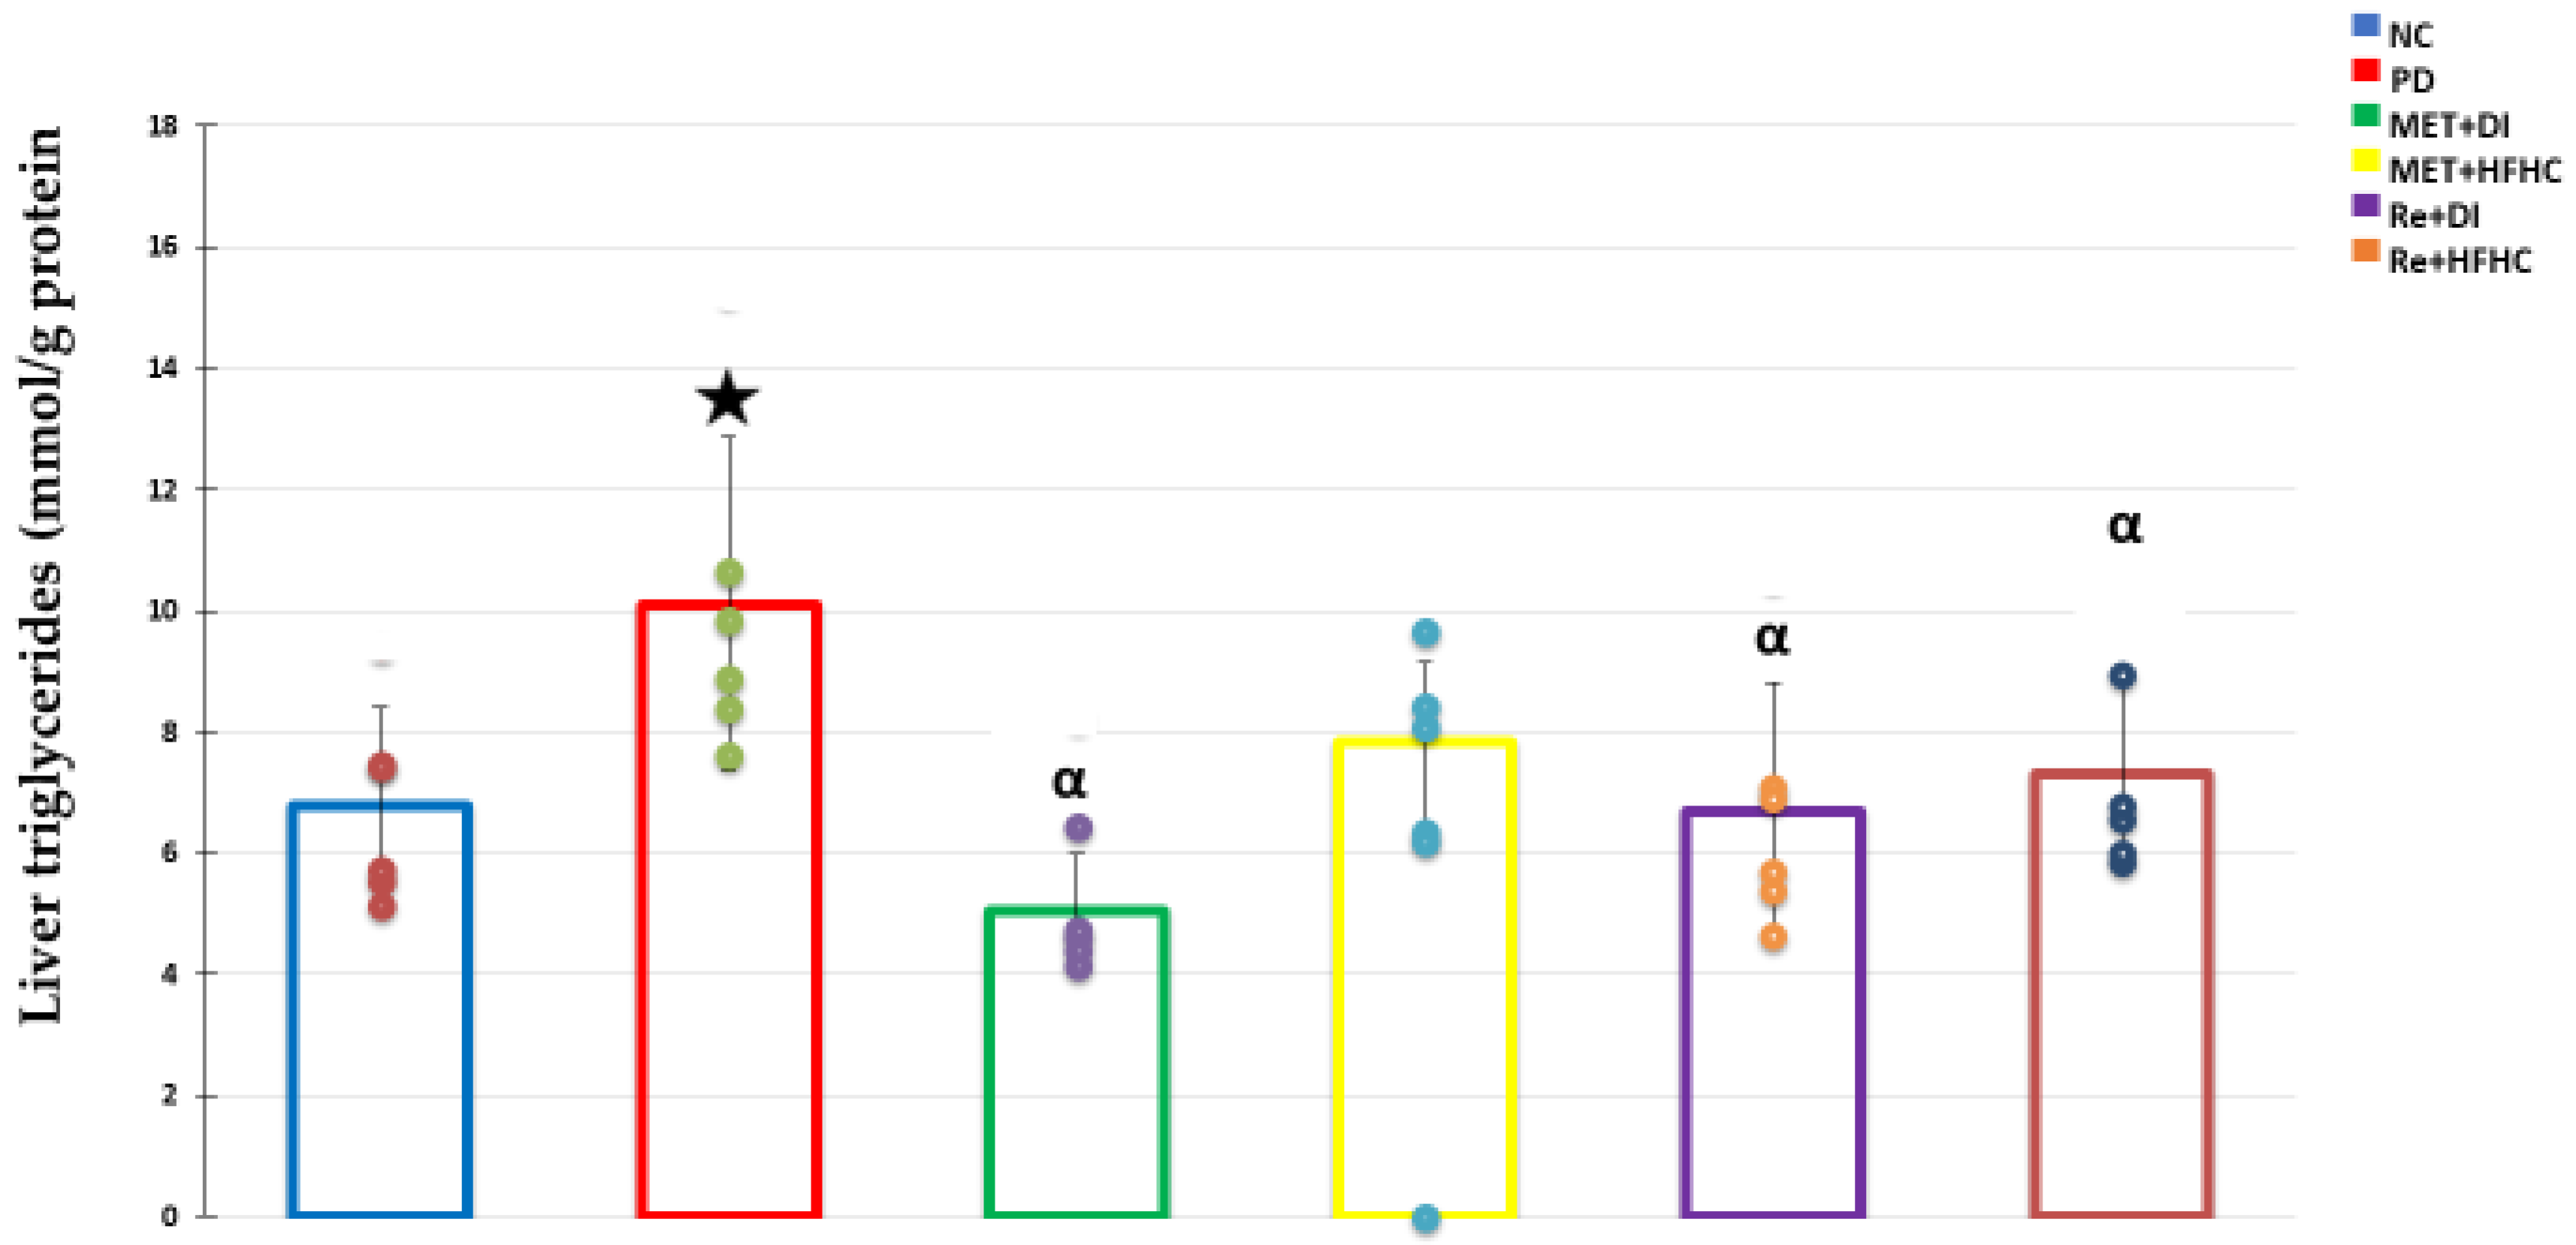
3.3. Liver Triglycerides (TGs) Concentration

Figure 4 shows liver triglyceride concentration in the normal control (NC), prediabetic control (PD), metformin and diet intervention (MET + DI), metformin and high fat–high carbohydrate (MET + HFHC), rhenium (V) compound and diet intervention (Re + DI) and rhenium (V) compound and high fat–high carbohydrate (Re + HFHC) groups after 12 weeks of treatment. By comparison with the NC group, the PD group showed a significant increase in liver triglycerides concentration (p < 0.05) (Figure 4). The administration of rhenium (V) compound in both diet intervention and high fat–high carbohydrate groups resulted in a significant decrease of liver triglycerides concentration when compared with the PD group (p < 0.05). A similar effect was observed with the MET + DI treated group when compared with the PD group (p < 0.05) (see Figure 4).

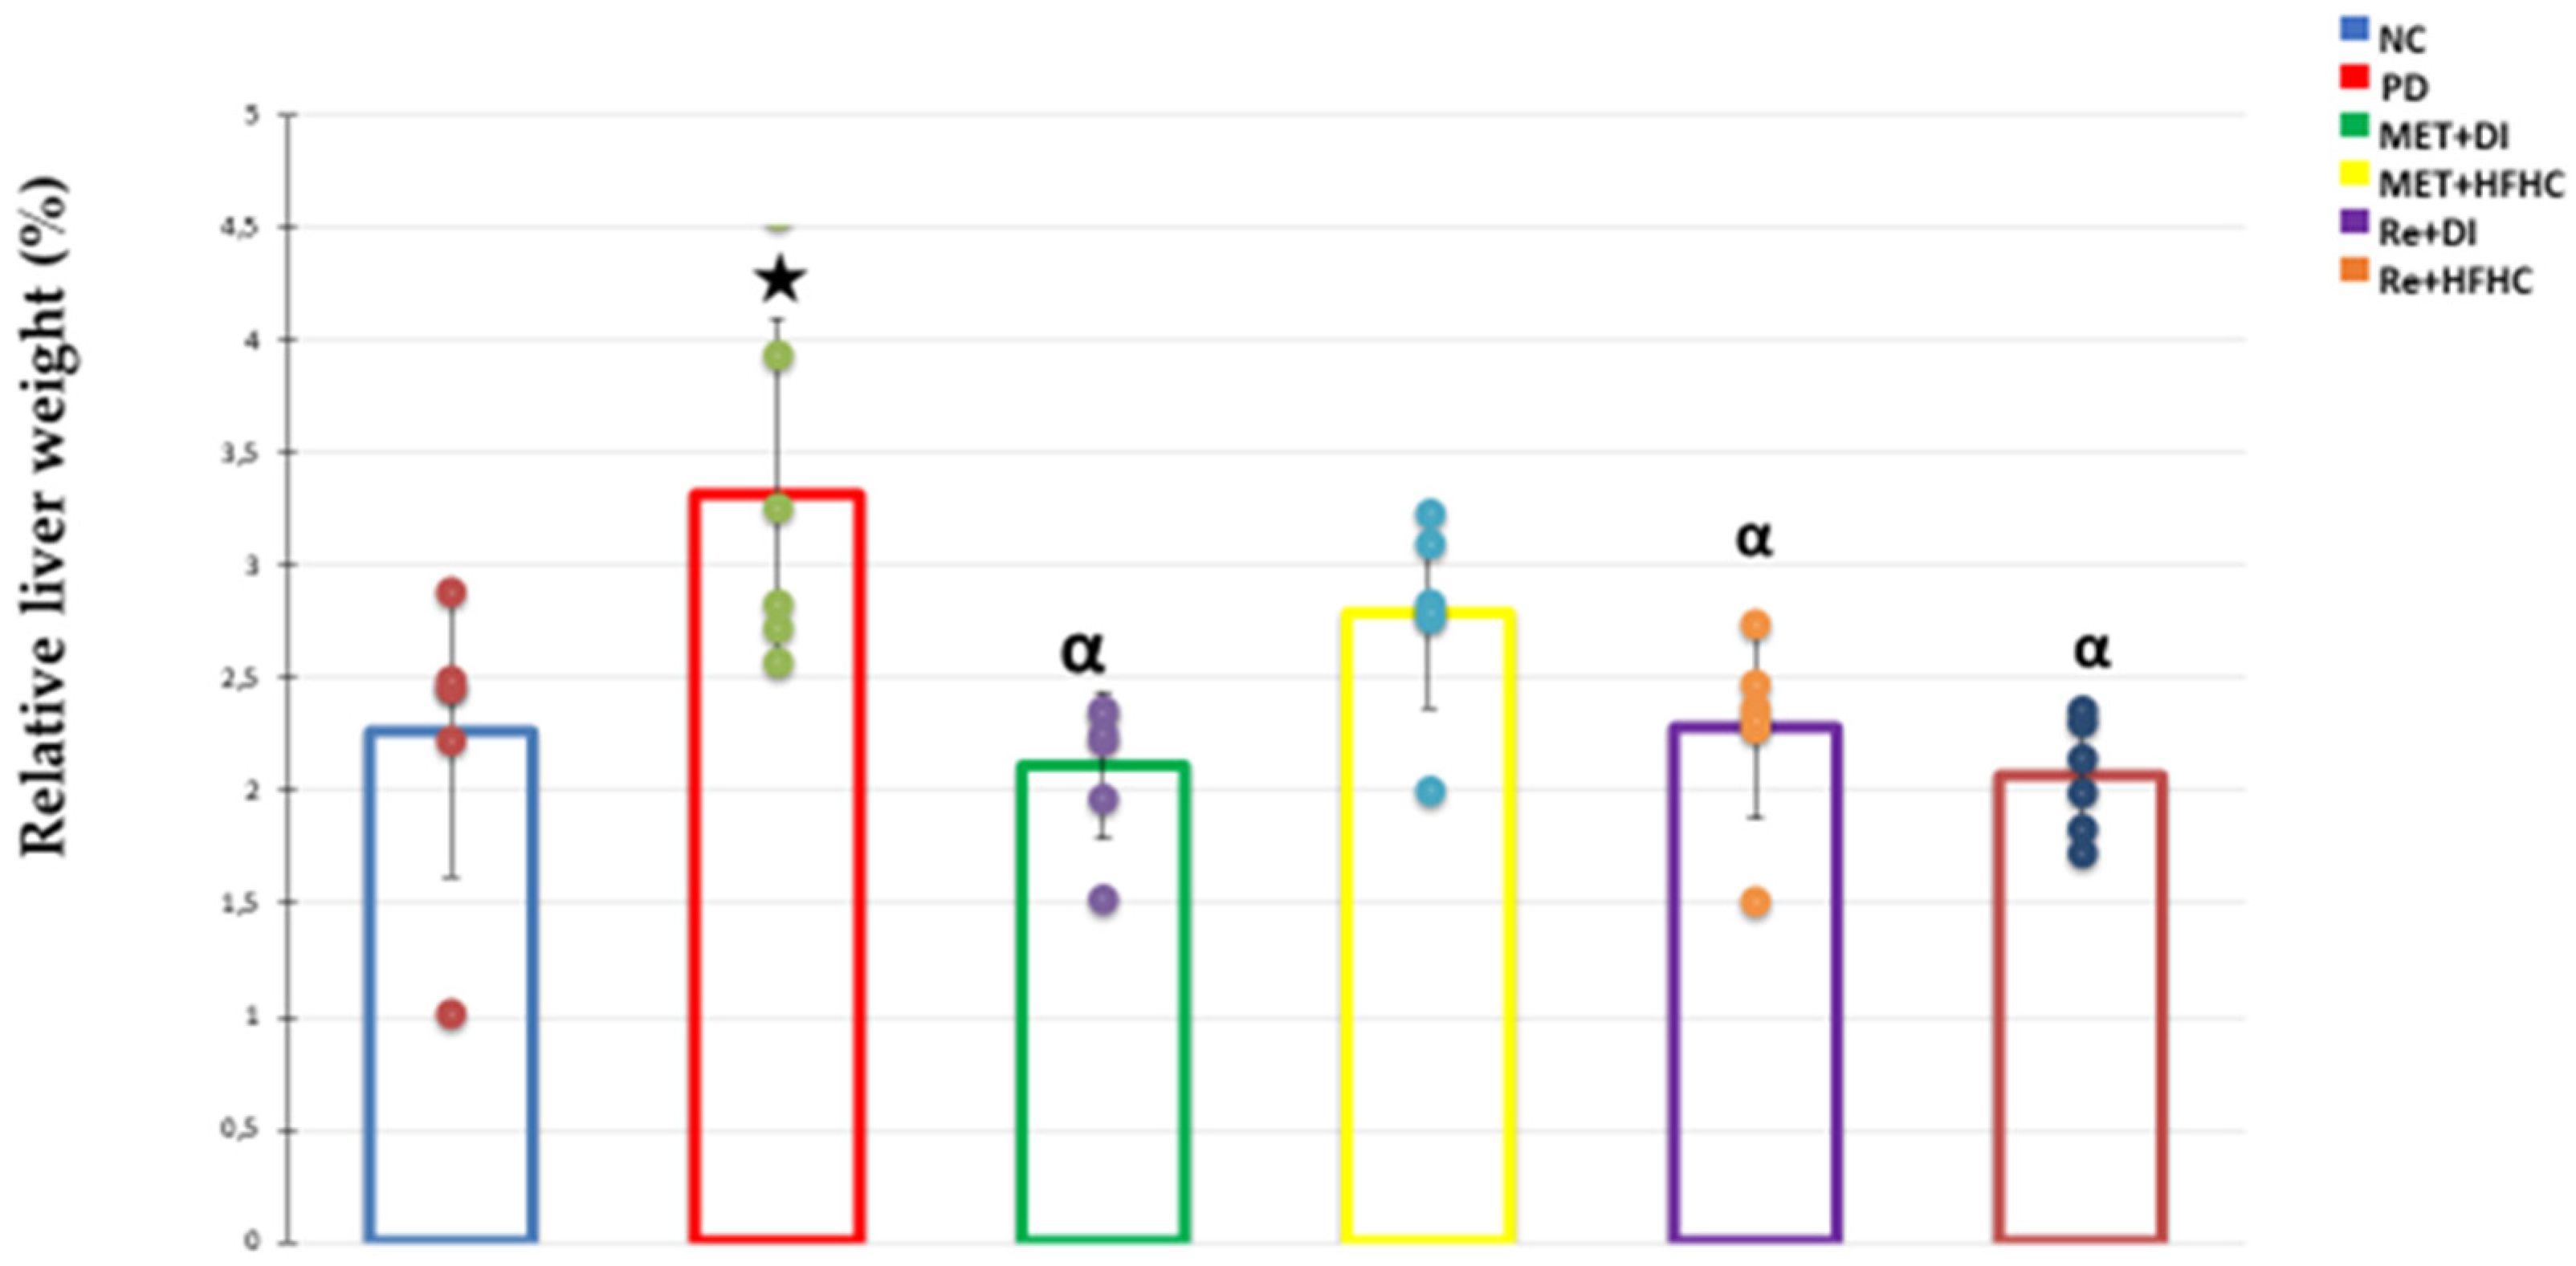
3.4. Relative Liver Weight

Figure 5 shows relative liver weight in the normal control (NC), prediabetic control (PD), metformin and diet intervention (MET + DI), metformin and high fat–high carbohydrate (MET + HFHC), rhenium (V) compound and diet intervention (Re + DI) and rhenium (V) compound and high fat–high carbohydrate (Re + HFHC) groups after 12 weeks of treatment. In comparison with the NC group, the PD group showed a significant increase in relative liver weight (p < 0.05) (Figure 5). The administration of rhenium (V) compound in both diet intervention and high fat–high carbohydrate groups resulted in a significant decrease of relative liver weight when compared with the PD group (p < 0.05). A similar effect was observed with the MET + DI treated group when compared with the PD group (p < 0.05) (see Figure 5).

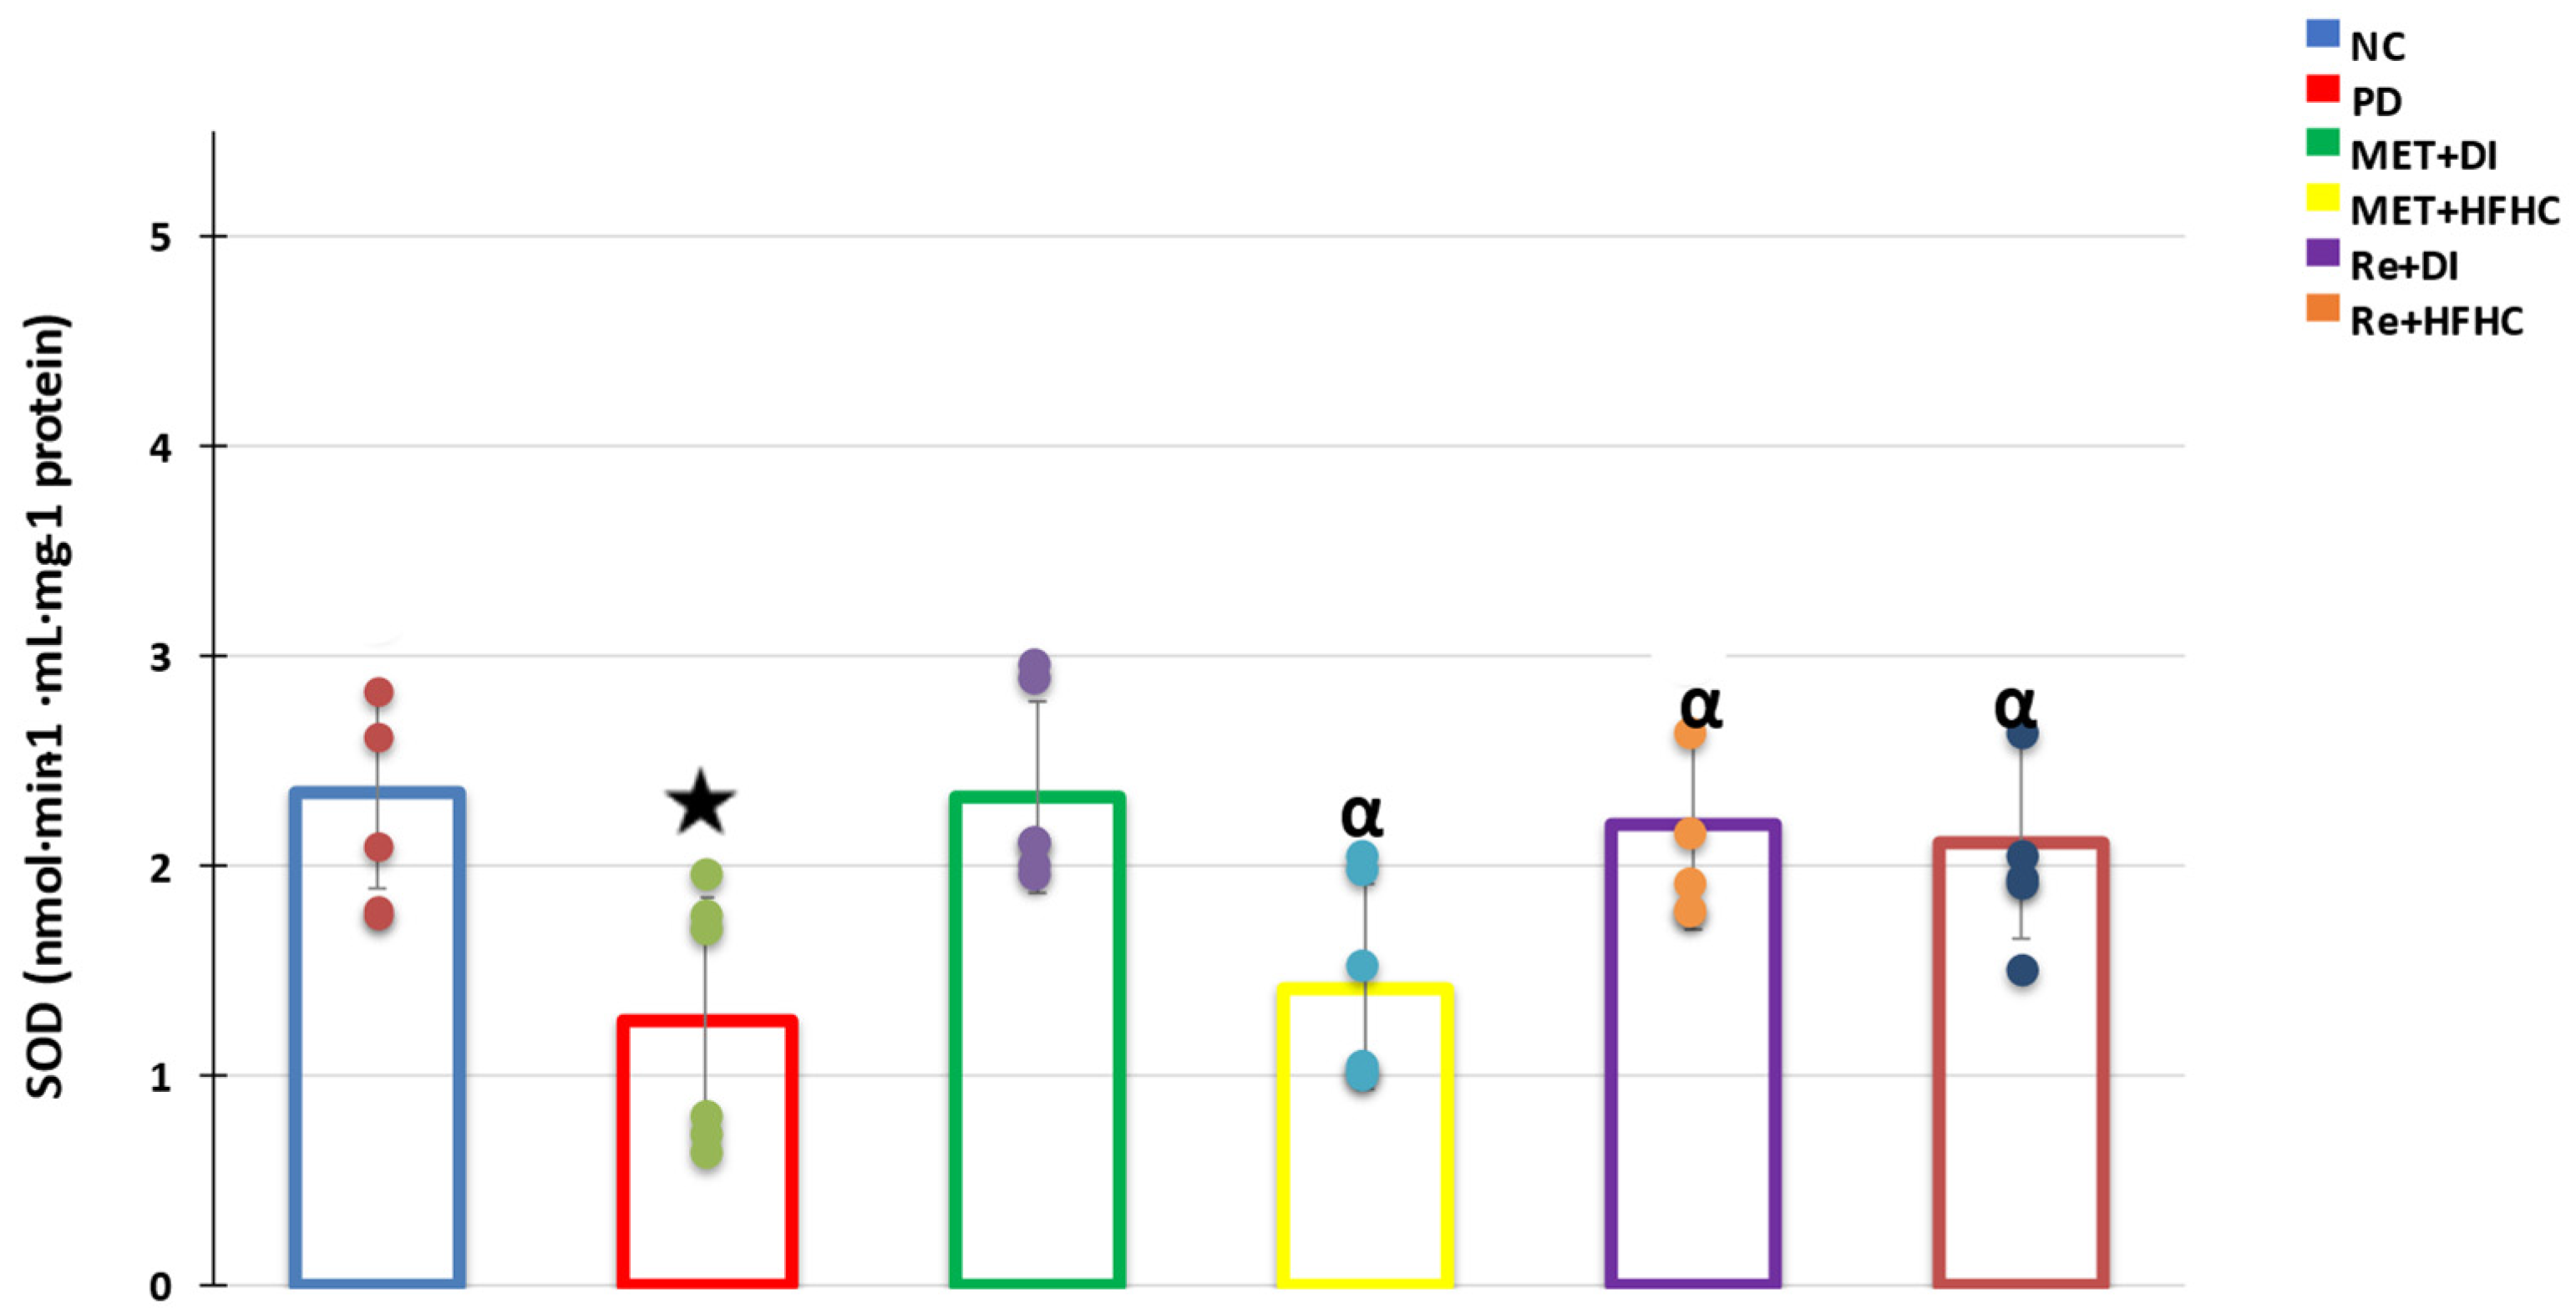
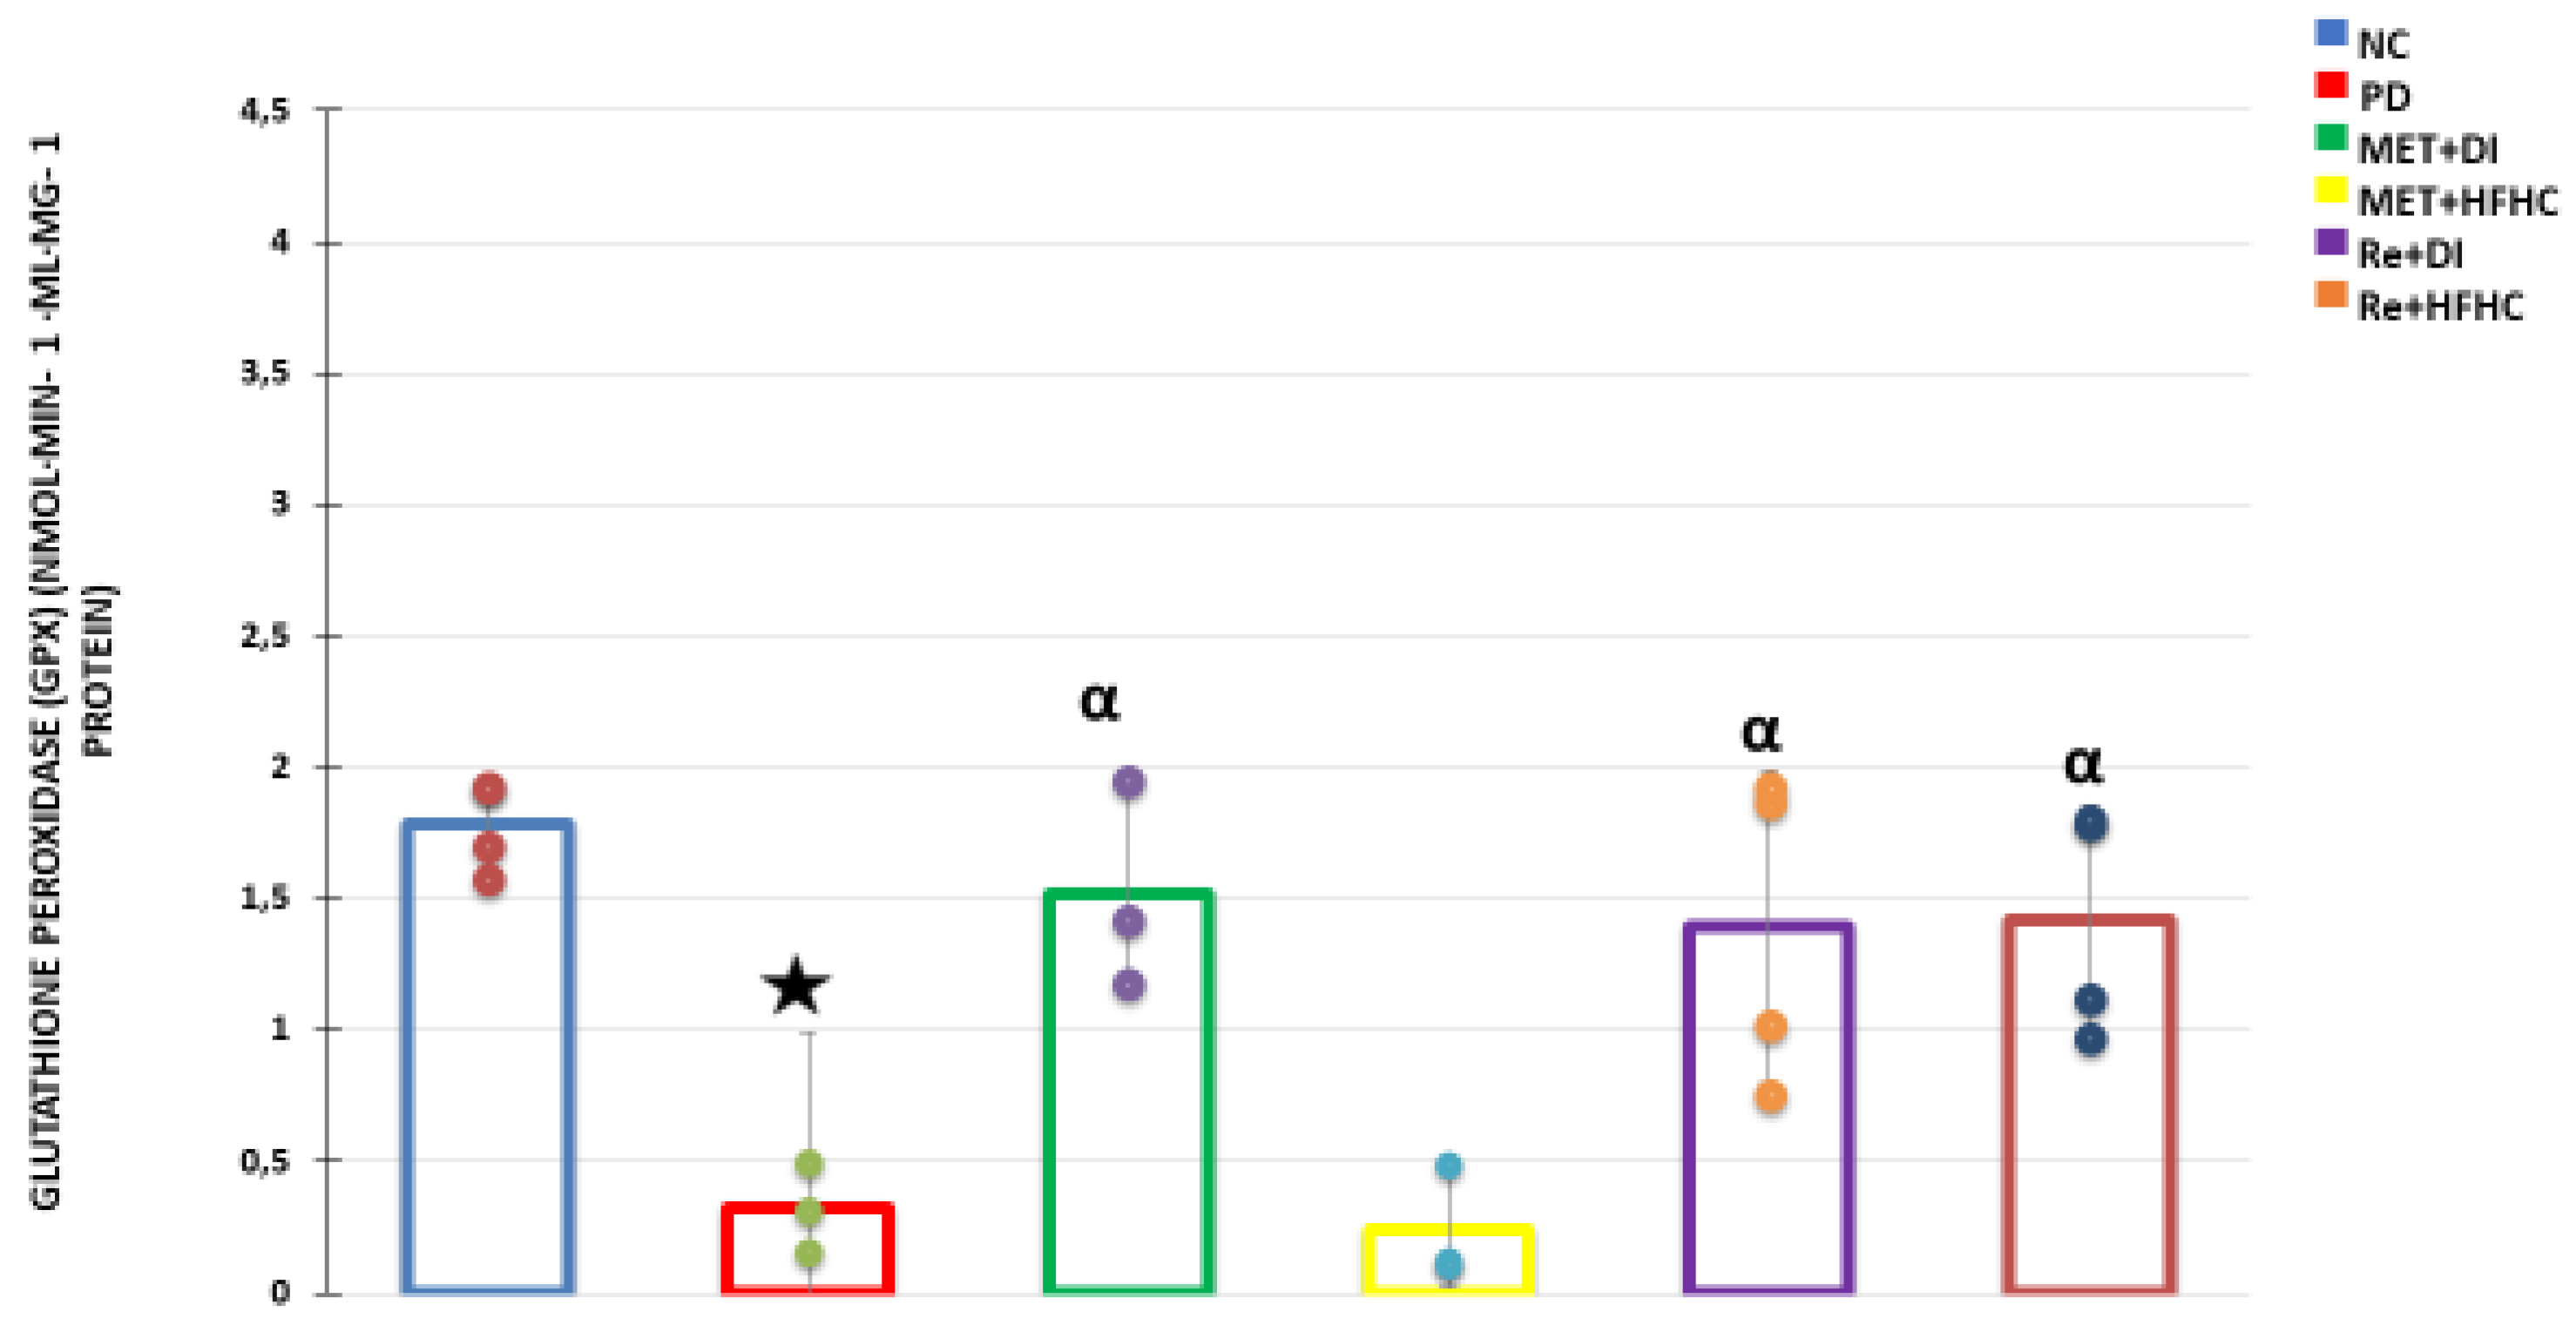
3.5. Liver Antioxidant Activity

Figure 6 shows antioxidant SOD activity in the normal control (NC), prediabetic control (PD), metformin and diet intervention (MET + DI), metformin and high fat–high carbohydrate (MET + HFHC), rhenium (V) compound and diet intervention (Re + DI) and rhenium (V) compound and high fat–high carbohydrate (Re + HFHC) groups after 12 weeks of treatment. In comparison with the NC group, the PD group showed a significant decrease in SOD activity (p < 0.05) (Figure 6). The administration of rhenium (V) compound in both diet intervention and high fat–high carbohydrate groups resulted in a significant increase of SOD activity when compared with the PD group (p < 0.05). A similar effect was observed with the MET + DI treated group when compared with the PD group (p < 0.05) (see Figure 6).
Figure 6 shows antioxidant GPx activity in the normal control (NC), prediabetic control (PD), metformin and diet intervention (MET + DI), metformin and high fat–high carbohydrate (MET + HFHC), rhenium (V) compound and diet intervention (Re + DI) and rhenium (V) compound and high fat–high carbohydrate (Re + HFHC) groups after 12 weeks of treatment. In comparison with the NC group, the PD group showed a significant decrease in GPx activity (p < 0.05) (Figure 7). The administration of rhenium (V) compound in both diet intervention and high fat–high carbohydrate groups resulted in a significant increase of GPx activity when compared with the PD group (p < 0.05). A similar effect was observed with the MET + DI treated group when compared with the PD group (p < 0.05) (see Figure 7).

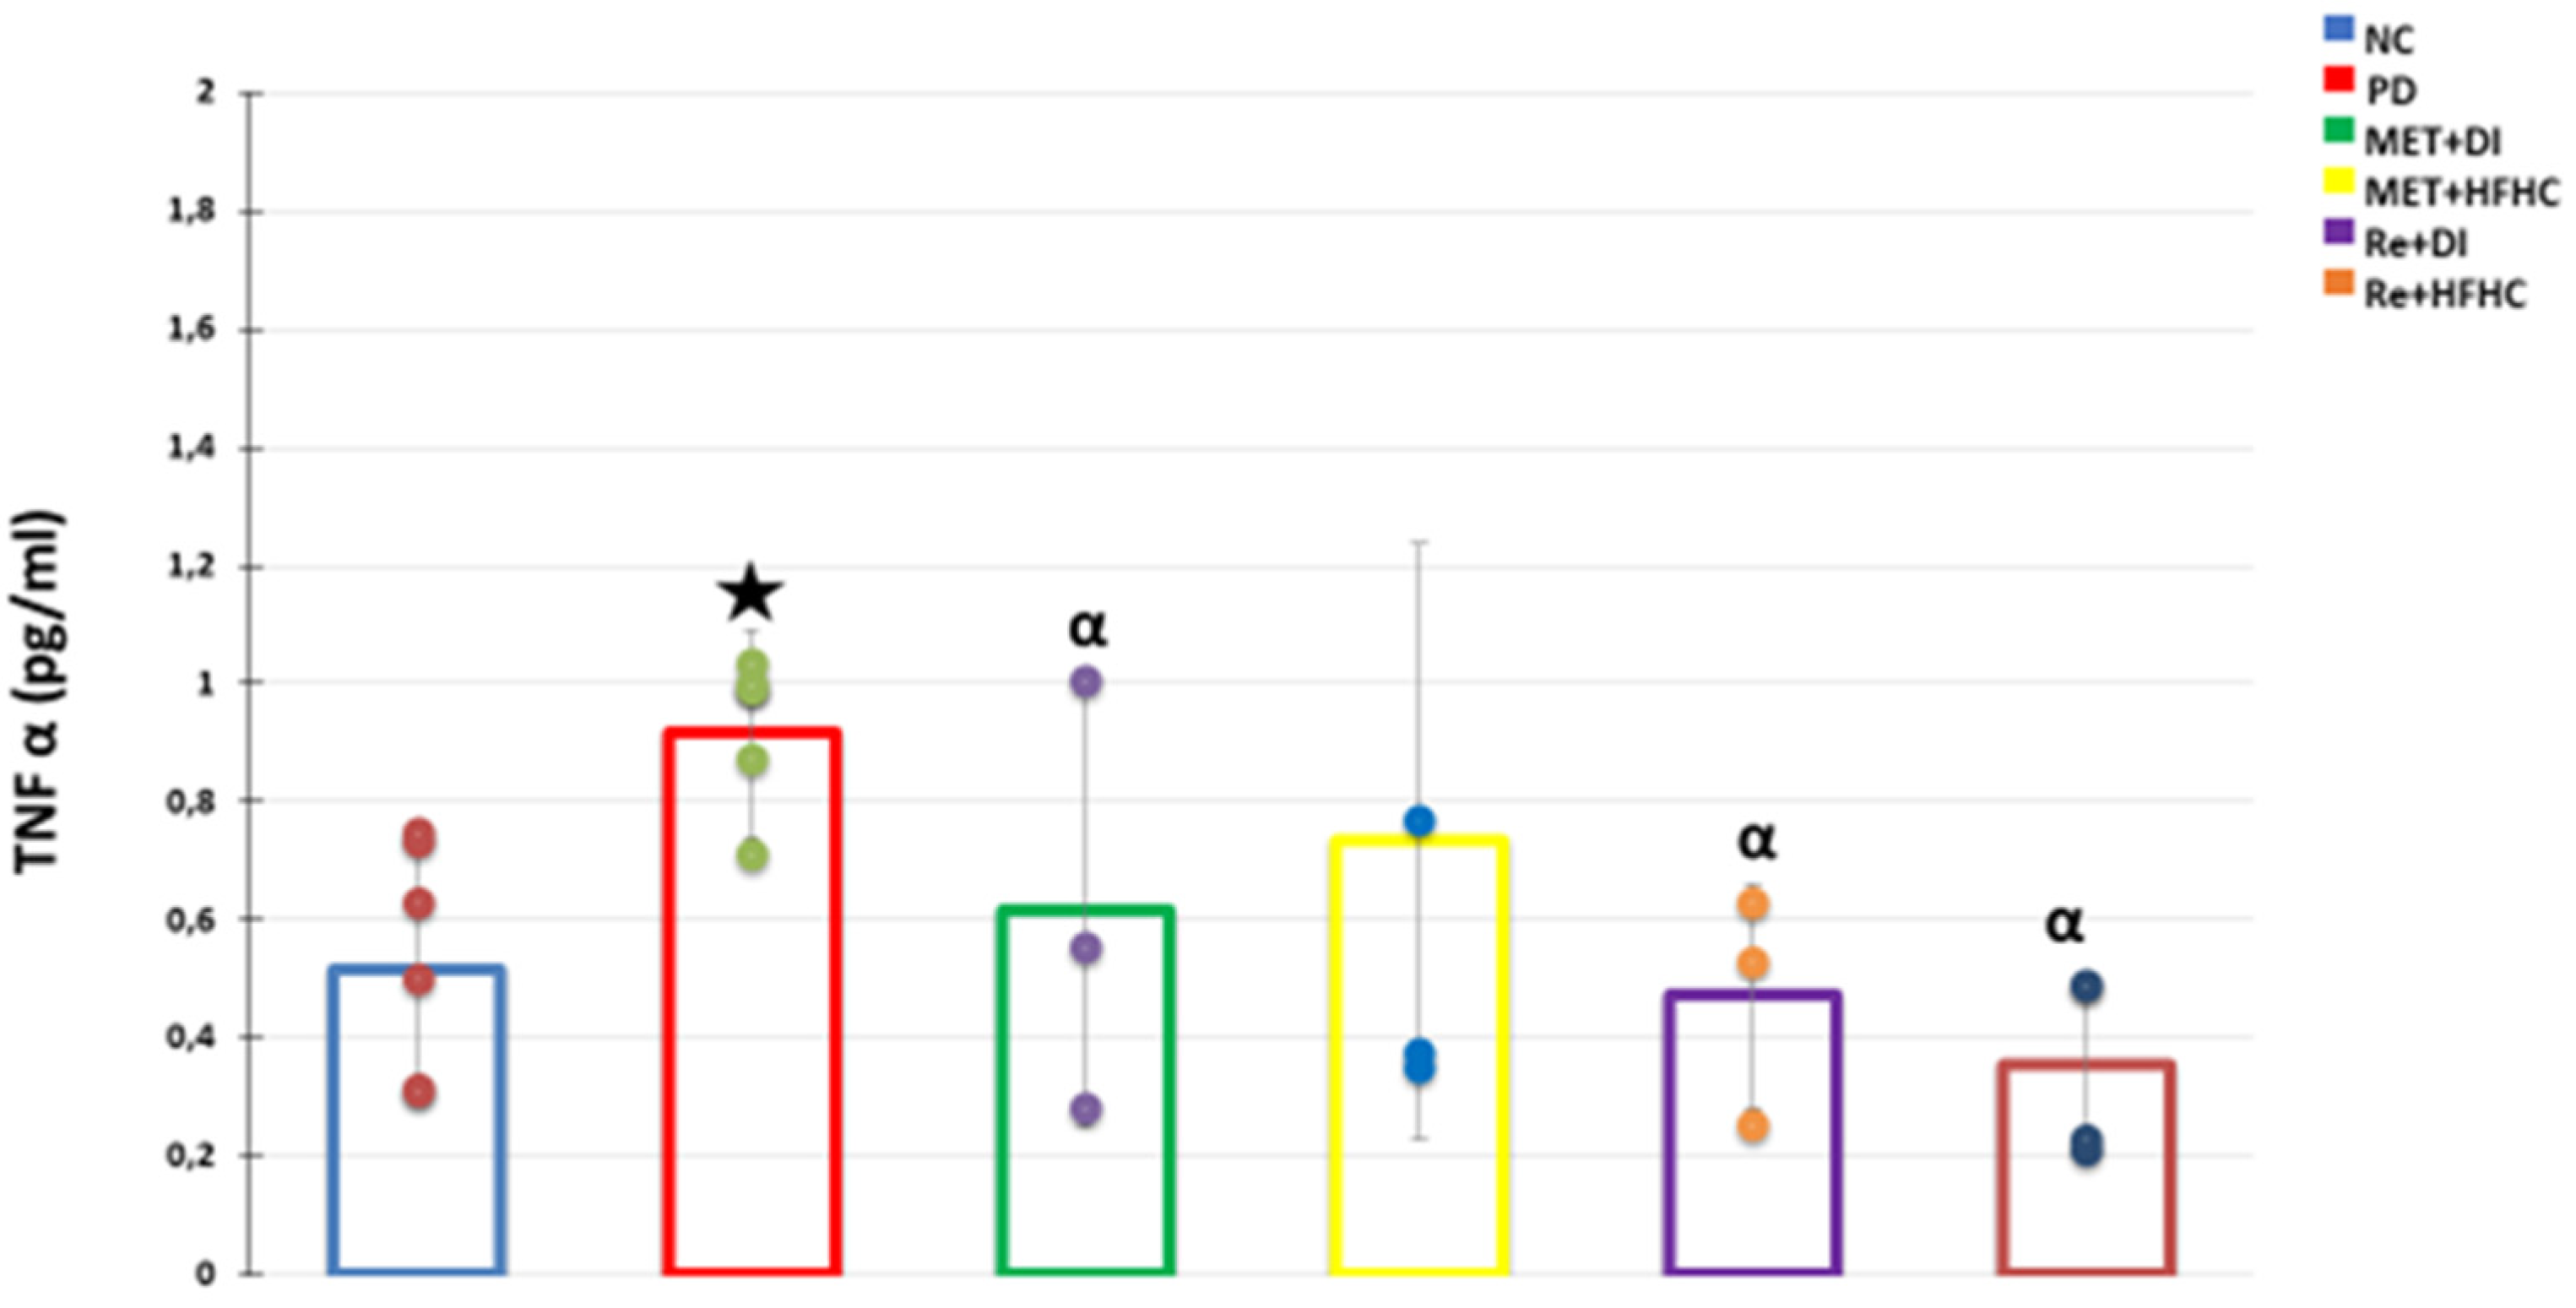
3.6. Liver TNF α Concentration

Figure 8 shows TNF α concentrations in the normal control (NC), prediabetic control (PD), metformin and diet intervention (MET + DI), metformin and high fat–high carbohydrate (MET + HFHC), rhenium (V) compound and diet intervention (Re + DI) and rhenium (V) compound and high fat–high carbohydrate (Re + HFHC) groups after 12 weeks of treatment. In comparison with the NC group, the PD group showed a significant increase in TNF α concentration (p < 0.05) (Figure 8). The administration of rhenium (V) compound in both diet intervention and high fat–high carbohydrate groups resulted in a significant decrease of TNF α concentration when compared with the PD group (p < 0.05). A similar effect was observed with the MET + DI treated group when compared with the PD group (p < 0.05) (see Figure 8).

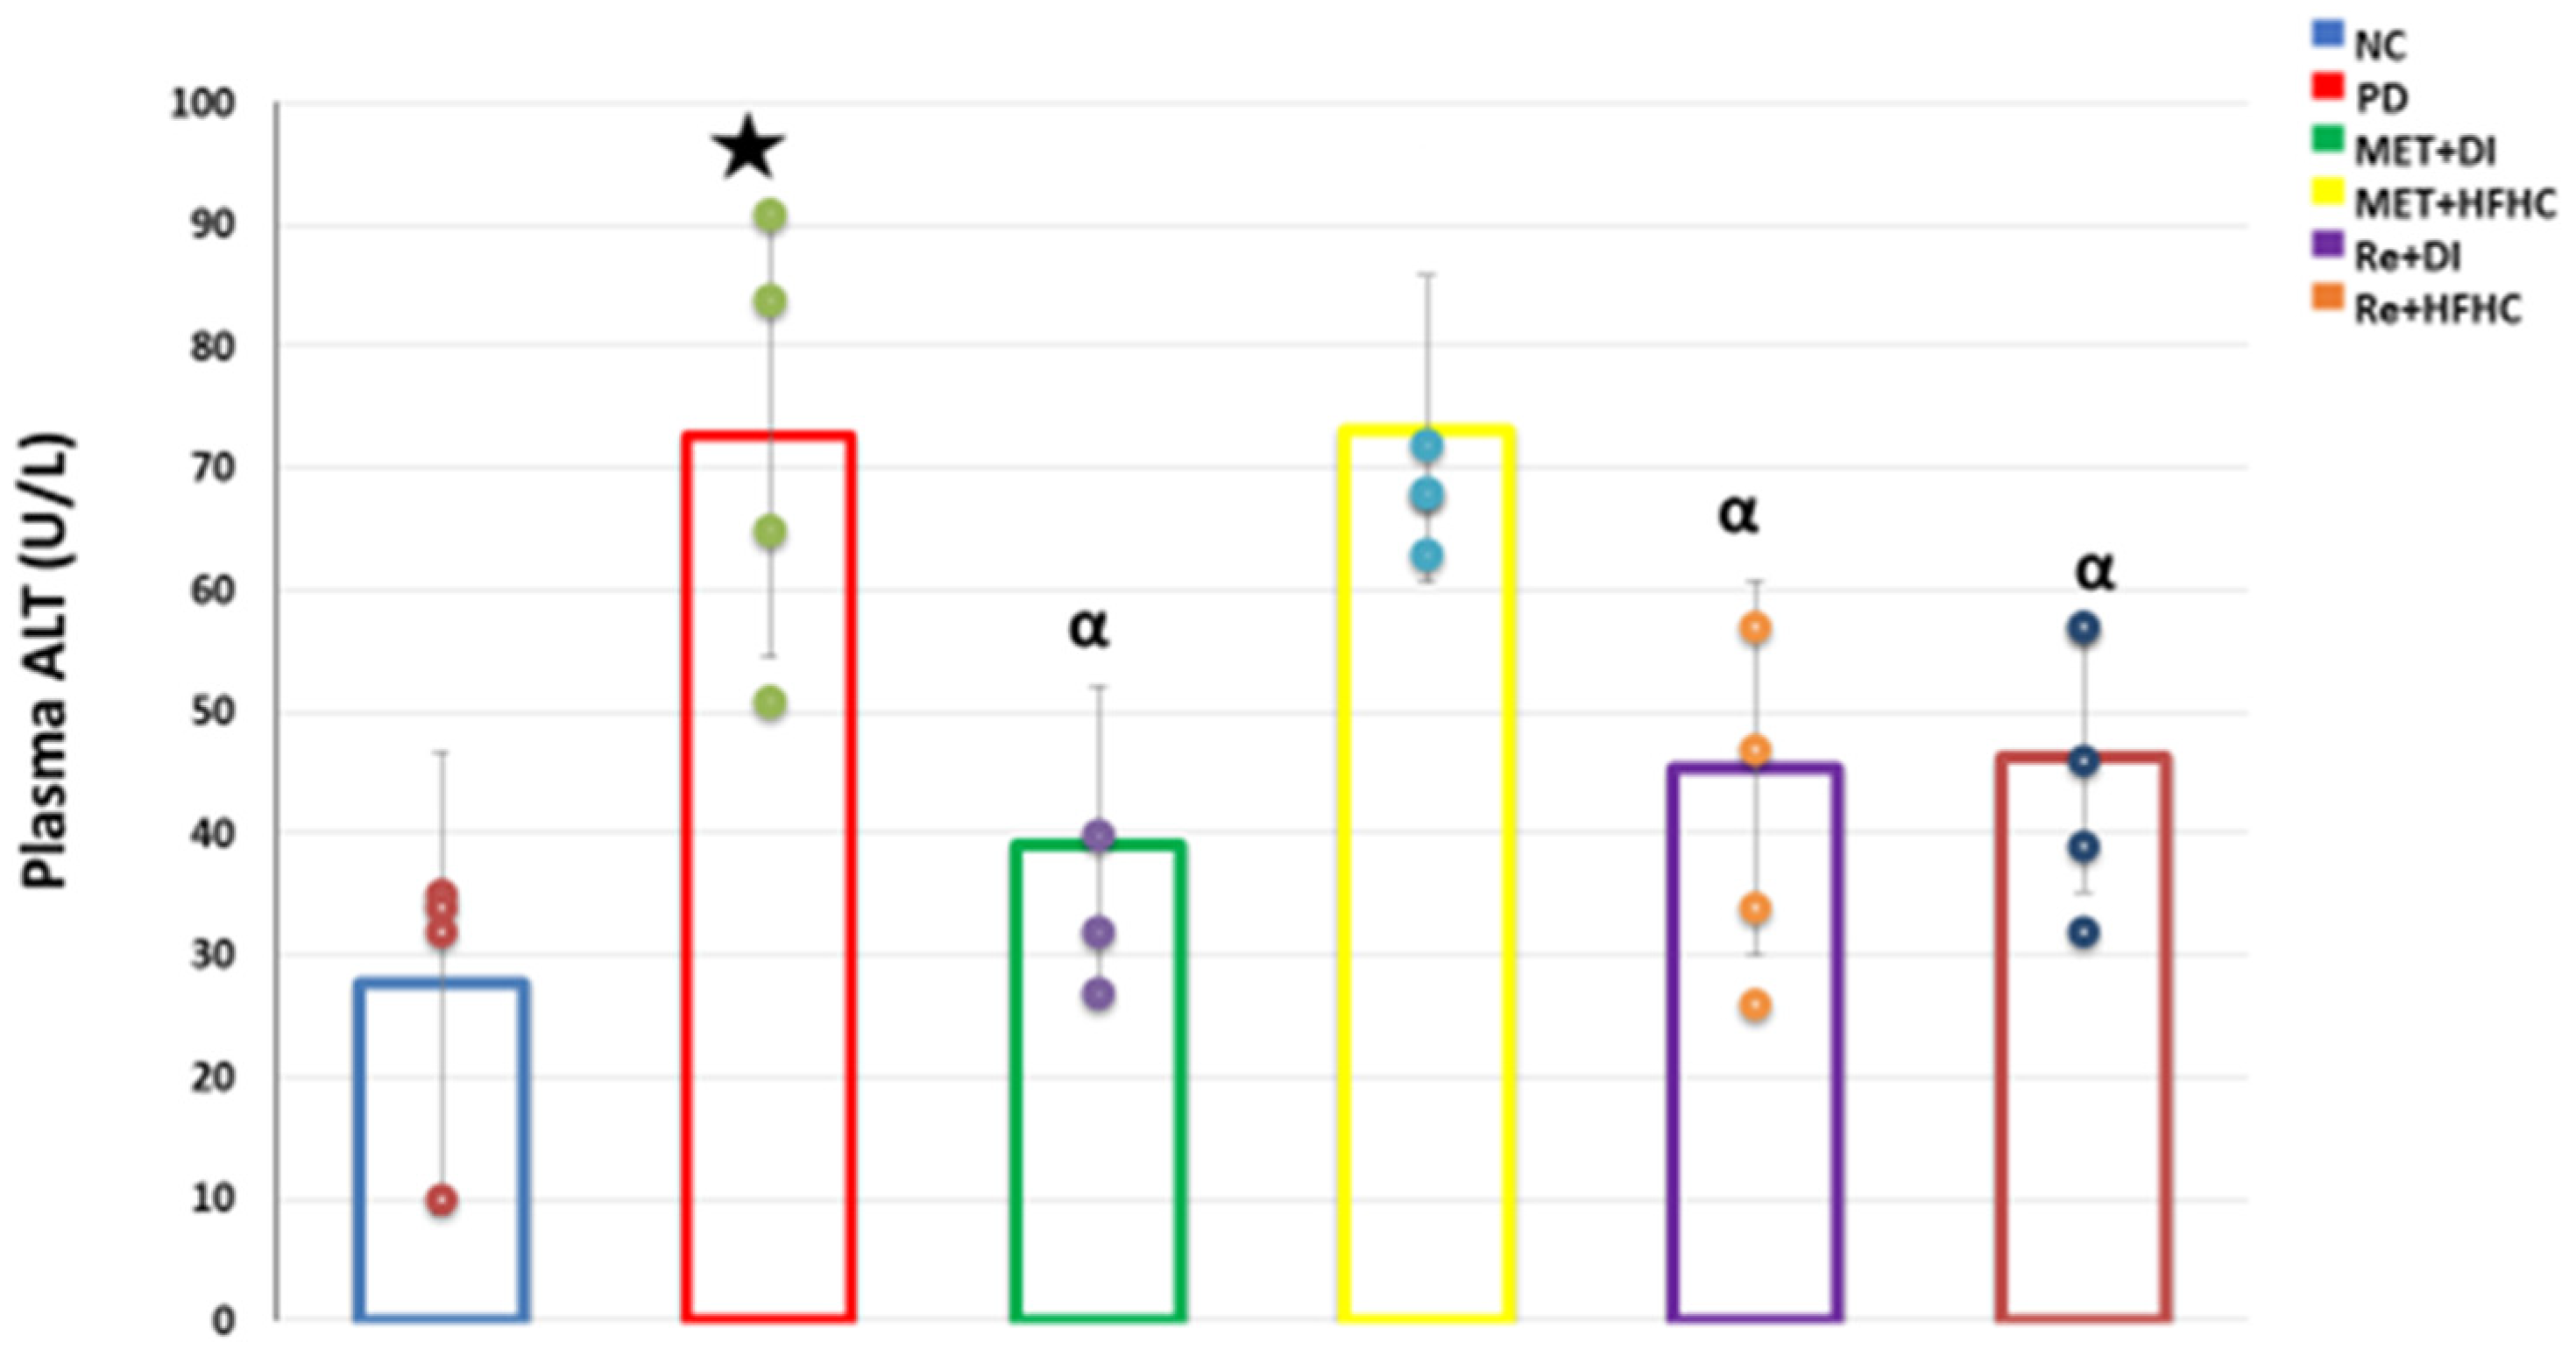
3.7. Plasma ALT Concentration

Figure 9 shows plasma ALT concentration in the normal control (NC), prediabetic control (PD), metformin and diet intervention (MET + DI), metformin and high fat–high carbohydrate (MET + HFHC), rhenium (V) compound and diet intervention (Re + DI) and rhenium (V) compound and high fat–high carbohydrate (Re + HFHC) after 12 weeks of treatment. In comparison with the NC group, the PD group showed a significant increase in plasma ALT concentration (p < 0.05) (Figure 9). The administration of rhenium (V) compound in both diet intervention and high fat–high carbohydrate groups resulted in a significant decrease of plasma ALT concentration when compared with the PD group (p < 0.05). A similar effect was observed with the MET + DI treated group when compared with the PD group (p < 0.05) (see Figure 9).

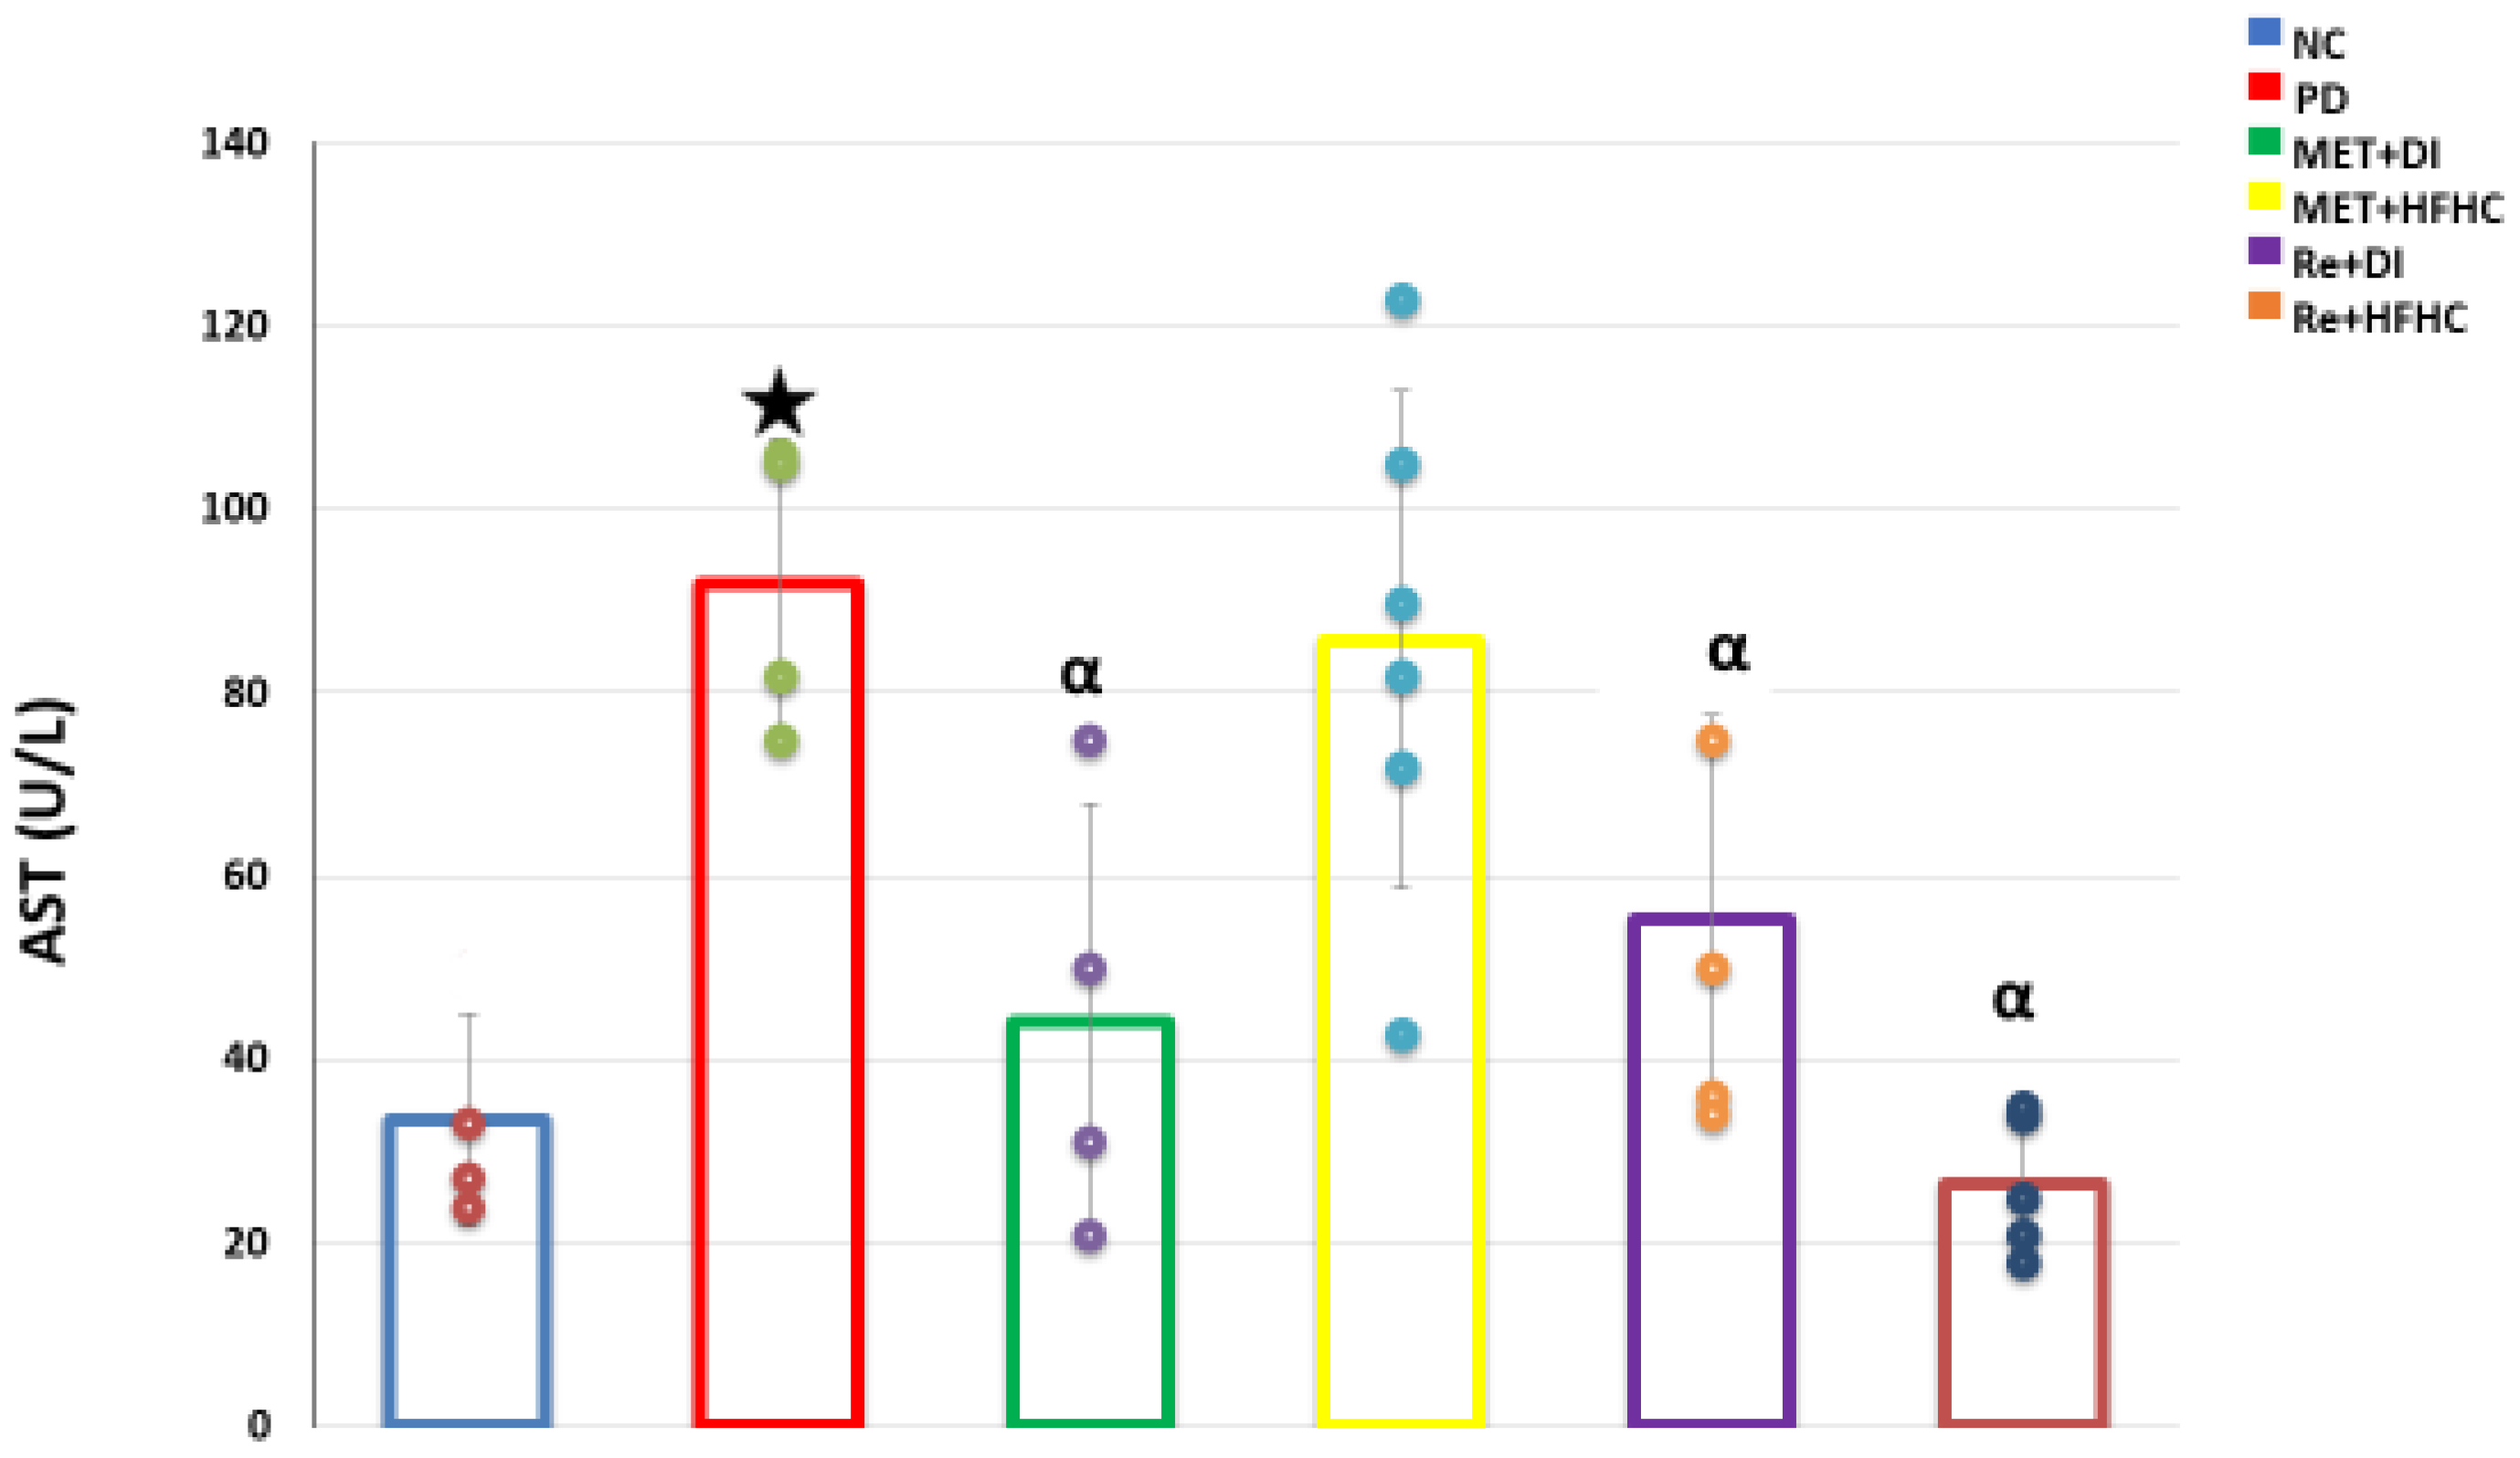
3.8. Plasma AST Concentration

Figure 10 shows plasma AST concentration in the normal control (NC), prediabetic control (PD), metformin and diet intervention (MET + DI), metformin and high fat–high carbohydrate (MET + HFHC), rhenium (V) compound and diet intervention (Re + DI) and rhenium (V) compound and high fat–high carbohydrate (Re + HFHC) groups after 12 weeks of treatment. In comparison with the NC group, the PD group showed a significant increase in plasma AST concentration (p < 0.05) (Figure 10). The administration of rhenium (V) compound in both diet intervention and high fat–high carbohydrate groups resulted in a significant decrease of plasma AST concentration when compared with the PD group (p < 0.05). A similar effect was observed with the MET + DI treated group when compared with the PD group (p < 0.05) (see Figure 10).

4. Discussion

There is growing evidence that associates prediabetes with disorders that were previously thought to co-exist with type 2 diabetes [25,26]. These disorders include impaired glucose homeostasis, dyslipidemia, NAFLD and cardiovascular disease [27,28]. The development of NAFLD is strongly linked with chronic consumption of high calorie diets and is considered the most frequent liver disease in developing countries [28]. Prediabetes is associated with insulin resistance, which can increase peripheral lipolysis, triglyceride synthesis and hepatic uptake of free fatty acids, which ultimately leads to NAFLD [27,29]. Studies have revealed that individuals with prediabetes and NAFLD have a higher risk of progressing to T2DM [27].
Studies have shown that anti-diabetic drugs can be used to manage NAFLD and to prevent it from developing into non-alcoholic steatohepatitis (NASH) [12,30]. Metformin has been used to treat NAFLD, as it is known to increase insulin action and reduce plasma glucose levels [31]. However, metformin has been shown to reach optimal efficacy when combined with lifestyle modifications that increase physical activity and lower caloric intake [30,32]. However, studies on patients show that there is an over-reliance on pharmacological interventions leading to a neglect on the lifestyle modification that results in reduced efficacy of the drugs [33]. Therefore, there is a great need for drugs which could perhaps assist those individuals who struggle with lifestyle modification [15,18].
There is a growing interest in using transition metal compounds to treat complications associated with metabolic disorders due to their high biological activity [9,34]. Our novel transition metal compound, rhenium (V) compound with uracil-derived ligands, has been previously shown to have anti-diabetic and anti-oxidant effects [20]. However, the effects of this metal-based compound on prediabetes induced NAFLD are yet to be investigated. In this study, we sought to further investigate the effects of this rhenium (V) compound on selected liver function markers in diet-induced prediabetic rats.
To maintain an individual’s health, processes such as glucose homeostasis are tightly regulated to meet the energy needs for important organs. The liver plays an important role in the maintenance of glucose homeostasis by being involved many pathways of glucose metabolism including glycogenesis, glycogenolysis, glycolysis and gluconeogenesis [6,35]. During fasting conditions, the liver has a vital role in producing glucose through gluconeogenesis as a fuel for other tissues, such as the brain, red blood cells and muscles [35]. The main function of insulin is to inhibit glycogenolysis and gluconeogenesis in the hepatocytes [33]. However, in the prediabetic state, there is increased energy demand due to insulin resistance in some tissues, while there is also dysregulation of metabolic pathways such as gluconeogenesis [36,37]. Gluconeogenesis is increased in the liver due to peripheral insulin resistance [38]. Insulin-resistant muscle and other tissues require energy; therefore, signals are sent to the liver to produce glucose [39,40]. Gluconeogenesis is activated, resulting in glucose production from the liver to the plasma, while hepatic steatosis leads to increased hepatic gluconeogenesis [41,42]. Indeed, the untreated prediabetic group in this study showed high fasting plasma glucose levels. This could be due to unregulated gluconeogenesis and energy demand from insulin-resistant peripheral tissues [32,43]. Furthermore, the treated groups with rhenium (V) compound were shown to have reduced plasma glucose in both the presence and absence of dietary intervention. The rhenium (V) compound has been previously shown to restore peripheral insulin sensitivity through increased GLUT 4 expression, thus ameliorating insulin sensitivity and improving glycemic control [37]. Another transition metal with an organic ligand such as the dioxidovanadium complex (V) for this compound was shown to lower plasma glucose by increasing glucose transport and insulin-receptor tyrosine-kinase activity in NAFLD [44].
The hepatocytes play a vital role in regulating carbohydrate metabolism [45]. The storage of glycogen in the liver during feeding conditions provides a storage form of glucose that can be used during fasting periods. Normally, stored glycogen is critical for maintaining glucose homeostasis in individuals during an overnight fasting period [11,45]. However, in the prediabetic state, the liver has to store glucose due to insulin resistance in other tissues such as muscle and adipose tissues [11]. GLUT 2 transports glucose independently of insulin, and this results in a higher rate of hepatic glycogenesis occurring due to the shunting of glucose during the prediabetic state [46]. In this study, the untreated prediabetic group was shown to have high hepatic glycogen concentration. This could be due to high glucose uptake through GLUT 2. Further observations show that the treated groups with the rhenium (V) compound in both the presence and absence of dietary intervention had reduced glycogen concentration. A possible reason for the observed reduction in glycogen levels in the rhenium (V) compound treated group may be because this compound has been shown to improve insulin sensitivity by increasing the expression of GLUT4 in the skeletal muscle and fat tissue, as shown in a study conducted by Siboto, A. et al., 2020 [20]. This reduction in the amount of glucose being shunted to the liver could result in reduced storage of hepatic glycogen [34]. Other studies on transition metals on NAFLD treatment showed that metal complexes including ruthenium and vanadium reduce hepatic glycogen concentration by channeling excess glucose to be metabolized in skeletal muscle and adipose tissue [19,44]. Glucose from excess dietary carbohydrates goes through glycolysis in hepatocytes and is later converted into fatty acids to be esterified into triglycerides (TGs), which are eventually secreted via very low-density lipoproteins [45].
In NAFLD patients with insulin resistance, the increased lipolysis in adipose tissue causes enhanced liver glucose synthesis, which further activates de novo lipogenesis, resulting in hepatic fat deposition [12,38]. Enhanced de novo lipogenesis and reduced fatty acid oxidation had been reported in patients with insulin resistance and contribute to a critical biochemical pathway for the pathogenesis of NAFLD [47,48].
Consumption of diets high in fructose also results in the activation of the de novo lipogenesis pathway. PPARγ-coactivator-1β (PGC-1β), which acts as a co-activator of SREBP1c, can be stimulated by fructose. Moreover, fructose inhibits hepatic fatty acid β-oxidation, which mainly occurs by inhibiting the transcriptional activities of PPARα [7,49]. Thus, the shift towards lipogenesis over fatty acid oxidation contributes to hepatic steatosis. In a hyper-insulinemic state, insulin continues to drive lipogenesis via the SREBP1 pathway in addition to failing to suppress gluconeogenesis, contributing to exacerbating hepatic steatosis. Due to hyperinsulinemia and hyperglycemia, SREBP-1c is activated resulting in high storage of TGs observed in the untreated prediabetic group. However, the administration of the rhenium (V) compound in both the presence and absence of diet intervention resulted in reduced hepatic TGs storage on the treated prediabetic rats. This may be because the rhenium (V) compound facilitated weight loss through suppressing the secretion of ghrelin and reducing food intake. The food consumption results are on a glucose homeostasis paper by Siboto, A. et al., 2020 [20].
Due to a decrease in hepatic TGs concentration in the treated groups, we can also speculate that the rhenium (V) compound may decrease free fatty deposition to the liver by divergence of the substrates to other tissues for metabolism, increased β oxidation of fat or increased triglyceride disposal via very low-density lipoprotein (VLDL) exportation from the liver. Other metals such a dioxidovanadium lowered plasma TGs in diabetic rats via improving insulin sensitivity in adipose tissue and skeletal muscle [44]. Literature research on metal complexes such as ruthenium (ii) complex facilitated weight loss in prediabetic rat resulting in less fatty acid deposition in the liver [19].
The administration of rhenium (V) compound in both the presence and the absence of diet intervention on treated prediabetic rats resulted in both reduction of hepatic glycogen concentration and hepatic TGs storage. This positive effect caused by the administration of the rhenium (V) compound resulted in reduced liver weight as compared to the untreated prediabetic group. Several studies suggest that increased liver weights in prediabetes and NAFLD are associated with increased hepatic lipid accumulation [33]. Furthermore, this may imply that the rhenium (V) compound manages NAFLD delaying from becoming NASH. Relative liver weights results may also be a reflection of triacylglycerol and liver weights due to hepatic very-low-density lipoprotein–triglyceride (VLDL-TG) secretion rates. Studies have shown that liver weight is directly related to hepatic VLDL-TG secretion, independently of body weight. Therefore, since there is reduction of liver TGs in the prediabetic treated group, the liver weight is also reduced. We speculate that with improved insulin sensitivity on the adipose tissue, fat molecules are metabolized, resulting in enhanced HDL reducing the risk of hepatic steatosis associated with insulin resistance.
Oxidative stress is balanced by a number of antioxidant enzymes [50]. Antioxidant enzymes are ROS scavenging agents to protect the cells against oxidative stress under physiological conditions [4]. Uncontrolled oxidative stress can result in liver injury [51]. Increased oxidative stress is independently associated with NAFLD [50]. NAFLD is characterized by insulin resistance, which results in elevated concentrations of free fatty acids, providing substrates for triglyceride formation and subsequent progression of the disease in the liver [51]. It is suggested that increased accumulation of liver triglycerides leads to increased oxidative stress in the hepatocytes [52,53]. NAFLD is also associated with mitochondrial dysfunction, and an increase of mitochondrial β-oxidation activity, due to a lipid overload, may induce an impairment of electron transport chain, resulting in electron leakage and increased ROS [54]. Oxidative stress causes hepatocellular damage through many different mechanisms, including lipid peroxidation, that can directly stimulate cell necrosis and activation of apoptosis [41,55]. Oxidation stress can directly lead to the synthesis of reactive oxygen species (ROS) that are usually removed by antioxidant pathways; however, in the prediabetic state, antioxidant activity is reduced. Indeed, this is also observed in the untreated prediabetic group. The administration of the rhenium (V) compound in both the presence and the absence of diet intervention in the prediabetic rats showed reduced lipid peroxidation and improved antioxidant activity in both SOD and GPx. We speculate that since the rhenium (V) compound reduces fat deposition in the liver, this prevents mitochondrial dysfunction. Therefore, the rhenium (V) compound can prevent liver injury that can be caused by oxidative stress. Vanadium and ruthenium complexes have also been shown to prevent oxidative stress through enhanced glycemic control [19,21,44].
Inflammation, oxidative stress and insulin resistance are involved in NAFLD. The progression of NAFLD to NASH is identified through increased inflammation. NASH patients with increased serum TNF-a concentrations also show higher levels of interleukin (IL)-6 [54]. The administration of the rhenium (V) compound in both the presence and the absence of diet intervention was showed to reduce oxidative stress and improve antioxidant activity, reducing liver injury. The rhenium (V) compound has been shown to have anti-inflammatory properties by reducing plasma TNF α in the treated prediabetic group, protecting progressive liver damage.
Liver enzymes, AST and ALT, are used as clinical biomarkers to identify the degree of hepatocyte damage occurring in the liver [45]. The reason the liver enzyme levels better reflect the presence of injury is that these enzymes are components of hepatocytes that are released into circulation upon hepatocyte damage [45]. Literature trends have variably shown that high AST and ALT occur in blood due to necrosis of the hepatocyte during liver damage [33,55]. Metals are strongly known to be toxic on the liver [39]. The rhenium (V) compound was administered via subcutaneous injection in order for the drug to bypass liver metabolism and be absorbed in the bloodstream. This allows the drug to avoid first-pass metabolism in the liver, as the rhenium complex is known to be relatively harmless. The literature has shown that metal complexes are often associated with increased plasma AST and ALT levels, suggesting liver toxicity [33,55]. However, the rhenium (V) compound is synthesized with uracil-derived ligands that increase bioactivity and uracil-derived ligands. This has been shown to have the capability of coordination through a variety of donor atoms [56]. These uracil-derived ligands make the rhenium (V) compound have reduced cellular toxicity [56,57].
Liver enzymes such as AST and ALT are released into the bloodstream whenever hepatocytes are damaged, and this has been reported to occur during prediabetes [55]. The untreated prediabetic group had a high level of liver AST and ALT [27]. This observation of increased liver enzymes in the plasma suggested that liver cells are damaged through oxidative stress and increased hepatic lipogenesis or glycogenesis. However, administration of the rhenium (V) compound in prediabetic rats resulted in a decreased concentration of liver enzymes. This can be a result that is observed in this study. The rhenium (V) compound seems to improve hepatic health via its antioxidant, antilipidemic and anti-inflammatory effects. Studies have shown that metal-based compounds such as ruthenium (II) compounds ameliorated liver disarrangement and prevented hepatotoxicity [19,58].

5. Conclusions

The administration of the rhenium compound is associated with an improved liver health as evidenced by decreased liver triglyceride, glycogen and fasting blood glucose concentrations. Additionally, the observations suggest that this compound may attenuate liver injury associated with prediabetes, as evidenced by the reduction of oxidative stress, liver function marker enzymes and inflammatory markers in the liver. Given the beneficial effects of the rhenium (V) compound presented in this study, further investigations are warranted to fully assess the therapeutic value of rhenium (V) administration during prediabetes.

Author Contributions

Conceptualization, A.S., A.K. and A.M.A.; methodology, A.S., M.B.I. and A.M.A.; software, A.S.; validation, A.S., A.K. and N.H.S.; formal analysis, A.S. and A.K.; investigation, A.S.; resources, A.K., P.N. and I.N.B.; data curation, A.S.; writing—original draft preparation, A.S.; writing—review and editing, I.N.B., A.K., N.H.S. and P.N.; visualization, A.S.; supervision, N.H.S. and A.K.; project administration A.K.; funding acquisition, A.K. All authors have read and agreed to the published version of the manuscript.

Funding

National Research Foundation (NRF) (grant 106041) and University of KwaZulu Natal College of Health Science funding.

Institutional Review Board Statement

The animal study protocol was approved by the Institutional Animal Research Ethics Committee of University of KwaZulu-Natal UKZN (protocol code AREC/00003221/2021 (previous AREC reference number: AREC/039/018M) and date of approval: 23 June 2022).

Informed Consent Statement

Not applicable.

Data Availability Statement

The data presented in this study are available on request from the corresponding author.

Acknowledgments

The authors acknowledge the personnel at the UKZN Biomedical Resource Unit for their technical assistance.

Conflicts of Interest

The authors declare no conflict of interest.

References

  1. Stefan, N.; Häring, H.-U.; Cusi, K. Non-alcoholic fatty liver disease: Causes, diagnosis, cardiometabolic consequences, and treatment strategies. Lancet Diabetes Endocrinol. 2018, 7, 313–324. [Google Scholar] [CrossRef]
  2. Cusi, K.; Sanyal, A.J.; Zhang, S.; Hartman, M.L.; Bue-Valleskey, J.M.; Hoogwerf, B.J.; Haupt, A. Non-alcoholic fatty liver disease (NAFLD) prevalence and its metabolic associations in patients with type 1 diabetes and type 2 diabetes. Diabetes Obes. Metab. 2017, 19, 1630–1634. [Google Scholar] [CrossRef] [PubMed]
  3. Khathi, A.; Luvuno, M.; Mabandla, M. Voluntary Ingestion of a High-Fat High-Carbohydrate Diet: A Model for Prediabetes. Master’s Thesis, University of KwaZulu-Natal, KwaZulu-Natal, South Africa, 2017. [Google Scholar] [CrossRef]
  4. Maghsoudi, Z.; Ghiasvand, R.; Salehi-Abargouei, A. Empirically derived dietary patterns and incident type 2 diabetes mellitus: A systematic review and meta-analysis on prospective observational studies. Public Health Nutr. 2015, 19, 230–241. [Google Scholar] [CrossRef] [PubMed] [Green Version]
  5. Kalender, S.; Apaydin, F.G.; Baş, H.; Kalender, Y. Protective effects of sodium selenite on lead nitrate-induced hepatotoxicity in diabetic and non-diabetic rats. Environ. Toxicol. Pharmacol. 2015, 40, 568–574. [Google Scholar] [CrossRef]
  6. Jensen, T.; Abdelmalek, M.F.; Sullivan, S.; Nadeau, K.J.; Green, M.; Roncal, C.; Nakagawa, T.; Kuwabara, M.; Sato, Y.; Kang, D.-H.; et al. Fructose and sugar: A major mediator of non-alcoholic fatty liver disease. J. Hepatol. 2018, 68, 1063–1075. [Google Scholar] [CrossRef] [Green Version]
  7. Ter Horst, K.W.; Serlie, M.J.J.N. Fructose consumption, lipogenesis, and non-alcoholic fatty liver disease. Nutrients 2017, 9, 981. [Google Scholar] [CrossRef] [Green Version]
  8. Newton, K.P.; Hou, J.; Crimmins, N.A.; LaVine, J.E.; Barlow, S.E.; Xanthakos, S.A.; Africa, J.; Behling, C.; Donithan, M.; Clark, J.M.; et al. Prevalence of Prediabetes and Type 2 Diabetes in Children With Nonalcoholic Fatty Liver Disease. JAMA Pediatr. 2016, 170, e161971. [Google Scholar] [CrossRef]
  9. Ortiz-Lopez, C.; Lomonaco, R.; Orsak, B.; Finch, J.; Chang, Z.; Kochunov, V.G.; Hardies, J.; Cusi, K. Prevalence of Prediabetes and Diabetes and Metabolic Profile of Patients With Nonalcoholic Fatty Liver Disease (NAFLD). Diabetes Care 2012, 35, 873–878. [Google Scholar] [CrossRef] [Green Version]
  10. Sanyal, D.; Mukherjee, P.; Raychaudhuri, M.; Ghosh, S.; Mukherjee, S.; Chowdhury, S. Profile of liver enzymes in non-alcoholic fatty liver disease in patients with impaired glucose tolerance and newly detected untreated type 2 diabetes. Indian J. Endocrinol. Metab. 2015, 19, 597–601. [Google Scholar] [CrossRef]
  11. Neuschwander-Tetri, B.A.J.B. Non-alcoholic fatty liver disease. BMC medicine. 2017, 15, 45. [Google Scholar] [CrossRef] [Green Version]
  12. Bhatt, H.B.; Smith, R.J. Fatty liver disease in diabetes mellitus. Hepatobiliary Surg. Nutr. 2015, 4, 101–108. [Google Scholar] [CrossRef]
  13. Shurrab, N.T.; Arafa, E.-S.A. Metformin: A review of its therapeutic efficacy and adverse effects. Obes. Med. 2020, 17, 100186. [Google Scholar] [CrossRef]
  14. Gupta, A.; Behl, T.; Sachdeva, M. Key milestones in the diabetes research: A comprehensive update. Obes. Med. 2020, 17, 100183. [Google Scholar] [CrossRef]
  15. El-Kader, S.M.A.; El-Den Ashmawy, E.M.S. Non-alcoholic fatty liver disease: The diagnosis and management. World J. Hepatol 2015, 7, 846. [Google Scholar] [CrossRef]
  16. Leite, N.C. Non-alcoholic fatty liver disease and diabetes: From physiopathological interplay to diagnosis and treatment. World J. Gastroenterol. 2014, 20, 8377–8392. [Google Scholar] [CrossRef]
  17. Malin, S.K.; Gerber, R.; Chipkin, S.R.; Braun, B. Independent and Combined Effects of Exercise Training and Metformin on Insulin Sensitivity in Individuals with Prediabetes. Diabetes Care 2011, 35, 131–136. [Google Scholar] [CrossRef] [Green Version]
  18. Roberts, S.; Barry, E.; Craig, D.; Airoldi, M.; Bevan, G.; Greenhalgh, T. Preventing type 2 diabetes: Systematic review of studies of cost-effectiveness of lifestyle programmes and metformin, with and without screening, for pre-diabetes. BMJ Open 2017, 7, e017184. [Google Scholar] [CrossRef] [Green Version]
  19. Mabuza, L.P.; Gamede, M.W.; Maikoo, S.; Booysen, I.N.; Nguban, P.S.; Khathi, A. Hepatoprotective Effects of a Ruthenium(II) Schiff Base Complex in Rats with Diet-Induced Prediabetes. Curr. Ther. Res. 2019, 91, 66–72. [Google Scholar] [CrossRef]
  20. Siboto, A.; Akinnuga, A.M.; Khumalo, B.N.; Ismail, M.B.; Booysen, I.N.; Sibiya, N.H.; Ngubane, P.S.; Khathi, A. The effects of a [3+1] oxo-free rhenium (V) compound with uracil-derived ligands on selected parameters of glucose homeostasis in diet-induced pre-diabetic rats. Obes. Med. 2020, 19, 100258. [Google Scholar] [CrossRef]
  21. Mabuza, L.P.; Gamede, M.W.; Maikoo, S.; Booysen, I.N.; Ngubane, P.S.; Khathi, A. Effects of a Ruthenium Schiff Base Complex on Glucose Homeostasis in Diet-Induced Pre-Diabetic Rats. Molecules 2018, 23, 1721. [Google Scholar] [CrossRef] [Green Version]
  22. Luvuno, M.; Mbongwa, H.; Khathi, A. Development of a novel prediabetes animal model using a high fat high carbohydrate diet: Implications for type 2 diabetes. PLoS ONE 2017, 13, 8–14. [Google Scholar]
  23. Wallace, T.M.; Levy, J.C.; Matthews, D.R. Use and Abuse of HOMA Modeling. Diabetes Care 2004, 27, 1487–1495. [Google Scholar] [CrossRef] [Green Version]
  24. Heikes, K.E.; Eddy, D.M.; Arondekar, B.; Schlessinger, L. Diabetes Risk Calculator: A simple tool for detecting undiagnosed diabetes and pre-diabetes. Diabetes Care 2008, 31, 1040–1045. [Google Scholar] [CrossRef] [Green Version]
  25. Ngubane, P.S.; Masola, B.; Musabayane, C.T. The Effects of Syzygium aromaticum-Derived Oleanolic Acid on Glycogenic Enzymes in Streptozotocin-Induced Diabetic Rats. Ren. Fail. 2011, 33, 434–439. [Google Scholar] [CrossRef]
  26. Mkhwanazi, B.N.; Serumula, M.R.; Myburg, R.B.; Van Heerden, F.R.; Musabayane, C.T. Antioxidant effects of maslinic acid in livers, hearts and kidneys of streptozotocin-induced diabetic rats: Effects on kidney function. Ren. Fail. 2013, 36, 419–431. [Google Scholar] [CrossRef]
  27. Buysschaert, M.; Medina, J.L.; Bergman, M.; Shah, A.; Lonier, J. Prediabetes and associated disorders. Endocrine 2014, 48, 371–393. [Google Scholar] [CrossRef]
  28. Bungau, S.; Behl, T.; Tit, D.M.; Banica, F.; Bratu, O.G.; Diaconu, C.C.; Nistor-Cseppento, C.D.; Bustea, C.; Aron, R.A.C.; Vesa, C.M. Interactions between leptin and insulin resistance in patients with prediabetes, with and without NAFLD. Exp. Ther. Med. 2020, 20, 1. [Google Scholar] [CrossRef]
  29. Rajput, R.; Ahlawat, P. Prevalence and predictors of non-alcoholic fatty liver disease in prediabetes. Diabetes Metab. Syndr. 2019, 13, 2957–2960. [Google Scholar] [CrossRef]
  30. Targher, G.; Corey, K.E.; Byrne, C.D.; Roden, M. The complex link between NAFLD and type 2 diabetes mellitus—Mechanisms and treatments. Nat. Rev. Gastroenterol. Hepatol. 2021, 18, 599–612. [Google Scholar] [CrossRef]
  31. Portillo-Sanchez, P.; Cusi, K. Treatment of Nonalcoholic Fatty Liver Disease (NAFLD) in patients with Type 2 Diabetes Mellitus. Clin. Diabetes Endocrinol. 2016, 2, 9. [Google Scholar] [CrossRef]
  32. Gaggini, M.; Morelli, M.; Buzzigoli, E.; DeFronzo, R.A.; Bugianesi, E.; Gastaldelli, A. Non-Alcoholic Fatty Liver Disease (NAFLD) and Its Connection with Insulin Resistance, Dyslipidemia, Atherosclerosis and Coronary Heart Disease. Nutrients 2013, 5, 1544–1560. [Google Scholar] [CrossRef] [PubMed]
  33. Adiels, M.; Taskinen, M.-R.; Borén, J.J.C. Fatty liver, insulin resistance, and dyslipidemia. Curr. Diabetes Rep. 2008, 8, 60–64. [Google Scholar] [CrossRef] [PubMed]
  34. Chang, L.; Chiang, S.-H.; Saltiel, A.R. Insulin Signaling and the Regulation of Glucose Transport. Mol. Med. 2004, 10, 65–71. [Google Scholar] [CrossRef] [PubMed]
  35. Sharabi, K.; Tavares, C.D.; Rines, A.K.; Puigserver, P. Molecular pathophysiology of hepatic glucose production. Mol. Asp. Med. 2015, 46, 21–33. [Google Scholar] [CrossRef] [Green Version]
  36. Katsiki, N.; Mikhailidis, D.P.; Mantzoros, C.S. Non-alcoholic fatty liver disease and dyslipidemia: An update. Metabolism 2016, 65, 1109–1123. [Google Scholar] [CrossRef]
  37. Sunny, N.E.; Parks, E.J.; Browning, J.D.; Burgess, S.C. Excessive Hepatic Mitochondrial TCA Cycle and Gluconeogenesis in Humans with Nonalcoholic Fatty Liver Disease. Cell Metab. 2011, 14, 804–810. [Google Scholar] [CrossRef] [Green Version]
  38. Chao, H.-W.; Chao, S.-W.; Lin, H.; Ku, H.-C.; Cheng, C.-F. Homeostasis of Glucose and Lipid in Non-Alcoholic Fatty Liver Disease. Int. J. Mol. Sci. 2019, 20, 298. [Google Scholar] [CrossRef] [Green Version]
  39. Watterworth, B.; Wright, T.B. Diabetic Peripheral Neuropathy, in Pain; Springer: Berlin/Heidelberg, Germany, 2019; pp. 911–913. [Google Scholar] [CrossRef]
  40. Bernardes, N.; Ayyappan, P.; De Angelis, K.; Bagchi, A.; Akolkar, G.; Dias, D.D.S.; Belló-Klein, A.; Singal, P.K. Excessive consumption of fructose causes cardiometabolic dysfunctions through oxidative stress and inflammation. Can. J. Physiol. Pharmacol. 2017, 95, 1078–1090. [Google Scholar] [CrossRef] [Green Version]
  41. Rowell, R.J.; Anstee, Q.M.J.C. An overview of the genetics, mechanisms and management of NAFLD and ALD. Clin. Med. 2015, 15 (Suppl. S6), s77–s82. [Google Scholar] [CrossRef]
  42. Abdul-Ghani, M.A.; DeFronzo, R.A. Pathophysiology of prediabetes. Curr. Diabetes Rep. 2009, 9, 193–199. [Google Scholar] [CrossRef]
  43. Samuel, V.T.; Shulman, G.I.J.T.J. The pathogenesis of insulin resistance: Integrating signaling pathways and substrate flux. J. Clin. Investig. 2016, 126, 12–22. [Google Scholar] [CrossRef] [Green Version]
  44. Sibiya, S.; Msibi, B.; Khathi, A.; Sibiya, N.; Booysen, I.; Ngubane, P. The effect of dioxidovanadium complex (V) on hepatic function in streptozotocin-induced diabetic rats. Can. J. Physiol. Pharmacol. 2019, 97, 1169–1175. [Google Scholar] [CrossRef]
  45. Kalra, A.; Yetiskul, E.; Wehrle, C.J.; Tuma, F. Physiology, Liver. In StatPearls; StatPearls Publishing: Treasure Island, FL, USA, 2022. [Google Scholar]
  46. Akehi, Y.; Yanase, T.; Motonaga, R.; Umakoshi, H.; Tsuiki, M.; Takeda, Y.; Yoneda, T.; Kurihara, I.; Itoh, H.; Katabami, T.; et al. High Prevalence of Diabetes in Patients With Primary Aldosteronism (PA) Associated With Subclinical Hypercortisolism and Prediabetes More Prevalent in Bilateral Than Unilateral PA: A Large, Multicenter Cohort Study in Japan. Diabetes Care 2019, 42, 938–945. [Google Scholar] [CrossRef] [Green Version]
  47. Goodpaster, B.H.; DeLany, J.P.; Otto, A.D.; Kuller, L.; Vockley, J.; South-Paul, J.E.; Thomas, S.B.; Brown, J.; McTigue, K.; Hames, K.C.; et al. Effects of diet and physical activity interventions on weight loss and cardiometabolic risk factors in severely obese adults: A randomized trial. JAMA 2010, 304, 1795–1802. [Google Scholar] [CrossRef] [Green Version]
  48. Manne, V.; Handa, P.; Kowdley, K.V. Pathophysiology of Nonalcoholic Fatty Liver Disease/Nonalcoholic Steatohepatitis. Clin. Liver Dis. 2018, 22, 23–37. [Google Scholar] [CrossRef]
  49. Sodum, N.; Kumar, G.; Bojja, S.L.; Kumar, N.; Rao, C.M. Epigenetics in NAFLD/NASH: Targets and therapy. Pharmacol. Res. 2021, 167, 105484. [Google Scholar] [CrossRef]
  50. Narasimhan, S.; Gokulakrishnan, K.; Sampathkumar, R.; Farooq, S.; Ravikumar, R.; Mohan, V.; Balasubramanyam, M. Oxidative stress is independently associated with non-alcoholic fatty liver disease (NAFLD) in subjects with and without type 2 diabetes. Clin. Biochem. 2010, 43, 815–821. [Google Scholar] [CrossRef]
  51. Asmat, U.; Abad, K.; Ismail, K. Diabetes mellitus and oxidative stress—A concise review. Saudi Pharm. J. 2015, 24, 547–553. [Google Scholar] [CrossRef] [Green Version]
  52. Arroyave-Ospina, J.C.; Wu, Z.; Geng, Y.; Moshage, H. Role of Oxidative Stress in the Pathogenesis of Non-Alcoholic Fatty Liver Disease: Implications for Prevention and Therapy. Antioxidants 2021, 10, 174. [Google Scholar] [CrossRef]
  53. Videla, L.A.; Rodrigo, R.; Araya, J.; Poniachik, J. Insulin resistance and oxidative stress interdependency in non-alcoholic fatty liver disease. Trends Mol. Med. 2006, 12, 555–558. [Google Scholar] [CrossRef]
  54. Masarone, M.; Rosato, V.; Dallio, M.; Gravina, A.G.; Aglitti, A.; Loguercio, C.; Federico, A.; Persico, M. Role of oxidative stress in pathophysiology of nonalcoholic fatty liver disease. Oxidative Med. Cell. Longev. 2018, 2018, 9547613. [Google Scholar] [CrossRef]
  55. Clark, J.M.; Brancati, F.L.; Diehl, A.M.J.G. Nonalcoholic fatty liver disease. N. Engl. J. Med. 2002, 122, 1649–1657. [Google Scholar] [CrossRef] [Green Version]
  56. Ismail, M.B.; Booysen, I.N. Complexes of the fac-[Re(CO)3]+ and [ReO]3+ Moieties with Aromatic, Multidentate, NDonor Ligands. Ther. Drug Monit. 2013, 357, 1499–1516. [Google Scholar]
  57. Ismail, M.B.; Booysen, I.N.; Akerman, M. DNA interaction studies of rhenium compounds with Schiff base chelates encompassing biologically relevant moieties. Nucleosides Nucleotides Nucleic Acids 2019, 38, 950–971. [Google Scholar] [CrossRef]
  58. Ismail, M.B.; Booysen, I.N.; Akerman, M.P. Rhenium(I) complexes with aliphatic Schiff bases appended to bio-active moieties. Inorg. Chem. Commun. 2017, 78, 78–81. [Google Scholar] [CrossRef]
Figure 1. The experimental protocol for the study.
Diabetology 03 00040 g001
Figure 2. Fasting blood glucose in NC, PD, MET + DI, MET + HFHC, Re + DI and Re + HFHC at 12 weeks of treatment. Values are presented as means ± SD (n = 6). ⋆ p < 0.05 by comparison with NC, α p < 0.05 by comparison with PD, MET + DI, MET + HFHC, Re + DI and Re + HFHC.
Diabetology 03 00040 g002
Figure 3. Liver glycogen concentration in NC, PD, MET + DI, MET + HFHC, Re + DI and Re + HFHC after 12 weeks of treatment. Values are presented as means ± SD and individual data points (n = 6). ⋆ p < 0.05 by comparison with NC, α p < 0.05 by comparison with PD, MET + DI, MET + HFHC, Re + DI and Re + HFHC.
Diabetology 03 00040 g003
Figure 4. Liver triglycerides concentration in NC, PD, MET + DI, MET + HFHC, Re + DI and Re + HFHC after 12 weeks of treatment. Values are presented as means ± SD and individual data points (n = 6). ⋆ p < 0.05 by comparison with NC, α p < 0.05 by comparison with PC, MET + DI, MET + HFHC, Re + DI and Re + HFHC.
Diabetology 03 00040 g004
Figure 5. Relative liver weight in normal control (NC), prediabetic control (PD), metformin and diet intervention (MET + DI), metformin and high fat–high carbohydrate (MET + HFHC), rhenium (V) compound and diet intervention (Re + DI) and rhenium (V) compound and high fat–high carbohydrate (Re + HFHC) groups after 12 weeks of treatment. Values are presented as means ± SD and individual data points (n = 6). ⋆ p < 0.05 by comparison with NC, α p < 0.05 by comparison with PD, MET + DI, MET + HFHC, Re + DI and Re + HFHC.
Diabetology 03 00040 g005
Figure 6. SOD activity in normal control (NC), prediabetic control (PD), metformin and diet intervention (MET + DI), metformin and high fat–high carbohydrate (MET + HFHC), rhenium (V) compound and diet intervention (Re + DI) and rhenium (V) compound and high fat–high carbohydrate (Re + HFHC) groups after 12 weeks of treatment. Values are presented as means ± SD and individual data points (n = 6). ⋆ p < 0.05 by comparison with NC, α p < 0.05 by comparison with PD, MET + DI, MET + HFHC, Re + DI and Re + HFHC.
Diabetology 03 00040 g006
Figure 7. GPx activity in normal control (NC), prediabetic control (PD), metformin and diet intervention (MET + DI), metformin and high fat–high carbohydrate (MET + HFHC), rhenium (V) compound and diet intervention (Re + DI) and rhenium (V) compound and high fat–high carbohydrate (Re + HFHC) groups after 12 weeks of treatment. Values are presented as means ± SD and individual data points (n = 6). ⋆ p < 0.05 by comparison with NC, α p < 0.05 by comparison with PD, MET + DI, MET + HFHC, Re + DI and Re + HFHC.
Diabetology 03 00040 g007
Figure 8. TNF α concentration in normal control (NC), prediabetic control (PD), metformin and diet intervention (MET + DI), metformin and high fat–high carbohydrate (MET + HFHC), rhenium (V) compound and diet intervention (Re + DI) and rhenium (V) compound and high fat–high carbohydrate (Re + HFHC) groups after 12 weeks of treatment. Values are presented as means ± SD and individual data points (n = 6). ⋆ p < 0.05 by comparison with NC, α p < 0.05 by comparison with PC, MET + DI, MET + HFHC, Re + DI and Re + HFHC.
Diabetology 03 00040 g008
Figure 9. Plasma ALT concentration in normal control (NC), prediabetic control (PD), metformin and diet intervention (MET + DI), metformin and high fat–high carbohydrate (MET + HFHC), rhenium (V) compound and diet intervention (Re + DI) and rhenium (V) compound and high fat–high carbohydrate (Re + HFHC) groups after 12 weeks of treatment. Values are presented as means ± SD and individual data points (n = 6). ⋆ p < 0.05 by comparison with NC, α p < 0.05 by comparison with PC, MET + DI, MET + HFHC, Re + DI and Re + HFHC.
Diabetology 03 00040 g009
Figure 10. Plasma AST concentration in normal control (NC), prediabetic control (PD), metformin and diet intervention (MET + DI), metformin and high fat–high carbohydrate (MET + HFHC), rhenium (V) compound and diet intervention (Re + DI) and rhenium (V) compound and high fat–high carbohydrate (Re + HFHC) groups after 12 weeks of treatment. Values are presented as means ± SD and individual data points (n = 6). ⋆ p < 0.05 by comparison with NC, α p < 0.05 by comparison with PD, MET + DI, MET + HFHC, Re + DI and Re + HFHC.
Diabetology 03 00040 g010
Publisher’s Note: MDPI stays neutral with regard to jurisdictional claims in published maps and institutional affiliations.

