


Abstract
High-resolution mass spectrometry (HRMS) enables non-targeted detection of drugs and metabolites in complex matrices. Phase II metabolites—especially glucuronides—are often the only detectable biomarkers in late or postmortem samples but are underrepresented in commercial libraries. This work pursued the prediction of phase II-glucuronide conjugates in diluted urine samples by non-targeted/targeted LC-HRMS workflows. A simply “dilute-and-shoot” qualitative UHPLC-HRMS/MS method (Q Exactive HF, ddMS2) was integrated with Compound Discoverer® software for data processing. The workflow incorporated predictive strategies such as exact mass suspect lists, Structured Query Language (SQL)-based filters, compound-class and diagnostic neutral-loss rules (including the characteristic loss of 176.0321 Da for glucuronides) and MS/MS confirmation using both in-house and public spectral libraries. An additional part of the application’s performance assessment involved its validation for diluted urine sample. A qualitative validated method for more than two hundred drugs in urine samples was performed, including the method’s selectivity/specificity, limit of identification, matrix effects, and potential carryover. Most analytes fulfilled the qualitative acceptance criteria, with more than 60% successfully identified at a concentration of at least 2.5 ng/mL. Matrix effects were within acceptable limits for most compounds, and no severe ion suppression was observed. A non-targeted workflow was applied to real forensic samples (n = 16), allowing a reduction of approximately 66,800 detected features to 225 glucuronide candidates, while a targeted workflow based on exact mass lists yielded 31 high-confidence identifications. Characteristic neutral losses and diagnostic fragment ions led to the tentative identification of some glucuronide phase II metabolites such as mirtazapine–glucuronide, morphine-6–glucuronide, and glucuronide conjugates of benzodiazepines and synthetic opioids. In conclusion, the integration of biotransformation knowledge with HRMS-based predictive filtering allows for the efficient and hydrolysis-free detection of glucuronide metabolites, thereby extending detection windows and enhancing toxicological interpretation in complex forensic scenarios. This adaptable and library-independent workflow also facilitates retrospective data mining, making it suitable for the identification of emerging substances and newly characterized metabolites.
1. Introduction
High-resolution mass spectrometry (HRMS) has become a pivotal tool in forensic toxicology due to its high sensitivity, specificity, and its ability to simultaneously detect parent drugs and their metabolites in complex biological matrices [1,2]. In the context of non-targeted analysis, HRMS allows for comprehensive metabolic profiling without requiring predefined search targets, significantly enhancing retrospective detection and interpretation of toxicological or pharmacological exposure [3,4].
The metabolism of toxicologically relevant compounds involves biochemical transformations that modulate biological activity and promote elimination. These transformations are classically divided into phase I reactions (oxidation, reduction, hydrolysis) and phase II reactions (conjugation), which are particularly relevant because they produce polar metabolites such as glucuronides, which often predominate in urine samples [5,6].
Traditionally, conjugated metabolites are not detected after hydrolysis—basic, acidic, or enzymatic—to release the parent compound [7]. In this context, the direct detection of glucuronide conjugates is particularly relevant in forensic toxicology, as it allows for confirmation of drug intake when the parent compound has already been fully metabolized. In general, certain metabolites are particularly useful as consumption biomarkers, especially those that extend detection windows and ensure endogenous formation, such as phase II glucuronide conjugation, as in this case.
Moreover, parent drugs may degrade into some of their metabolites; this phenomenon is especially observed in postmortem samples. In addition, further degradation of products may form due to chemical or thermal instability, as well as contributions from endogenous metabolism and degradation caused by bacteria or fungi. Therefore, the detection of these metabolites is highly recommended for identifying substance use, new psychoactive substances (NPSs), and other toxic agents [8,9], in addition to the parent drug.
The identification of these conjugates is crucial for elucidating cases of poisoning, validating results in challenging specimens, and distinguishing true intake from contamination or vial-related interferences, as well as for extending the detection time window, especially in matrices that are not standardized or cannot be hydrolyzed [10], such as blood and visceral tissues, among others. As many of these conjugates are not included in commercial libraries, complementary strategies are required, such as generating theoretical exact mass lists, applying predictive filters based on known chemical structures, and using diagnostic ions like characteristic neutral losses (e.g., −176.0321 Da for glucuronides), alongside structural validation through MS/MS fragmentation spectra [11,12,13].
In forensic toxicology, several studies have demonstrated the applicability of HRMS workflows, including predictive tools, theoretical mass lists, diagnostic ions, and retrospective data mining, for the detection of phase II metabolites, particularly glucuronide conjugates. For synthetic cannabinoids, Scheidweiler et al. identified over 40 urinary metabolites using an untargeted LC-QTOF-MS workflow supported by neutral loss filters and MS/MS library matching, without requiring enzymatic hydrolysis [14]. Gundersen et al. applied a retrospective screening strategy using UHPLC-QTOF-MS data and the HighResNPS database to identify metabolites of cannabinoids, synthetic opioids, and benzodiazepines in postmortem samples, emphasizing the utility of non-targeted workflows for newly emerging substances [15]. In the case of opioids, Maurer et al. reported the successful identification of morphine-3–glucuronide (M3G) and morphine-6–glucuronide (M6G) in urine using LC-MS and neutral loss scanning as a reliable alternative to traditional hydrolysis [16]. For benzodiazepines, Peters et al. showed that glucuronide metabolites of lorazepam and oxazepam could be directly detected through precursor ion and neutral loss-based acquisition, improving the confirmation of intake in advanced metabolic stages [2]. Regarding nitazenes, Kanamori et al. characterized the in vitro biotransformation of several analogs in human hepatocytes, revealing extensive phase I and phase II metabolism, including glucuronidation, and detecting these metabolites via LC-HRMS without prior hydrolysis [17]. Finally, in the context of anabolic steroids, Polet et al. applied UHPLC-HRMS to detect long-term urinary metabolites of stanozolol and related compounds, highlighting the importance of full-scan acquisition and retrospective analysis in doping control [18].
These previous studies provide a strong foundation for developing broad-spectrum analytical workflows that integrate untargeted HRMS acquisition, prediction-based compound screening, and structural confirmation for detecting conjugated metabolites in complex biological matrices.
Exploring the metabolic pathways of toxicologically relevant substances provides key insights into their behavior in the human body. Different chemical families undergo specific biotransformation routes that affect their toxicity, detectability, and analytical interpretation, such as opiates, benzodiazepines, anabolic steroids, cannabinoids and nitazenes.
Opioids such as codeine and morphine undergo hepatic metabolism primarily mediated by CYP2D6, CYP3A4, and UGT2B7. Codeine is mainly converted into codeine-6–glucuronide, norcodeine, and morphine—the latter having significantly greater analgesic potency. Morphine is conjugated into M3G and M6G, with M6G being an active metabolite. The morphine/norcodeine ratio serves as a differential marker for codeine ingestion versus direct morphine administration [19,20].
Benzodiazepines are primarily metabolized in the liver through phase I reactions catalyzed by CYP3A4, CYP3A5, and CYP2C19 enzymes, involving N-dealkylation and hydroxylation. These processes often produce active metabolites, which may prolong clinical effects, as seen with diazepam, clorazepate, and flurazepam [21,22]. In phase II, these metabolites are conjugated with glucuronic acid by UGT1A4, UGT2B7, and UGT2B15, facilitating renal excretion. According to PharmGKB, functional genetic variants such as CYP2C192 and UGT2B152 can significantly alter the metabolism and clearance of benzodiazepines like diazepam, lorazepam, and oxazepam [23], making interindividual variability especially relevant in forensic toxicology, particularly for postmortem sample interpretation.
The main metabolism of THC in cannabinoids occurs in the liver via CYP2C9 and CYP3A4, producing the psychoactive metabolite 11-hydroxy-THC (11-OH-THC) and the inactive metabolite 11-nor-9-carboxy-THC (THC-COOH), which can subsequently undergo glucuronidation. Detection of 11-OH-THC in blood indicates recent consumption, while THC-COOH in urine reflects past or chronic use [19]. CBD and CBN follow similar metabolic pathways involving CYP2C19. These yields hydroxylated and carboxylated metabolites, which are also subject to glucuronidation [24,25].
Forensic investigations increasingly require attention to synthetic and semi-synthetic cannabinoids, which are widely used as recreational substances and frequently found in unregulated therapeutic products. Compounds from families such as JWH, AM, UR-144, and AB-FUBINACA show high affinity for CB1 and CB2 receptors and undergo rapid metabolism through hydroxylation, oxidation, and N-dealkylation (via CYP3A4, CYP2C9, and CYP2C19), followed by UGT-mediated conjugation. Certain esterified derivatives may also undergo enzymatic or chemical hydrolysis during metabolism or sample preparation, producing their corresponding carboxylic acids. This process is important for accurately determining total cannabinoid content and can affect the interpretation of forensic and clinical results [24,25]. The structural diversity and continual emergence of these compounds make it necessary to rely on updated spectral libraries, untargeted analytical workflows, and predictive metabolic tools, as the parent cannabinoids are rarely detected in biological matrices [15,17,26,27].
Anabolic steroids undergo reduction, hydroxylation, and conjugation reactions catalyzed by 5α-reductase, CYP3A4, and UGT/SULT enzymes. Structural modifications, such as C17α-alkylation or C17β-esterification, influence their metabolism, duration of action, and hepatotoxicity. Their complex structures and prolonged metabolism mean that their metabolites require advanced techniques such as GC-MS/MS or LC-HRMS for detection [28,29].
Last but not least are nitazenes, an emerging group of highly potent synthetic opioids that were originally developed in the 1950s and have recently been reintroduced to the illicit drug market in the form of fentanyl analogues. Compounds such as isotonitazene and protonitazene exhibit high μ-opioid receptor affinity and pose significant risks of overdose and toxicity. Their atypical structure hinders detection by immunoassays, necessitating specific instrumental methods.
Biotransformation of nitazenes primarily involves N-dealkylation, aromatic hydroxylation, and, in some cases, glucuronidation. For instance, isotonitazene metabolizes into N-desmethyl-isotonitazene, identified in forensic samples via LC-HRMS [30]. These transformations have clinical and toxicological implications, as metabolites may retain opioid activity and prolong effects. Analytical detection of nitazenes in matrices such as blood, urine, or dried blood spots (DBSs) requires sensitive methods. LC-HRMS has proven effective in detecting them at trace levels, even after extended storage, making them priority targets in postmortem toxicology and anti-doping controls [31].
Considering the importance of the metabolic pathways of the different drug families, this study aimed to predict phase II–glucuronide conjugates in diluted urine samples by non-targeted/targeted LC-HRMS workflows. To achieve this, three specific goals were pursued: (i) validation of a qualitative LC-HRMS method for diluted urine samples containing over 200 substances; (ii) development of HRMS non-targeted and targeted workflows for predicting glucuronide conjugates (phase II metabolites) in urine samples; (iii) tentative identification of phase II glucuronide metabolites through structural elucidation; and (iv) assessment of the forensic impact of non-targeted HRMS predictive strategies.
2. Materials and Methods
2.1. Materials
All used reagents were analytical grade or higher. Mobile phase solvents and additives were LC-MS grade. The mobile phase solvents (acetonitrile and methanol) were of LC-MS grade (Merck, Darmstadt, Germany). Chemicals such as formic acid and ammonium formate were purchased from Sigma-Aldrich.
The certified reference material (CRM) of all tested substances (See Table S1 of Supplementary Information) was purchased from LGC Promochem Cerilliant (Teddington Middlesex, UK) Lipomed and Cayman Chemical, providing either pure solutions in methanol or solid.
Standard solutions were prepared by gravimetric dilution to obtain a single working solution at a concentration of 0.2 mg/L in methanol. Aliquots of this working solution (1, 2.5, 5, 10, 25, and 50) µL were added directly to 0.2 mL of blank of urine samples, resulting in final concentrations in the urine matrix of (1, 2.5, 5, 10, 25, and 50) ng/mL, respectively. The final methanol volume was adjusted to 60 µL, including 10 µL of the internal standard nalorphine at 1 mg/L, and 740 µL of the aqueous mobile phase (eluent A) was subsequently added.
Human urine samples from ten volunteer donors and forensic casework under investigation were analyzed. Samples were stored at 0 °C and −20 °C prior to analysis to prevent degradation.
2.2. UHPLC-HRMS/MS Acquisition Method
UHPLC-HRMS/MS analysis was performed using a Thermo Vanquish UHPLC system coupled to an Accucore™ phenyl-hexyl column (Thermo Scientific, Waltham, MA, USA; 100 × 2.1 mm, 2.6 µm), maintained at 40 °C. The mobile phase consisted of eluent A (2 mM ammonium formate in water with 0.1% formic acid, pH 3) and eluent B (2 mM ammonium formate in 50:50 acetonitrile:methanol containing 1% water and 0.1% formic acid). The gradient flow (0.5 mL/min) was: 0–1.0 min at 1% B, linear ramp to 99% B (1.0–10.0 min), return to 1% B (10.0–11.5 min), and held until 13.5 min [32].
Mass spectrometric detection was carried out using a Q Exactive HF instrument (Thermo Scientific) with a Heated Electrospray Ionization (HESI)-II source in positive polarity, operated in data-dependent acquisition (ddMS2) mode. Full scan settings were: resolution 70,000 (FWHM), AGC target 3 × 10⁶, max IT 240 ms, and m/z 125–1000. ddMS2 acquisition selected the top 3 precursor ions per scan (resolution 17,500, AGC target 5 × 10⁴, IT 50 ms, isolation window m/z 1.0, NCE 30/60/90). Dynamic exclusion was set to 9 s, with a ±0.5 min retention time window for background exclusion.
The mass spectrometer was calibrated at least every week in the positive mode, with a calibrating solution consisting of (L-methionyl-arginyl-phenylalanyl-alanine acetate) at 1 mg/ L, caffeine at 2 mg/L, and Ultramark® (Bio-Rad Laboratories, Hercules, CA, USA) 1621 0.001% (a commercially available mixture of fluorinated phosphazenes).
Non-targeted HRMS data were processed using Compound Discoverer 3.3 SP3 (Thermo Scientific), following a defined workflow integrating multiple modules for peak detection, annotation, and result summarization. Analytical strategies included compound identification based on in-house libraries, online databases, and exact mass lists. Additional filters based on biochemical rules and neutral losses were applied to tentatively identify metabolites not available as reference standards [13].
Additionally, specific validation parameters were also evaluated using Trace Finder software version 5.1 SP2 (Thermo Scientific).
To validate the applicability of the analytical approach, four experimental sessions were conducted using a direct analysis method based on diluted urine injection via LC-HRMS in untargeted mode. Urine samples were diluted 1:5 (v/v) in mobile phase without prior extraction or hydrolysis, simplifying preparation while maintaining analytical sensitivity and coverage.
The analyzed substances were classified into pharmacological families: 1. benzodiazepines and related drugs, 2. antidepressants, 3. antipsychotics (neuroleptics), 4. antiepileptics, 5. opioids and other analgesics, 6. non-steroidal anti-inflammatory drugs (NSAIDs) and related agents, 7. cardiovascular drugs—beta-blockers, 8. cardiovascular drugs—calcium-channel blockers, antiarrhythmics and vasodilators, 9. renin–angiotensin system—ACE inhibitors and angiotensin II receptor blockers, 10. diuretics and related drugs, 11. antidiabetic and metabolic drugs, 12. lipid-lowering agents, 13. anticoagulant and antiplatelet drugs, 14. anti-infective agents, 15. antihistamines and related CNS-active agents, 16. gastrointestinal drugs, 17. respiratory drugs and xanthines, 18. corticosteroids, 19. urologic and sexual-function drugs, and 20. miscellaneous CNS and other agents (for more in details, see Table 1 by pharmacological family). The method was applied to different sample types: blank urine from ten different individuals, fortified urine spiked with a multi-analyte standard at six concentration levels (1–50) ng/mL, forensic case samples, and quality controls with and without internal standard (nalorphine). Each sample was brought up to 1 mL (1:5 dilution) with mobile phase and injected directly into the system.
Table 1.
Pharmacological families indicating number of compounds (N = 203) considered and their names.
2.3. UHPLC-HRMS/MS Data Processing
Systematic data processing for non-targeted HRMS acquisition was carried out through Compound Discoverer software (version 3.3 SP3, ThermoScientific). A node-based workflow was implemented to streamline the acquisition, alignment, detection, and identification of chemical compounds in the analyzed samples. An overview of the program flow and the nodes integrated into the software is shown in Figure 1.
Figure 1.
Example of workflow tree, with different nodes applied for results in the study, without SQL filters, through Compound Discoverer software (version 3.3 SP3, ThermoScientific). The node colors represent different functional categories within the workflow: purple indicates feature processing steps such as detection, grouping, and compound assembly; yellow and orange correspond to scoring and annotation processes used for compound identification and confidence evaluation; blue represents data input and database searching nodes; green denotes generation or creation steps such as mass trace or molecular network generation; and red identifies nodes related to expected compounds handling.
In general, there are three types of nodes. One group is responsible for detecting and organizing feature regrouping ion data curation (MS1 and MS2). The other two nodes are dedicated to the conceptualization and relationship between them.
Through MS1 scan acquisition, these ions were detected and assigned to their corresponding precursor species, based on isotopic pattern recognition and node detections.
In this case, the MS2 spectra generated using data-dependent acquisition (DDA) are conceptualized within their corresponding identification nodes.
All of these nodes are associated with both targeted and non-targeted relational searches, using up–bottom (MS1 → MS2) or bottom–up (MS2 → MS1) combinations in different strategies.
The nodes shown in Figure 1 were conceptualized within the data processing workflow (Figure 2), which was structured into the following main stages.
Figure 2.
Conceptual diagram designed by the authors for the non-targeted HRMS data processing workflow and the results for this study. It was generated with the assistance of ChatGPT 5.1 (OpenAI) and reviewed, edited and finalized by the authors. The scheme illustrates the pre-processing, for results of study. The results show (N > 66,000 compounds in this study), on the left-hand side, the different nodes described for the evaluation of the detected ions presented in the study results in MS1 and MS2/MSn, and their correlation across the different nodes, including isotopic pattern clustering, mass lists with or without retention time, libraries and predictive tools, diagnostic ions, neutral losses, molecular networking, and fragmentation pathways, enabling a comprehensive characterization of compounds beyond conventional targeted screening. On the right-hand side of the results are the practical application of SQL filters, in this case, for evaluation and tentative identification of phase II conjugated metabolites (glucuronides). Non-targeted screening was performed using Filter 1 (n = 225) while targeted screening was carried out using Filter 2 (n = 31). This second filter integrates a predictive mass list of glucuronides (n = 550 compounds) generated from the mzvault library, which applied in combination with Filter 1. This approach allowed the tentative identification of eight positive glucuronide metabolites.
Detecting, regrouping and data curation nodes:
- (a)
- Spectral pre-processing: this included tasks such as retention time alignment and noise reduction, allowing for consistent comparison across injections.
- (b)
- Compound detection and peak integration: nodes such as “Detect Compounds”, “Group Unknowns”, and “Fill Gaps” were applied to define compound features and correct for missing signals.
- (c)
- Background subtraction and filtering: the “Mark Background Compounds” node was used to eliminate signals from procedural blanks or noise, refining the list of relevant compounds.
- (d)
- According to the acquisition methodology, the nodes responsible for displaying the results in a traceable manner focus on MS1 and MS2 ion acquisition modes. All these nodes are structured within an interconnected, node-based analytical architecture that is analogous to a relational data table. In this architecture, the compounds table functions as the primary analytical hub and the main section for selecting and reviewing substance-related information. Together, these modules enable a comprehensive and automated analysis of the spectral data, facilitating rapid compound annotation and prioritization for subsequent toxicological interpretation.
Precursors and pattern isotopic detection nodes (MS1):
- (a)
- “Mass list node” searches MS1 data for m/z ions based on molecular formulas included in exact mass lists obtained from sources such as HighResNPS. These formulas may be linked to either experimental or predicted retention times, depending on data availability. When retention time cannot be determined or estimated, the search is performed solely by molecular formula. This approach enables the comparison of millions of candidate molecules with the acquired ions through web-based repositories such as ChemSpider. The HRMS strategy offers a high screening capacity and superior analytical sensitivity compared to low-resolution mass spectrometry.
- (b)
- The “Pattern Isotopic Scoring node”, through MS1 data, compares experimentally observed isotope distributions with their theoretical counterparts to support compound identification, particularly for halogenated species containing elements such as Cl or Br. Additionally, the “Predict Composition node” determines molecular formulas from experimental monoisotopic masses within a specified ppm tolerance, using predefined atomic combinations (e.g., C, H, N, O, S, F, Cl, Br, and I).
Identification nodes (MS2):
- (c)
- For identification purposes, compound fragmentation is crucial, at least at the MS2 level (Figure 1). Identification and library searching identification used online resources such as the “mzCloud node”, together with local spectral libraries integrated within the “mzVault node”, including CDC Opioid HR Spectral Library; NIST HR1/HR2 (2023); HighResNPS Consensus Library (March 2025); and the in-house INTCF library.
The search based on diagnostic ions and on common neutral losses associated with specific structural cores of compound families also contributes to structural elucidation and to down–top (MS2 → MS1) searching. These searches are integrated into the workflow in the following nodes:
- (d)
- “Compound class node”: This node searches for common fragment ions that are characteristic of the shared molecular backbone or structural motif. These fragments appear consistently across related analogues and can be applied as search filters or incorporated into query criteria when examining all fragment ions generated in the analytical workflow results.
- (e)
- “Neutral loss node”: This node searches for predefined neutral losses within the MS2 spectral data. The more characteristic and specific a neutral loss is, the more valuable the information it provides, for example, the loss of a glucuronide group on phase II glucuronide metabolites. These patterns can occasionally be detected in MS1 as well—albeit to a lesser extent—due to in-source fragmentation, meaning they are not exclusively restricted to MS2.
- (f)
- Additional nodes that provide substantial information and enhance the analytical output include the “Mass Defect node”, the use of “Molecular Networking node”, and theoretical fragmentation models weighted by logic-based scoring approaches (e.g., “mzLogic” and “FISh scoring” nodes). Compound-specific fragmentation maps can also be incorporated for targeted metabolic studies, drawing on established fragmentation pathways reported in the literature. These strategies may be further extended through the use of exact mass lists and molecular formulas with in silico tools such as GLORYx (https://nerdd.univie.ac.at/gloryx/, accessed on 10 December 2025) or BioTransformer 3.0 (https://biotransformer.ca, accessed on 10 December 2025).
As noted previously, Figure 2 provides a conceptual overview that illustrates how these nodes interact and how they can be progressively integrated and parameterized for both targeted and non-targeted workflow searches. This integration is enabled through the application and combination of various Structured Query Language (SQL) filters across multiple analytical strategies and substance or metabolite families. Such an approach facilitates the detection of compounds that might otherwise remain overlooked in conventional targeted or targeted-screening workflows.
Once all relevant nodes have been applied and the results tables generated, filtering becomes essential for navigating and interpreting the large volume of indexed information. Filter optimization and data-mining strategies therefore constitute a critical, independent stage of the workflow. As an example, this study illustrates the detection and screening of glucuronide-conjugated compounds through two parallel execution branches: (i) a non-targeted workflow based solely on intrinsic spectral parameters—such as characteristic neutral losses—without relying on predefined molecular lists and (ii) a targeted workflow that incorporates additional constraints derived from predictive exact mass lists to focus on potential phase II conjugates. Both branches share the same preprocessing and feature-detection framework, diverging only during the filtering and annotation stage, where distinct SQL rules and reference lists are applied (Figure 2).
As mentioned before, together, these modules enabled a comprehensive, automated analysis of the spectral data, facilitating rapid compound annotation and prioritization for further toxicological interpretation. The systematic application of neutral-loss and compound-class fragmentation pattern modules is interpreted through the “Compound Class Scoring” and “Neutral Loss” nodes, which filter and classify compounds according to their MS/MS fragmentation behavior. These tools are particularly valuable for recognizing structural motifs, especially in the context of NPS.
Detection of glucuronide metabolites: Phase II glucuronide conjugates were identified using in silico-generated metabolite lists obtained through specialized predictive tools. A qualitative approach was applied by combining neutral loss filtering (−176.0321 Da, corresponding to the glucuronide moiety) with the interpretation of characteristic MS/MS fragment ions to support structural confirmation.
3. Validation of the Qualitative Method
To assess the reliability and applicability of the proposed method for urine analysis, a qualitative validation was conducted using available certified reference materials. Parameters and acceptance criteria were defined according to internationally recognized guidelines for exploration studies [33,34,35,36,37,38,39], with a focus on reproducibility, detection capability under real conditions, and interference minimization.
3.1. Selectivity/Specificity
Selectivity and specificity were assessed by confirming the absence of interferences in blank and fortified negative samples and by verifying compound-specific detection in both real case samples and calibration standards. The method’s ability to distinguish target analytes from endogenous or exogenous matrix interferences was assessed in:
- (a)
- Two diluted blank urine samples (Or/Dil-00) without internal standard (ISTD) as negative controls.
- (b)
- Ten diluted urine samples (Or/Dil-0) from different individuals, pre-characterized as negative, with ISTD addition.
- (c)
- One spiked sample containing the compounds from the mixture (see Table S1 for details), along with a set of real samples used to evaluate potential cross-interference by analyzing at least 10 different cases.
- (d)
- One highest calibration level sample without ISTD to evaluate residual contributions.
Acceptance criteria:
- No significant signal should appear in ISTD channels in conditions (a) and (c).
- Signals in conditions (b) and (d) must not be below the limit of identification (LOI) for evaluated substances.
This design checks absence of matrix or cross-contamination interferences and instrumental specificity against possible non-target interfering compounds.
3.2. Limit of Detection (LOD) and Limit of Identification (LOI)
To validate the minimum level of reliable detection and identification of the compound, these parameters were assessed and evaluated with spiked samples at decreasing concentrations at six concentration levels (50, 25, 10, 5, 2.5 and 1 ng/mL).
The limit of detection (LOD) was defined as the minimum concentration at which the analyte can be detected through precursor ions in first-order mass spectrometry (MS1), meeting the following criteria: a signal-to-noise ratio (S/N) ≥ 3, mass accuracy within ±5 ppm, consistent retention time (≤0.1 min intraday and ≤0.2 min interday), and isotopic pattern agreement.
In turn, the limit of identification (LOI) was defined as the lowest concentration level at which the analyte fulfilled all these detection criteria, while also allowing positive confirmation through the acquisition of HRMS/MS spectra (MS2), obtained in this case from the fragmentation of the precursor ion.
Signal-to-noise ratios were calculated by Compound Discoverer software using the peak height-to-root-mean-square (RMS) noise approach from extracted ion chromatograms (±5 ppm mass window).
Peak intensity corresponds to the height of the chromatographic peak obtained from the extracted ion chromatogram (EIC), while and RMS noise represents the root mean square of the local baseline noise.
The RMS noise was calculated automatically by the software from signal fluctuations in chromatographic regions adjacent to the analyte peak, excluding the peak itself, using the same exact mass extracted ion chromatogram. The noise estimation was therefore compound-specific and locally determined for each chromatographic signal.
For reliable identification, additional quality criteria were applied. Each analyte was required to exhibit at least five scans of the precursor ion always within the ±5 ppm mass window, because in case noise is absent in HRMS, a signal should be present in at least five subsequent scans [37]. We also applied a minimum peak intensity (height) of 100,000 counts units.
All these parameters are integrated together with additional algorithmic settings within the peak detection node, where they are jointly applied during compound detection and signal processing.
Acceptance criteria for LOD, in line with international guidelines [33,34,35,36,37,38,39]:
- Signal-to-noise ratio (S/N) ≥ 3.
- At least 5 scans of the precursor ion within the ±5 ppm mass window.
- Peak intensity ≥ 100,000 counts units (height), not area.
- Intraday retention time variation ≤ 0.1 min (≤2% relative to batch control at ~5 min retention).
- Interday retention time variation ≤ 0.2 min.
Additional acceptance criteria for LOI, in line with international guidelines [33,34,35,36,37,38,39]:
- At least two ions with a mass error ≤ 5 ppm, at least one of which must correspond to the precursor ion in MS1.
- It is strongly recommended to have at least a spectral match ≥ 60%, in reverse search.
3.3. Matrix Effect (ME%)
We assessed the degree of signal suppression or enhancement caused by the matrix, as well as process recovery and efficiency. This is evaluated by comparing signals from two sets of diluted urine and solvent-based standards at 10 ng/mL and 50 ng/mL.
- SET-1: standard mixtures prepared in methanol solution without matrix, five replicates per concentration.
- SET-2: standards spiked post-dilution in ten different matrices, ten matrices per concentration.
The matrix effect is expressed as a percentage of signal enhancement or suppression, as follows:
Values below 100% indicate ion suppression, whereas values above 100% indicate ion enhancement.
In accordance with the SANTE guideline, matrix effects were evaluated considering two complementary criteria:
- (i).
- The magnitude of ion suppression or enhancement, expressed as the mean ME% value, and
- (ii).
- The consistency of the matrix effect across different matrix sources, expressed as the relative standard deviation (RSD%).
Different international validation guidelines apply slightly different acceptance ranges for the magnitude of matrix effects. For example, the SANTE guideline considers acceptable ME values within 70–130% (80–120% recommended), whereas the ANSI/ASB 036 guideline applies a narrower intermediate range of 75–125%. Despite these differences, all guidelines emphasize that the critical parameter is the reproducibility of the matrix effect, typically requiring an RSD ≤ 20% across matrix sources.
Accordingly, matrix effects were considered acceptable when the mean ME% values fell within the guideline-defined ranges and the associated RSD did not exceed 20%, ensuring robust method performance and consistent ionization behavior across different matrix samples.
This approach enables discrimination between the absolute magnitude of ion suppression or enhancement and its reproducibility across different matrices, the latter being the key determinant of method robustness when matrix-matched calibration is applied.
Recovery and efficiency were not evaluated, given direct preparation without extraction or hydrolysis.
- Acceptance criteria:
Therefore, the applied acceptance criteria were defined as follows: Matrix effects or suppression or enhancement were evaluated according to consensus or guidelines and were considered. Ideally, matrix effects were within the range of 75–125% and the associated RSD did not exceed 20%. It is acceptable despite ion suppression or enhancement when the mean ME exceeds the 75–125% range, provided that the associated RSD is below 20%.
3.4. Carryover
We investigated potential sample-to-sample contamination by analyzing blank matrices immediately after injection of the highest concentration standard and selected high-concentration analyte samples.
- Acceptance criteria:
Total absence of signal or signal below LOI in blanks, with respect to the applied identification criteria in Section 3.2, were accepted.
4. Results and Discussion
In this section, the results of the qualitative validation parameters obtained for the more than 200 substances included in this study (Section 4.1) are shown and discussed. Then, the non-targeted screening workflow for the predictive identification and software-assisted localization of Phase II conjugated metabolites is shown (Section 4.2). Finally, a brief discussion of the impact of this non-targeted predictive strategy is made to show its potential in the forensic context (Section 4.3).
4.1. Method Validation
Qualitative validation of the method was performed using diluted urine samples, following the previously described criteria. The results of the method validation for the 203 compounds are presented in Table 2. This table provides a detailed overview of the individual evaluated parameters, such as limit of detection (LOI), matrix effect (ME%), and reproducibility (RSD%) values for each compound, allowing for the assessment of performance parameters at each concentration level. Name and molecular formula, ionization mode, and m/z are also included. Selectivity, specificity and carryover effect were evaluated as part of the method validation.
Table 2.
Distribution of LOI values by concentration level for the 203 compounds evaluated.
4.1.1. Selectivity and Specificity
No signals above the LOI threshold were observed for the deuterated internal standards (ISTDs) in blank diluted urine samples (Or/Dil-00) or in fortified samples lacking ISTDs. Negative urine samples from different individuals, when spiked with ISTDs, showed consistent signals corresponding to the expected compounds, with no significant cross-interferences. Additionally, no residual signals exceeding the LOI threshold were detected in methanolic blanks injected after high-concentration samples. These results confirm that the method is selective and specific for the target analytes under the tested conditions.
4.1.2. Limit of Detection (LOD) and Limit of Identification (LOI)
The LOI was assessed for a set of spiked compounds at decreasing concentrations: 50, 25, 10, 5, 2.5, and 1 ng/mL. Each compound was analyzed at all concentration levels, and the lowest concentration meeting the identification criteria was recorded. These criteria included a signal-to-noise ratio ≥ 3, at least two fragment ions within ±5 ppm, a spectral match score ≥ 60%, and a retention time assignment within predefined tolerance limits (see analytical validation parameters section). As seen in Table 2, out of the 203 analyzed compounds, 54 met the identification criteria at 1 ng/mL, 71 at 2.5 ng/mL, 25 at 5 ng/mL, 29 at 10 ng/mL, 22 at 25 ng/mL and 2 at 50 ng/mL. These results are clearly shown in Table 2.
The urine matrix, in most cases, provides a significant contribution of very valuable information for determining the consumption of substances and commonly used drugs, both in living subjects and in deceased individuals (postmortem cases) [10]. This is due to the high concentrations typically found in urine and to its role as an excretory pathway with an extended detection window compared to other toxicological matrices (such as blood or oral fluid).
Although its main relevance lies more in the qualitative domain, the LOI is the most decisive parameter, and will therefore be the main focus of the results (see LOD and LOI in Table 3).
Table 3.
Individual results for limit of identification (LOI), matrix effect (ME%), and relative standard deviation (RSD %) obtained in diluted urine samples for the 203 compounds ordered alphabetically. Values were evaluated according to the acceptance criteria established for qualitative validation in this biological matrix and ordered by alphabetic name.
Despite the identification-based analysis of substances rather than in the actual concentrations detected, it is nevertheless necessary to validate and establish its selectivity and sensitivity, as well as its capability to detect substances and their metabolites. Within the methodologies applied in the clinical and forensic fields, sometimes it is necessary to define a cut-off of positive concentration, especially in specific typologies of analysis [40,41].
In general, we can consider good identification for non-targeted screening, a good capability of identification at concentrations ≤ 10 ng/mL in 183 out of 203 substances, where, in this particular methodology, 54 out of 203 substances were identified at concentrations ≤ 1 ng/mL: for example, the two compounds imipramine and gliclazide (see Figure 3).
Figure 3.
LC–HRMS identification of two example compounds’ LOIs: imipramine and gliclazide. Extracted ion chromatograms of the protonated molecules ([M+H]+, MS1) obtained at different concentration of LOI are shown on the left, while experimental MS2 spectra are compared with reference spectra from the internal library (INTCF) and the mzCloud web library on the right. Identification was confirmed based on retention time, accurate mass, and MS2 spectral matching.
Some compounds present chromatographic limitations, such as those that share a structural motif typical of many ACE inhibitors (spirapril, perindopril, enalapril and enalaprilate), since they are esterified prodrug-type compounds with a peptidomimetic backbone that includes an amide bond, a proline-derived (or proline-like) ring system involved in ACE binding, and a carboxylic acid/carboxylate functionality in their active diacid forms (for example, enalaprilat, the active metabolite of enalapril—see Figure 4). Likewise, other compounds may be affected by ionization phenomena, which will be discussed in more detail in Section 3.3.
Figure 4.
LC–HRMS identification of enalaprilate and enalapril. Extracted ion chromatograms of the protonated molecules ([M+H]+, MS1) obtained at different concentrations (1–50 ng/mL) are shown on the left, while experimental MS2 spectra are compared with reference spectra from the internal library (INTCF) and the mzCloud web library on the right. Identification was confirmed based on retention time, accurate mass, and MS2 spectral matching. On the left, overlayed extracted ion chromatograms at different concentrations are shown; each color represents a concentration level, with increasing peak area and height reflecting the concentration–response relationship and consistent retention time across levels. On the right, the MS/MS spectra are shown: the top panels correspond to mzVault spectra and the bottom panels to mzCloud spectra. Grey peaks represent the reference spectrum, green peaks indicate matching fragment ions, and red peaks correspond to non-matching ions contributing less to the spectral similarity score.
4.1.3. Matrix Effect
Although this method is intended solely for qualitative analysis and the dispersion of ionization reflected by the RSD is a critical factor, matrix effects were also evaluated at the concentration levels used for the calculation of the LOD and LOI.
Matrix effects are a well-known limitation in liquid chromatography–mass spectrometry (LC-MS) analyses, especially when evaluating complex biological matrices such as urine without any pre-treatment. Although this preparative strategy (dilute and shoot) has undeniable advantages—it is fast, inexpensive, requires no consumables or qualified personnel, and does not depend on the efficiency and yield of analyte extraction or the release of conjugates, which can lead to incomplete releases, instability, transformations, and artefact formation—it does have limitations.
Co-eluted endogenous compounds can interfere with the ionization process, causing ion suppression or enhancement, which alters the analyte response and compromises analytical reliability.
Regarding suppression or enhancement, most results fell within the 75–125% interval range with 143 compounds at 10 ng/mL and 158 at 50 ng/mL, suggesting signal consistency or a slight enhancement compared to the theoretical value. A considerable number of observations also fell within the 75–100% interval, indicating moderate signal suppression. Extreme suppression values (<50%) were not observed. However, a signal gain greater than (>) 150% was observed in 13% of compounds (n = 27; Acetaminophen (Paracetamol), Astemizole, Azatadine, Benazepril, Camazepam, Cilazapril, Ciprofloxacin, Clozapine, Dexchlorpheniramine, Doxylamine, Enalapril, Enalaprilat, Linagliptin, MHD (10,11-Dihydro-10-hydroxycarbamazepine), Mirtazapine, Moxifloxacin, Ofloxacin, Olanzapine, Olmesartan medoxomil, Perindopril, Quetiapine, Quinapril, Risperidone, Spirapril, Theophylline, Tiprolidine, Torasemide (Torsemide)). These results are appropriate for the qualitative method.
Several studies have demonstrated that ion suppression represents the most critical matrix-related phenomenon, as it may significantly decrease analyte signal intensity, potentially reducing responses below the limit of detection (LOD) and limit of identification (LOI). When this occurs, compounds present in the sample may remain undetected, leading to false negative results and reduced reproducibility, especially in qualitative screening methods [42,43,44].
In contrast, signal enhancement is generally considered less problematic for qualitative purposes, since increased ionization efficiency does not hinder analyte detection, although it may affect quantitative accuracy [43,44]. Consequently, suppression effects are regarded as the primary factor influencing method sensitivity, robustness, and reliability in screening methodologies.
Signal enhancement is indeed as problematic as signal suppression, because it can lead to detector saturation and erroneous identifications. However, this limitation is partially mitigated by signal gain being normalized by the ion transmission and accumulation process in Orbitrap systems. Although ion intensity may be amplified, it is also inherently limited by the ion trap located prior to cooled ion injection into the Orbitrap analyzer, namely the C-trap, with automatic gain control (AGC target), which fills the C-trap with ions [45,46,47]. This device regulates the number of ions entering the Orbitrap, preventing uncontrolled ion overfilling and reducing the risk of detector saturation. Consequently, while signal enhancement is observed, its impact on mass accuracy and isotopic pattern integrity is mitigated by this ion-capacity-controlled mechanism.
Interestingly, although some compounds exhibited notable ion suppression or enhancement, their matrix-effect values were not classified as unacceptable because the RSD did not exceed 20%, indicating limited variability. Consequently, this situation was observed in only a small subset of compounds.
This repeatability (RSD%) was evaluated at two concentration levels: 10 ng/mL and 50 ng/mL. The results are also summarized in Table 3.
Most compounds exhibited RSD values below 20%, with 191 observations at 10 ng/mL and 200 at 50 ng/mL, indicating good repeatability at both levels for a total of compounds of 203. Only a small number of compounds exceeded 30% at 10 ng/mL (n = 12; Amiloride, Cimetidine, Ciprofloxacin, Enalaprilat, Espirapril, Famotidine, Fluconazole, Hydrocortisone, Acetaminophen, Theophylline, Tiprolidine and Triamtereneat) and at 50 ng/mL (n = 3; Enalaprilat, Famotidine and Theophyline), likely due to matrix-specific interferences.
In general, the results obtained for the pharmacological families show good sensitivity, and their individual information by specific pharmacology class is included as Supplemental Information (see Table 3) [48].
However, these observed deviations must be discussed. Although 158 of the 203 compounds showed an LOI equal to or lower than 5 ng/mL, the 45 compounds with higher LOIs represent nearly 22% of the total. The drugs exhibiting a presumptive LOI above 5 ng/mL and their distribution are presented in the following Table 3.
According to Table 3, shown below, fluconazole (antifungal) and metronidazole (anti-bacterial) both contain an azole-type heteroaromatic ring, exhibiting matrix-induced ion suppression. This behavior is consistent with previous reports describing ion suppression effects for azole-containing compounds under ESI conditions, suggesting that the observed response is related to shared structural features rather than isolated com-pound-specific effects [49].
Doxylamine is a structurally related, lipophilic amine-containing compound that is readily protonated in ESI(+); however, its multi-aromatic and hydrophobic character can limit ionization efficiency depending on the analytical conditions. Because these compounds usually fragment at relatively low CID energies (NCE ≈ 10), they may also be more prone to in-source fragmentation when aggressive source settings are used, which may contribute to LOI values > 1 ng/mL. In addition, doxylamine and dexchlorphenamine show ion enhancement, suggesting the presence of endogenous interferences that alter the qualifier ions used to meet LOI criteria. The highest matrix effect observed in these compounds, olanzapine, loxapine, amitriptyline, oxcarbazepine and its metabolite MHD, share several common structural features that are typical of CNS-active psychoactive drugs. Most of them contain polycyclic ring systems (two or more fused or linked aromatic/heteroaromatic rings), which confer relatively high lipophilicity. In addition, oxcarbazepine and MHD cannot be measured intact by gas chromatography, for example, even when injected into a cooled, inert fused-silica capillary column, due to thermal decomposition into substituted iminostilbene derivatives [50]. A similar process may occur in the ESI source, which could explain the observed increase in LOI.
For, synthetic glucocorticoids, such as prednisone and methylprednisolone, the LOIs are 10 and 25. They share the characteristic steroidal cyclopentanoperhydrophenanthrene core, common to endogenous corticosteroids and other synthetic analogues such as hydrocortisone, prednisolone, dexamethasone and their isomer betamethasone. Their molecular structures are dominated by multiple hydroxyl and carbonyl functionalities, while lacking basic amino groups, which limits their protonation efficiency under positive electrospray ionization conditions. Which can be improved under positive ionization conditions by using optimized and specific mobile phases, for example, a higher percentage of formic acid (>0.1%) and the use of acetonitrile as the organic solvent.
Despite their preferential ionization in positive mode, the absence of strongly basic moieties and the presence of acidic hydroxyl groups and conjugated carbonyl systems make these compounds potential candidates for ultratrace detection under negative electrospray ionization, deprotonated form ([M–H]−) or acetate adduct form ([M+CH3COO]−) [51]. In this ionization mode, deprotonation processes may occur, similarly to other structurally related corticosteroids, enabling their identification alongside additional steroidal analogues exhibiting comparable physicochemical properties.
Also, other compounds contain a carboxylic acid or acidic sulfonamide group. From an analytical perspective, carboxylic acids often ionize poorly in positive-mode LC–ESI–MS because they are acidic groups that tend to remain neutral (COOH) under typical LC conditions and, when deprotonated (COO−), the sulphonamide groups (-NH-SO2−) have weakly basic functionalities and tend to remain neutral under typical LC conditions. In contrast, the N-H proton of the sulphonamide residue exhibits an acidic character due to the strong electronegative effect of the sulphonyl group. When deprotonated, the resulting anion is effectively stabilized by resonance over sulphonyl oxygen and are more efficiently detected in negative mode. Therefore, in ESI(+) they generally predominate in these groups, exhibiting lower proton affinity and weaker [M+H]+ signals, which favors the formation of [M–H]− and would explain a higher LOI for the compounds.
Other non-glucocorticoid compounds showed considerably higher limits of identification (LOI > 5 ng/mL), attributable to pronounced matrix effects exceeding 150%. This group included several NSAIDs (aceclofenac, diclofenac, ketoprofen, ketorolac, piroxicam, and suxibuzone), the coumarin anticoagulant acenocoumarol, diuretics and related agents (bumetanide, indapamide), lipid-lowering drugs (rosuvastatin), and renin–angiotensin system modulators (valsartan, telmisartan, and olmesartan medoxomil). Others included the renin–angiotensin system–pril–family (enalapril, enalaprilat and perindopril). These inhibitors exhibit mixed ionization behavior due to the presence of both carboxylic acid groups, which favor negative electrospray ionization, and amine functionalities, which allow detection in positive mode. As a result, they can be detected in both ionization modes, although greater sensitivity is generally achieved in negative mode, particularly for enalaprilat due to its diacidic structure. In addition, the chromatographic limitations associated with these compounds are discussed in the corresponding section, due to their high retention in a standard gradient method (see enalapril in Figure 4).
Saxagliptin, sitagliptin, and linagliptin share a common structural motif typical of DPP-4 inhibitors. In general, they contain a peptidomimetic scaffold designed to interact with the catalytic site of the DPP-4 enzyme that can present several challenges in LC–MS analysis, mainly because they are highly polar and basic (amine-rich) compounds that often show weak retention in reversed-phase LC, leading to early elution and co-elution with matrix components that cause strong ion suppression. In addition, they frequently form multiple ion species in ESI (e.g., [M+H]+, sodium/potassium adducts, and solvent-related clusters), which can split the signal and increase the LOI. Sildenafil and tadalafil seemed not to exhibit a great matrix effect. However, the LOIs are 5 and 25. With minimally cleaned urine, endogenous components often increase the baseline and cause co-eluting interferences near the retention time, which reduces signal-to-noise (S/N), worsens peak shape (broadening/tailing), and can destabilize quantifier/qualifier ions or RT matching—so a higher concentration is needed to confidently meet criteria established for LOI.
Despite all these limitations, in general, in urine samples, unlike blood and plasma samples within the toxicological range, whether forensic or clinical, there are few references establishing the required analytical sensitivity values. This is because urine is an excretory matrix that primarily reflects substance elimination rather than pharmacological effect.
Consequently, the relevance of the findings derived from the analysis will depend on the type of casework and the specific investigation conducted. The objectives differ depending on the casework applied, with particular emphasis placed on the detection of psychoactive substances and metabolites in contexts such as road traffic control. While forensic postmortem and clinical toxicology focus on identifying substances involved in acute intoxications, with or without a fatal outcome, in cases of chemical submission and chemsex the aim is to identify a panel of substances and determine their predominant role within a temporally associated pattern of use. In this context, extending the detection window by analyzing urine samples and other biological matrices, together with the inclusion of unequivocal markers of consumption and emerging psychoactive substances not including established panels, can significantly contribute to a more robust and well-founded forensic interpretation.
4.1.4. Carryover
Carryover was evaluated by analyzing blank samples immediately after injections of high-concentration standards. No significant residual signals were detected in any monitored channels. All signals observed in the blank samples were below the limit of identification (LOI), fulfilling the established acceptance criteria.
A good practice for quality control and result evaluation is to continuously monitor the presence of potential false positives by carryover and other factors. One effective approach is to inject reagent blanks between consecutive samples within the same analytical sequence. This allows proper evaluation of background signals, ensures traceability of the results, and enables systematic comparison between samples throughout the analytical run.
For the analytes evaluated in this validation, and particularly given that this is an open-scope (non-targeted) method, it is important to allow the assessment of this factor in other compounds as well.
As an example of several representative carryovers we evaluated, Figure 5 shows the signal from a negative target after injection of the highest level injected, 50 ng/mL. This figure was created using Trace Finder software version 5.1 SP2 (Thermo Scientific) to provide a clearer visualization of the areas, representing LOD, LOI and QC-50 ng/mL as well as the balance to evaluate carryover.
Figure 5.
Evaluation of carryover for olanzapine and risperidone under positive electrospray ionization mode (MS1, [M+H]+). The figure shows representative chromatograms for low levels (1 ng/mL), 2.5 ng/mL, and high levels of concentration (50 ng/mL) in urine, after injecting a blank urine sample for evaluate carryover. The representative substances were olanzapine (m/z 313.1414), risperidone (m/z 411.2198) O-desmethylvenlafaxine and tramadol (m/z 264.1913) and the isomers with no significant interference observed in the blank matrix (<LOI). RT = retention time; AA: area; AH: height; chromatograms processed signal with Trace Finder software (version 5.1 SP2, ThermoScientific).
As shown in Figure 5, no signal was observed for olanzapine at its corresponding retention time (RT) in the carryover sample. The measured peak height (AH: 3.2 × 10⁵, for level of LOI = 2.5 ng/mL) indicates the absence of residual analyte after injection of the highest concentration level 50 ng/mL (AH: 6.9 × 10⁶). In contrast, for risperidone a residual signal was detected at its RT, with a peak height of 9.7 × 10² in the blank for carryover. However, this response was lower than the peak height (AH:4.4 × 10⁵) obtained at the LOI (2.5 ng/mL), and the peak height (AH:7.8 × 10⁴) for a value of 1 ng/mL (LOD) in this blank was more than fifty times lower than that observed for the LOD, demonstrating that the observed signal does not compromise analytical evaluation of carryover for identification.
Another interesting case in this figure is that of tramadol and the isomeric compound O-desmethylvenlafaxine. They have the same molecular formula (C16H25NO2), and both are widely prescribed. In the case of O-desmethylvenlafaxine, it is also an active metabolite of venlafaxine, together with its other isomer and the product of amine demethylation (N-desmethylvenlafaxine). These three compounds share the same molecular formula, and despite their structural differences, their main diagnostic ion originates from the predominant fragmentation of the functional amine group highlighted in blue in Figure 5 ([C3H7N]+, m/z = 58.06513).
Chromatographic separation of tramadol and O-desmethylvenlafaxine can be observed and used to differentiate them (see Figure 5). In this case, carryover can be evaluated for both compounds, for which the obtained LOI was 1 ng/mL, with a peak height of AH: 2.3 × 10⁵ for tramadol, and the carryover observed in blank urine injected after the highest concentration level (50 ng/mL) was AH: 4.5 × 10³, >50 times lower using automatically generated integration, in addition to being non-fragmented. Therefore, the signal was below the limit of identification (<LOI).
4.2. Non-Targeted/Targeted Workflows for Prediction of Phase II Conjugated Metabolites
In non-targeted analyses, the larger number of precursor ions acquired in MS1 and fragments in MS2 makes result screening and filtering essential. HRMS coupled with high-quality data enables the conceptualization of molecular formulas based on MS1 precursor ions and MS2 fragmentation patterns, including characteristic neutral losses and diagnostic ions. This detailed interpretation, supported by advanced screening tools such as non-procedural SQL-based queries, facilitates the investigation of specific metabolites or entire compound families.
This section presents the results obtained from the investigation of phase II glucuronide-conjugated metabolites in urine samples of sixteen real cases. Predictive tools were applied to the non-targeted data processing workflow to analyze these samples. The initial total number of compounds detected before applying any SQL filters was in the thousand range (precisely 66,804).
In this case, two different strategies were applied for the detection of phase II glucuronide metabolites, through SQL filter processing and the use of diagnostic ions.
- FILTER 1: Non-targeted glucuronides
The workflow of this broad screening approach is shown graphically in Figure 2. The application of SQL filters directed the analysis toward potentially relevant signals, substantially reducing the number of uninformative compounds or candidates. In this example, a filter was used to detect a characteristic neutral loss designed as “Glucuronide,” corresponding to the mass loss (-C6H8O6) between the precursor ion and one of the observed fragments in the mass spectrum.
This strategy was complemented by assessing the chromatographic peak quality of the precursor ion using the “peak rating” parameter. It is recommended that a minimum threshold be set at ≥3 (maximum score: 10). This combination greatly improved the quality of the data, reduced irrelevant information and shortened the time it took for analysts to interpret it. This untargeted analysis also gained ability to detect toxicologically relevant metabolites, even when such compounds were not predefined in standard spectral libraries. Following this non-targeted workflow, a total of 225 candidate compounds were obtained from the over 66,000 detected ions. This means that 99.7% of the initially recorded ions were discarded. Only 0.3% showed an exact mass loss corresponding to glucuronide loss in their spectra, alongside the other defining features of Filter 1 (Figure 2, right branch of the results workflow).
- FILTER 2: Targeted glucuronides
This filter applies to the list of non-targeted glucuronides obtained by Filter 1 (see Figure 2, right branch of the results workflow, 3). It performs a mandatory match with a customized exact mass list (“customized mass list for predictive glucuronide compounds”), which includes over 550 compounds generated via macros from internal (INTCF) and external (mzVault) libraries (see Supported Information File). This targeted filter enables the automatic comparison of acquired data with theoretical exact masses and molecular structures of glucuronide conjugates. This enhances structural confirmation without altering other analytical parameters.
Both filters effectively enabled the detection of glucuronide metabolites of interest, underscoring the robustness of the data processing approach. However, the inclusion of the exact mass list in Filter 2 improved confirmatory identification, particularly for compounds requiring precise structural matching.
By using this workflow for filtering the targeted glucuronides from the non-targeted list of compounds, a total of 31 candidate compounds were obtained from the over 66,000 detected ions. This means that 99.95% of the initially recorded ions were discarded. Fewer than 0.05% showed an exact mass loss corresponding to glucuronide loss in their spectra, along with the other defining features of Filter 2.
Interestingly, this last workflow can also be expanded to encompass broader targeted searches that consider compounds not yet present in spectral libraries, thereby extending the analytical capability beyond predefined databases, particularly valuable during the early stages of a general screening.
4.3. Tentative Identification of Phase II Glucuronide Metabolites
After applying the previous workflows (Filter 1 and 2), the identification was based on the match between the exact mass of the precursor ion and the generated fragments, in accordance with multiple matching criteria. This instrumental evidence is essential for confirming the presence of active substance metabolites, even in the absence of free molecules.
In several spectra, characteristic neutral losses corresponding to conjugated groups such as glucuronic acid (-C6H8O6) were observed, serving as key diagnostic structural patterns in the interpretation of phase II metabolites. Figure 6 illustrates the tentative identification of mirtazapine–glucuronide (C23H27N3O6) using LR-HRMS/MS in a urine sample prepared by the dilute-and-shoot approach. A characteristic feature is the neutral loss of 176.03209 Da, corresponding to glucuronic acid conjugation. This neutral loss acts as a diagnostic marker for phase II metabolites, supporting the structural elucidation of the detected compound.
Figure 6.
Precursor formula and chromatogram (left) and MS2 spectra showing the neutral loss of glucuronide (right) of mirtazapine–glucuronide obtained by direct injection of a diluted urine sample (“dilute-and-shoot” pre-analytical preparation). The five most abundant ions of mirtazapine glucuronide (1*, 2*, 3*, 4*, and 5*) are highlighted in the figure.
Figure 7 additionally depicts the MS/MS fragmentation spectrum of the protonated precursor ion for mirtazapine glucuronide [C23H27N3O6+H]+ at m/z 442.19684. The spectrum exhibits several diagnostic characteristic fragments of mirtazapine, including the fragment of the mirtazapine aglycon precursor ion. Ranked by relative abundance, the major fragment ions were observed at m/z 266.16522 (free mirtazapine aglycone, [C17H19N3+H]+), 195.09183, 72.08163, 209.10751, and 194.08456. The key fragment at m/z 266.16522 serves as a molecular fingerprint for the original active compound after the glucuronide group (−176.03209, -C6H8O6) has been lost. The other fragments result from specific bond cleavages within the tetracyclic structure of mirtazapine.
Figure 7.
ESI–MS/MS product ion spectra of protonated mirtazapine and its glucuronide conjugate . The glucuronide spectrum shows the characteristic neutral loss of 176.0321 Da, resulting in the aglycone ion at m/z 266, Interestingly, the five most abundant ions of mirtazapine glucuronide (1*, 2*, 3*, 4*, and 5*) are highlighted and can be compared with their relative abundances in mirtazapine in this figure.
Table 4 shows the MS1profile of the mirtazapine–glucuronide precursor, including the ionized molecular formula and its exact mass. This feature was filtered to obtain its corresponding MS2 spectrum. The five selected fragment ions observed for of mirtazapine are also present in the parent drug spectrum, sharing identical exact masses but exhibit different relative abundances. Thus, this table shows that the most abundant fragment ion corresponds to the protonated mirtazapine structure, resulting from neutral loss produced by the labile conjugation of mirtazapine in its glucuronidated form. All of the remaining fragments are present in the parent compound, although their abundances differ from those of mirtazapine due to the varying degrees to which phase II glucuronide conjugation affects the spectrum and ion intensities.
Table 4.
MS1profile of the precursor [M+H]+ of mirtazapine–glucuronide, including the ionized molecular formula and its exact mass and five MS2 selected fragment ions of mirtazapine providing the same exact mass of the precursor.
Additionally, Figure 7 displays the fragmentation pattern of the protonated mirtazapine and its glucuronide conjugate. Fragment ions 1–5 were observed in both spectra; however, differences in their relative abundances were noted in the glucuronide, likely due to the presence of the conjugated moiety and its effect on fragmentation. Accordingly, the high mass selectivity of HRMS allows a tentative yet well-supported assignment of the molecule to this compound, despite its absence from existing spectral libraries and the lack of systematic cataloguing. Notably, this metabolite has been previously reported in a pharmacokinetics study. The work of Delbressine et al. [52] focused on the pharmacokinetics and biotransformation of mirtazapine in human volunteers. They noted that the R(−)-enantiomer exhibited a longer half-life plasma elimination, attributed to its preferential conversion to a quaternary ammonium glucuronide that may undergo deconjugation, thereby recirculating the parent compound and prolonging its elimination. In contrast, the S(+)-enantiomer was primarily metabolized to an 8-hydroxy glucuronide.
This neutral loss, resulting from the labile glucuronide conjugation, can be readily and automatically recognized, as demonstrated by the consistent results obtained for several additional glucoronidated metabolites analyzed in this study, including 8-hydroxy-mirtazapine–glucuronide, bisoprolol–glucuronide, hydroxyalprazolam–glucuronide, alprazolam–glucuronide, morphine-6–glucuronide, cenobamate–glucuronide and desmethyltramadol–glucuronide (see Figures S1–S14 of the Supplementary Information) [45].
In a general and more theoretical manner, Figure 8 illustrates how this neutral loss occurs in at least two types of glucuronide conjugation: through linkage to a quaternary amine (N–glucuronide) or through oxygen linkage, typically involving hydroxyl, phenol or acid carboxylic groups at the β-D position on the dextrorotatory configuration, commonly referred to as β-D–glucuronides.
Figure 8.
Illustration of the characteristic neutral loss of glucuronide (−176.03209 Da) observed in the phase II metabolites, showing the two principal conjugation pathways: (A) N-glucuronidation of quaternary amines and (B) O-glucuronidation of hydroxyl or carboxyl groups in the β-D configuration. The resulting aglycone fragment, generated after glucuronide cleavage, provides a diagnostic feature that supports the tentative identification of glucuronide conjugates in non-targeted analyses. Both the glucuronide and the loss of the glucuronide are visualized in blue in this figure.
Conversely, directly comparing fragment selectivity and mass accuracy constitutes, in itself, a highly powerful approach for both screening confident identification. For mass accuracy, the mass ion error is measured in parts per million (ppm) between the expected and observed fragments and is always minimally <5 ppm, with the exception of fragments below m/z <100, but this can be corrected by introducing butylamine (C4H11N, m/z = 74.096425) into the calibration, which is included in the same calibrant mixer solutions; however, commercial libraries and standard instruments do not correct the mass axis with this substance update. Instead, the first ion normally used is derived from the in-source fragmentation of caffeine (m/z = 138.0648). This reflects excellent instrumental accuracy and supports reliable molecular assignments. This level of resolution and mass exactness is crucial for distinguishing between compounds with similar ions but different formulas in complex biological matrices.
This extraordinary selectivity means that identifying the exact mass of these fragments, regardless of their relative abundance, constitutes a valid identification parameter in itself. This is recognized in international guidelines, which accept it as an independent and sufficient identification criterion [37].
Moreover, these fragments can be directly compared with mirtazapine fragments once the glucuronide has been lost. This can be done either by submitting the suspect compound to the mzCloud library and comparing MS2 sub-spectra or by matching them through their inclusion list and comparing them with the exact mass list used in Filter 2. The precise match between theoretical and experimental fragments confirms the identity of the compound, minimizing the risk of false positives due to isomers or matrix interferences.
In summary, this set of data illustrates how the integration of predictive criteria—such as characteristic neutral losses—with detailed MS/MS fragment analysis enables robust structural identification of conjugated metabolites. This combined approach ensures not only detection but also the precise structural confirmation of toxicologically relevant compounds, even in the absence of the free drug. The concordance between theoretical and experimental fragments validates the findings and exemplifies the potential of untargeted analysis supported by advanced data processing tools.
4.4. Forensic Impact of Non-Targeted HRMS Predictive Strategies
The implementation of predictive exact mass lists and structural filtering significantly enhanced the detection of glucuronide conjugates, which are frequently absent from commercial spectral libraries.
By combining high-resolution mass filtering, SQL-based identification of diagnostic neutral losses (e.g., −176.0321 Da), and MS/MS fragmentation analysis, the strategy enables the identification of key phase II metabolites, including mirtazapine–glucuronide, alprazolam–glucuronide, and morphine-6–glucuronide, among others. These conjugates often represent the only detectable biomarkers in post-consumption or postmortem samples, particularly when the parent drug is no longer present. In several cases, glucuronide metabolites were detected even in the absence of their corresponding aglycone parent compounds, underscoring the relevance of incorporating biotransformation pathways into non-targeted analytical workflows. Moreover, the proposed approach is readily adaptable to the continuous emergence of novel substances and evolving metabolic profiles, thereby ensuring broad and flexible analytical coverage.
4.4.1. Comparison with Non-Targeted Workflows and Existing Libraries
This strategy aligns with prior recommendations, such as those by Maurer and Meyer [16], advocating for the expansion of HRMS libraries to include metabolite data. However, unlike traditional static libraries that rely solely on experimentally acquired spectra, the current method incorporates experimental entries generated from curated chemical structures.
In this case, the work focuses on predicting phase II metabolism and the neutral loss patterns that are commonly observed. Particular emphasis is placed on the prediction and correlation of glucuronide loss. The analysis identifies and compares the different molecules that may undergo phase II metabolism through glucuronidation and compares them with the known free drug. Thanks to the high quality of HRMS data, the mere presence of fragments with accurate mass provides highly selective and complementary information for identification purposes. This approach is one of the strategies employed within the diagnostic ion framework [13] on the precursor and the neutral loss of glucuronide, of structurally theoretical predictions of experimentally unconfirmed metabolites, including a wide range of glucuronidated and hydroxylated species. By overcoming the constraints of targeted workflows, this methodology enables the identification of both phase I and phase II metabolites. Furthermore, its flexibility enables continuous updates as new metabolic and structural data emerge, thereby enhancing its relevance and applicability in forensic toxicology.
After applying this strategy to real forensic cases, specifically to a set of 16 cases analyzed at the INTCF, the results summarized in Table 5 were obtained. The table compiles the abundances of the major phase II glucuronide-conjugated compounds that were detected and subsequently incorporated into the INTCF working library as tentatively identified compounds. These compounds were also compared with those found in other types of cases within the same study, and they were observed exclusively in cases involving the consumption of the corresponding substances and their associated metabolic pathways. In total, the table includes 50 spectra, most of which—as expected—correspond to compounds typically undergoing phase II conjugation metabolism, such as benzodiazepines, related drugs, and cannabinoids.
Table 5.
Selected phase II-conjugated compounds (glucuronides) were detected during routine analysis and incorporated into the INTCF library as tentative identified compounds. This table includes the characteristic neutral loss of glucuronide (-C6H8O6, −176.03209 Da), Relative Retention Time (RRT) and the abundance of the corresponding free drug or metabolite fragment observed in the spectrum after glucuronide cleavage. The abundance percentages were extracted from an Excel file of the used library. Annotation (INTCF **): tentative identification in a real sample spectrum without reference standards, assigned by INTCF.
Pre-analytical methods that do not include a hydrolysis sample preparation step, such as the “dilute and shoot” preparation used in this study, can directly assess these conjugated metabolites, which typically do not appear in spectral libraries. Regarding the specific neutral loss of glucuronide, it is noteworthy that this loss was the base peak, or the most abundant fragment, in 50% of the spectra (25 out of 50).
Compounds with short half-lives and extensive metabolism are also recommended for targeted and non-targeted detection, particularly those exhibiting psychoactive effects. This includes various substances—such as paracetamol and stanozolol. In the case of stanozolol, two glucuronide metabolites were tentatively identified in the analyzed biological samples. According to the consulted literature, these metabolites can be conjugated primarily through the pyrazole ring (N–glucuronides), such as 17-epistanozolol-1N–glucuronide and 17-epistanozolol-2N–glucuronide [53], or alternatively through hydroxyl groups (β-D–glucuronides). The detection of these metabolites is of particular interest due to their higher stability and the extension of the detection window compared with other conjugated metabolites present in urine samples, being especially relevant when compared to hydroxy-metabolites such as 3′-hydroxy-stanozolol glucuronide [53,54]. This is especially relevant in urine samples, although they can also be detected in other types of matrices, such as blood, tissues and viscera. For their detection, these metabolites must be properly identified, typically through non-targeted data processing strategies and predictive searching and subsequently incorporated into conventional analytical methods and libraries. This process should be carried out in parallel with the study itself or supported by existing scientific literature and published reports.
The glucuronide of the drug, compared to the free drug using its Relative Retention Time (RRT = glucuronide-drug/free drug), is generally eluted earlier than the free drug, with RRT ratios typically ranging from 0.7 to 1 with respect to the free drug (see Table 5). However, reliable prediction retention time requires models that account for structural differences and the specific sites and types of conjugation at the functional groups involved. This task is further complicated by the presence of multiple equivalent isomeric metabolites (e.g., hydroxy metabolites, for example). The mzVault-format library generated in this study has been deposited in Mendeley Data (https://doi.org/10.17632/p5js4nf9hw.1) [48].
4.4.2. Forensic Impact
From a forensic standpoint, the ability to detect phase II glucuronide conjugates significantly strengthen the interpretive capability of toxicological analyses. In scenarios such as postmortem investigations, therapeutic drug monitoring, or suspected overdose cases, these metabolites may represent the only remaining chemical evidence of drug intake. The proposed non-targeted/targeted workflow for analyzing diluted urine analysis by LC-HRMS offers a practical, sensitive, and efficient solution for screening a broad range of compound classes. These include benzodiazepines, opioids, antidepressants, and synthetic drugs including NPS such as synthetic cannabinoids, synthetic cathinones (amphetamine-type stimulants) and synthetic opioids (e.g., nitazenes). The ability to detect low-abundance metabolites in complex biological matrices without extraction or hydrolysis steps makes this workflow particularly valuable in forensic settings where time, resources, or sample volume may be limited.
4.4.3. Integration with Others Predictive Forensic and Analytical Strategies
These exact mass lists can be accompanied by or integrated with filters for predictive fragmentation of diagnostic ions by families [35], specific mechanisms of metabolites, and in silico searches for specific metabolites (see the work of Menéndez-Quintanal et al. [55]) that are more specific to certain compound families. They can also be incorporated into the proposed non-targeted/targeted workflow, which includes predicted retention times (RTs) generated through a machine learning model based on artificial neural networks (ANNs), eliminating the need to know the experimental retention time of the glucuronidated compound. This model integrates data from multiple chromatographic systems using a one-hot encoding strategy similar to that implemented in HighResNPS (https://highresnps.com/ (accessed on 10 December 2025); refer to Pasin et al. [26]).
5. Conclusions
The dilute-and-shoot sample preparation strategy demonstrated in this work proved particularly advantageous for non-targeted LC-HRMS/MS screening, as it eliminates reliance on extraction efficiency and analyte recovery. By reducing variability associated with extraction yield, matrix-dependent losses, and incomplete release of conjugated metabolites, the approach enhances the overall robustness and reproducibility of the method. Moreover, avoiding selective clean-up steps enables broader coverage of chemically diverse compounds, minimizing the risk of extraction-related bias.
The analytical performance obtained for the 203 evaluated compounds indicates that the proposed strategy enables low limits of identification for most analytes. Specifically, 61.5% of compounds showed LOI values ≤ 2.5 ng/mL and 74.3% ≤ 5 ng/mL. These higher limits were mainly associated with intrinsic physicochemical and analytical constraints, including limited ionization efficiency under positive ESI, in-source fragmentation, chromatographic behavior, or matrix effects. Reduced sensitivity was especially noticeable for compounds containing acidic, sulfonamide, or carboxylic groups; steroid-like scaffolds; or highly polar molecular structures under positive ESI.
The monitoring of glucuronide conjugates allows for simplified sample preparation while maintaining analytical performance, as demonstrated by the methodological validation in urine using the dilute-and-shoot approach. This is particularly relevant since chemical or enzymatic hydrolysis is feasible in urine but cannot be reliably performed in matrices such as blood or vitreous humor. The ability to detect phase II metabolites effectively extends the detection window and enables interpretation of true drug consumption rather than mere exposure—an essential advantage in postmortem toxicology or in cases where alternative tissues (e.g., muscle or liver) must be analyzed.
To support the investigation of parent-drug conjugations and phase I metabolites, the combined use of predictive searching, machine-learning-assisted mass spectral tools, certified material reference (CMR) and spectral libraries offers significant analytical value. The hybrid targeted/non-targeted workflow applied in this study, leveraging MS2-based structural elucidation, enabled the tentative identification of glucuronide metabolites not present in conventional spectral libraries, thereby expanding the analytical scope for forensic screening. Importantly, as more routine casework is processed and the method is embedded into day-to-day laboratory operations, newly observed tentative glucuronide metabolites are progressively curated and can be incorporated into the mzVault library and updated in other methodologies (such as targeted screening methods, see a propouse for automatic update through File S3 whose origin is the library data, assisted by use of artificial intelligence, for create this file [48]. This turns the workflow into an iterative, self-improving system in which accumulated evidence continuously enriches spectral resources, refines predictive mass lists and characteristic fragments, and enhances future detection performance. Predictive mass lists incorporating characteristic fragment ions thus provide targeted insight within a non-targeted framework, while the adaptable and theory-driven nature of the approach overcomes the limitations of static libraries and supports ongoing updates as new metabolic knowledge emerges.
The incorporation of phase II metabolites substantially provides added value for toxicological interpretation, particularly in situations involving delayed consumption scenarios or postmortem investigations, where the parent drug may no longer be at detectable levels. For an operational perspective, the proposed workflow offers a rapid, efficient, and cost-effective alternative for forensic laboratories, enabling broad qualitative detection of multiple drug classes and their metabolites without the need for extraction or hydrolysis. Importantly, the approach can be applied to matrices for which hydrolysis is not feasible, such as blood, vitreous humor, and visceral tissues.
Taking this together, the combination of biotransformation knowledge with HRMS-based predictive filtering enables hydrolysis-free and efficient detection of glucuronidated metabolites, extending detection windows and improving the interpretive value of forensic toxicology. In addition, the flexible and library-independent design of the workflow allows retrospective interrogation of acquired data, facilitating the recognition of newly emerging substances as well as previously unreported metabolites.
Finally, SQL-based filtering strategies can be customized for targeted or non-targeted workflows, making it possible to integrate multiple conceptual approaches and parameterize result retrieval according to laboratory needs, incorporating strategic searches into the algorithm. This methodology is highly effective in multi sample studies and provides the scientific community with valuable analytical resources, including libraries suitable for both targeted and non-targeted applications. This is particularly useful in scenarios requiring rapid sample preparation or where hydrolysis is not feasible.
Its usefulness extends beyond forensic toxicology and is equally relevant in clinical toxicology.
Supplementary Materials
The following supporting information can be downloaded at: https://www.mdpi.com/article/10.3390/analytica7010018/s1.
Author Contributions
Conceptualization, J.M.M.; methodology, L.M.M.-Q., B.B.S. and J.M.M.; software, C.B., L.M.M.-Q. and J.M.M.; validation, C.B., L.M.M.-Q., B.B.S. and J.M.M.; formal analysis, C.B., B.B.S. and J.M.M.; investigation, C.B., L.M.M.-Q., B.B.S. and J.M.M.; resources, C.B., B.B.S. and J.M.M.; data curation, C.B., J.M.M. and L.M.M.-Q.; writing—original draft preparation, C.B. writing—review and editing, C.B., J.M.M., L.M.M.-Q., G.M., C.G.-R. and B.B.S.; supervision, L.M.M.-Q., G.M., C.G.-R., B.B.S. and J.M.M.; All authors have read and agreed to the published version of the manuscript.
Funding
This research received no external funding.
Data Availability Statement
Available upon request from josemanuel.matey@justicia.es.
Acknowledgments
The authors acknowledge the Spanish National Institute of Toxicology and Forensic Sciences (INTCF, Ministry of the Presidency, Justice and Parliamentary Relations) for instrumental resources and analytical platforms. The authors acknowledge the funding support from the Non-targeted foRensic multidisCiplinary platfOrm for inveStigation of drug-related fatalitieS (NARCOSIS) PROJECT. This project has received funding from the European Union’s Horizon Europe research and innovation programme (Civil Security for Society) under grant agreement No. 101168195.
Conflicts of Interest
The authors declare no conflict of interest.
References
- Maurer, H.H. Analytical toxicology: The basics. Toxicol. Chem. Pharmacol. 2010, 44, 123–137. [Google Scholar]
- Peters, F.T.; Drummer, O.H.; Musshoff, F. Bioanalytical method validation in forensic toxicology. Forensic Sci. Int. 2007, 165, 216–224. [Google Scholar] [CrossRef] [Scilit]
- Peters, F.T.; Wissenbach, D. Current state-of-the-art approaches for mass spectrometry in clinical toxicology: An overview. Expert Opin. Drug Metab. Toxicol. 2023, 19, 487–500. [Google Scholar] [CrossRef] [Scilit]
- Pope, J.D.; Black, M.J.; Drummer, O.H.; Schneider, H.G. Urine toxicology screening by liquid chromatography time-of-flight mass spectrometry in a quaternary hospital setting. Clin. Biochem. 2021, 95, 66–72. [Google Scholar] [CrossRef] [Scilit]
- Testa, B.; Krämer, S.D. The Biochemistry of Drug Metabolism; Wiley-VCH: Weinheim, Germany, 2008. [Google Scholar]
- Moffat, A.C.; Osselton, M.D.; Widdop, B.; Galichet, L.Y. Clarke’s Analysis of Drugs and Poisons, 4th ed.; Pharmaceutical Press: London, UK, 2011. [Google Scholar]
- Wille, S.M.R.; Elliott, S. The Future of Analytical and Interpretative Toxicology: Where are We Going and How Do We Get There? J. Anal. Toxicol. 2021, 45, 619–632. [Google Scholar] [CrossRef] [Scilit]
- Menéndez-Quintanal, L.M.; Matey, J.M.; González, V.d.F.; Serrano, B.B.; Hernández-Díaz, F.J.; Zapata, F.; Montalvo, G.; García-Ruiz, C. The state of the Art in Post-Mortem redistribution and stability of new psychoactive substances in fatal cases: A review of the literature. Psychoactives 2024, 3, 525–610. [Google Scholar] [CrossRef] [Scilit]
- Matey, J.M.; Menéndez-Quintanal, L.M.; Bravo Serrano, B.; del Fresno González, V.; Zapata, F.; Montalvo, G.; García-Ruíz, C. Analysis of NPS in post-mortem samples in forensic toxicology. In Comprehensive Analytical Chemistry; Elsevier: Amsterdam, The Netherlands, 2025. [Google Scholar] [CrossRef] [Scilit]
- Maurer, H.H. Towards better metabolite identification. Anal. Bioanal. Chem. 2016, 408, 1237–1244. [Google Scholar]
- Schymanski, E.L.; Jeon, J.; Gulde, R.; Fenner, K.; Ruff, M.; Singer, H.P.; Hollender, J. Identifying small molecules via high-resolution mass spectrometry: Communicating confidence. Environ. Sci. Technol. 2014, 48, 2097–2098. [Google Scholar] [CrossRef] [Scilit]
- Matey, J.M.; Zapata, F.; Menendez-Quintanal, L.M.; Montalvo, G.; Garcia-Ruiz, C. Identification of new psychoactive substances and their metabolites using non-targeted detection with high-resolution mass spectrometry through diagnosing fragment ions/neutral loss analysis. Talanta 2023, 265, 124816. [Google Scholar] [CrossRef] [Scilit] [PubMed]
- Scheidweiler, K.B.; Kuypers, K.P.C.; Fogarty, M.F.; Huestis, M.A. Application of LC-QTOF-MS for the identification of synthetic cannabinoid urinary metabolites without hydrolysis. Anal. Bioanal. Chem. 2015, 407, 7779–7790. [Google Scholar]
- Gundersen, P.Ø.M.; Spigset, O.; Josefsson, M.; Øiestad, E.L. Retrospective screening of postmortem toxicology samples using UHPLC-QTOF-MS and the HighResNPS database. Anal. Chem. 2023, 95, 1145–1153. [Google Scholar]
- Maurer, H.H.; Meyer, M.R. The role of LC-MS in identifying glucuronides and sulfates of drugs of abuse in urine. Bioanalysis 2010, 2, 469–483. [Google Scholar]
- Kanamori, T.; Kuwayama, K.; Tsujikawa, K.; Segawa, H.; Yamamuro, T.; Iwata, Y.T. Metabolic profiling of new synthetic opioids using human hepatocytes and high-resolution mass spectrometry. Drug Test Anal. 2023, 15, 123–135. [Google Scholar]
- Polet, M.; Van Eenoo, P.; Deventer, K. Detection of long-term metabolites of anabolic steroids using LC–HRMS in doping control. J. Chromatogr. B 2020, 1142, 122011. [Google Scholar]
- Rentsch, K.M.; Düllmann, M.; Jäger, U.; Vogel, H.; Geyer, B. Differentiation of codeine and morphine use by plasma and urine pharmacokinetics. Forensic Sci. Int. 2011, 212, 38–43. [Google Scholar]
- Staehli, L.; Steuer, A.E.; Binz, T.M.; Kraemer, T. Differentiation of morphine and codeine use by post-mortem concentrations and ratios. Forensic Sci. Int. 2020, 313, 110347. [Google Scholar]
- Zanger, U.M.; Schwab, M. Cytochrome P450 enzymes in drug metabolism: Regulation of gene expression, enzyme activities, and impact of genetic variation. Pharmacol. Ther. 2013, 138, 103–141. [Google Scholar] [CrossRef] [Scilit] [PubMed]
- Court, M.H. Interindividual variability in UDP-glucuronosyltransferase expression and function: Challenges for drug therapy and future prospects. Drug Metab. Rev. 2010, 42, 59–109. [Google Scholar]
- PharmGKB Diazepam Pathway, Pharmacokinetics [Internet]. Available online: https://www.pharmgkb.org/pathway/PA165111375 (accessed on 25 April 2025).
- Huestis, M.A. Human cannabinoid pharmacokinetics. Chem. Biodivers. 2007, 4, 1770–1804. [Google Scholar] [CrossRef] [Scilit]
- Milman, G.; Schwope, D.M.; Cone, E.J.; Pastore, R.S.; Huestis, M.A. Cannabinoid metabolites in human urine: Method optimization and validation. Clin. Chem. 2012, 58, 748–758. [Google Scholar]
- Pasin, D.; Mollerup, C.B.; Rasmussen, B.S.; Linnet, K.; Dalsgaard, P.W. Development of a single retention time prediction model integrating multiple liquid chromatography systems: Application to new psychoactive substances. Anal. Chim. Acta 2021, 1184, 339035. [Google Scholar] [CrossRef] [Scilit] [PubMed]
- Diao, X.; Huestis, M.A. New synthetic cannabinoids metabolism and strategies to best identify optimal marker metabolites. Front. Chem. 2019, 7, 109. [Google Scholar] [CrossRef] [Scilit]
- Thevis, M.; Schänzer, W. Mass spectrometry in doping control analysis. Mass. Spectrom. Rev. 2007, 26, 79–107. [Google Scholar] [CrossRef] [Scilit]
- Sobolevsky, T.; Rodchenkov, G. Detection of anabolic steroids and their metabolites in doping control analysis. Drug Test Anal. 2012, 4, 734–739. [Google Scholar]
- Strickland, E.A.; Bosse, R.; Poklis, J.L.; Poklis, A.; Ropero-Miller, J.D.; Hargrove, L.; Shafi, S.T.; Horner, G.L.; Wolf, C.E. Detection of isotonitazene and its metabolite in authentic forensic casework by LC–QTOF-MS. J. Anal. Toxicol. 2021, 45, 129–135. [Google Scholar] [CrossRef] [Scilit]
- Vitrano, A.; Di Giorgi, A.; Abbate, V.; Basile, G.; La Maida, N.; Pichini, S.; Di Trana, A. Evaluation of short-term stability of different nitazenes psychoactive opioids in dried blood spots by liquid chromatography–high-resolution mass spectrometry. Anal. Bioanal. Chem. 2024, 25, 12332. [Google Scholar] [CrossRef] [Scilit]
- Helfer, A.G.; Michely, J.A.; Weber, A.A.; Meyer, M.R.; Maurer, H.H. Orbitrap technology for comprehensive metabolite-based liquid chromatographic–high resolution-tandem mass spectrometric urine drug screening–Exemplified for cardiovascular drugs. Anal. Chim. Acta 2015, 891, 221–233. [Google Scholar] [CrossRef] [Scilit] [PubMed]
- Scientific Working Group for Forensic Toxicology (SWGTOX). Standard practices for method validation in forensic toxicology. J. Anal. Toxicol. 2013, 37, 452–474. [Google Scholar] [CrossRef] [Scilit]
- AAFS Standards Board. Standard Practices for Method Validation in Forensic Toxicology, American Academy of Forensic Sciences. 2019. Available online: https://www.aafs.org/asb-standard/standard-practices-method-validation-forensic-toxicology (accessed on 10 December 2025).
- LeBeau, M.A. ANSI/ASB Standard 036 for Method Validation in Forensic Toxicology Has Replaced SWGTOX’s Version. J. Anal. Toxicol. 2020, 44, 414. [Google Scholar] [CrossRef] [Scilit]
- Wille, S.M.R.; Coucke, W.; De Baere, T.; Peters, F.T. Update of standard practices for new method validation in forensic toxicology. Curr. Pharm. Des. 2017, 23, 5442–5454. [Google Scholar] [CrossRef] [Scilit]
- Pihlström, T.; Fernández-Alba, A.R.; Amate, C.F.; Poulsen, M.E.; Hardebusch, B.; Anastassiades, M.; Lippold, R.; Cabrera, L.C.; de Kok, A.; ORegan, F.; et al. Analytical Quality Control and Method Validation Procedures for Pesticide Residues Analysis in Food and Feed SANTE 11312/2021. Sante, 11312(v2). 2021. Available online: https://www.eurl-pesticides.eu/userfiles/file/EurlALL/SANTE-11312_2021-V2.pdf (accessed on 10 December 2025).
- Wille, S.M.R.; Peters, F.T.; Di Fazio, V.; Samyn, N. Practical aspects concerning validation and quality control for forensic and clinical bioanalytical quantitative methods. Accredit. Qual. Assur. 2011, 16, 279–292. [Google Scholar] [CrossRef] [Scilit]
- Gleaves, J.; Petróczi, A.; Folkerts, D.; De Hon, O.; Macedo, E.; Saugy, M.; Cruyff, M. Doping prevalence in competitive sport: Evidence synthesis with “best practice” recommendations and reporting guidelines from the WADA Working Group on Doping Prevalence. Sports Med. 2021, 51, 1909–1934. [Google Scholar] [CrossRef] [Scilit]
- United Nations Office on Drugs and Crime. Guidance on the Forensic Analysis of Drugs Facilitating Sexual Assault and Other Criminal Acts (ST/NAR/45). United Nations. 2013. Available online: https://syntheticdrugs.unodc.org/uploads/syntheticdrugs/res/library/forensics_html/Guidelines_for_the_Forensic_analysis_of_drugs_facilitating_sexual_assault_and_other_criminal_acts_Spanish.pdf (accessed on 10 December 2025).
- World Anti-Doping Agency. World Anti-Doping Agency Prohibited List 2023 (Urinary Threshold: Δ9-THC > 150 ng/mL). 2023. Available online: https://www.wada-ama.org/en/prohibited-list (accessed on 10 December 2025).
- Bonfiglio, R.; King, R.C.; Olah, T.V.; Merkle, K. The effects of sample preparation methods on the variability of the electrospray ionization response for model drug compounds. Rapid Commun. Mass Spectrom. 1999, 13, 1175–1185. [Google Scholar] [CrossRef]
- Wi Matuszewski, B.K.; Constanzer, M.L.; Chavez-Eng, C.M. Strategies for the assessment of matrix effect in quantitative bioanalytical methods based on HPLC–MS/MS. Anal. Chem. 2003, 75, 3019–3030. [Google Scholar] [CrossRef] [Scilit]
- Chambers, E.; Wagrowski-Diehl, D.M.; Lu, Z.; Mazzeo, J.R. Systematic and comprehensive strategy for reducing matrix effects in LC/MS/MS analyses. J. Chromatogr. B 2007, 852, 22–34. [Google Scholar] [CrossRef] [Scilit]
- Bayat, P.; Lesage, D.; Cole, R.B. Tutorial: Ion activation in tandem mass spectrometry using ultra-high resolution instrumentation. Mass Spectrom. Rev. 2020, 39, 680–702. [Google Scholar] [CrossRef] [Scilit]
- Zarrouk, E.; Lenski, M.; Bruno, C.; Thibert, V.; Contreras, P.; Privat, K.; Ameline, A.; Fabresse, N. High-resolution mass spectrometry: Theoretical and technological aspects. Toxicol. Anal. Et Clin. 2022, 34, 3–18. [Google Scholar] [CrossRef] [Scilit]
- Cabañas, M.; Manuel, J. Prospectives in the Forensic Investigation of New Psychoactive Substances: Transition from Targeted to Non-Targeted Analysis by Mass Spectrometry. Doctoral Dissertation, Universidad de Alcalá, Alcalá de Henares, Madrid, 2024. [Google Scholar]
- Cabañas, M.; Manuel, J. Supplemental Information of Glucuronides Article, Mendeley Data, V1. 2025. Available online: https://data.mendeley.com/datasets/p5js4nf9hw (accessed on 10 December 2025).
- Lei, H.; Guo, J.; Lv, Z.; Zhu, X.; Xue, X.; Wu, L.; Cao, W. Simultaneous Determination of Nitroimidazoles and Quinolones in Honey by Modified QuEChERS and LC-MS/MS Analysis. Int. J. Anal. Chem. 2018, 2018, 4271385. [Google Scholar] [CrossRef] [Scilit] [PubMed] [PubMed Central]
- Von Unruh, G.E.; Paar, W.D. Gas chromatographic/mass spectrometric assays for oxcarbazepine and its main metabolites, 10-hydroxy-carbazepine and carbazepine-10,11-trans-diol. Biomed. Env. Mass Spectrom. 1986, 13, 651–656. [Google Scholar] [CrossRef] [Scilit] [PubMed]
- Beguiristain, I.; Alongi, A.; Rúbies, A.; Granados, M. Analysis of corticosteroids in samples of animal origin using QuEChERS and ultrahigh-performance liquid chromatography coupled to high-resolution mass spectrometry. Anal. Bioanal. Chem. 2019, 411, 449–457. [Google Scholar] [CrossRef] [Scilit]
- Delbressine, L.P.C.; Moonen, M.E.G.; Kaspersen, F.M.; Wagenaars, G.N.; Jacobs, P.L.; Timmer, C.J.; Paanakker, J.E.; van Hal, H.J.M.; Voortman, G. Pharmacokinetics and biotransformation of mirtazapine in human volunteers. Clin. Drug Investig. 1998, 15, 45–55. [Google Scholar] [CrossRef] [Scilit]
- Göschl, L.; Gmeiner, G.; Gärtner, P.; Stadler, G.; Enev, V.; Thevis, M.; Schänzer, W.; Guddat, S.; Forsdahl, G. Stanozolol-N-glucuronide metabolites in human urine. Drug Test. Anal. 2021, 13, 1668–1677. [Google Scholar] [CrossRef] [Scilit] [PubMed]
- Tudela, E.; Deventer, K.; Van Eenoo, P. Sensitive detection of 3′-hydroxy-stanozolol glucuronide by liquid chromatography–tandem mass spectrometry. J. Chromatogr. A 2013, 1292, 195–200. [Google Scholar] [CrossRef] [Scilit] [PubMed]
- Menéndez-Quintanal, L.M.; Matey, J.M.; Perretti, M.D.; Paz, N.R. Fragmentation pathways of dihydro-metabolites of synthetic cathinones by high-resolution mass spectrometry on Orbitrap and quadrupole time-of-flight (qTOF) mass spectrometers. Int. J. Mass. Spectrom. 2026, 519, 117549. [Google Scholar] [CrossRef] [Scilit]
- Menéndez-Quintanal, L.M.; Matey, J.M.; Perretti; Martínez-Ramírez, C.; Hernández-DíaZ, F.J. Potential of high-resolution mass spectrometry for identification and structural elucidation of scopolamine metabolomic biomarkers in a confirmed case of Brugmansia intoxication. Specially application in drug-facilitated crimes. Forensic Chem. 2024, 40, 100602. [Google Scholar] [CrossRef] [Scilit]
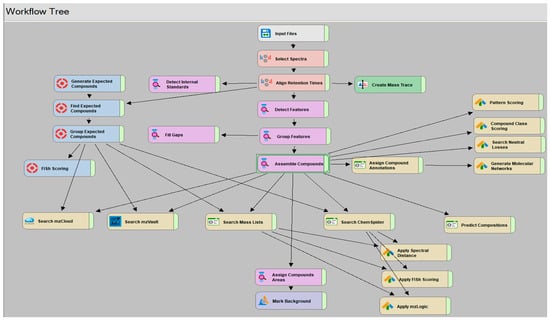
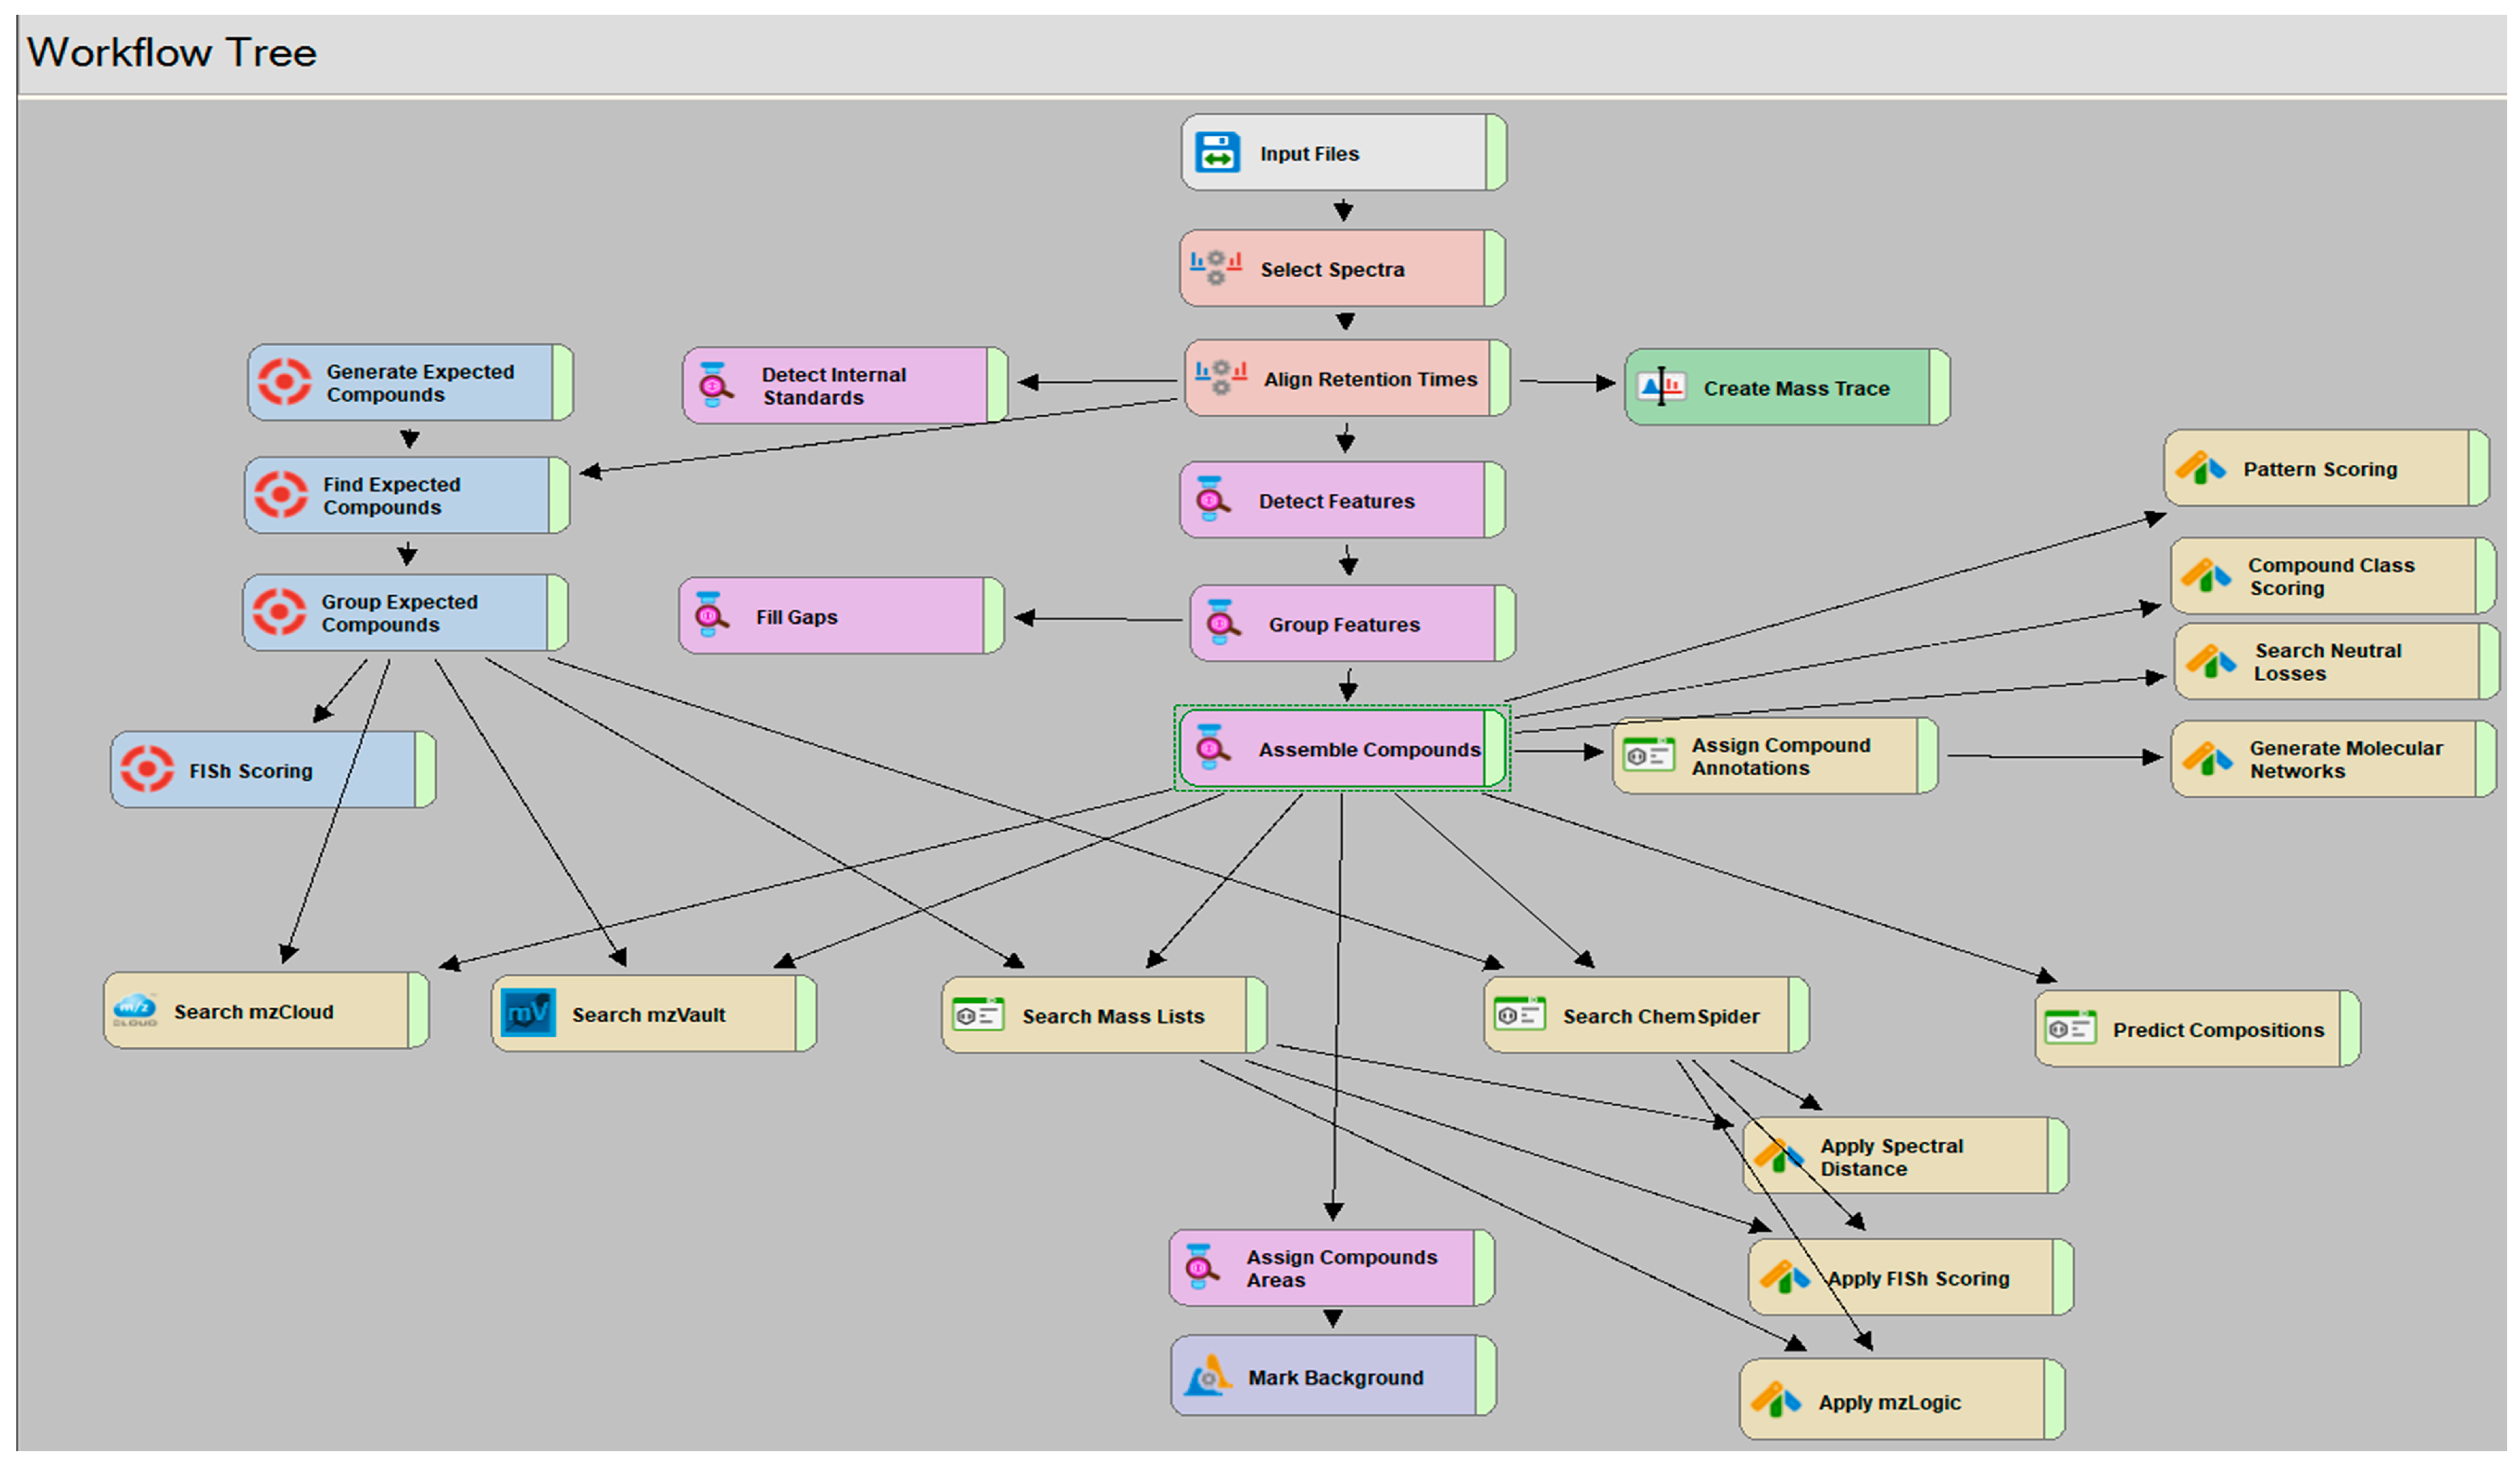
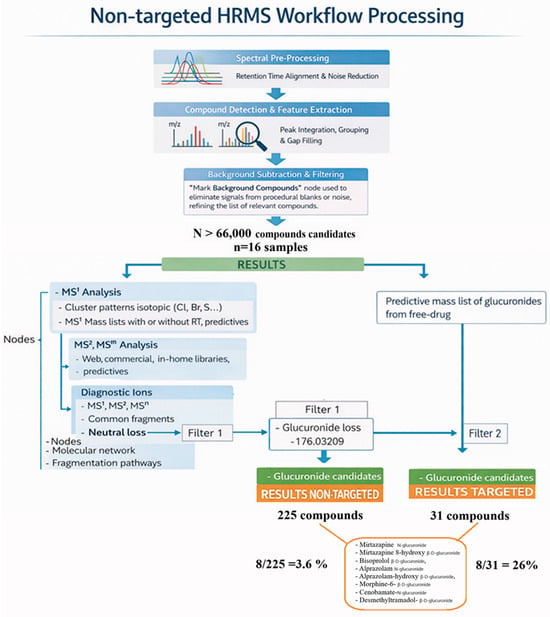
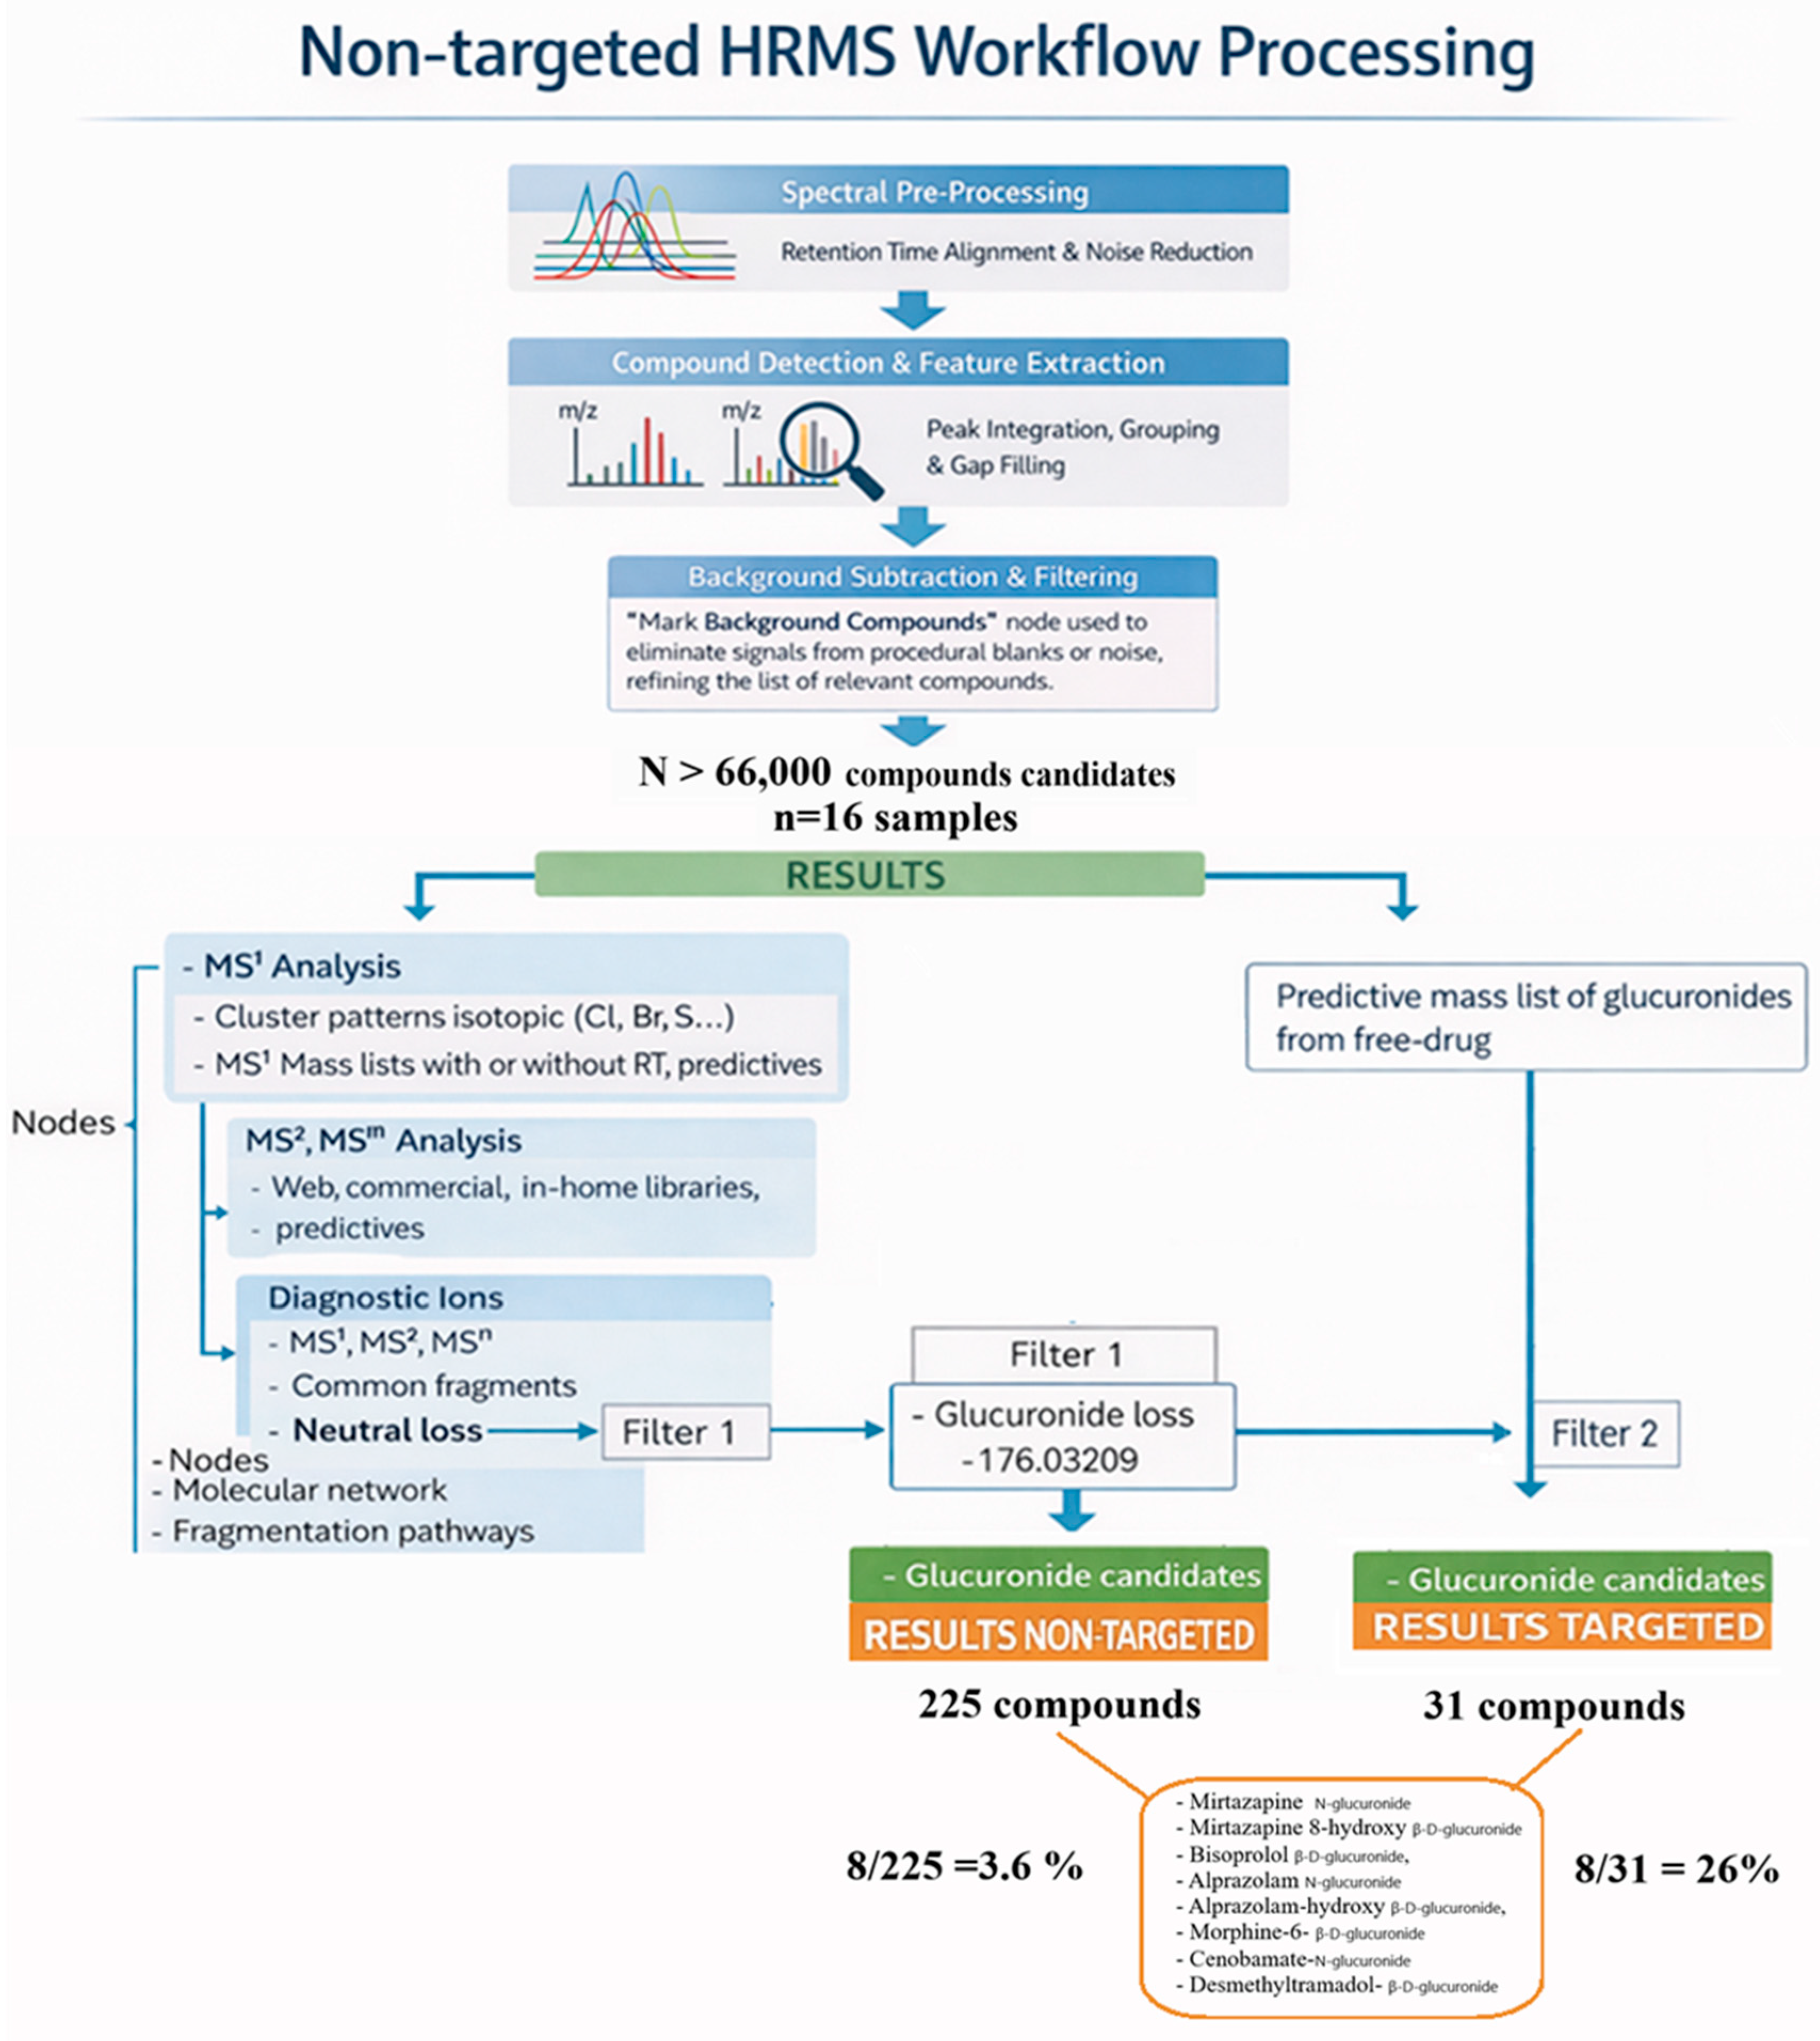
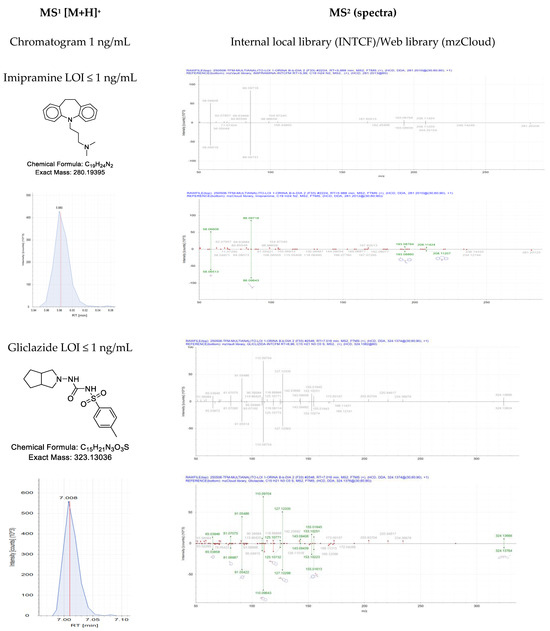
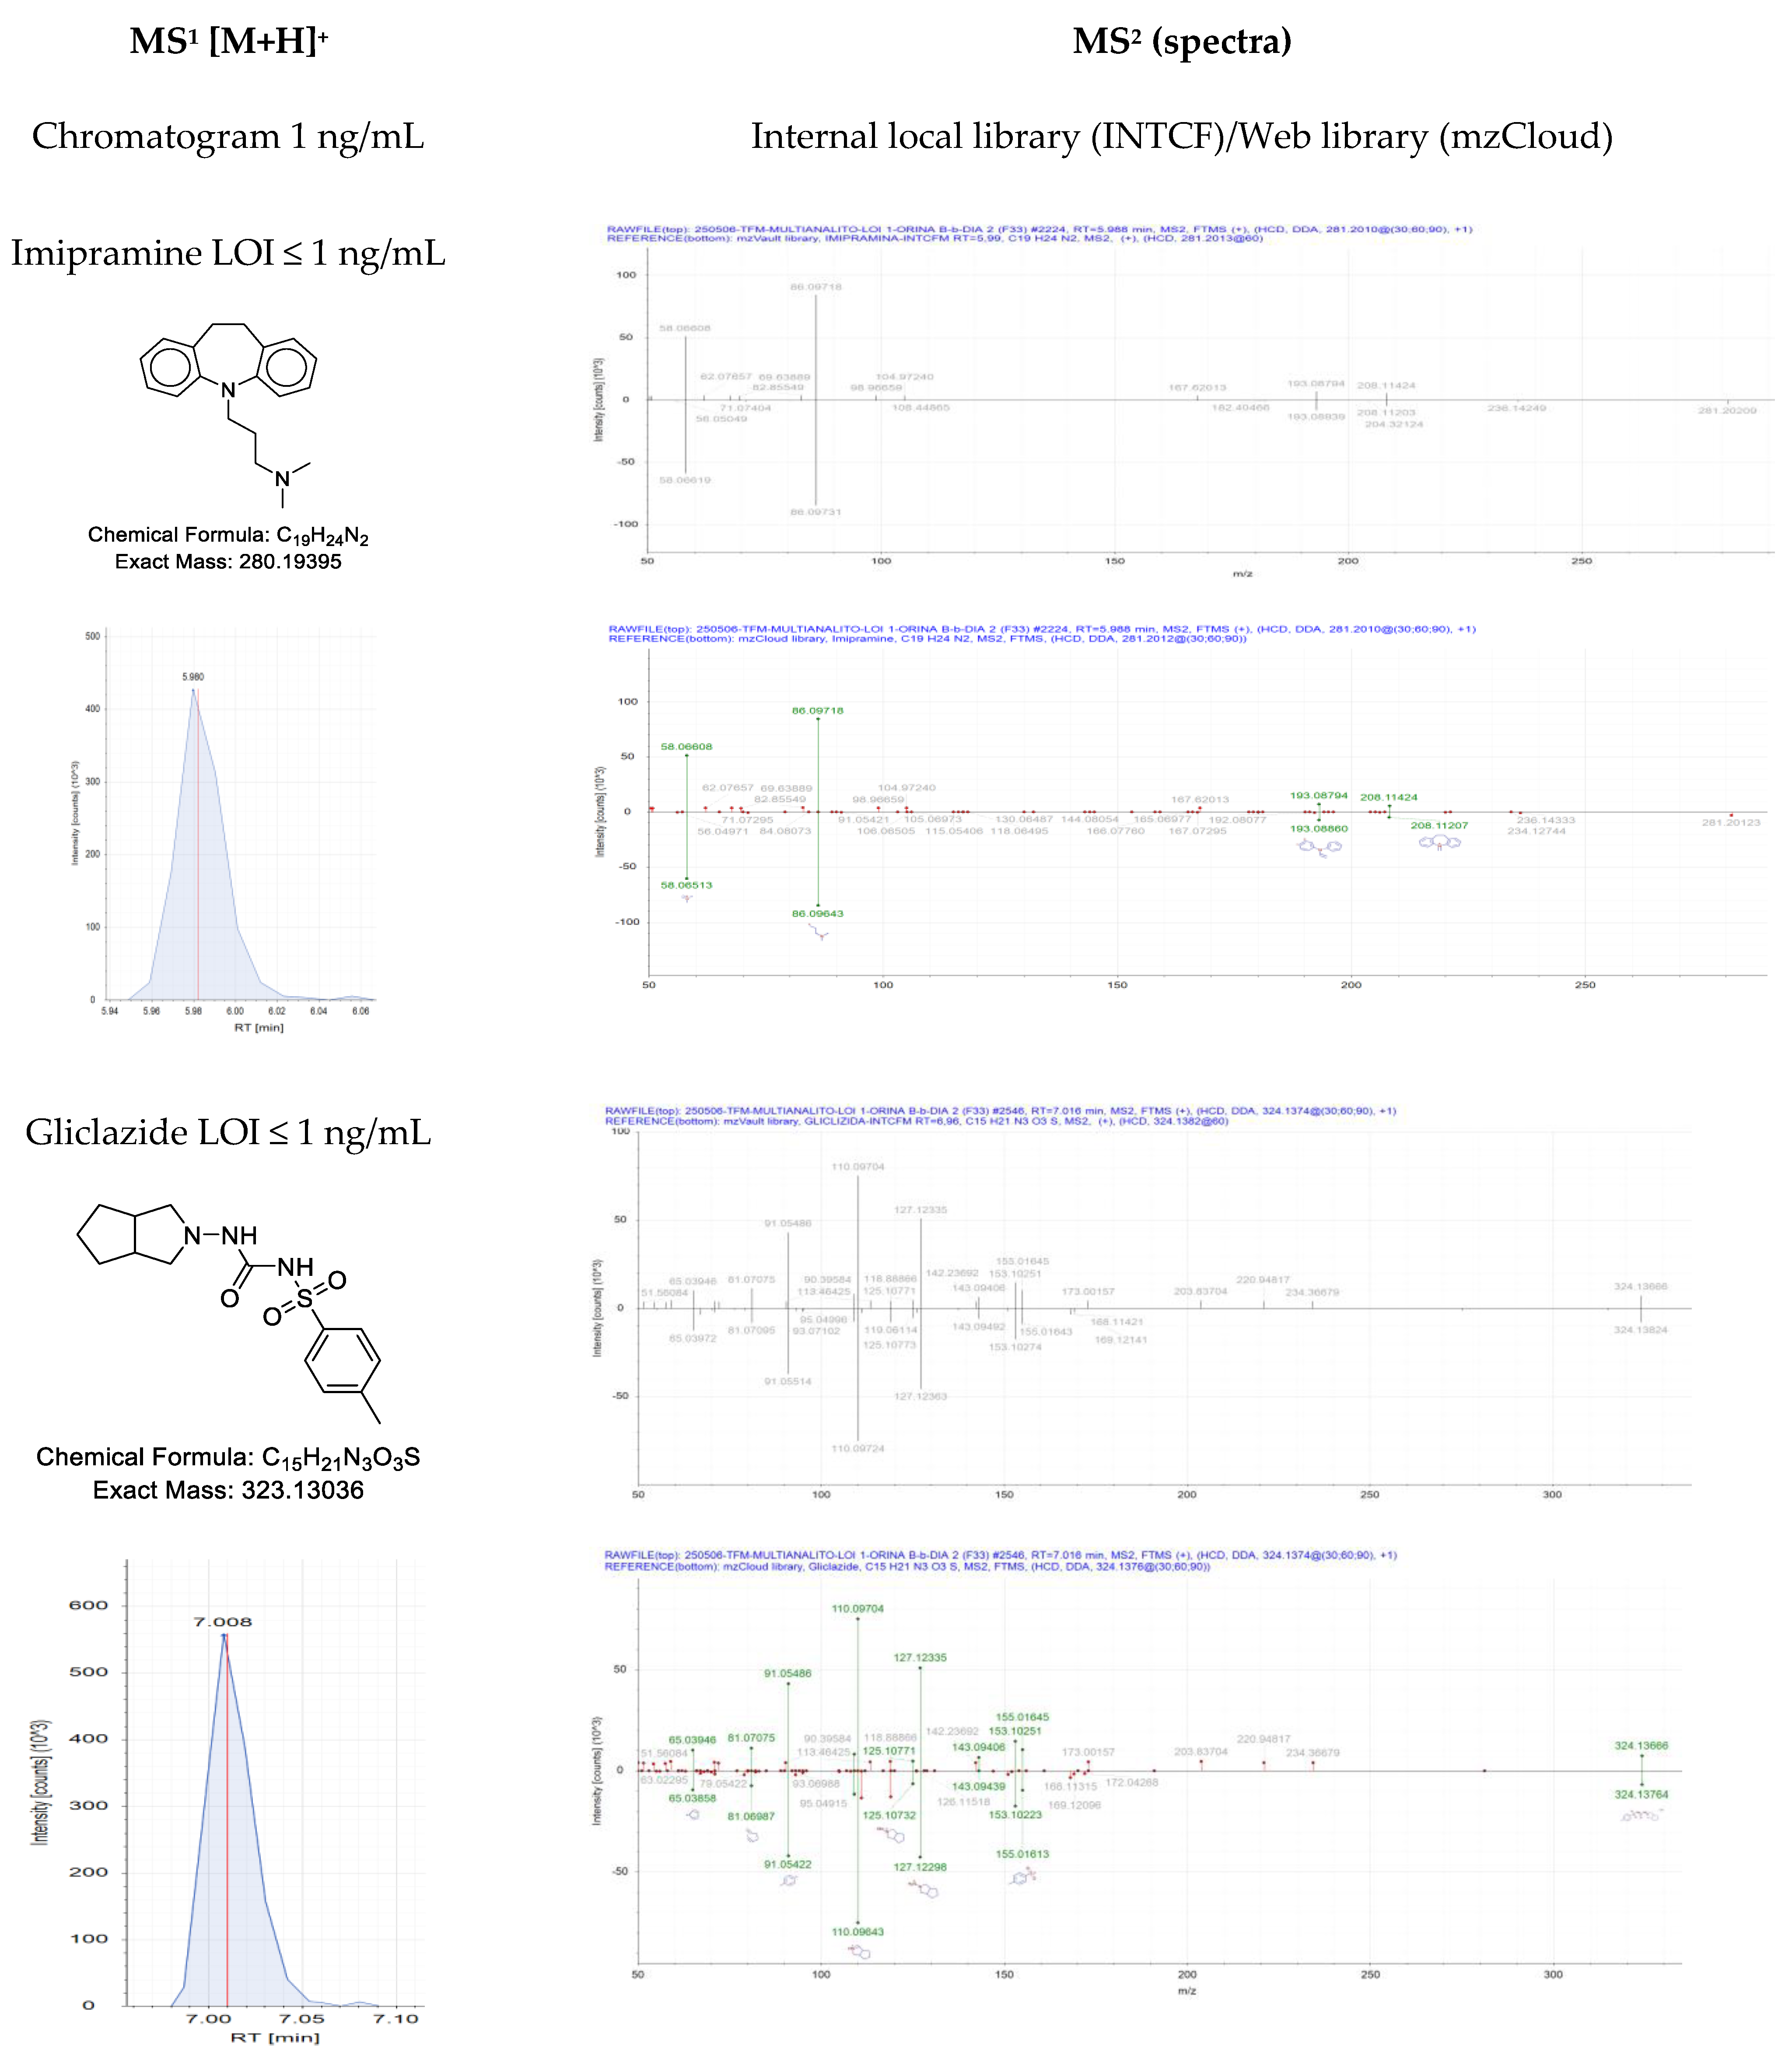
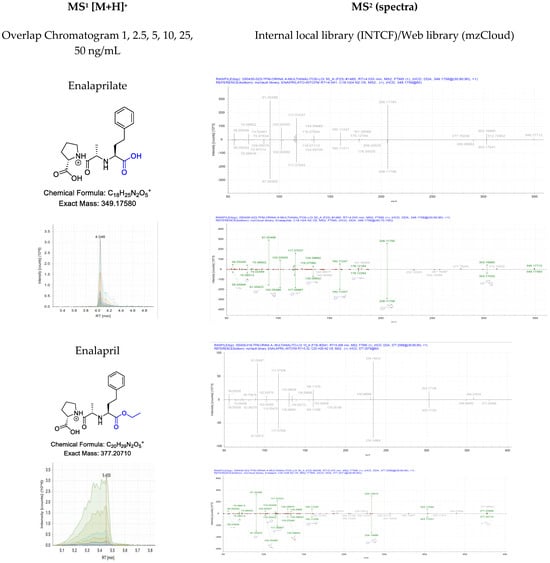
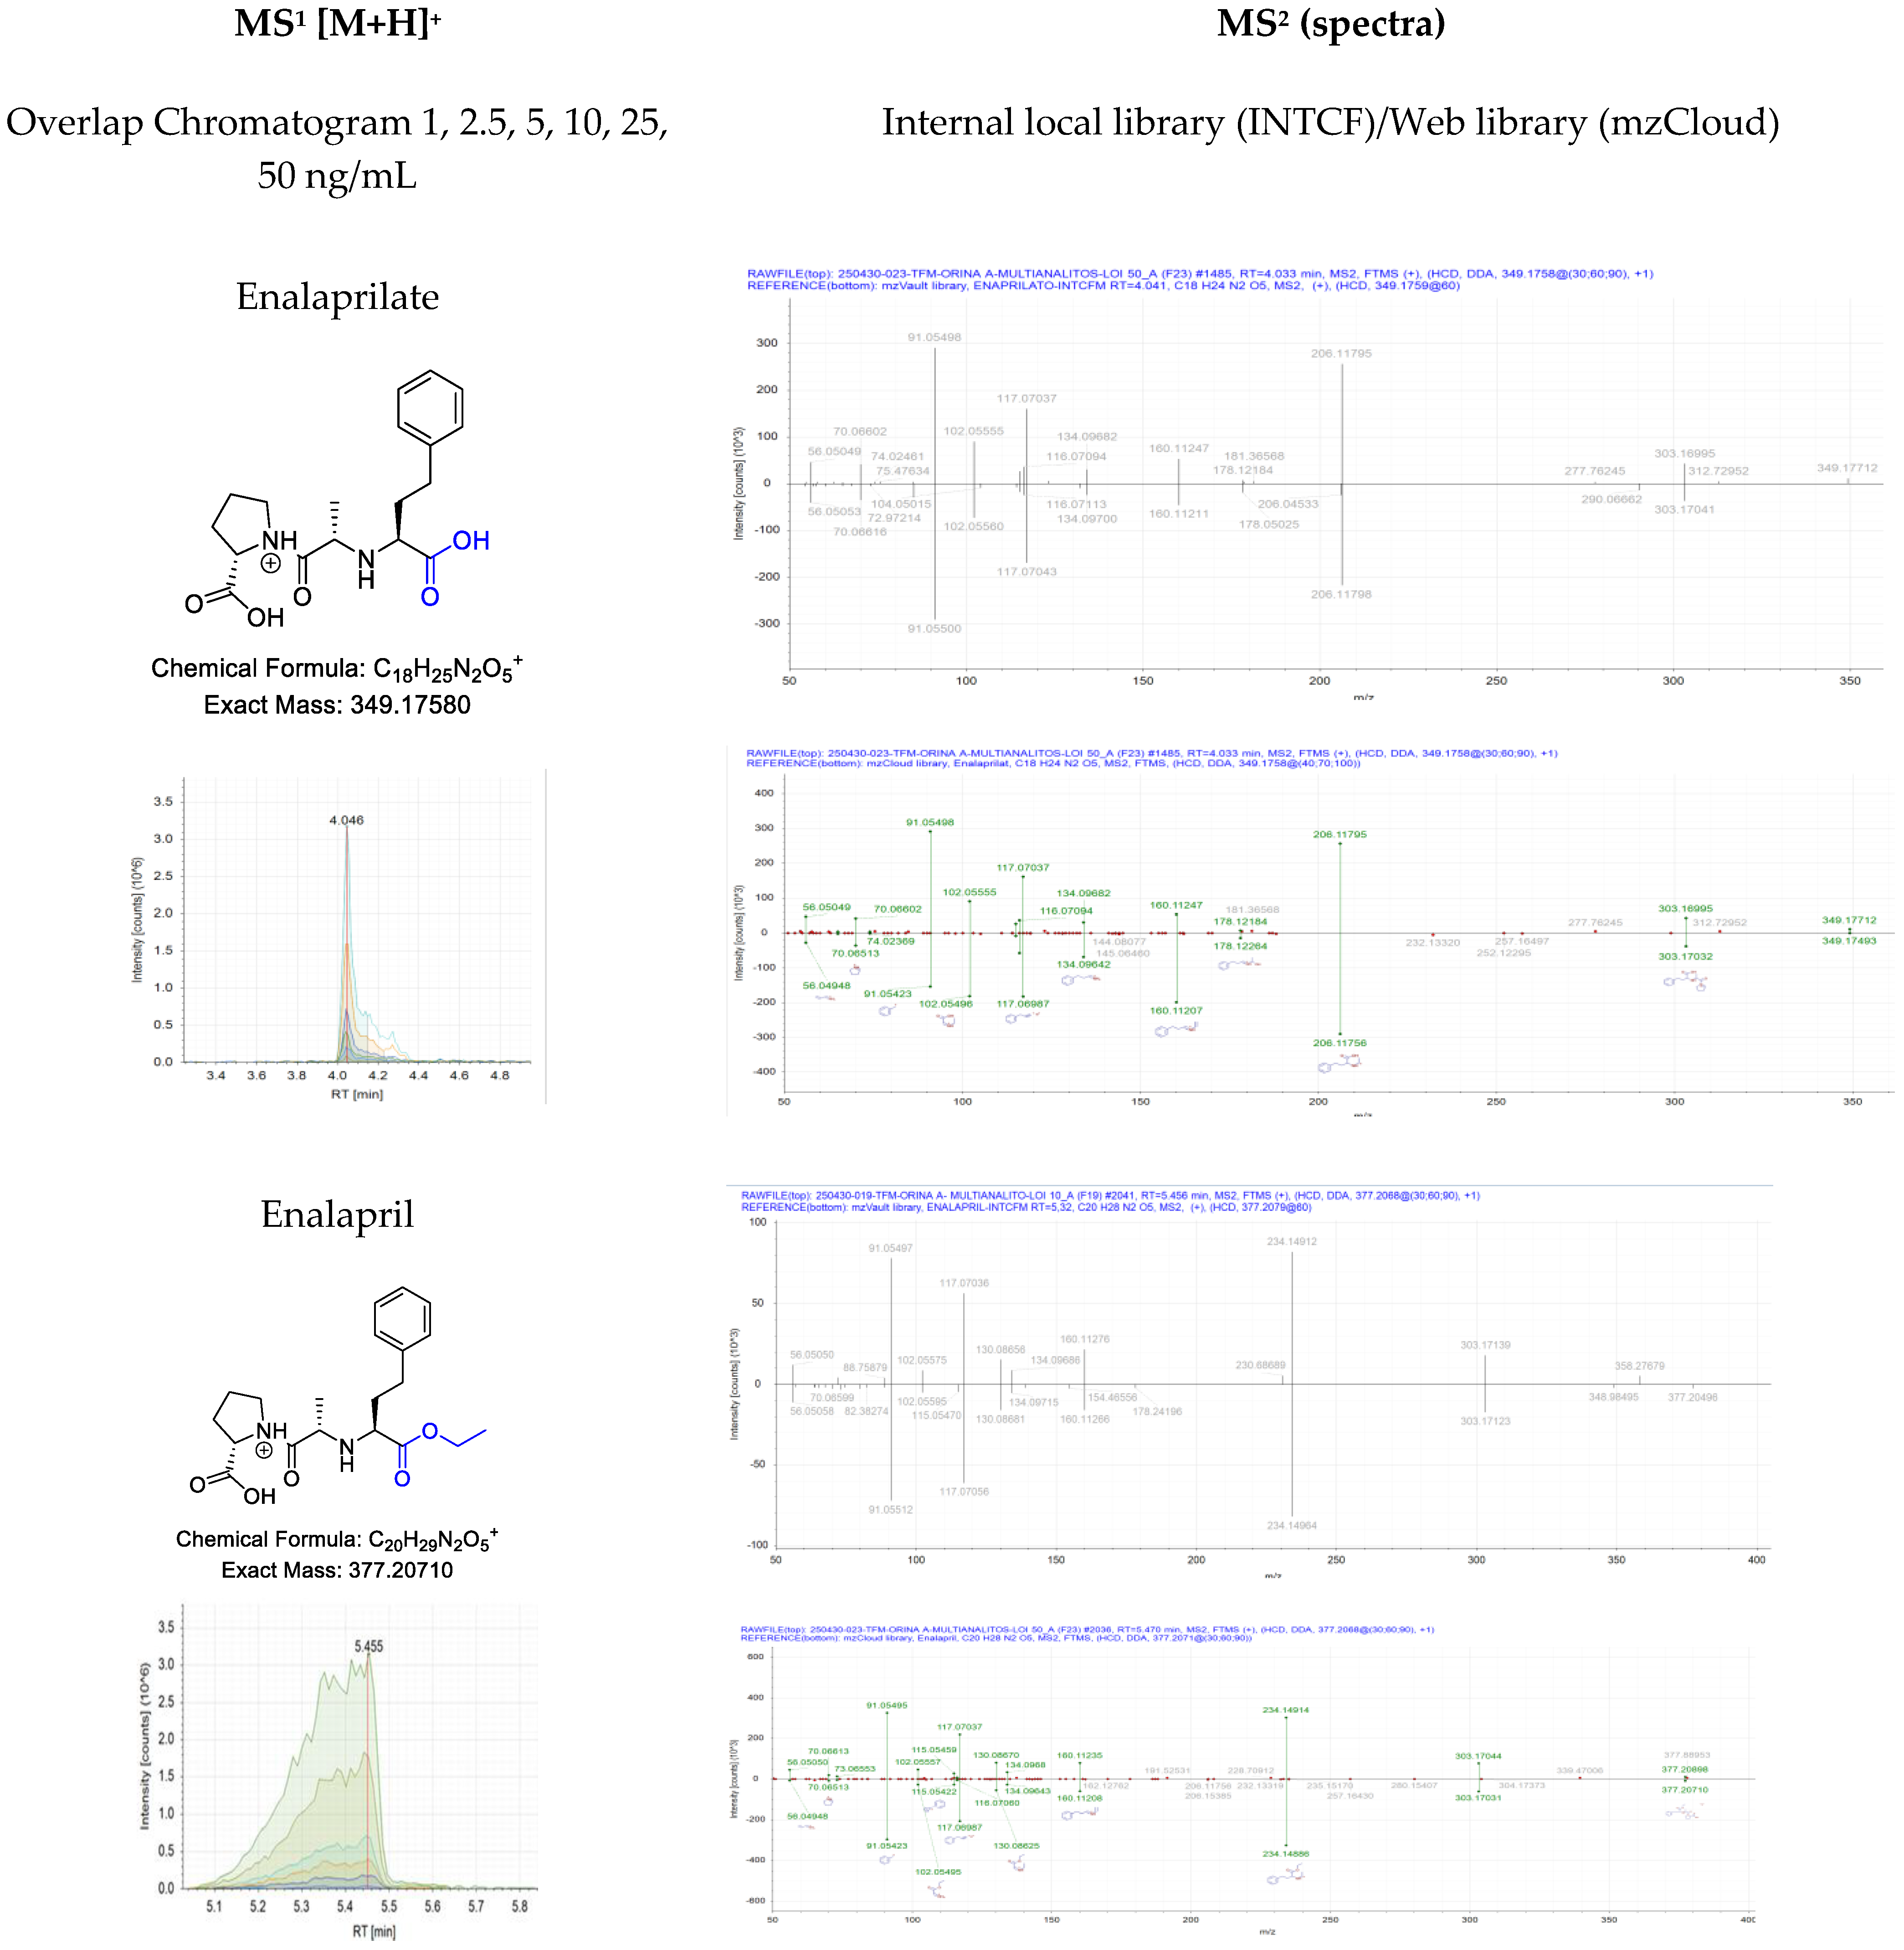
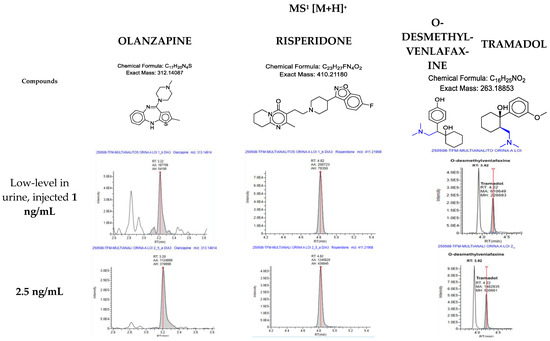
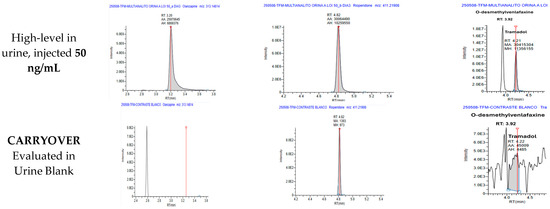
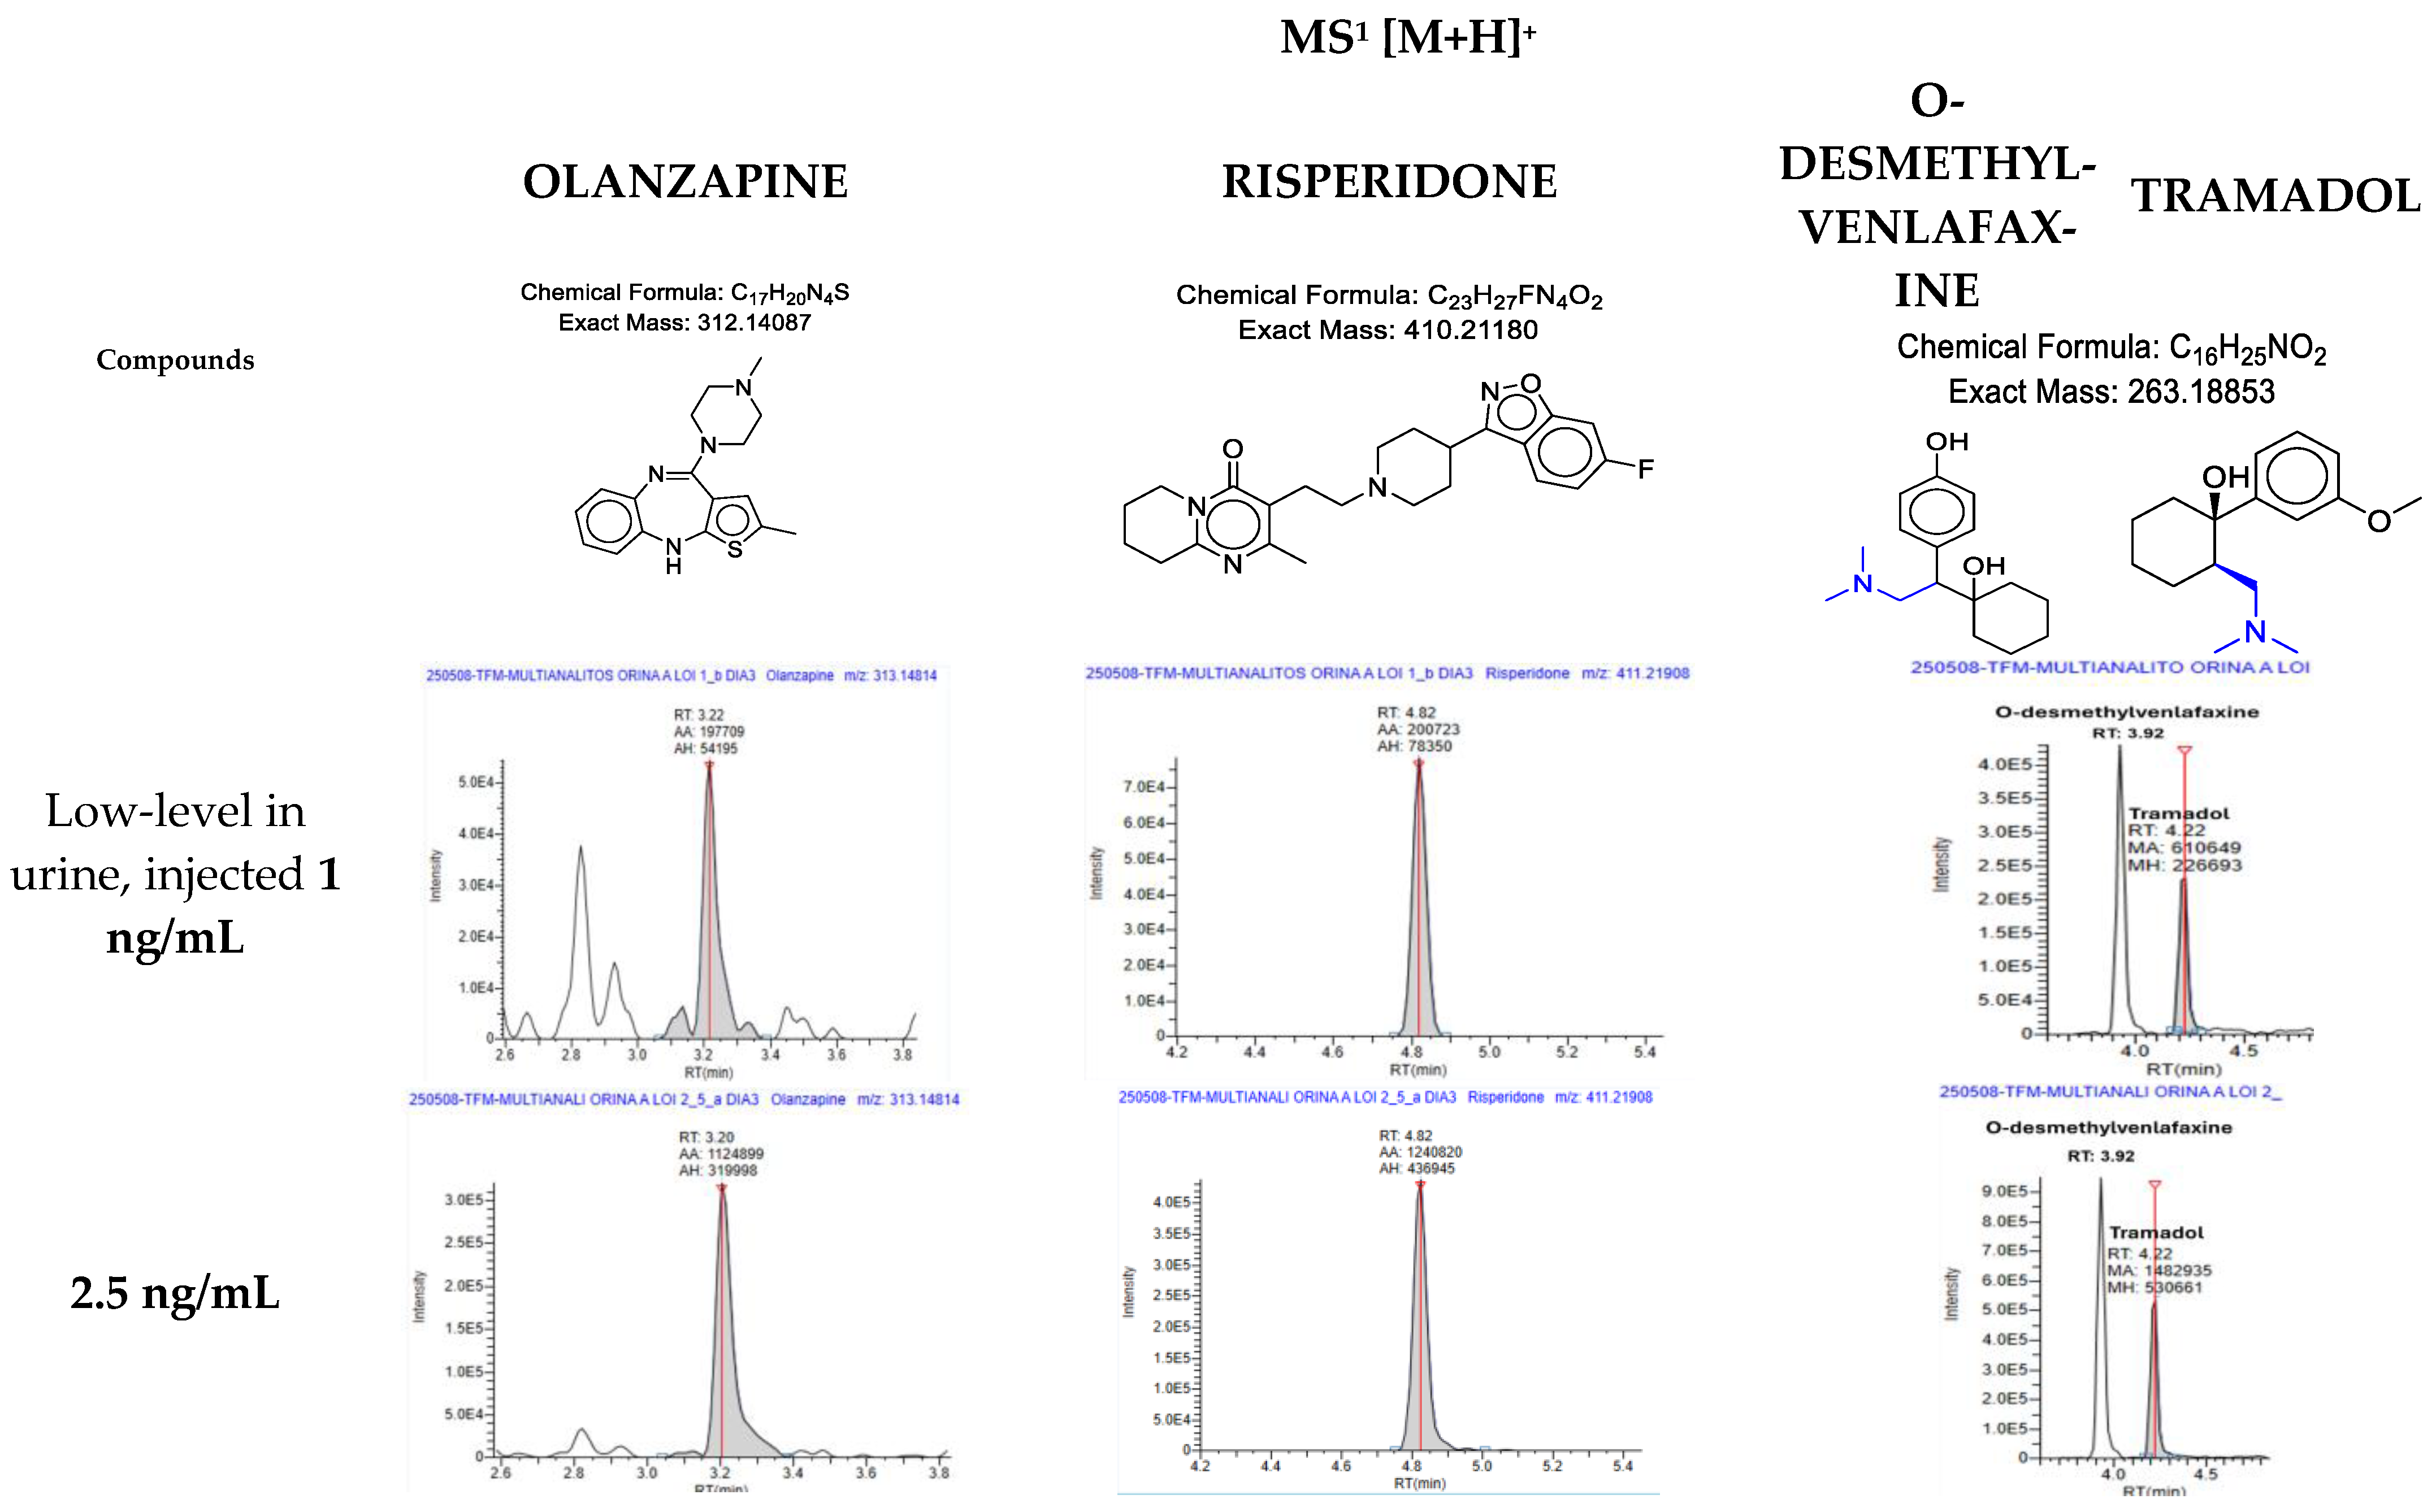
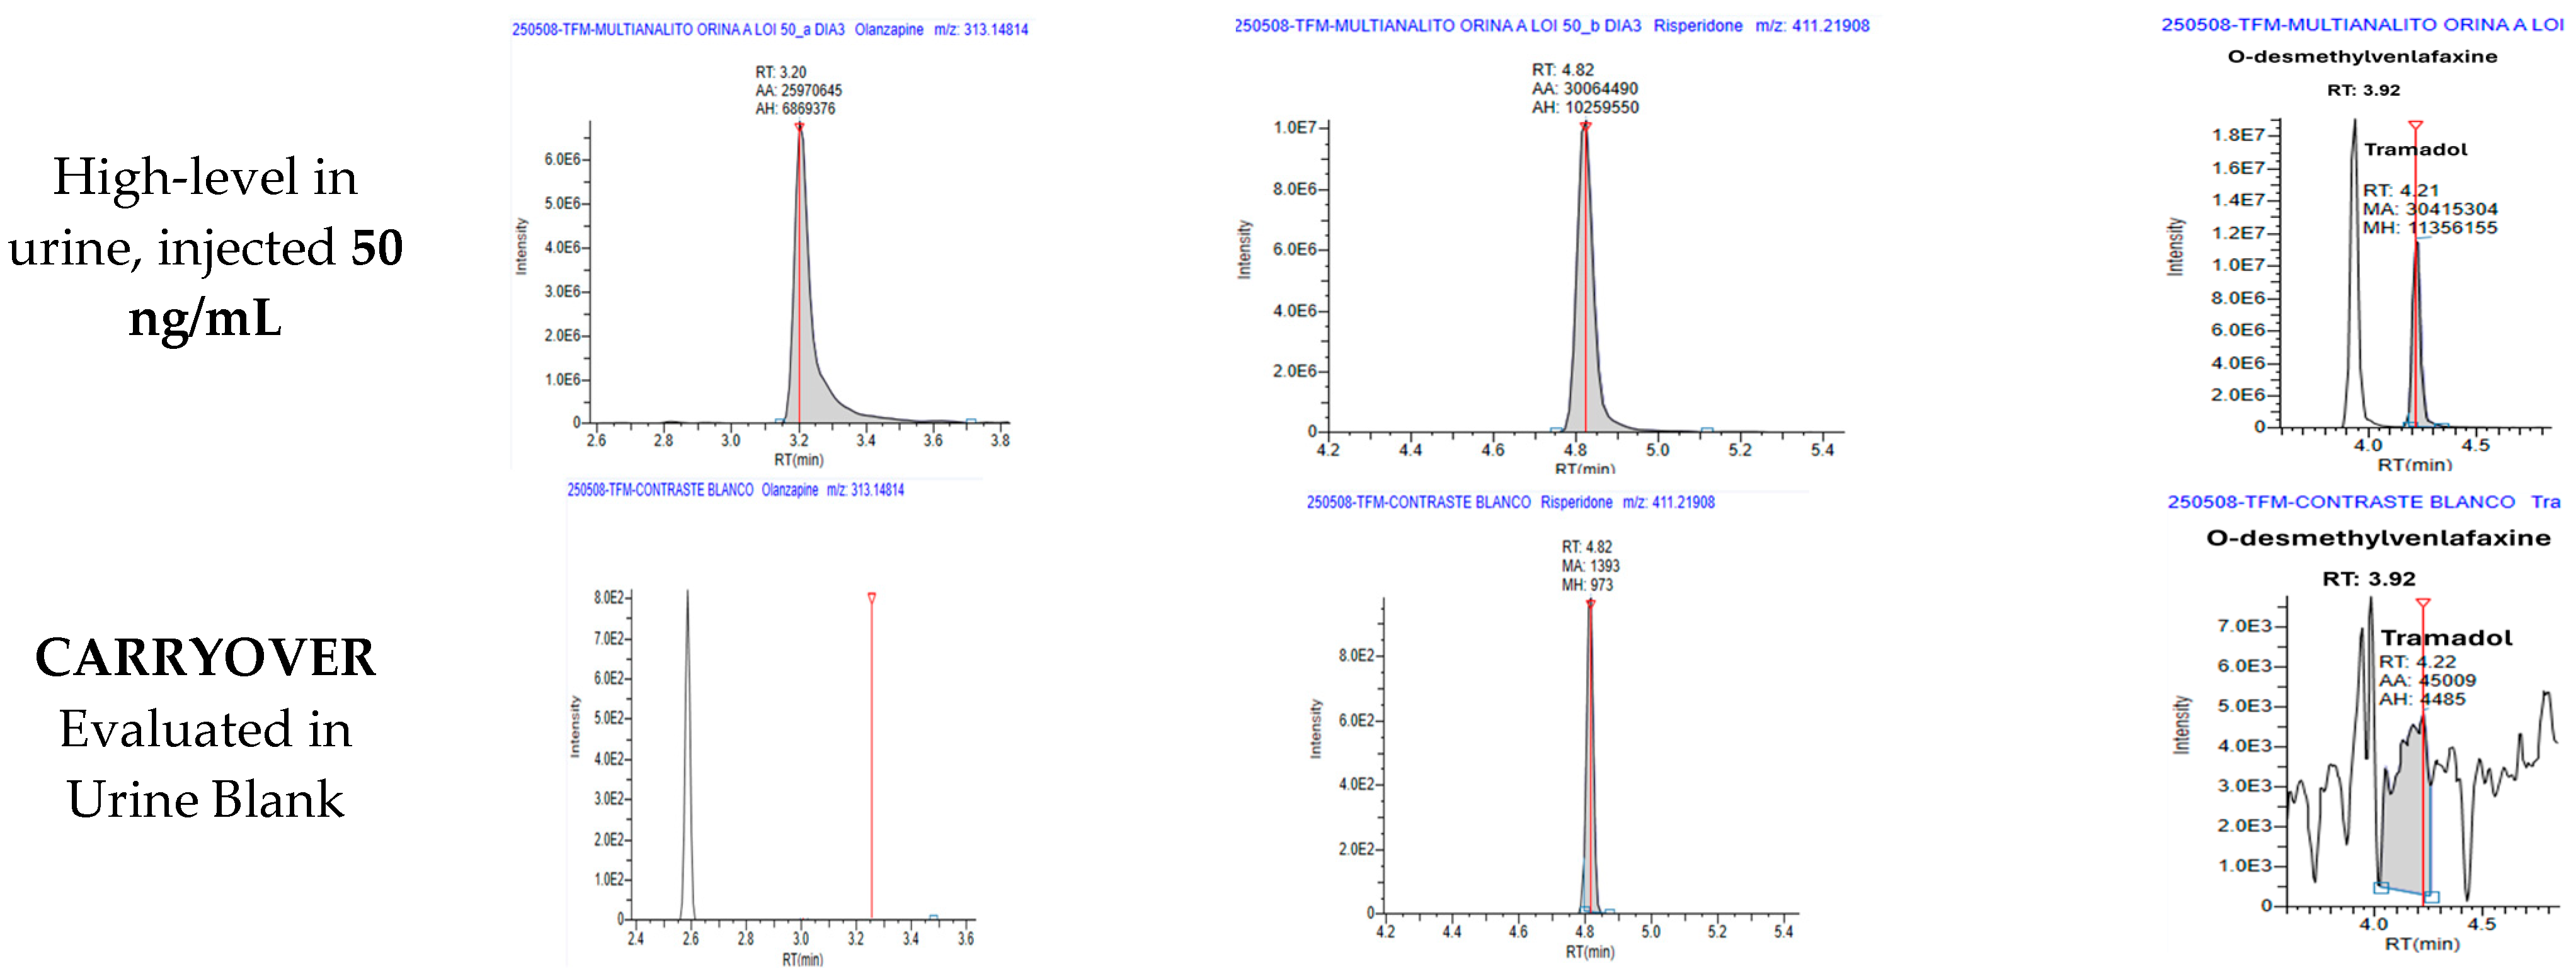
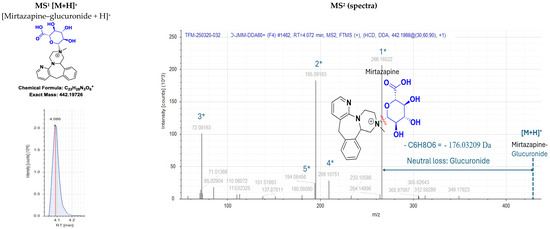
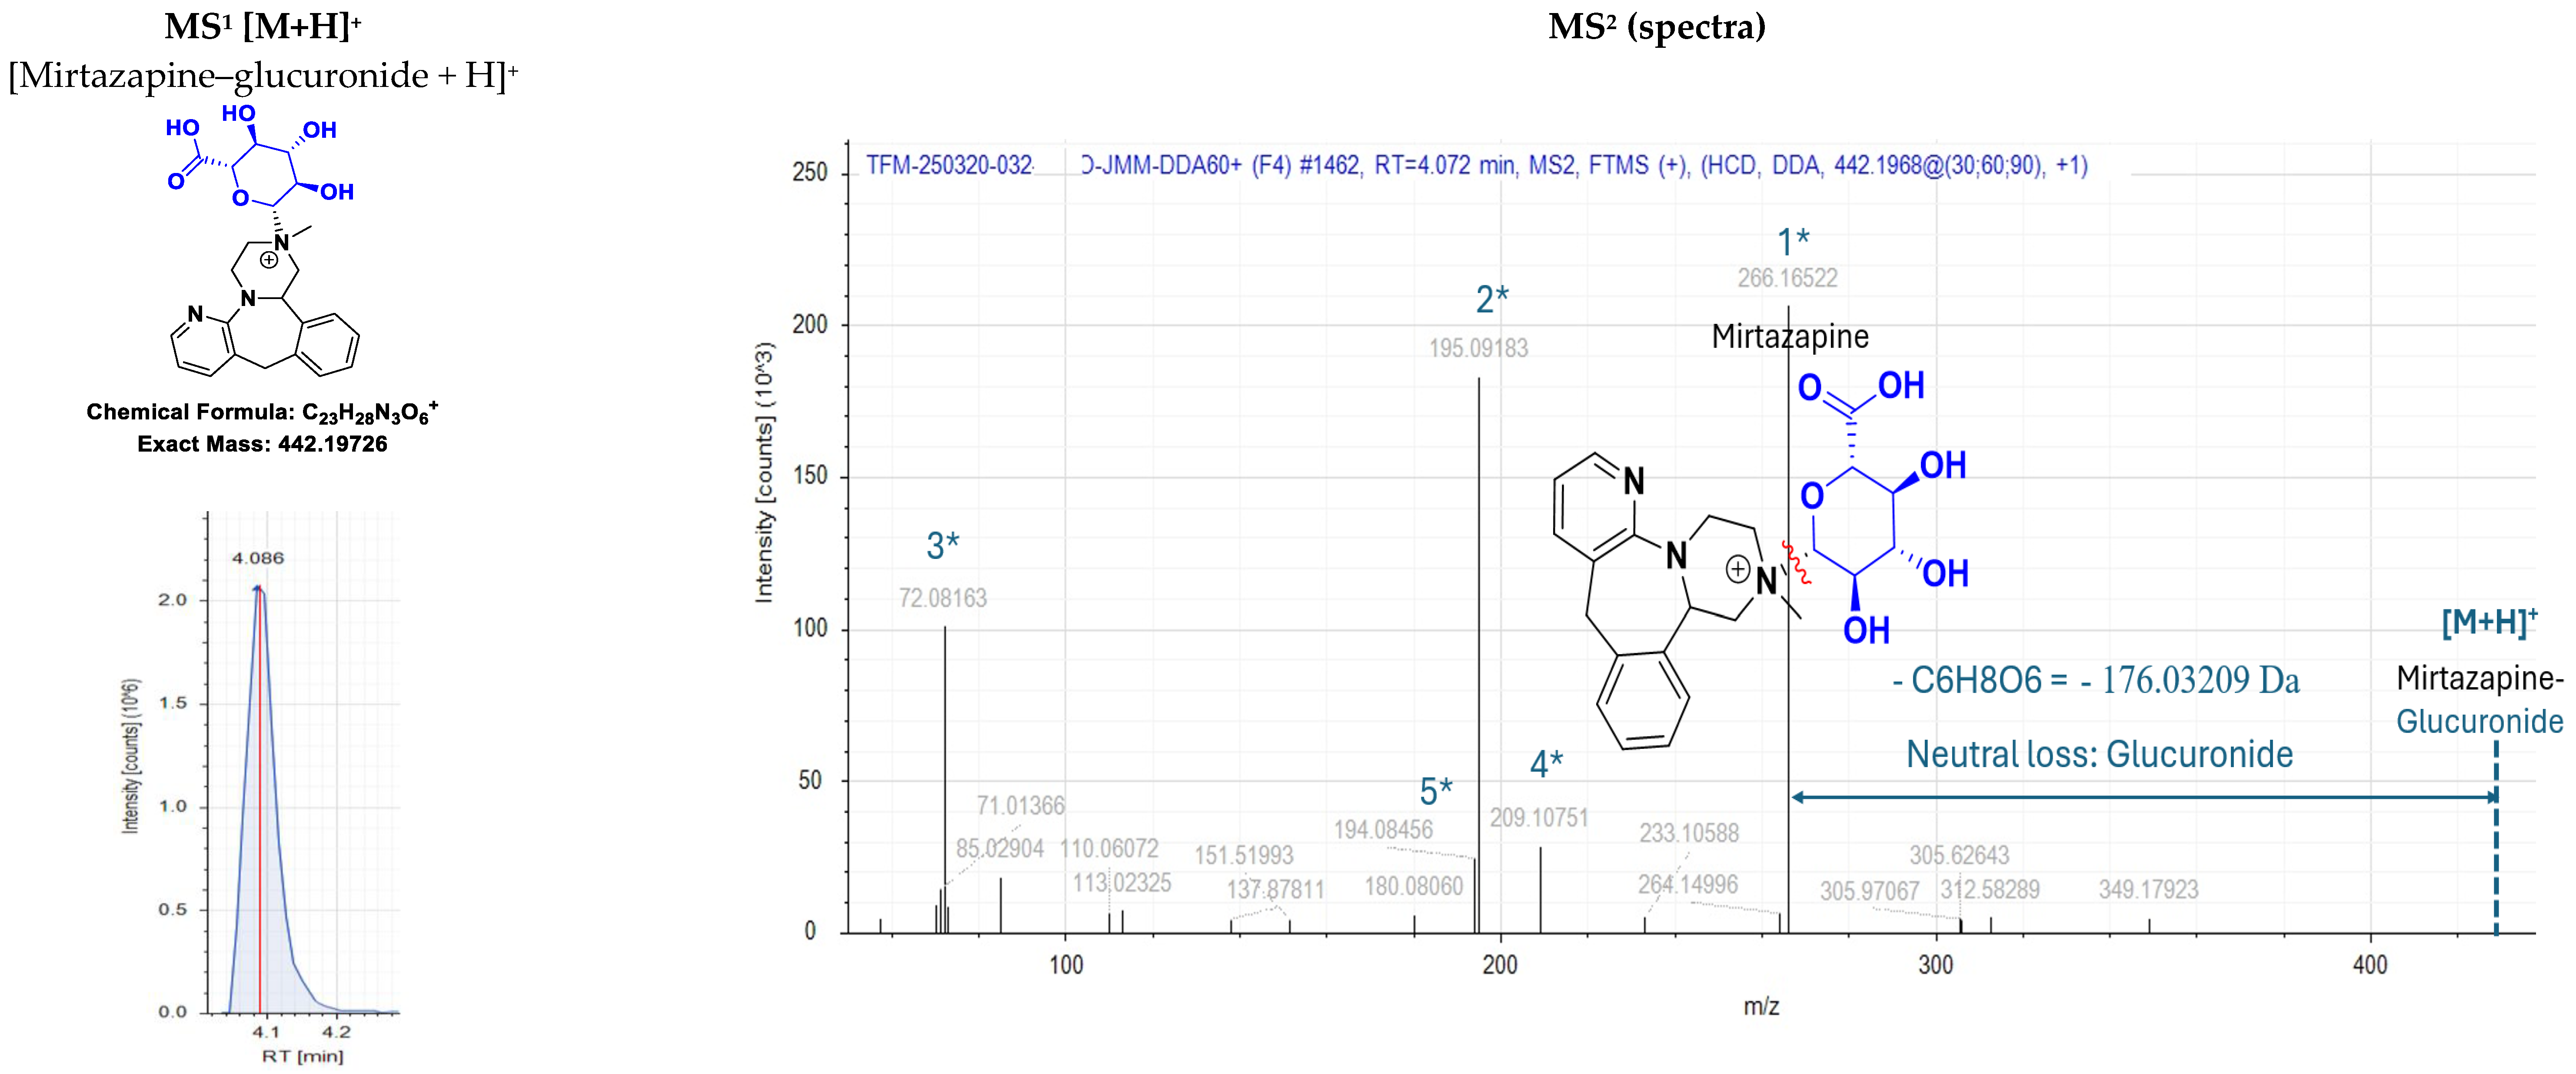
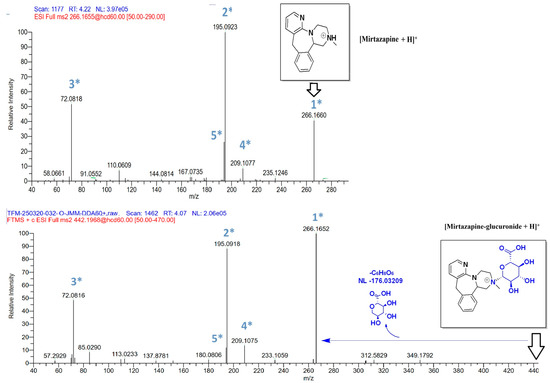
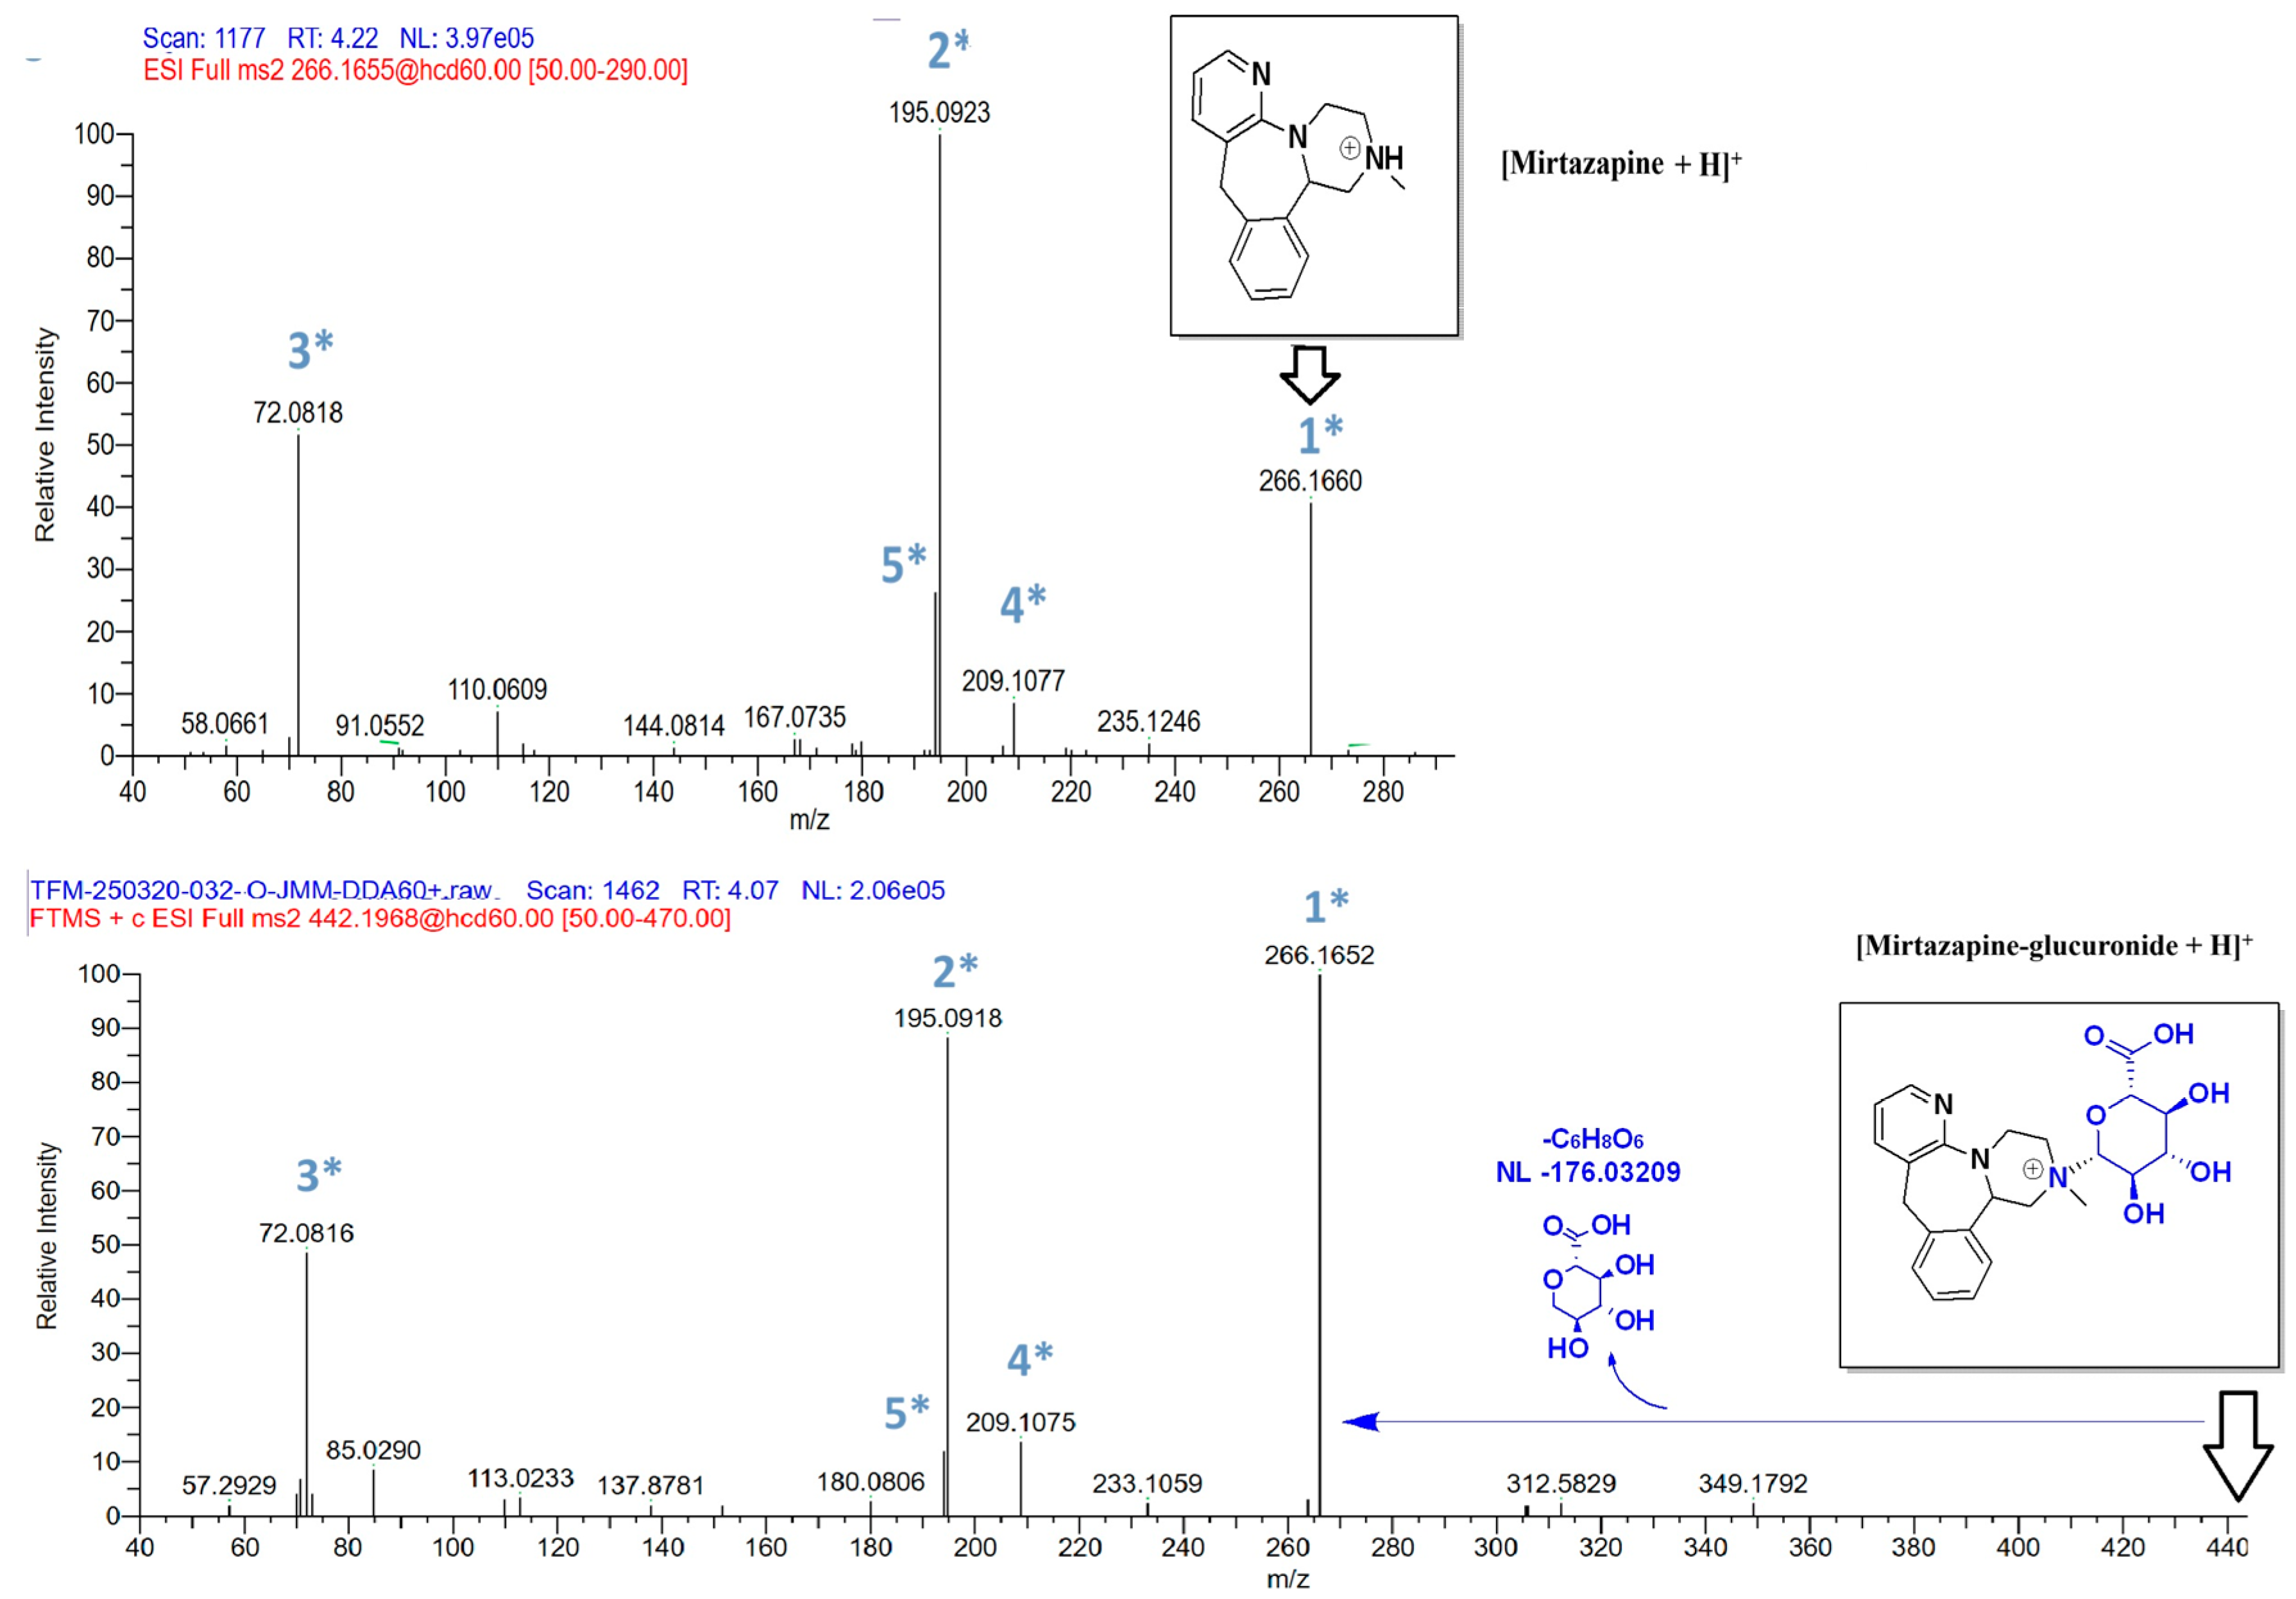
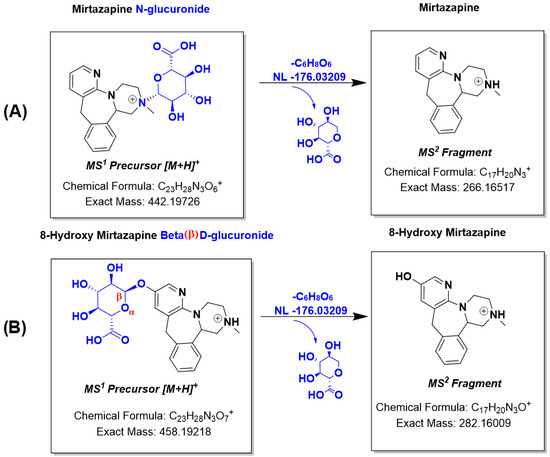
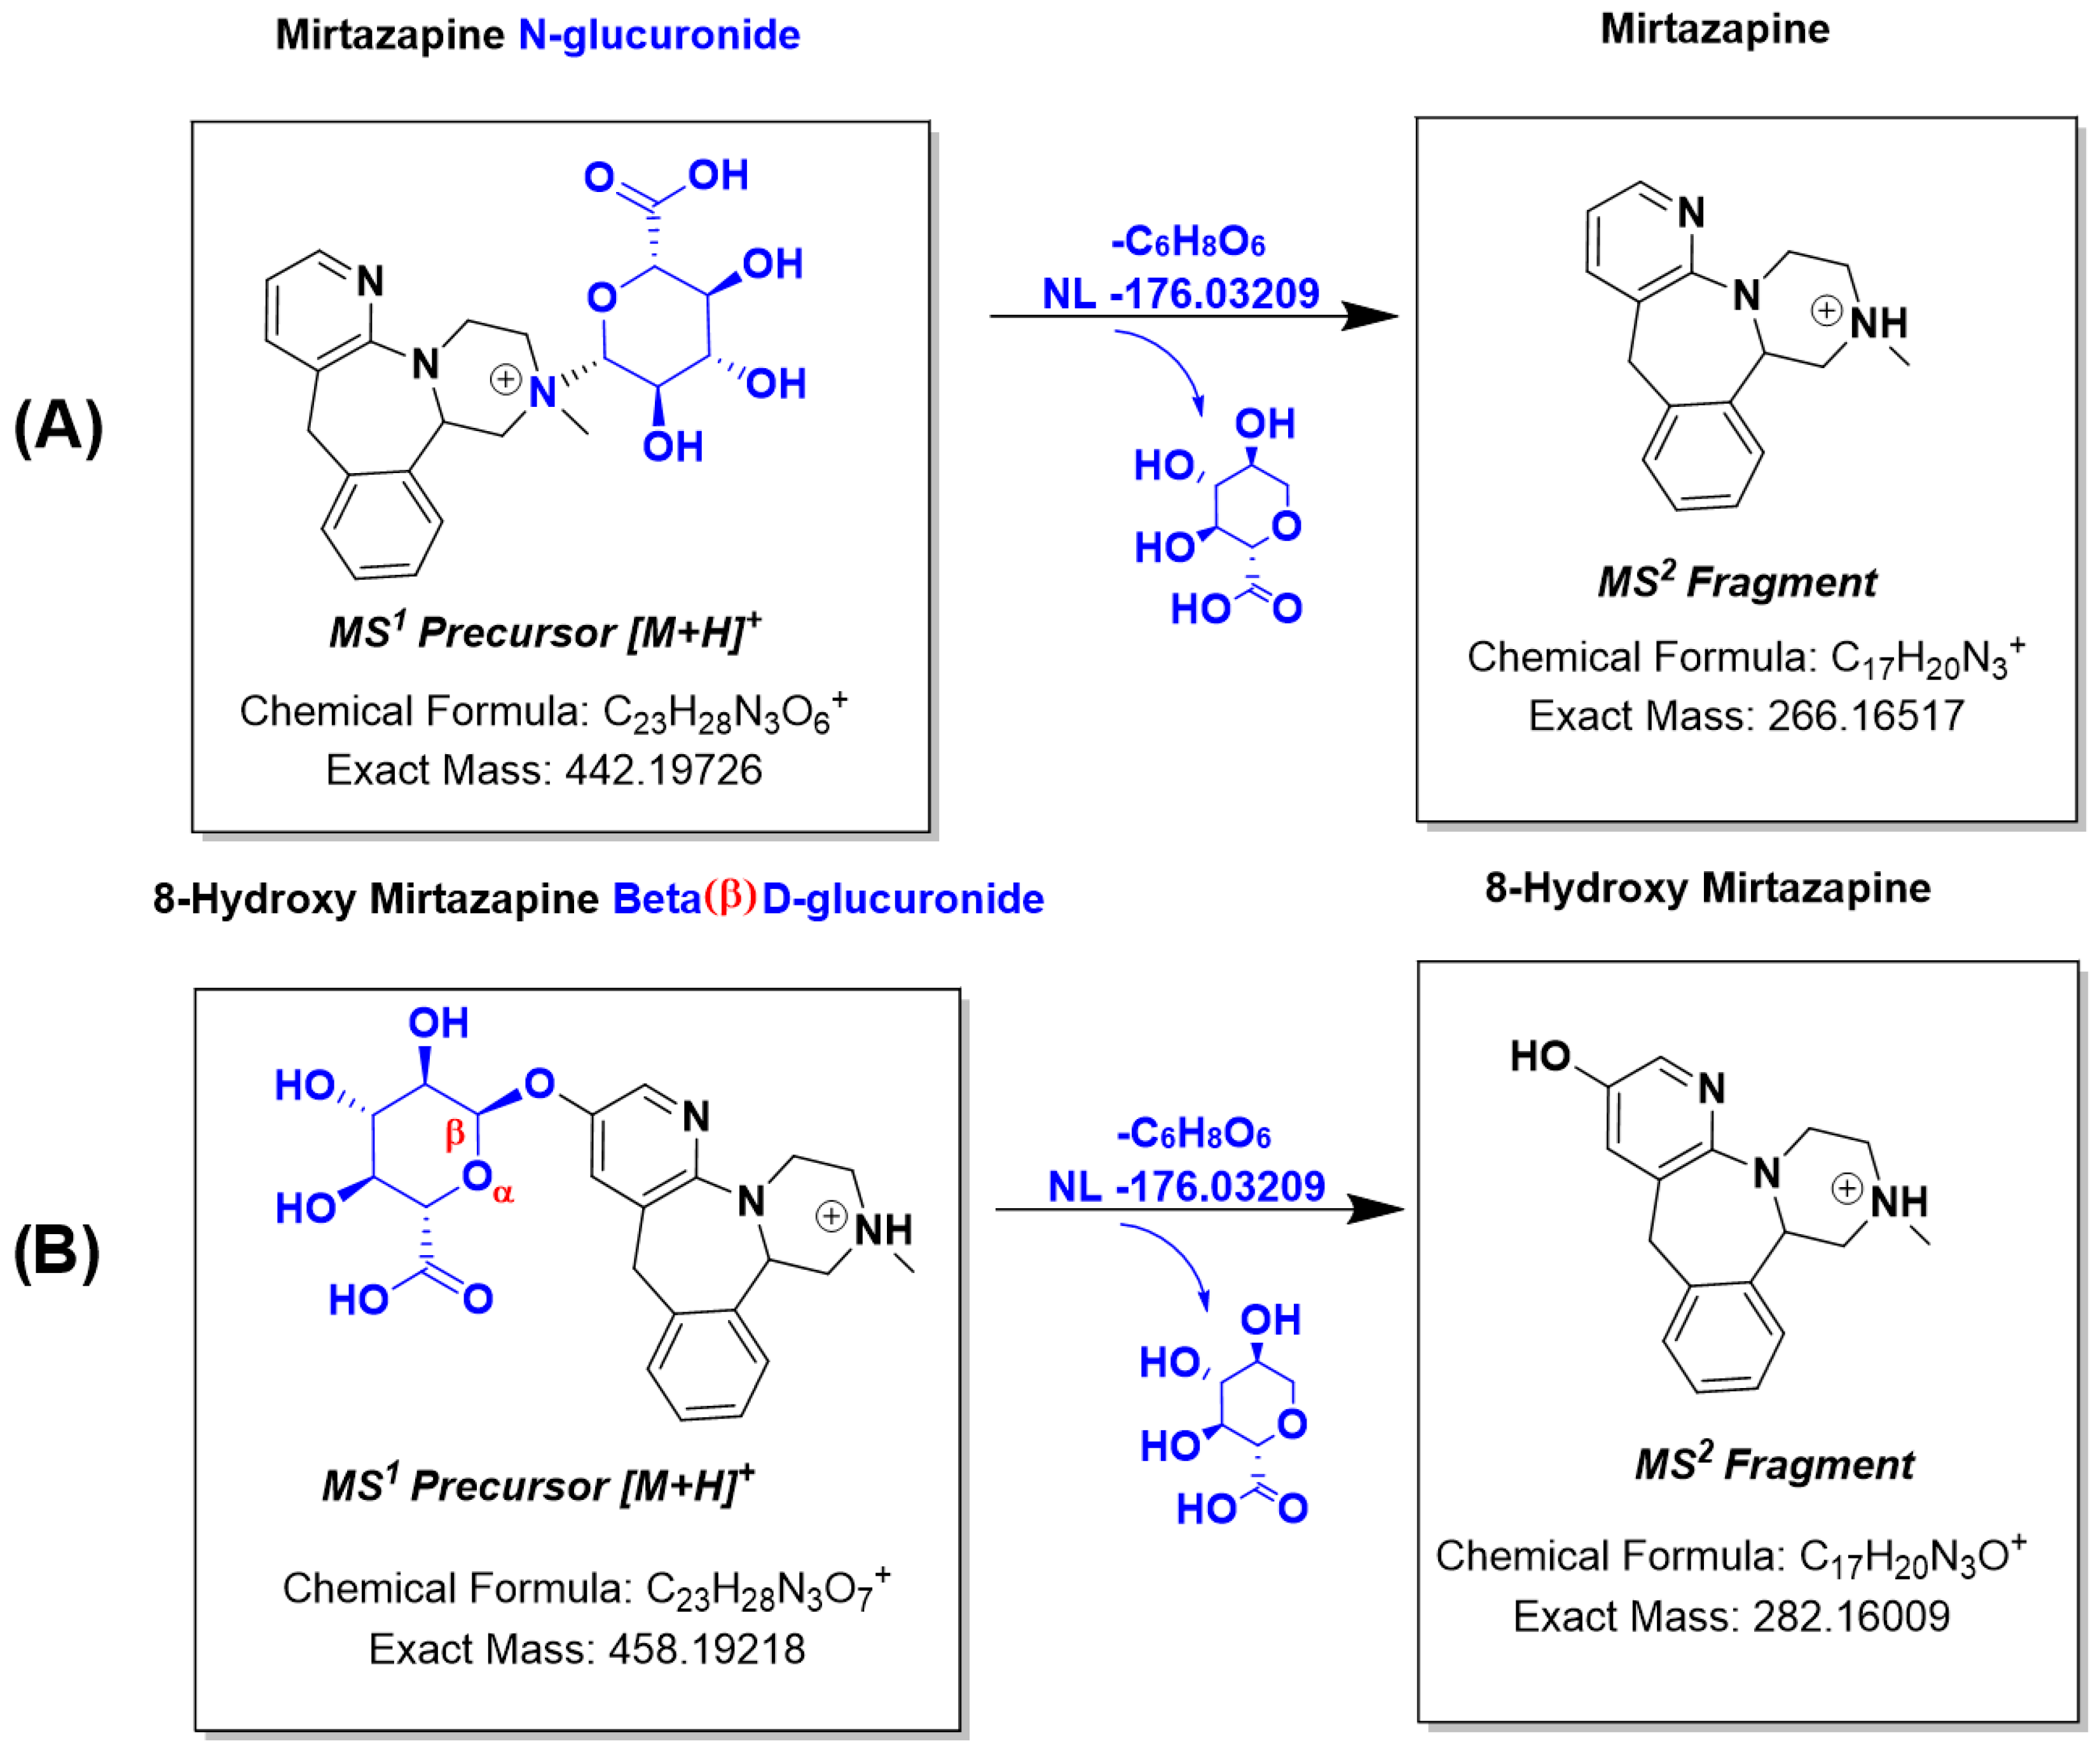

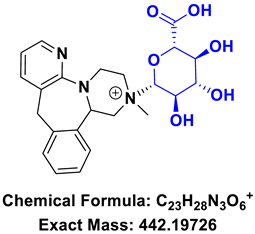
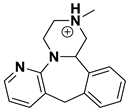
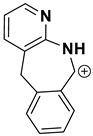

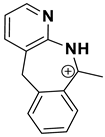
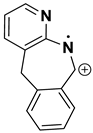
Disclaimer/Publisher’s Note: The statements, opinions and data contained in all publications are solely those of the individual author(s) and contributor(s) and not of MDPI and/or the editor(s). MDPI and/or the editor(s) disclaim responsibility for any injury to people or property resulting from any ideas, methods, instructions or products referred to in the content. |
© 2026 by the authors. Licensee MDPI, Basel, Switzerland. This article is an open access article distributed under the terms and conditions of the Creative Commons Attribution (CC BY) license.