Article

Liver Iron Content and Magnetic Resonance: A “Biopsy-Free” Quantification Method and Its Validation

1
Department of Experimental and Clinical Biomedical Sciences, University of Florence, Largo Brambilla 3, 50134 Florence, Italy
2
Department of Hematology, Careggi University Hospital, Largo Brambilla 3, 50134 Florence, Italy
3
MDS Unit, Hematology, DMSC, AOU Careggi, University of Florence, Largo Brambilla 3, 50134 Florence, Italy
4
Department of Radiology, Careggi University Hospital, Largo Brambilla 3, 50134 Florence, Italy
5
Department of Health Physics, Careggi University Hospital, Largo Brambilla 3, 50134 Florence, Italy
6
Department of Agricultural, Food, Environmental and Forestry Sciences and Technologies, University of Florence, Piazzale delle Cascine, 18, 50144 Florence, Italy
7
Institute of Histopathology and Molecular Diagnosis, Careggi University Hospital, Largo Brambilla 3, 50134 Florence, Italy
*
Author to whom correspondence should be addressed.
Livers 2026, 6(4), 60; https://doi.org/10.3390/livers6040060
Submission received: 28 February 2026 / Revised: 14 April 2026 / Accepted: 11 June 2026 / Published: 1 July 2026

Abstract

Background/Objectives: Accurate liver iron content (LIC) quantification and monitoring are crucial for managing patients with hematological disorders. Biopsy-based LIC assessment is invasive and prone to sampling errors. This study aimed to develop a simple and safe method for calibrating MR scanner to accurately measure LIC. Methods: Five certified test objects with increasing aqueous Fe3+ solutions were used for R2* relaxometry to create a calibration curve with equation for converting R2* value to iron content (mg/g), using two different MR scanners. Additionally, two sets of test objects (aqueous and gelled solutions to mimic liver tissue) were developed to evaluate the feasibility of using homemade test objects. Our method was compared with two existing methods (Wood et al.’s equation and the Iron Calculator App) in 59 hematological patients, using the certified test object method as reference. We also compared our method with biopsy-based iron quantification (inductively coupled plasma optical emission spectroscopy) in four patients. Results: The equations derived from our homemade test objects were comparable to those from certified test objects across both MRI scanners. The literature methods consistently overestimated LIC compared to our method. For biopsy validation, our method was more accurate in two out of four cases. Conclusions: Our homemade calibration method offers a simple, reliable alternative for LIC quantification. The type of test object (aqueous or gelled) showed no significant difference. While biopsy-based methods remain useful, our MRI-based approach is quicker and avoids the limitations of biopsy sampling. This method, relying on the relationship between iron concentrations and relaxation times, could provide a more comprehensive and accurate assessment of liver iron levels.

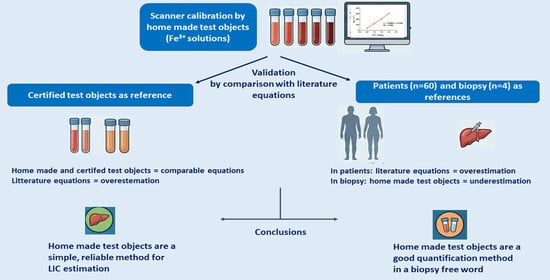
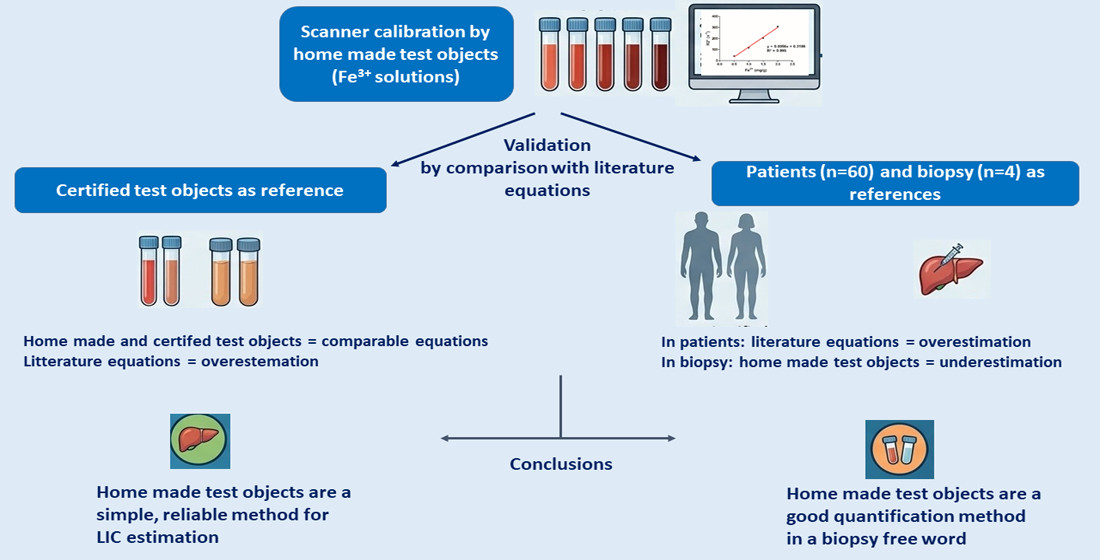
Graphical Abstract

1. Introduction

Quantification and long-term monitoring of liver iron content (LIC) is mandatory in the clinical management of patients with several hematological disorders [1]. Liver biopsy provides a direct quantification of LIC (expressed as mg/g as dry weight of hepatic tissue), but its use is limited by invasiveness and sampling errors [2]. Magnetic Resonance Imaging (MRI) is accepted as a useful primary approach for non-invasive LIC evaluation in the clinical management of iron accumulation prone patients [3]. Three methods have been introduced: the first method is based on chemical shift (e.g., in-phase and opposed-phase sequences) [4]; the second method is based on measuring the signal-intensity ratio between the liver and paraspinal muscles obtained by multiple breath-hold gradient-echo sequences [5]; the third method—relaxometry—is based on loss of MR signal caused by T2 and T2* relaxation time shortening [6] due to iron overload. As with any methodology, all these methods need calibration to obtain consistent and accurate results. In relaxometry, quantitative data is expressed as the transverse relaxation time (T2*, measured in ms) of the liver parenchyma, or as the relaxation rate (R2*, which is the reciprocal of T2*). Therefore, a calibration method, usually with liver biopsy, is required to obtain a quantization expressed as mg/g. However, since biopsy is rarely performed because of its invasiveness, radiologists need a method to calibrate their scanners. In recent years, there has been growing interest in developing calibration methods to reliably derive LIC (expressed in mg/g) from R2* values. The goal is to develop a method able to provide reproducible and accurate LIC measurements, regardless of the magnetic field strength, the scanner brand, or specific sequences used.
On this background, we aim to develop a simple method to calibrate the MR scanner using R2* relaxometry with several homemade test objects using calibration curves obtained from certified test objects as references; to evaluate the potential clinical applicability of our method by testing patients with varying degrees of liver iron accumulation by comparison with data obtained from biopsy samples.

2. Materials and Methods

2.1. Phantoms with Iron Content

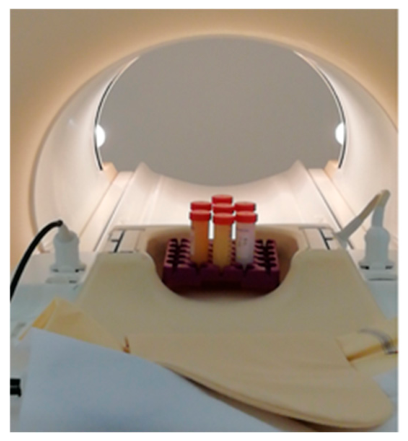
In order to obtain a calibration curve in R2* relaxometry, 5 certified test objects were used, containing an SI-traceable FeCl3 solution (0.40, 0.75, 1.15, 1.50, 1.95 mg/g) in 0.1 M HNO3 test solution [7]. In addition, 8 homemade test objects with iron concentrations were set up, including 4 “gelled” phantoms and 4 “aqueous” phantoms. Gelled phantoms consisted of 50 mL test tubes of a gelled by 2% of agarose for bimolecular analysis (Sigma Aldrich, Milan, Italy) containing Fe3+ (derived from Iron chloride; Merck, Darmstadt, Germany). Final concentrations were set at 0.5, 1.0, 1.5, and 2.0 mg/g, assuming a standard deviation of ±0.05 mg for each individual weighing. Agarose-free aqueous phantoms were prepared with the same iron concentrations, in order to obtain test objects with a consistency similar to liver parenchyma and evaluate the potential influence of the intrinsic agar signal. A 12 h soaking period of all the test objects in the scanner room (21 °C) was respected before MR scans. The analysis was carried out six months later to verify the test object’s long-term stability (Figure 1).

2.2. R2* MRI Sequence

MR images of test tubes (reference and homemade ones) were acquired on two 1.5 T scanners (Ingenia 1.5 T, Philips Medical System, Best, The Netherlands and Magnetom Aera, Siemens Medical Solutions, Erlangen, Germany). Gradient-echo sequences were employed, with the specific technical parameters summarized in Table 1. For each test tube, that is 20 mm in diameter, 9 slices were acquired. The parametric T2* maps were automatically generated on the scanner. T2* values were measured using circular regions of interest (ROIs), 10 mm in diameter, placed by two independent radiologists blinded to the phantom concentrations. Each ROI was centered on the middle slice (slice 5) of the respective test object. To achieve a linear relationship with iron content, T2* values were converted into their reciprocal R2*, using the formula R2*[s−1] = 1000/T2*[ms]. The mean values obtained from each test object were used to derive scanner-specific calibration curves, providing equations to convert R2* values to iron content (mg/g). Coefficient of determination (R2) of each equation was calculated. In order to compare quantitative data obtained with our homemade test objects, we quantified iron content values also by two different methods: (1) a similar equation from the literature obtained from biopsy-based calibration curves by Wood et al. (LIC mg/g dry weight = 0.0254 × R2* + 0.202) [8]; (2) an android available application software (Iron Calculator App, developed by Fernandes JL, Jose Michel Kalaf Research Institute, version 2021) based on an equation derived from biopsy-based calibration methods developed by Garbowski et al. (LIC mg/g dry weight = 0.0320 × R2* − 0.140) [9,10]. The comparison was obtained using the certified test objects as reference. The quantification obtained with our proposed method and by comparison methods was expressed as percentage deviation from the certified test objects concentration.

2.3. Patients, Characteristics of Population

Patients with hematological disorders—including thalassemia, hemochromatosis and myelodysplastic syndromes—who had undergone liver MRI as part of routine clinical care at our Radiology Department between March 2021 and September 2025 were retrospectively identified for inclusion in the study. The retrospective use of these clinical data and images for research purposes was approved by the Comitato Etico Regione Toscana Area Vasta Centro (protocol code 29758_oss; approval date: 13 January 2026). This study was conducted in accordance with the ethical principles outlined in the Declaration of Helsinki (1975, revised in 2013). After approval and before inclusion in the research dataset, written informed consent for the retrospective use of clinical data and MRI images was obtained from all participants. Inclusion criteria were a complete liver MR examination, including the T2* relaxometry sequence (described above), performed on the same 1.5T MR scanner (Philips Ingenia 1.5 T, Amsterdam, The Netherlands) for LIC quantification. Fifty-nine hematological patients (44 males, 15 females) were enrolled. Using a PACS workstation (version Syngo plaza-VB30D; Siemens Medical Healthineers, Erlangen, Germany), two radiologists with 10 years of experience in abdominal imaging (L.C. and C.N.) reached a consensus to select the T2* map slice with the optimal image quality. The chosen slice was located in the mid-portion of the right lobe, where artifacts—such as those from cardiac motion or lung and bowel interfaces—are minimized. Six 1-cm diameter circular ROIs—three in the right lobe and three in the left lobe—were placed in the most homogeneous areas of liver parenchyma on the selected slice. To minimize partial volume effects, ROIs were positioned at least 2 cm away from the edges of the liver, avoiding macroscopic vessels and possible focal lesions. T2* values were converted into their reciprocal R2* (as described in Section 2.2). For each patient, the mean R2* value was calculated by averaging the values from the six ROIs. Patients were then categorized into four groups based on their R2* values: normal iron content (<60 s−1), mild (120–270 s−1), moderate (271–580 s−1), and severe iron overload (>580 s−1) [11].

2.4. Biopsy and Its Analysis

Among the included patients, four had undergone liver biopsy within one month after having an MRI scan. Biopsy samples were analyzed for iron content using inductively coupled plasma optical emission spectroscopy (ICP-AES). The method consists of the measurement of the intensities of electromagnetic radiation emitted by excited atoms/ions of the species present in the sample by means of spectrometric techniques with plasma source. The sample and the calibration solutions are appropriately nebulized and the aerosol is transported into the plasma, where, following excitation phenomena, the production of the emission spectrum composed of the characteristic lines of the elements present occurs. The emission intensities are detected, simultaneously or sequentially, and the concentration of analyte present in the sample is determined by comparison with a reference solution of known concentration, and by Perls histochemistry reaction in order to determine the visible iron content by blue granules originated from this specific reaction as described in Iezzoni et al. [12].

3. Results

3.1. Calibration Curve Determination and Its Validation

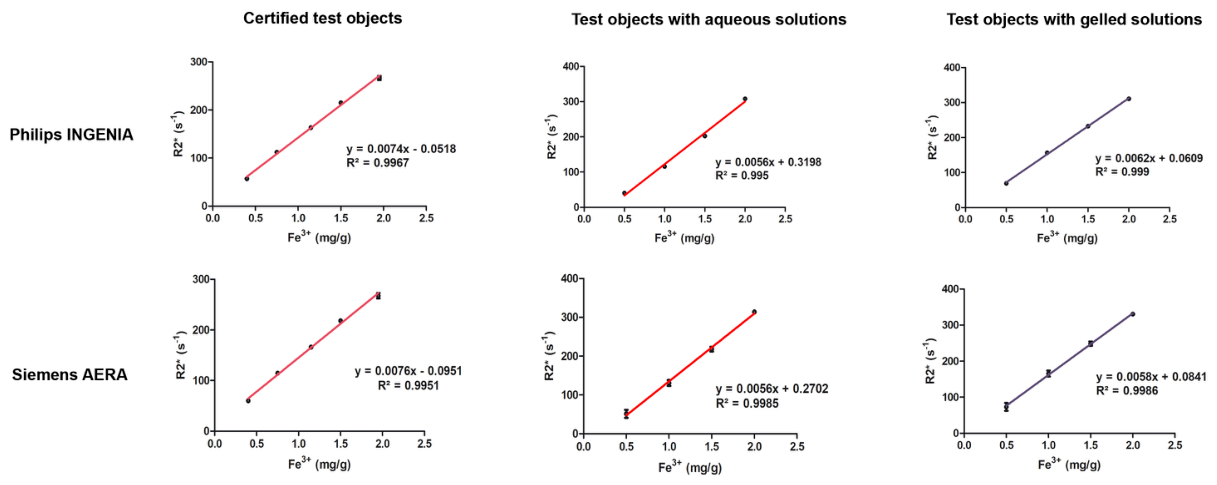
R2* values obtained from certified test objects on 1.5 T Ingenia Philips and 1.5 T Magnetom Aera Siemens scanners were correlated with known iron concentrations. This yielded linear correlations defined by the following equations:
y = 0.0074 × R2* − 0.0518 for Ingenia Philips
y = 0.0076 × R2* − 0.0951 for Magnetom Aera Siemens,
where y = iron content (mg/g) and R2* is the relaxation rate (Figure 2).
Using R2* values and iron content of our aqueous test object, we achieved the following equations:
y = 0.0056 × R2* + 0.3241 for Ingenia Philips
y = 0.0056 × R2* + 0.2684 for Magnetom Aera Siemens.
Using the R2* values and iron content of our gelled phantoms, we achieved the following equations:
y = 0.0062 × R2* + 0.0629 for Ingenia Philips
y = 0.0057 × R2* + 0.0985 for Magnetom Aera Siemens.
Coefficients of determination (R2) for each equation, ranging from 0.9951 to 0.9992 (very high correlation), were reported in Figure 2. Data obtained from the analysis carried out after six months yielded comparable results.
In order to verify the phantoms short-term stability, MR analyses were repeated after 5 min. The resulting calibration curves were entirely superimposable on those from the initial measurement for both scanners.
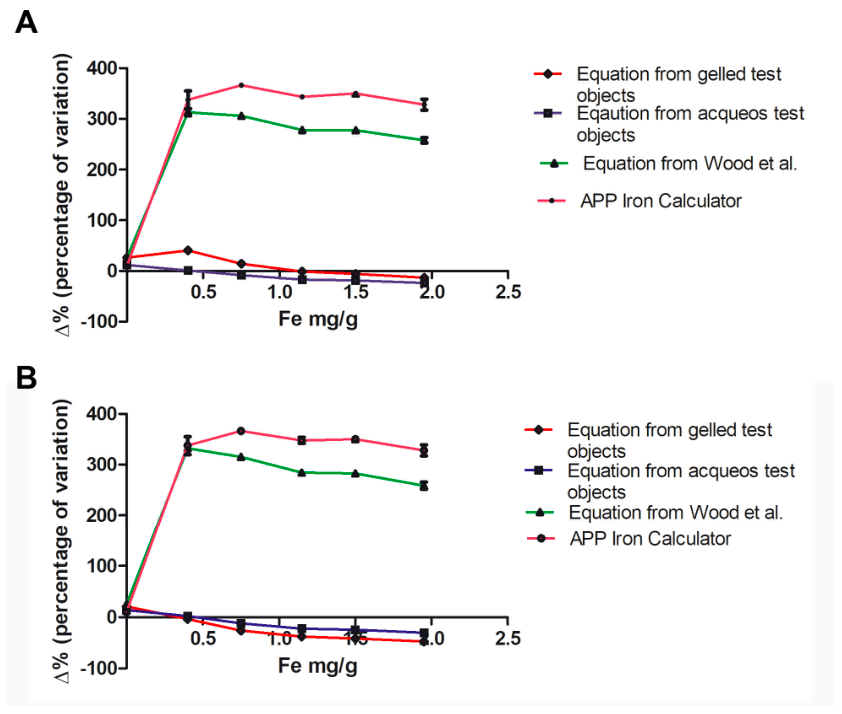
Applying our equation derived from gelled test objects to certified phantoms for the different known concentrations, we observed an average iron content underestimation of approximately 4% on both scanners. Always using certified phantoms as reference, the equation derived from test objects in an aqueous solution yielded an iron content average underestimation of 9%. Notably, both methods chosen for comparison showed significant iron content average overestimation (+234% for Wood et al. equation and +276% for Iron Calculator App) when averaging the results across the two scanners (Figure 3).

3.2. Patient Evaluations

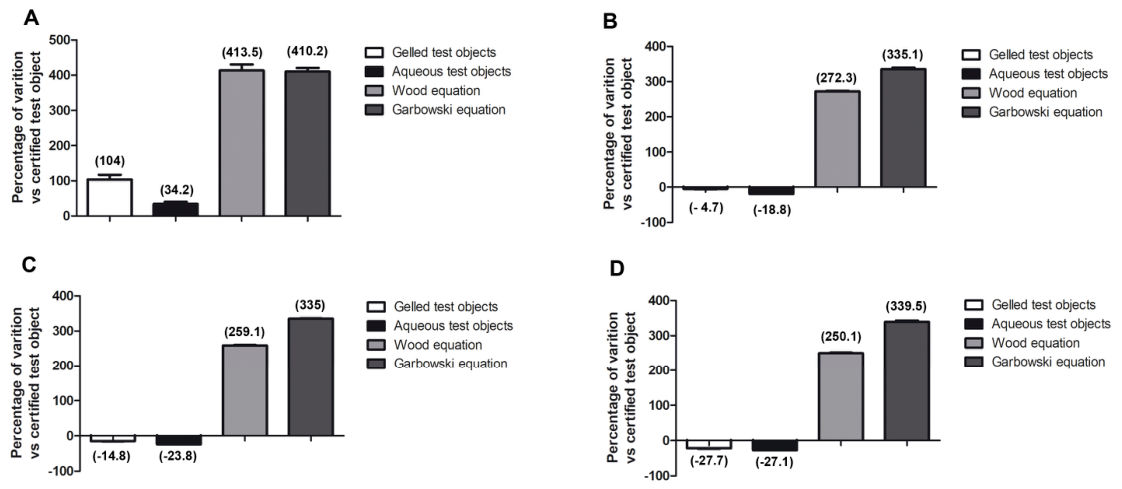
Based on the mean R2* values, patients were categorized into four subgroups: patients without iron accumulation (n = 25), patients with mild iron accumulation (n = 9), patients with moderate iron accumulation (n = 20), and patients with severe iron accumulation (n = 5). From the R2* values, the LIC was calculated using the equations derived on Ingenia Philips scanner from our gelled and aqueous test objects, Wood et al. equation and the Iron Calculator App. Using the certified test object equation as reference, the percentage variations for each patient’s subgroup are shown in Figure 4. The results mirrored the trends observed in the phantom study. Specifically, both the gel-based and aqueous equations underestimated LIC in patients with iron overload (by an average of 16% and 23%, respectively), while overestimating it by approximately 69% in the normal iron group. It should be noted that the underestimation in the overload group appeared to correlate with the severity of iron accumulation. At the same time, it can be observed that the difference between quantization with different test object (gelled and aqueous) equations progressively decreased as iron levels rose; in the severe overload group, the underestimation was nearly identical (−27.7% vs. −27.1%). In contrast, both comparison methods (Wood et al. and Iron Calculator App) consistently overestimated LIC across all subgroups, with an average deviation exceeding 200%.

3.3. Quantification Methods Comparison in Biopsy

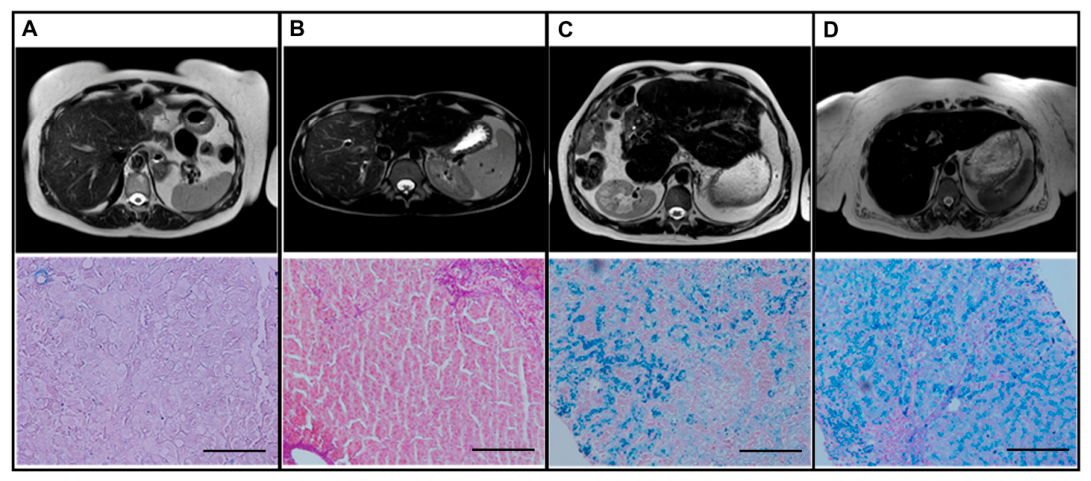
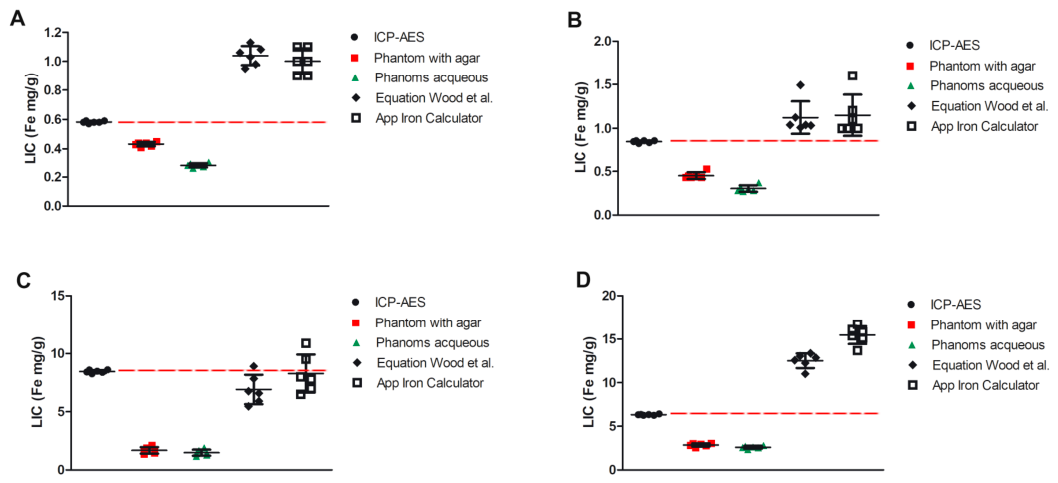
Four patients in the study population underwent right-lobe liver biopsy. Based on their R2* values, they are classified as follows: two non-accumulators (R2* < 60 s−1), one mild-to-moderate (R2* 260 ± 22 s−1) and one moderate-to-severe (R2* 565 ± 31 s−1). Semi-quantitative evaluation of iron content using Perls’ reaction confirmed the MRI-based classification (Figure 5). LIC values obtained with our equations derived from gelled and aqueous test objects, Wood et al. equation and Iron Calculator App were compared against LIC measured from inductively coupled plasma optical emission spectroscopy as the reference standard. Both of our proposed equations underestimated LIC in all four cases, with no significant differences between gelled and aqueous models. This underestimation was less pronounced in patients with normal iron levels (patient A and B) and in the moderate-to-severe case (patient D). Conversely, both the Wood et al. equation and the Iron Calculator App overestimated LIC, particularly in the non-accumulator and moderate-to-severe case (Figure 6).

4. Discussion

In recent decades, several iron quantification methods have been developed to support the role of MRI as a critical tool in the clinical management of patients prone to iron overload. Among these, relaxometry-based techniques appear to be the easiest to apply. Whilst hematologists have become used to expressing the amount of iron in terms of T2* or R2* values, reporting the iron quantification in mg/g (LIC) could significantly improve communication and data interpretation across different medical specialties. Consequently, reliable calibration methods to derive LIC from R2* are essential. Given that liver biopsy is no longer widely used as a diagnostic method for hepatic iron assessment, phantom-based calibration methods could be an easier and quicker response to this need. The current literature reflects a growing interest in developing test objects for quantitative MRI. For instance, Sękowska et al. developed test objects for the assessment of hepatic T1 mapping [13], while Goodall et al. developed low-agar-content test objects for R2* relaxometry. However, while Goodall’s study focused on highlighting inter-scanner and sequence variability, it did not validate the efficacy of these phantoms in a patient population or compare them against established calibration methods [14].
Our data demonstrate that scanner calibration for iron quantification can be achieved using a limited number of certified test objects, with no significant differences between the scanners employed, in accordance with Goodall and colleagues [14]. Therefore, this method of calibration demonstrates a kind of universality, and it would be helpful if this were confirmed in further work by other research groups.
We also found it interesting to create homemade test objects either in aqueous solution, like the certified ones, or gelled with 2% agar. Although other research groups have employed lower agar concentrations (e.g., 0.8%) for stabilizing iron distribution [15], our aim was to more closely mimic the mechanical properties and texture of the liver parenchyma to evaluate their impact on relaxometry. So, we have chosen a higher concentration of agar (2%) to better approximate the tissue consistency of a patient’s liver. Furthermore, we hypothesize that the use of test objects with agar could be a method useful in assessing iron overload in other organs with similar parenchymal textures, such as the heart or pancreas.
When applying our equations to patients, the comparison between gelled and aqueous test objects—using certified phantoms as reference—showed that both methods yield comparable results. Specifically, an underestimation of LIC was observed, ranging from 16% and 23% in patients with iron overload, compared to approximately 4% in phantom measurements. It has long been known that agarose influences T2 relaxation time, so the lack of this component in aqueous phantoms causes higher T2 relaxation time, with a higher underestimation of iron content [16,17]. On the other side, the final agar concentration can be adjusted to reduce the potential overestimation. From a practical standpoint, developing homemade aqueous phantoms appears to be a simpler approach for widespread clinical use. Notably, the underestimation associated with aqueous phantoms progressively decreases as the severity of iron overload increases. This seems to suggest that the contribution of the agarose matrix to T2 relaxation becomes negligible at high LIC values, where the paramagnetic effect of iron dominates the signal.
In comparison with our method, using certified test objects as reference, both Wood et al. equation and Iron Calculator App—which are derived from biopsy-based calibrations—yielded an apparent overestimation of iron levels. While we are aware of the inherent bias in these comparisons, our findings could suggest a significant weakness in using biopsy as a reference standard. Biopsy-based LIC quantification measures iron in a dehydrated environment (with values expressed as mg of iron per gram of dry weight), whereas relaxometry parameters are obtained in an aqueous (in vivo) environment. Consequently, using dry weight could introduce a systematic error due to tissue dehydration: for a given iron content, the removal of the solvent (water) results in a higher apparent concentration. This discrepancy likely explains the significant percentage variations observed between LIC values obtained with our equation and those established in the existing literature. We therefore hypothesize that our results, which should be considered preliminary, are not of secondary importance, as the MRI signal is fundamentally based on the interaction between the aqueous dipole, radiofrequency, and magnetic field.
We wish to underline that comparing our equations with established methods is not intended to claim the inherent superiority of phantom-based techniques. On the contrary, we believe this comparison offers the opportunity for a critical reflection on how quantification methods derive their validity from the technical and methodological context in which they are developed. When liver biopsy was the gold standard, biopsy-based calibration was ideal. However, as biopsy is no longer used to assess iron accumulation, it seems more appropriate to develop a calibration method based on phantoms, given the greater homogeneity between liver environment and calibration technique.
In addition to the known critical issues related to its invasiveness, our data also confirm an additional critical issue of liver biopsy. As shown in one of our patients (Figure 5B), where T2 hypointensity consistent with iron overload was localized exclusively to the left lobe, biopsy can be subject to a significant sampling error. This underlines how, in the case of a sectorial or “geographic map-like” pattern of iron accumulation, MR relaxometry, which provides a comprehensive assessment of the entire liver is preferable to biopsy.
A single biopsy specimen may not accurately reflect the total LIC, a factor of critical importance both for initial diagnosis and for monitoring the efficacy of iron chelation therapy during follow-up.
Our study has some limitations that should be considered. First, it is a retrospective observational study, although all patients with hematological disorders were evaluated using a standardized MRI protocol. Second, only a small cohort of patients underwent biopsy; however, as previously noted, liver biopsy is no longer the primary diagnostic tool for LIC assessment. While the limited number of biopsy comparisons do not allow us to draw definitive conclusions, it is noteworthy that LIC values derived from our equations always tend to underestimate the value determined with spectroscopy, while those derived from the established literature-based equations tended to significantly overestimate LIC both in the one non-accumulator patient and in the patient with moderate-to-severe accumulation. These findings underscore that accurate LIC quantification remains a complex clinical challenge. Given the current rarity of liver biopsies, collecting further comparative data will require prospective multicenter studies. Nevertheless, we believe our results provide a robust foundation for validating phantom-based calibration and refining any correction factors for converting R2* to LIC. A further critical point of our method is the potential difficulty for diagnostic centers to produce homemade gelled test objects. Considering the reliability of test objects with known iron content in aqueous solution, which is relatively easy to obtain even for physicians without years of laboratory experience, this calibration method seems easier to recommend. Finally, we did not account for the potential coexistence of iron overload and other storage diseases, such as Wilson’s disease or hepatic steatosis. Regarding copper accumulation, only a few studies involving patients with Wilson’s disease suggest that copper levels may interfere with iron quantification by lowering T2* values [18]. Concerning steatosis, while some evidence suggests that iron does not significantly affect fat fraction calculation, other studies indicate that high iron concentrations can compromise its accuracy [19,20]. Data from Shrestha et al. indicated that, on 0.55 T MR scanners, the relationship between iron concentration and R2* is not significantly influenced by the degree of steatosis, with LIC measurement bias remaining near zero as the fat fraction increases [21]. However, Karlsson et al. reported that liver R2* is affected by liver fat, and that fat increases R2* on 1.5 T MRI scanners [22]. Therefore, it will be prudent to develop and evaluate in future studies multi-component test objects containing a mixture of iron and potential confounders, such as fat or copper, to better assess their influence on iron content estimation.

5. Conclusions

Our experience showed that: (1) it was possible calibrate the MRI scanner by several certified test objects which have proven to be accurate, stable over time and independent of the scanner used; (2) homemade aqueous test objects are relatively simpler to obtain vs. gelled test objects, with a similar reliable calibration of the scanner; (3) in clinical practice, MR scanners specific calibration equations for converting liver R2* values to LIC may overcome some limitations of dry weight biopsy-based methods, but further comparison and validation studies are needed. This kind of approach may improve radiologists’ confidence in iron content evaluation and allows one to directly link the loss of T2 MR signal caused by iron accumulation to an easily understandable quantitative measurement.

Author Contributions

Conceptualization, L.C. (Lorenzo Cinci) and L.C. (Linda Calistri); methodology, L.C. (Lorenzo Cinci), C.N. and L.C. (Linda Calistri); validation, L.C. (Lorenzo Cinci) and S.B.; formal analysis, L.C. (Lorenzo Cinci) and L.C. (Linda Calistri); investigation, L.C. (Lorenzo Cinci), G.D., S.P., L.M. (Luca Messerini) and M.L. (Martina Legato); data curation, L.C. (Lorenzo Cinci) and L.C. (Linda Calistri); writing—original draft preparation, L.C. (Lorenzo Cinci); writing—review and editing, L.C. (Lorenzo Cinci) and L.C. (Linda Calistri); supervision, L.C. (Linda Calistri); patients management, V.C. and V.S. All authors have read and agreed to the published version of the manuscript.

Funding

This research received no external funding.

Institutional Review Board Statement

The study was conducted in accordance with the Declaration of Helsinki. Patients had undergone liver MRI as part of routine clinical care between March 2021 and September 2025. The retrospective use of these clinical data and images for research purposes was approved by the Comitato Etico Regione Toscana Area Vasta Centro (protocol code 29758_oss; approval date: 13 January 2026). After approval and before inclusion in the research dataset, written informed consent for the retrospective use of clinical data and MRI images.

Informed Consent Statement

Patients had undergone liver MRI as part of routine clinical care between March 2021 and September 2025. The retrospective use of these clinical data and images for research purposes was approved by the Comitato Etico Regione Toscana Area Vasta Centro (protocol code 29758_oss; approval date: 13 January 2026). After approval and before inclusion in the research dataset, written informed consent for the retrospective use of clinical data and MRI images.

Data Availability Statement

The original contributions presented in this study are included in the article. Further inquiries can be directed to the corresponding author.

Conflicts of Interest

The authors declare no conflicts of interest.

References

  1. Brittenham, G.M.; Badman, D.G.; National Institute of Diabetes and Digestive and Kidney Diseases (NIDDK) Workshop. Noninvasive measurement of iron: Report of an NIDDK workshop. Blood 2003, 101, 15–19. [Google Scholar] [CrossRef] [Scilit] [PubMed]
  2. Bacigalupo, L.; Paparo, F.; Zefiro, D.; Viberti, C.M.; Cevasco, L.; Gianesin, B.; Pinto, V.M.; Rollandi, G.A.; Wood, J.C.; Forni, G.L. Comparison between different software programs and post-processing techniques for the MRI quantification of liver iron concentration in thalassemia patients. Radiol. Med. 2016, 121, 751–762. [Google Scholar] [CrossRef] [Scilit] [PubMed]
  3. Henninger, B.; Zoller, H.; Rauch, S.; Finkenstedt, A.; Schocke, M.; Jaschke, W.; Kremser, C. R2* relaxometry for the quantification of hepatic iron overload: Biopsy-based calibration and comparison with the literature. Rofo 2015, 187, 472–479. [Google Scholar] [CrossRef] [Scilit] [PubMed]
  4. Lim, R.P.; Tuvia, K.; Hajdu, C.H.; Losada, M.; Gupta, R.; Parikh, T.; Babb, J.S.; Taouli, B. Quantification of hepatic iron deposition in patients with liver disease: Comparison of chemical shift imaging with single-echo T2*-weighted imaging. AJR Am. J. Roentgenol. 2010, 194, 1288–1295. [Google Scholar] [CrossRef] [Scilit] [PubMed]
  5. Gandon, Y.; Olivie, D.; Guyader, D.; Aube, C.; Oberti, F.; Sebille, V.; Deugnier, Y. Non-invasive assessment of hepatic iron stores by MRI. Lancet 2004, 363, 357–362. [Google Scholar] [CrossRef] [Scilit] [PubMed]
  6. St Pierre, T.G.; Clark, P.R.; Chua-anusorn, W.; Fleming, A.J.; Jeffrey, G.P.; Olynyk, J.K.; Pootrakul, P.; Robins, E.; Lindeman, R. Noninvasive measurement and imaging of liver iron concentrations using proton magnetic resonance. Blood 2005, 105, 855–861. [Google Scholar] [CrossRef] [Scilit] [PubMed]
  7. Clarkson, C.; Hill, S.; Gezer, T.D.; Ün, I.; Rai, S.; Abukashabeh, A.; Entwisle, J.; Cashmore, M.; Cooke, E.A.; McDowell, A.R.; et al. A standard SI traceable phantom suitable for qMRI: Design, manufacture and characterization. Metrologia 2025, 62, 025008. [Google Scholar] [CrossRef] [Scilit]
  8. Wood, J.C.; Enriquez, C.; Ghugre, N.; Tyzka, J.M.; Carson, S.; Nelson, M.D.; Coates, T.D. MRI R2 and R2* mapping accurately estimates hepatic iron concentration in transfusion-dependent thalassemia and sickle cell disease patients. Blood 2005, 106, 1460–1465. [Google Scholar] [CrossRef] [Scilit] [PubMed]
  9. Git, K.-A.; Fioravante, L.A.B.; Fernandes, J.L. An online open-source tool for automated quantification of liver and myocardial iron concentrations by T2* magnetic resonance imaging. Br. J. Radiol. 2015, 88, 20150269. [Google Scholar] [CrossRef] [Scilit] [PubMed]
  10. Garbowski, M.W.; Carpenter, J.P.; Smith, G.; Roughton, M.; Alam, M.H.; He, T.; Pennell, D.J.; Porter, J.B. Biopsy-based calibration of T2* magnetic resonance for estimation of liver iron concentration and comparison with R2 FerriScan. J. Cardiovasc. Magn. Reson. 2014, 16, 40. [Google Scholar] [CrossRef] [Scilit] [PubMed]
  11. Labranche, R.; Gilbert, G.; Cerny, M.; Vu, K.N.; Soulières, D.; Olivié, D.; Billiard, J.S.; Tang, A. Liver iron quantification with MR imaging: A primer for radiologists. Radiographics 2018, 38, 392–412. [Google Scholar] [CrossRef] [Scilit] [PubMed]
  12. Iezzoni, J.C. Diagnostic histochemistry in hepatic pathology. Semin. Diagn. Pathol. 2018, 35, 381–389. [Google Scholar] [CrossRef] [Scilit] [PubMed]
  13. Sękowska, A.; Majchrowicz, D.; Sabisz, A.; Ficek, M.; Bułło-Piontecka, B.; Kosowska, M.; Jing, L.; Bogdanowicz, R.; Szczerska, M. Nanodiamond phantoms mimicking human liver: Perspective to calibration of T1 relaxation time in magnetic resonance imaging. Sci. Rep. 2020, 10, 6446. [Google Scholar] [CrossRef] [Scilit] [PubMed]
  14. Goodall, A.; Powell, S.; Lister, J.; Fry, A. Development and testing of an in-house phantom to assess T2*/R2* relaxometry measurements of liver iron concentration. Proc. Int. Soc. Magn. Reson. Med. 2022, 30, 2401. [Google Scholar] [CrossRef] [Scilit] [PubMed]
  15. Mobini, N.; Malekzadeh, M.; Haghighatkhah, H.; Saligheh Rad, H. A hybrid (iron-fat-water) phantom for liver iron overload quantification in the presence of contaminating fat using magnetic resonance imaging. Magn. Reson. Mater. Phys. 2020, 33, 385–392. [Google Scholar] [CrossRef] [Scilit] [PubMed]
  16. Mitchell, M.D.; Kundel, H.L.; Axel, L.; Joseph, P.M. Agarose as a tissue-equivalent phantom material for NMR imaging. Magn. Reson. Imaging 1986, 4, 263–266. [Google Scholar] [CrossRef] [Scilit] [PubMed]
  17. Dwihapsari, Y.; Maulidiyah, N.; Darminto. The effect of paramagnetic agent on relaxation and mechanical properties of agar hydrogel for phantom in magnetic resonance imaging. IOP Conf. Ser. Mater. Sci. Eng. 2018, 395, 012025. [Google Scholar] [CrossRef] [Scilit]
  18. Dezortova, M.; Lescinskij, A.; Dusek, P.; Herynek, V.; Acosta-Cabronero, J.; Bruha, R.; Jiru, F.; Robinson, S.D.; Hajek, M. Multiparametric quantitative brain MRI in neurological and hepatic forms of Wilson’s disease. J. Magn. Reson. Imaging 2020, 51, 1829–1835. [Google Scholar] [CrossRef] [Scilit] [PubMed]
  19. Liau, J.; Shiehmorteza, M.; Girard, O.M.; Sirlin, C.B.; Bydder, M. Evaluation of MRI fat fraction in the liver and spine pre and post SPIO infusion. Magn. Reson. Imaging 2013, 31, 1012–1016. [Google Scholar] [CrossRef] [Scilit] [PubMed]
  20. İdilman, İ.S.; Gümrük, F.; Haliloğlu, M.; Karçaaltıncaba, M. The feasibility of magnetic resonance imaging for quantification of liver, pancreas, spleen, vertebral bone marrow, and renal cortex R2* and proton density fat fraction in transfusion-related iron overload. Turk. J. Haematol. 2016, 33, 21–27. [Google Scholar] [CrossRef] [Scilit] [PubMed]
  21. Shrestha, U.; Bolding, M.; Santiago, T.; Abramson, Z.; Morin, C.E.; Tipirneni-Sajja, A. Evaluation of 0.55T MRI for Simultaneous R2* and Fat Fraction Quantification in the Presence of Hepatic Iron Overload and Steatosis Using Simulations and Phantoms. Magn. Reson. Med. 2026, 95, 1737–1752. [Google Scholar] [CrossRef] [Scilit] [PubMed]
  22. Karlsson, M.; Ekstedt, M.; Dahlström, N.; Forsgren, M.F.; Ignatova, S.; Norén, B.; Leinhard, O.D.; Kechagias, S.; Lundberg, P. Liver R2* is affected by both iron and fat: A dual biopsy-validated study of chronic liver disease. J. Magn. Reson. Imaging 2019, 50, 325–333. [Google Scholar] [CrossRef] [Scilit] [PubMed]
Figure 1. Pictorial representation of test objects during MR acquisition.
Livers 06 00060 g001
Figure 2. Calibration curve set up on two different scanners by certified and homemade test objects (aqueous and gelled). Linear correlation between iron concentration and R2* with corresponding equations and coefficients of determination (R2) were shown. R2* data were expressed as mean values ± standard deviation (SD). y = iron content of test object (mg/g); x = R2* value. SD values [mean (range)] for Philips and Siemens scanners: 1.6 (0.4–4.1) and 4.8 (0.3–10.3), respectively.
Livers 06 00060 g002
Figure 3. Graphs of percentage of variation of iron content (mg/g) obtained with our equations (derived from gelled test and aqueous test), Wood et al. equation and Iron Calculator App, taking certified test objects iron contents as references, on Ingenia Philips (A) and Magnetom Aera Siemens (B) scanner. Data were expressed as mean values ± standard deviation (SD). SD values [mean (range)] for Philips and Siemens scanners: (1) gelled test objects: Philips 0.9 (0.7–1.5) and Siemens 0.3 (0–0.9); (2) aqueous test objects: Philips 0.8 (0–1.2) and Siemens 0.5 (0–1.3); (3) Wood et al. equation: Philips 3.9 (2.1–7.2) and Siemens 2.9 (0.6–7.1); (4) App Iron Calculator: Philips 5.2 (0–17.6) and Siemens 6.6 (0–17.6).
Livers 06 00060 g003
Figure 4. Graphs representing the percentage of variation of LIC in patients without iron accumulation (A), with mild iron accumulation (B), with moderate iron accumulation (C) and with severe iron accumulation (D) in comparison with the equation derived from certified test objects taken as reference. In all graphs, the average value is shown in brackets for each column.
Livers 06 00060 g004
Figure 5. Schematic representation of patients undergoing biopsy. For each patient: (top panel) image of TSE T2 sequence of liver; (bottom panel) representative image of Perls reaction on histological specimen, the presence of iron is indicated by the blue color (scale bar: 100 µm). (A) Patient without iron accumulation; (B) patient without iron accumulation with lower T2 signal intensity in left hepatic lobe; (C) patient with mild/moderate iron accumulation; (D) patient with moderate/severe iron accumulation.
Livers 06 00060 g005
Figure 6. Graphs representative of quantification method comparison in patients undergoing biopsy. (A,B) Patients without iron accumulation; (C) patient with mild/moderate iron accumulation; (D) patient with moderate/severe iron accumulation. Inductively coupled plasma optical emission spectroscopy, ICP-AES. The red dotted line indicates the average level measured by ICP-AES in order to better highlight the differences in calibration methods with respect to this value. Wood’s equation [8]; App Iron Calculator [9,10].
Livers 06 00060 g006
Table 1. Technical parameters of MRI sequences in both used scanners.
ParametersPhilips INGENIA 1.5 TSiemens AERA 1.5 T
Slice thickness (mm)55
Repetition time (ms)15200
First echo time(s) (ms)1.131.29
Echo spacing (ms)shortest1.9
Echoes1612
Number of averages11
Echo train length1612
%Sampling100100
Receiving coilbody matrix coilbody matrix coil
Acquisition matrix160 × 16080 × 128
FoV size (mm × mm)400 × 400250 × 400
Voxel size (mm3)2.5 × 2.5 × 53.12 × 3.12 × 5
Flip angle (deg)2520
Acquisition time (s)1716
Disclaimer/Publisher’s Note: The statements, opinions and data contained in all publications are solely those of the individual author(s) and contributor(s) and not of MDPI and/or the editor(s). MDPI and/or the editor(s) disclaim responsibility for any injury to people or property resulting from any ideas, methods, instructions or products referred to in the content.