Article

Limited Agreement of Different Elastography Techniques in Assessing Liver Stiffness in Postmenopausal Women with Early-Stage Metabolic Dysfunction-Associated Steatotic Liver Disease


by
Ilias D. Vachliotis
1,
Vasileios Rafailidis
2,
Athanasios D. Anastasilakis
3,
Nikoletta Pyrrou
2 and
Stergios A. Polyzos
1,*
1
Laboratory of Pharmacology, School of Medicine, Aristotle University of Thessaloniki, 54124 Thessaloniki, Greece
2
Department of Clinical Radiology, AHEPA University Hospital, Aristotle University of Thessaloniki, 54636 Thessaloniki, Greece
3
Department of Endocrinology, 424 General Military Training Hospital, 56429 Thessaloniki, Greece
*
Author to whom correspondence should be addressed.
Livers 2026, 6(3), 53; https://doi.org/10.3390/livers6030053
Submission received: 5 January 2026 / Revised: 14 March 2026 / Accepted: 9 May 2026 / Published: 16 June 2026

Abstract

Background/Objectives: Metabolic dysfunction-associated steatotic liver disease (MASLD) is the most common chronic liver disease. Accurate staging of hepatic fibrosis is pivotal for risk stratification; however, ultrasonography (US)-based elastography techniques may yield variable results across various technologies and manufacturers. The present study aimed to assess the concordance of liver stiffness (LS) measurements between two different US elastography technologies and manufacturers in patients with MASLD. Methods: This cross-sectional study included 68 postmenopausal women with MASLD. LS was measured using two-dimensional shear wave elastography (2D-SWE) on a LOGIQ™ E10 device and both 2D-SWE and point SWE (pSWE) on an Acuson Sequoia device. Hepatic steatosis was quantified using the ultrasound-guided attenuation parameter (UGAP). Results: The LS measurements were 5.0 ± 1.3 kPa with 2D-SWE on LOGIQ™ E10, 4.3 ± 1.5 kPa with 2D-SWE on Acuson Sequoia, and 3.8 ± 0.8 kPa with pSWE on Acuson Sequoia. A significant, but low correlation was found between LOGIQ™ E10 2D-SWE and Acuson Sequoia pSWE (rs = 0.25, p = 0.045), and a moderate correlation between Acuson Sequoia 2D-SWE and pSWE (rs = 0.37, p = 0.002). No correlation was shown for 2D-SWE between the two different manufacturers. Bland–Altman analysis showed moderate-to-poor agreement of LS values between the three different US elastography techniques. Conclusions: LS measurements differed across US elastography technologies and manufacturers in postmenopausal women with early-stage MASLD. These findings highlight the need to standardize existing US elastography devices before elastography-derived LS can be applied interchangeably in MASLD diagnostic algorithms.

1. Introduction

Metabolic dysfunction-associated steatotic liver disease (MASLD), previously known as nonalcoholic fatty liver disease (NAFLD), is regarded as the most common chronic liver disease globally, affecting approximately 30% of the population and being closely linked to the epidemics of obesity and type 2 diabetes mellitus (T2DM) [1]. A significant proportion of patients with MASLD (~20%) will progress to metabolic dysfunction-associated steatohepatitis (MASH) in the long-term, which increases the risk of developing hepatic fibrosis, a key determinant of prognosis in patients with MASLD [2]. Of note, advanced fibrosis (stages F3–F4) has been consistently associated with a higher risk of liver-related events (decompensation of cirrhosis, hepatocellular carcinoma), major cardiovascular events (myocardial infarction, ischemic stroke, peripheral arterial disease), chronic kidney disease, extra-gastrointestinal malignancies, and mortality [3,4,5]. Accurate assessment of fibrosis is, therefore, essential for identifying individuals at risk of advanced liver disease.
While liver biopsy remains the gold standard for fibrosis staging, it is invasive, prone to sampling error, and has considerable intra- and inter-observer variability. Non-invasive tests (NITs) are considered acceptable alternatives to liver biopsy, providing largely reliable and repeatable results, without the risk of adverse events observed after liver biopsy in a minority of patients [6]. Therefore, NITs, being blood-based, imaging-based, or combined blood- and imaging-based, are recommended by major scientific societies, including the American Association for the Study of Liver Diseases (AASLD) and the European Association for the Study of the Liver (EASL) [7,8]. In this regard, ultrasonography (US)-based elastography techniques are extensively used in MASLD clinical practice to provide non-invasive and reproducible measurements of liver stiffness (LS), which correlates with histologically-confirmed hepatic fibrosis [9]. Transient elastography (TE), implemented on a Fibroscan device (Echosens, Paris, France), is the most extensively validated technique for the non-invasive assessment of hepatic fibrosis [10]. However, the region of interest (ROI) is not visualized during the examination. Therefore, artifacts and areas of non-hepatic tissue, such as vessels, cannot be avoided with this method, resulting in relatively high failure rates [11].
In contrast, both point shear wave elastography (pSWE) and two-dimensional shear wave elastography (2D-SWE) use the B-mode guidance of conventional US to select a suitable ROI of the hepatic parenchyma in real-time, before the measurement of LS. This real-time visualization enables the operator to avoid large vessels, bile ducts, and focal lesions, thus focusing on hepatic parenchyma to improve accuracy and minimize the high rate of unreliable results observed with TE [11]. Moreover, 2D-SWE applies a color-coded elastographic map over a wider hepatic parenchymal area than the single-point sampling of pSWE, potentially enhancing measurement reliability [12]. Importantly, both technologies have shown comparable or better diagnostic performance than TE in evaluating hepatic fibrosis [13].
Considering the above, the primary aim of this study was to assess the agreement of LS measurements between two different elastography technologies and manufacturers in patients with MASLD.

2. Materials and Methods

For this cross-sectional study, we recruited consecutive, outpatient postmenopausal women, aged ≥40 years, who visited the Department of Endocrinology at the 424 General Military Training Hospital in Thessaloniki, Greece, from January 2024 to July 2025. Women with presumed MASLD and no other potential cause of liver disease (average alcohol consumption >20 gr/day, drug-induced liver injury, chronic viral hepatitis B or C, autoimmune hepatitis, primary biliary cholangitis, primary sclerosing cholangitis, hemochromatosis, Wilson’s disease, alpha1-antitrypsin deficiency, overlap (mixed) hepatic diseases) were eligible. Hepatic steatosis was initially evaluated with two NITs, i.e., fatty liver index (FLI) ≥ 60 [14] and/or hepatic steatosis index (HSI) ≥ 36 [15]. The study participants were drawn from an ongoing prospective, non-randomized study, evaluating the effect of anti-osteoporotic medications on hepatic steatosis and fibrosis in postmenopausal women with osteoporosis and concomitant MASLD (ClinicalTrials.gov ID: NCT05493761). At baseline, eligible participants were subjected to the measurement of LS using two different elastography technologies: (1) a LOGIQ™ E10 device (GE Healthcare, Chicago, IL, USA), which measures LS with 2D-SWE, with proposed cut-off values of LS > 8.27 kPa for significant fibrosis (F2), LS > 9.40 kPa for advanced fibrosis (F3), and LS > 11.88 kPa for liver cirrhosis (F4); (2) an Acuson Sequoia device (Siemens Healthineers, Erlangen, Germany), which measures LS with both 2D-SWE and pSWE, with proposed cut-off values by the manufacturer of LS > 5 kPa for F2, LS > 7 kPa for F3, and LS > 9 kPa for F4. Hepatic steatosis was also quantified using the ultrasound-guided attenuation parameter (UGAP) on the above-mentioned LOGIQ™ E10 device. UGAP ≥ 0.53, ≥0.60, and ≥0.65 dB/m have been proposed to define steatosis grade 1 (S1), S2, and S3, respectively [16]. All measurements were performed at the Department of Clinical Radiology, AHEPA University Hospital, Aristotle University of Thessaloniki, after fasting for at least 4 h, using the intercostal approach and with suspended breath by the same operator (VR), who is professionally experienced in the use of the technologies. The operator was blinded to the history and all relevant information of the patients.
The main epidemiological characteristics were recorded, and clinical examination was performed on all the participants. Body weight, height, and waist circumference (WC) were measured, and body mass index (BMI) was calculated. Obesity was defined as BMI ≥ 30 kg/m2. Abdominal adiposity was defined as WC ≥ 80 cm. Metabolic Syndrome (MetS) was defined according to the International Diabetes Federation (IDF) consensus [17].
The study protocol was approved by the Scientific Committee of the 424 General Military Training Hospital, Thessaloniki, Greece, and conformed to the ethical guidelines of the Declaration of Helsinki. All patients provided written informed consent before the study initiation.

Statistical Analysis

Continuous variables are presented as mean ± standard deviation (SD) for normally distributed variables or median (interquartile range [IQR]) for non-normally distributed variables. Categorical variables are presented as numbers (percentages). The Shapiro–Wilk test was used to check the normality of the distribution of continuous variables. Correlations among LS measurements obtained by the three different US elastography techniques were evaluated using Spearman’s correlation coefficient (rs). Agreement across the three different US elastography techniques was evaluated using Bland–Altman plots. For each pairwise comparison, the mean of the two measurements (x-axis) was plotted against their difference (y-axis). The mean difference (bias) and the 95% limits of agreement (LoA) were determined. The presence of systemic and proportional bias was assessed by the visual inspection of the plots. Statistical analysis was performed using SPSS 29.0 for Macintosh (SPSS Inc., Chicago, IL, USA). The level of statistical significance was set at p < 0.05 (two-sided) for all tests.

3. Results

Sixty-eight postmenopausal women were included in this study, with an age of 65.5 ± 8.6 years, BMI of 29.0 ± 4.5 kg/m2, and WC of 95 ± 11 cm. A total of 26 (38%) were obese, 37 (54%) had hypertension, 50 (74%) dyslipidemia, 4 (6%) T2DM, and 40 (59%) met the criteria for MetS. The main characteristics of the patients are presented in Table 1.
The LS measurement on the LOGIQ™ E10 device (2D-SWE) was 5 ± 1.3 kPa. Using the predefined cut-offs for 2D-SWE, 66 participants (97%) were classified as F0–F1 (absence or mild fibrosis), and two participants (3%) were classified as F2. The LS measurement on the Acuson Sequoia device (2D-SWE) was 4.3 ± 1.5 kPa. Using the predefined cut-offs for 2D-SWE, 48 participants (71%) were classified as F0–F1, 18 participants (27%) were classified as F2, and 2 participants (3%) were classified as F3. In the latter machine, the LS measurement with the pSWE technique was 3.8 (0.8) kPa; 62 (91%) participants were classified as F0–F1, and 6 (9%) as F2. The UGAP was 0.63 ± 0.07 dB/m [S1: 24 (35%), S2: 16 (24%), S3: 28 (41%)].
There was a significant, but low correlation of LS measurements between 2D-SWE on the LOGIQ™ E10 device and pSWE on the Acuson Sequoia device (rs = 0.25; p = 0.045), and a moderate correlation of LS measurements between 2D-SWE and pSWE on the same Acuson Sequoia device (rs = 0.37, p = 0.002); no correlation was shown for 2D-SWE between the two different devices (rs = 0.13; p = 0.311). The relevant scatterplots of LS values for the different US elastography technologies and manufacturers are depicted in Figure 1.
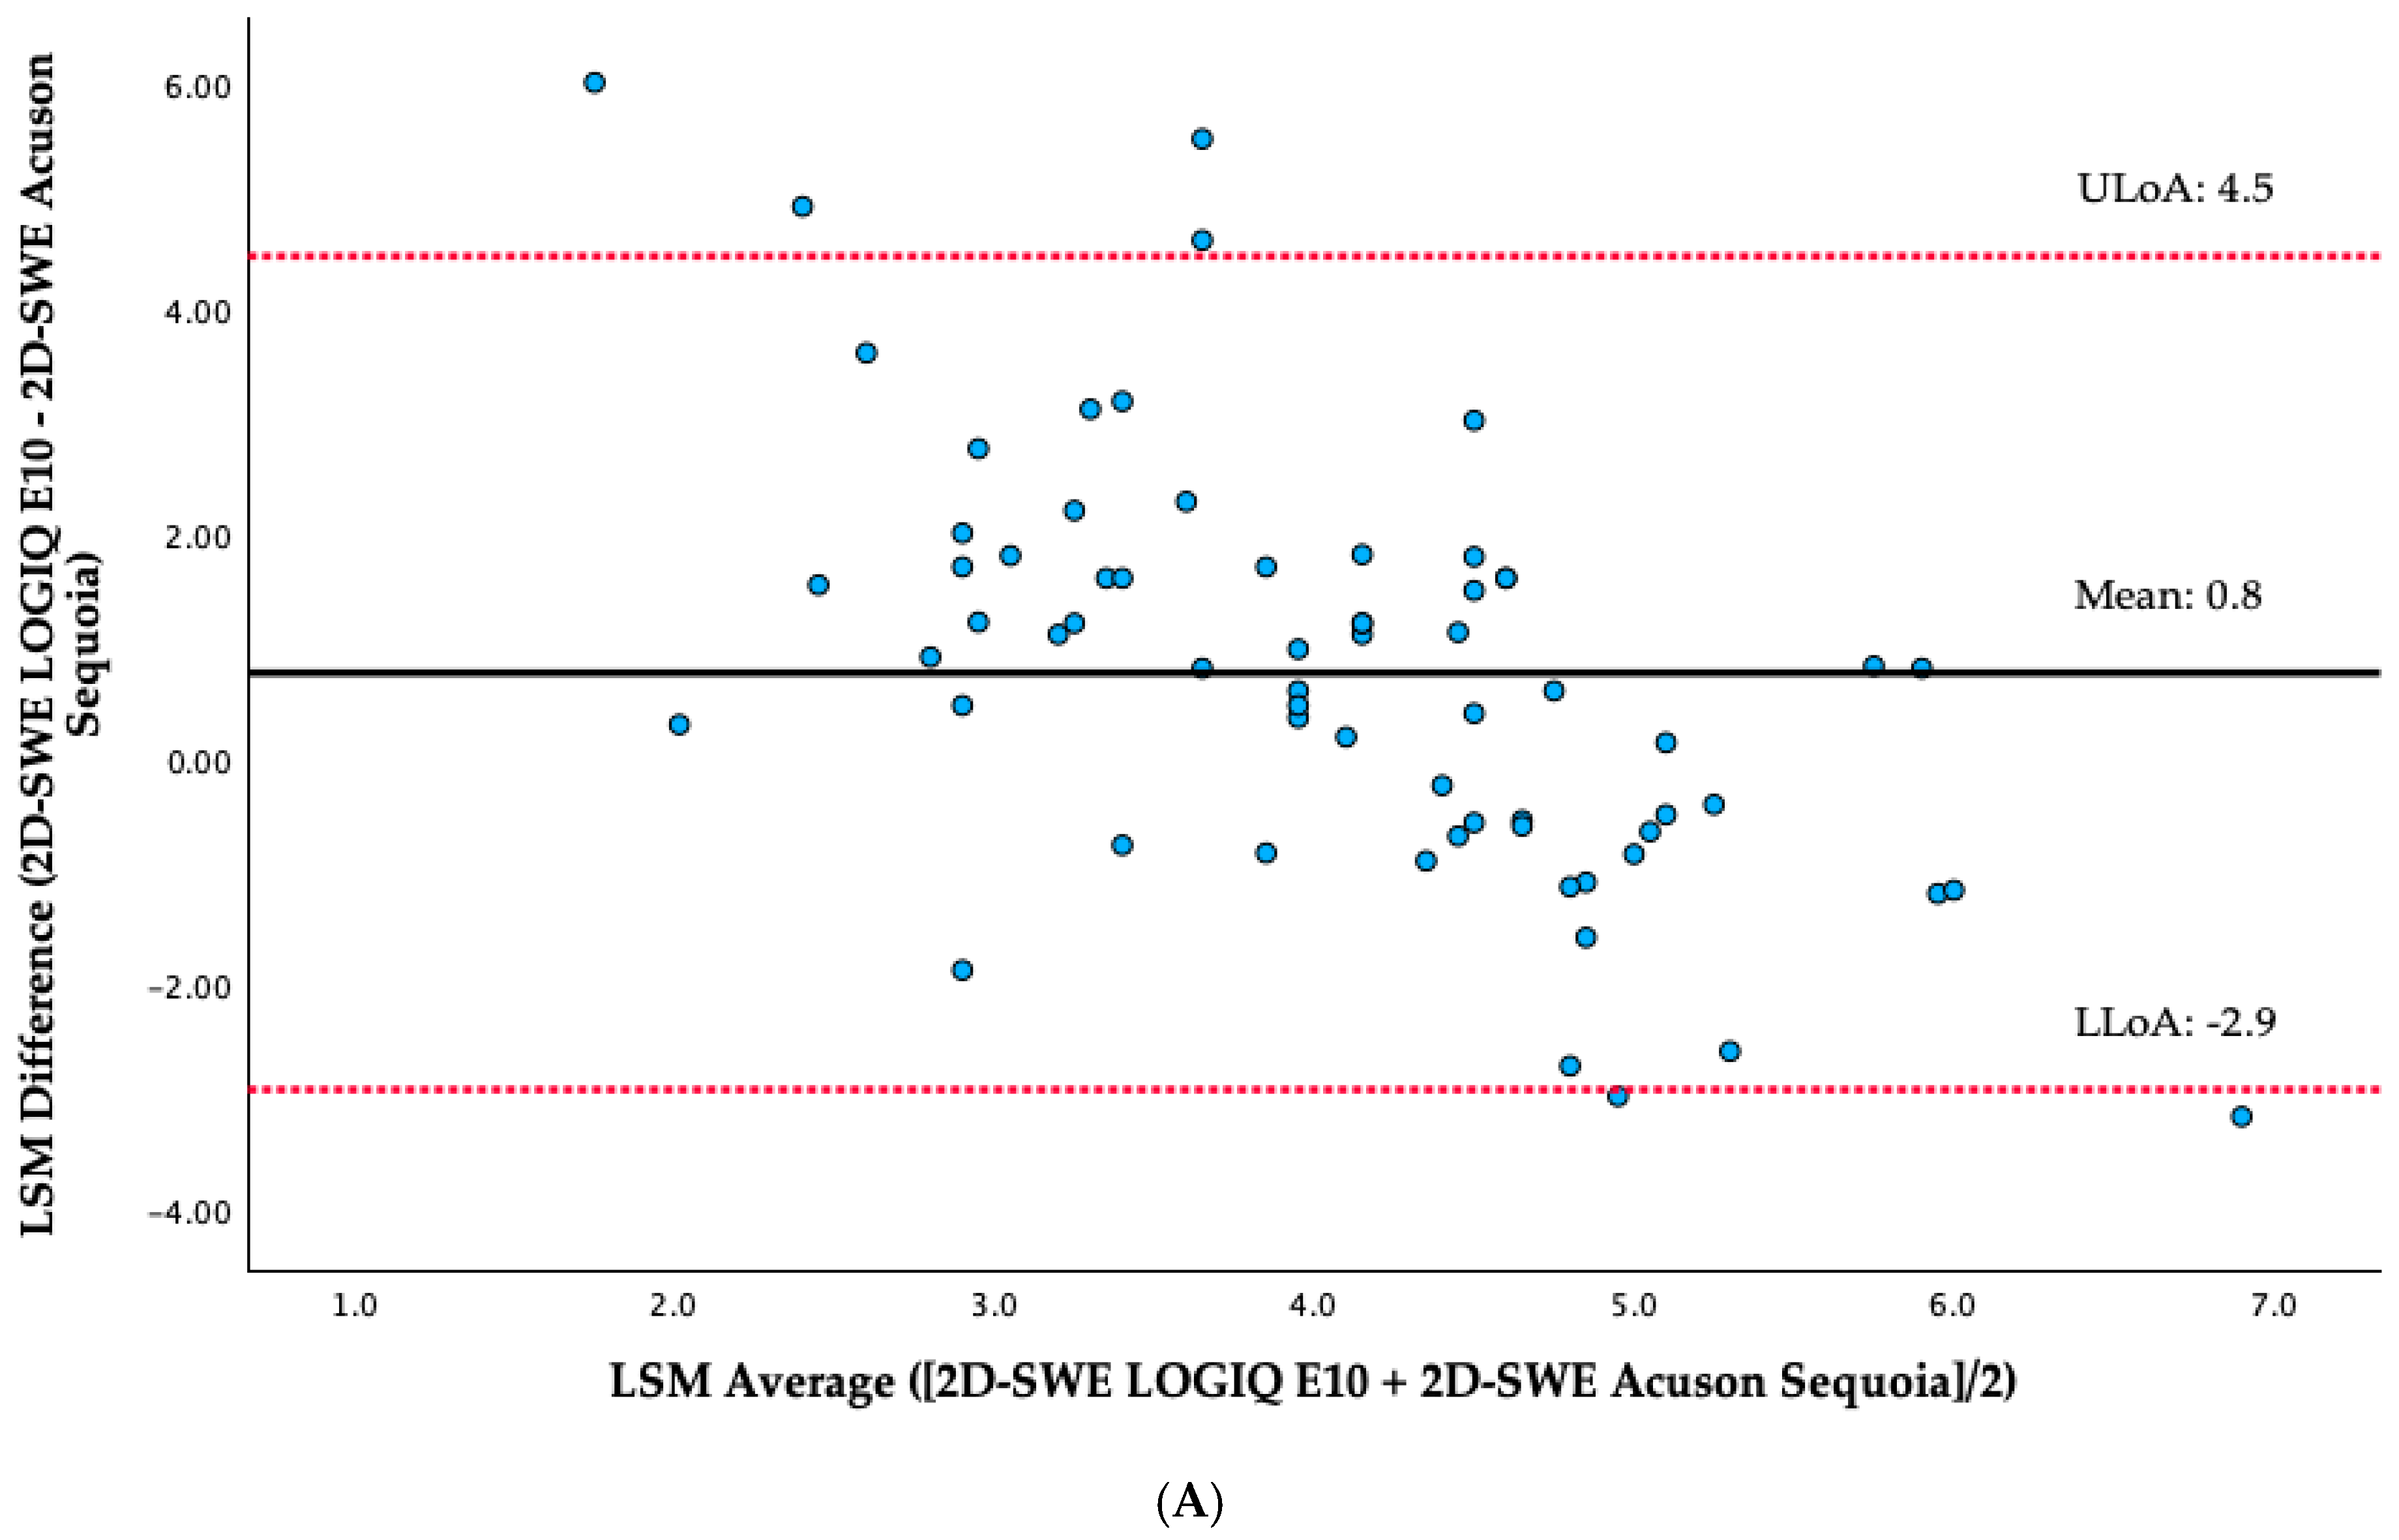
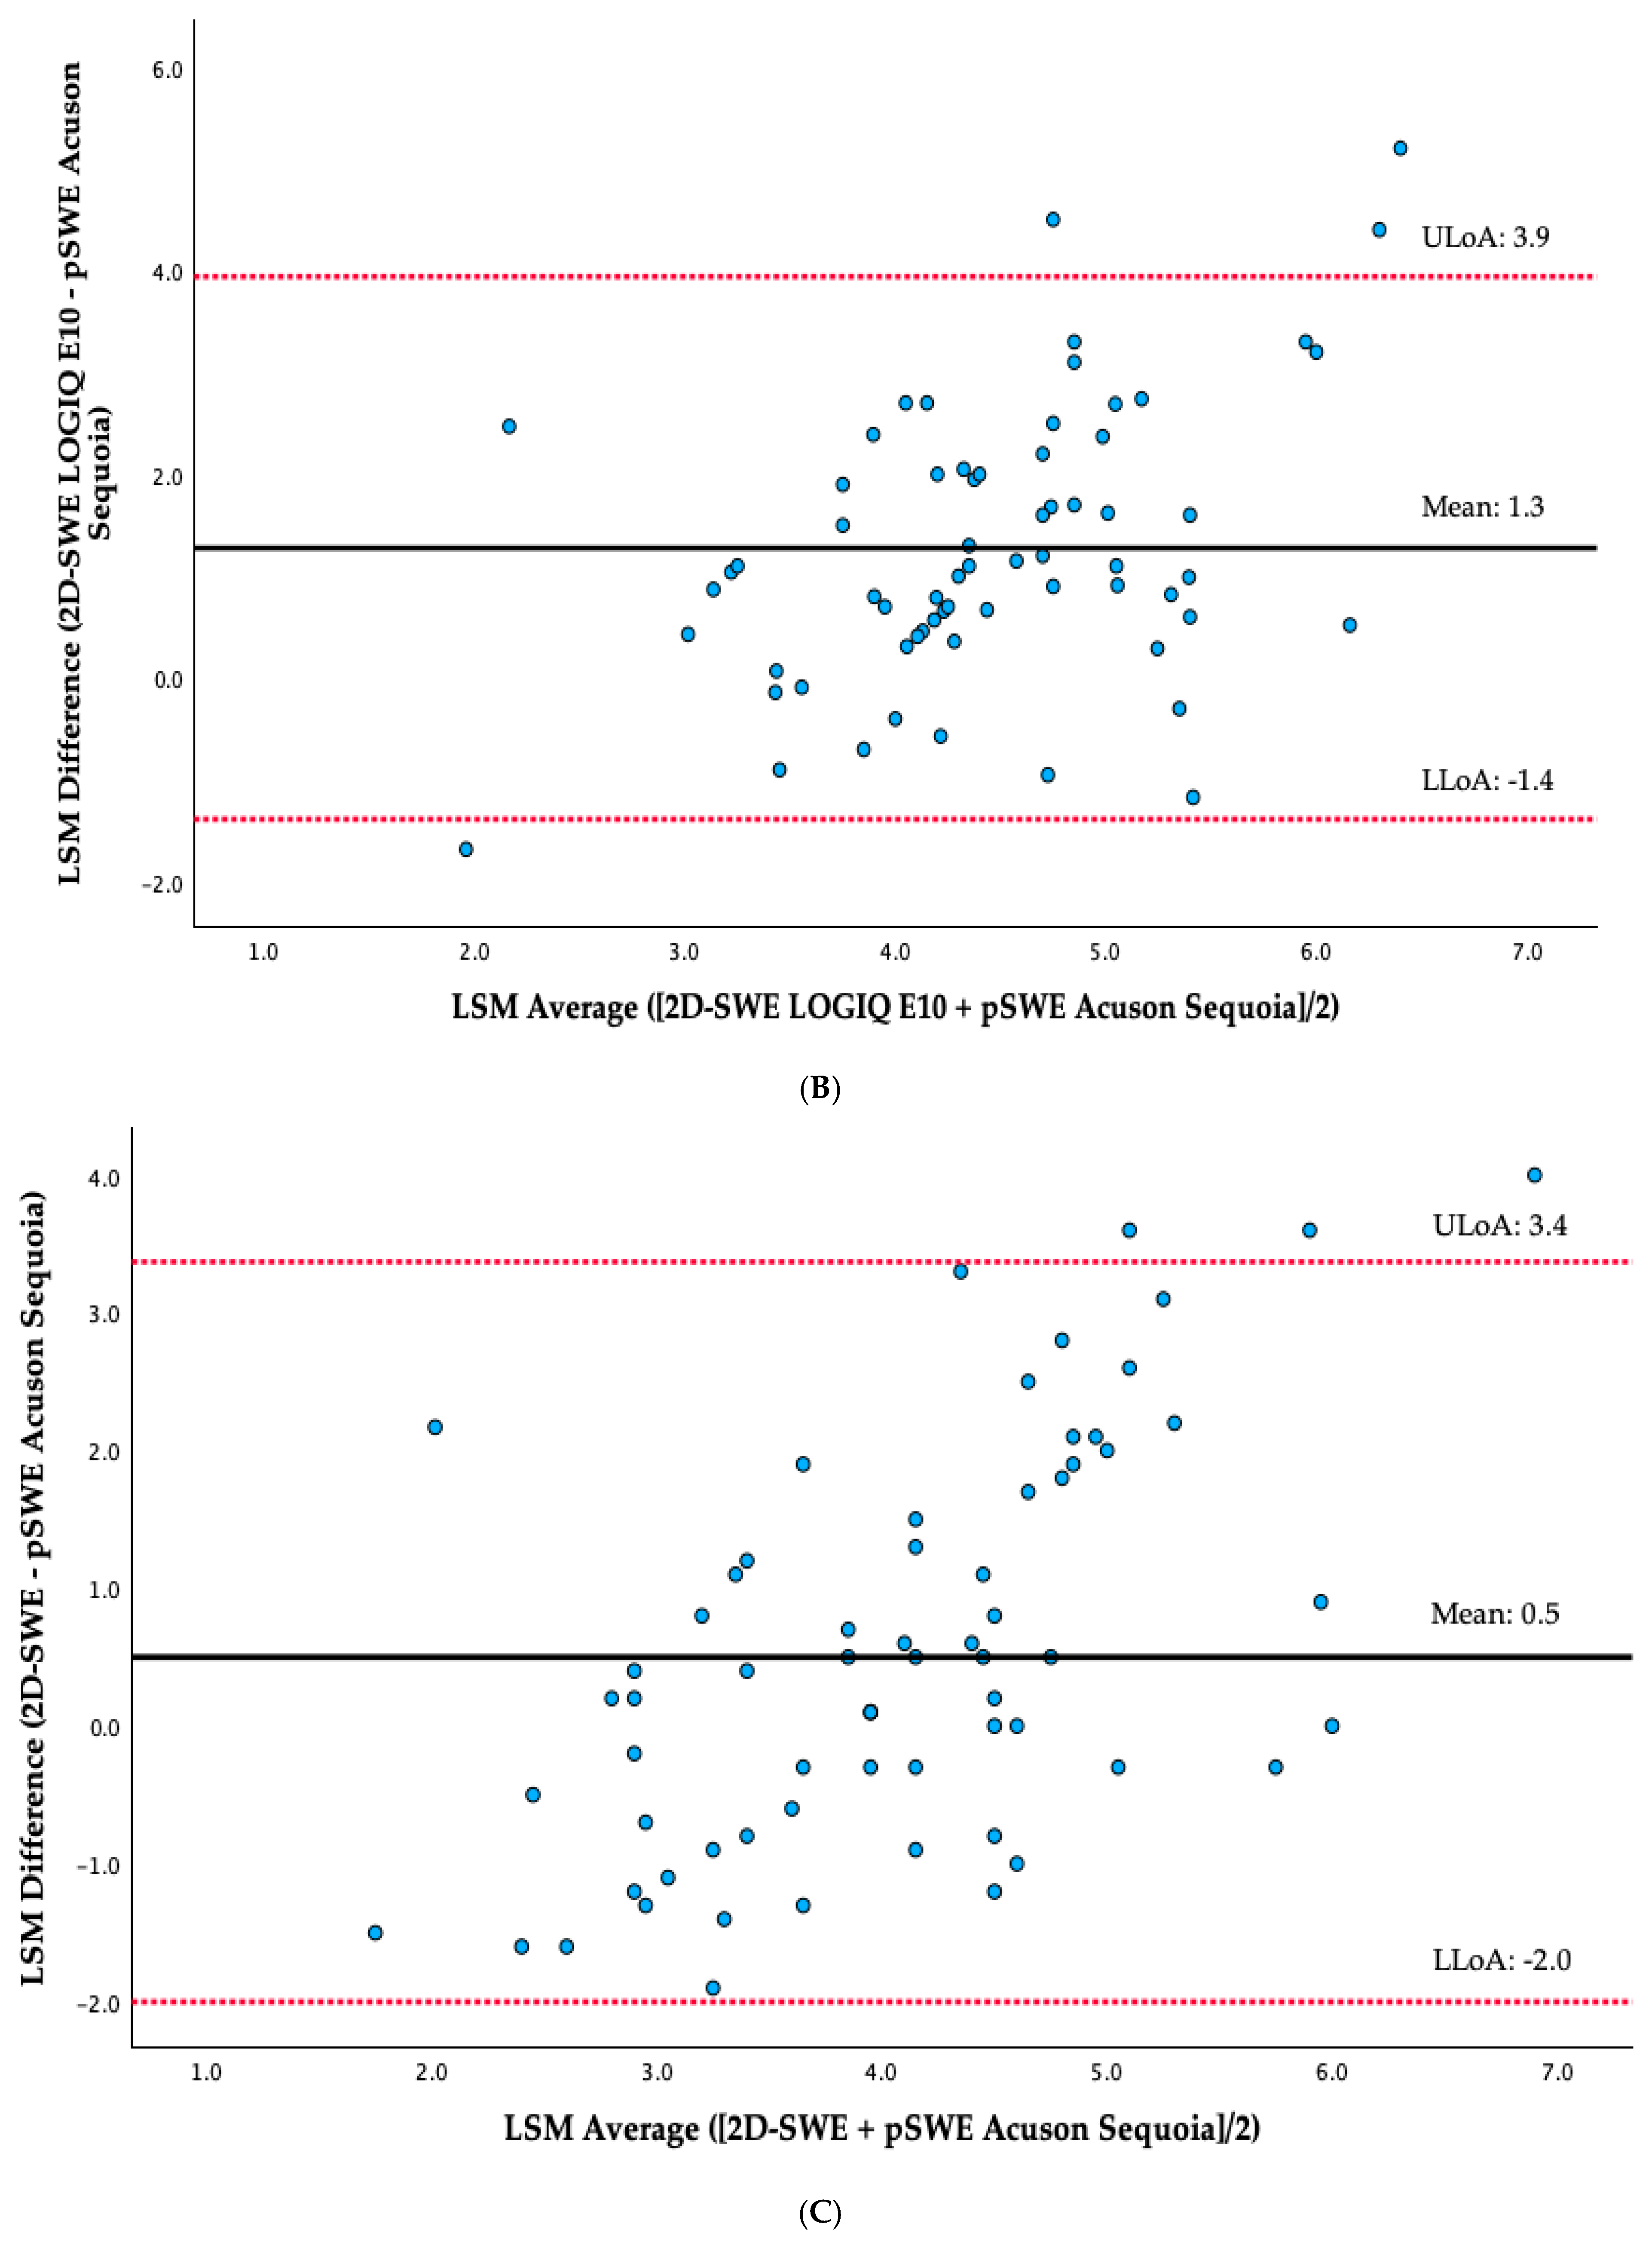
Bland–Altman analysis demonstrated small mean differences (bias) between the elastography techniques, but relatively wide LoA (Figure 2).
For the comparison between 2D-SWE LOGIQ™ E10 and 2D-SWE Acuson Sequoia, the bias was 0.8 kPa, with a 95% LoA ranging from −2.9 to 4.5 kPa. For the comparison between 2D-SWE LOGIQ™ E10 and pSWE Acuson Sequoia, the bias was 1.3 kPa, with 95% LoA ranging from −1.4 to 3.9 kPa. Finally, for the comparison between 2D-SWE and pSWE on Acuson Sequoia, the bias was 0.5 kPa, with 95% LoA ranging from −2.0 to 3.4 kPa. Although the bias between techniques was small and close to zero, the relatively wide LoA indicates moderate-to-poor agreement and suggests that the methods cannot be used interchangeably for individual patient monitoring.
UGAP was positively correlated with LS measurement on the same machine (2D-SWE with LOGIQ™ E10 device) (rs = 0.25; p = 0.041), whereas negatively correlated with LS measurement using pSWE with Acuson Sequoia device (rs = −0.25; p = 0.038); no correlation was shown between UGAP and LS measurement using 2D-SWE with Acuson Sequoia device (rs = −0.04; p = 0.756).

4. Discussion

This cross-sectional study directly compared LS measurements obtained with two different US elastography technologies from different manufacturers in postmenopausal women with early-stage MASLD. We demonstrated low-to-moderate agreement in LS values between 2D-SWE on the LOGIQ™ E10 device and 2D-SWE and pSWE on the Acuson Sequoia device, highlighting the variability of elastography measurements across different US systems.
Prior studies have reported variability in LS measurements obtained from different US-based systems that employ 2D-SWE or pSWE compared with TE, particularly in cohorts with chronic hepatitis C, rather than MASLD [18,19]. Notably, differences in LS measurements across systems have been reported to exceed 2 kPa. Therefore, cut-off values for staging hepatic fibrosis with SWE may not be interchangeable across different US systems [19]. Accordingly, this study showed moderate agreement of LS values between 2D-SWE and pSWE (both on Acuson Sequoia device), and moderate-to-poor agreement of LS values between 2D-SWE (LOGIQ™ E10 device) and pSWE (Acuson Sequoia device), as well as between 2D-SWE (LOGIQ™ E10 device) and 2D-SWE (Acuson Sequoia device), reinforcing that LS measurements may differ depending on the device and the underlying technology used to generate shear waves. For example, the LOGIQ™ E10 device uses a comb-Push excitation mode with real-time visualization of elasticity, whereas the Acuson Sequoia device uses Virtual Touch elastography with an acoustic radiation force impulse technique and a single-frame acquisition, which may explain the lack of correlation between the two 2D-SWE technologies. Among the two US elastography techniques (2D-SWE vs. pSWE), 2D-SWE was shown to have higher sensitivity than pSWE for staging significant and advanced hepatic fibrosis [20].
The positive correlation of UGAP with LS (2D-SWE) on the LOGIQ™ E10 device and the negative correlation with LS (pSWE) on the Acuson Sequoia device is intriguing. Although the design of this study cannot provide a secure explanation for these seemingly conflicting results, they may be attributed to the potentially confounding effect of hepatic steatosis on shear wave propagation, which may differ across devices. However, these conflicting correlations might also have been incidental findings, requiring external validation.
The present study has certain limitations. First, the sample size was relatively small and restricted to postmenopausal women with presumed early MASLD (the majority of participants had F0–F1), limiting the applicability of the findings to patients with more advanced MASLD. Second, liver biopsy was not performed; thus, fibrosis staging was based only on the predefined LS cut-offs from the literature. Third, the percentage of patients with F ≥ 2 was very low; therefore, the correlation among different technologies in advanced disease cannot be shown in this study. Fourth, we included only postmenopausal women; therefore, our findings need to be validated in premenopausal women and men with MASLD. Therefore, our results cannot be generalized in premenopausal women or men, or patients with moderate or advanced fibrosis; thus, this study may be considered as hypothesis-generating, requiring external validation by other studies with different populations, especially with more advanced disease.
Despite these limitations, our findings may have relevant clinical implications. LS measurement is recommended as a second step in the diagnostic algorithm for patients with MASLD and increased or intermediate values of NITs of fibrosis, such as Fibrosis-4 (FIB-4) [7]. However, the present study raises a critical issue: existing US elastography devices need standardization, as their limited agreement may lead to misclassification of patients with MASLD. To date, given the lack of agreement between different devices and the pitfalls of LS measured by TE [11,21], clinicians should be cautious when interpreting LS results. Given the well-known inherent technological differences between different elastography technologies and the variability demonstrated in the present study, our findings underscore the challenges of directly comparing LS measurements across different techniques and manufacturers. Our results highlight the need for larger, possibly multicenter studies with mixed populations to evaluate inter-system variability in patients with MASLD, including those with more advanced fibrosis stages, which are more clinically relevant. Such studies may support future efforts towards the harmonization of measurement protocols and the development of validated conversion equations for LS measurements obtained from different US-based elastography technologies. Until then, it is advisable that patients with MASLD be consistently followed up, when necessary, using the same technique and manufacturer.

Author Contributions

Conceptualization and Design, I.D.V. and S.A.P. Data collection, I.D.V., V.R., A.D.A., and N.P. Data analysis, I.D.V. and S.A.P. Writing—Original Draft Preparation, I.D.V. Writing—Review & Editing, V.R., A.D.A., S.A.P. Supervision, S.A.P. All authors have read and agreed to the published version of the manuscript.

Funding

This research received no external funding.

Institutional Review Board Statement

This study was performed in line with the principles of the Declaration of Helsinki. Approval was granted by the Scientific Committee of the 424 General Military Training Hospital, Thessaloniki, Greece (approval code: 23/24 Mαρ 21/424ΓΣΝΕ/ΔΤΕΕΟΕ; approval date: 24 March 2021).

Informed Consent Statement

Informed consent was obtained from all subjects involved in the study.

Data Availability Statement

The data presented in this study are available on request from the corresponding author.

Conflicts of Interest

The authors declare no conflicts of interest.

References

  1. Younossi, Z.M.; Kalligeros, M.; Henry, L. Epidemiology of Metabolic Dysfunction-Associated Steatotic Liver Disease. Clin. Mol. Hepatol. 2025, 31, S32–S50. [Google Scholar] [CrossRef] [Scilit]
  2. Seo, Y.-G.; Polyzos, S.A.; Park, K.-H.; Mantzoros, C.S. Fibrosis-4 Index Predicts Long-Term All-Cause, Cardiovascular and Liver-Related Mortality in the Adult Korean Population. Clin. Gastroenterol. Hepatol. 2023, 21, 3322–3335. [Google Scholar] [CrossRef] [Scilit]
  3. Polyzos, S.A.; Kechagias, S.; Tsochatzis, E.A. Review Article: Non-Alcoholic Fatty Liver Disease and Cardiovascular Diseases: Associations and Treatment Considerations. Aliment. Pharmacol. Ther. 2021, 54, 1013–1025. [Google Scholar] [CrossRef] [Scilit]
  4. Polyzos, S.A.; Chrysavgis, L.; Vachliotis, I.D.; Chartampilas, E.; Cholongitas, E. Nonalcoholic Fatty Liver Disease and Hepatocellular Carcinoma: Insights in Epidemiology, Pathogenesis, Imaging, Prevention and Therapy. Semin. Cancer Biol. 2023, 93, 20–35. [Google Scholar] [CrossRef] [Scilit] [PubMed]
  5. Younossi, Z.M.; de Avila, L.; Petta, S.; Hagström, H.; Kim, S.U.; Nakajima, A.; Crespo, J.; Castera, L.; Alkhouri, N.; Zheng, M.-H.; et al. Predictors of Fibrosis, Clinical Events and Mortality in MASLD: Data from the Global-MASLD Study. Hepatology 2025. [Google Scholar] [CrossRef] [Scilit]
  6. Kouvari, M.; Valenzuela-Vallejo, L.; Guatibonza-Garcia, V.; Polyzos, S.A.; Deng, Y.; Kokkorakis, M.; Agraz, M.; Mylonakis, S.C.; Katsarou, A.; Verrastro, O.; et al. Liver Biopsy-Based Validation, Confirmation and Comparison of the Diagnostic Performance of Established and Novel Non-Invasive Steatotic Liver Disease Indexes: Results from a Large Multi-Center Study. Metabolism 2023, 147, 155666. [Google Scholar] [CrossRef] [Scilit] [PubMed]
  7. European Association for the Study of the Liver (EASL); European Association for the Study of Diabetes (EASD); European Association for the Study of Obesity (EASO); European Association for the Study of the Liver (EASL). EASL-EASD-EASO Clinical Practice Guidelines on the Management of Metabolic Dysfunction-Associated Steatotic Liver Disease (MASLD). J. Hepatol. 2024, 81, 492–542. [Google Scholar] [CrossRef] [Scilit] [PubMed]
  8. Sterling, R.K.; Patel, K.; Duarte-Rojo, A.; Asrani, S.K.; Alsawas, M.; Dranoff, J.A.; Fiel, M.I.; Murad, M.H.; Leung, D.H.; Levine, D.; et al. AASLD Practice Guideline on Blood-Based Noninvasive Liver Disease Assessment of Hepatic Fibrosis and Steatosis. Hepatology 2025, 81, 321–357. [Google Scholar] [CrossRef] [Scilit]
  9. Villani, R.; Lupo, P.; Sangineto, M.; Romano, A.D.; Serviddio, G. Liver Ultrasound Elastography in Non-Alcoholic Fatty Liver Disease: A State-of-the-Art Summary. Diagnostics 2023, 13, 1236. [Google Scholar] [CrossRef] [Scilit]
  10. Cao, Y.-T.; Xiang, L.-L.; Qi, F.; Zhang, Y.-J.; Chen, Y.; Zhou, X.-Q. Accuracy of Controlled Attenuation Parameter (CAP) and Liver Stiffness Measurement (LSM) for Assessing Steatosis and Fibrosis in Non-Alcoholic Fatty Liver Disease: A Systematic Review and Meta-Analysis. EClinicalMedicine 2022, 51, 101547. [Google Scholar] [CrossRef] [Scilit]
  11. Castéra, L.; Foucher, J.; Bernard, P.-H.; Carvalho, F.; Allaix, D.; Merrouche, W.; Couzigou, P.; de Lédinghen, V. Pitfalls of Liver Stiffness Measurement: A 5-Year Prospective Study of 13,369 Examinations. Hepatology 2010, 51, 828–835. [Google Scholar] [CrossRef] [Scilit]
  12. Yoo, J.; Lee, J.M.; Joo, I.; Yoon, J.H. Assessment of Liver Fibrosis Using 2-Dimensional Shear Wave Elastography: A Prospective Study of Intra- and Inter-Observer Repeatability and Comparison with Point Shear Wave Elastography. Ultrasonography 2020, 39, 52–59. [Google Scholar] [CrossRef] [Scilit]
  13. Friedrich-Rust, M.; Poynard, T.; Castera, L. Critical Comparison of Elastography Methods to Assess Chronic Liver Disease. Nat. Rev. Gastroenterol. Hepatol. 2016, 13, 402–411. [Google Scholar] [CrossRef] [Scilit]
  14. Bedogni, G.; Bellentani, S.; Miglioli, L.; Masutti, F.; Passalacqua, M.; Castiglione, A.; Tiribelli, C. The Fatty Liver Index: A Simple and Accurate Predictor of Hepatic Steatosis in the General Population. BMC Gastroenterol. 2006, 6, 33. [Google Scholar] [CrossRef] [Scilit] [PubMed]
  15. Lee, J.-H.; Kim, D.; Kim, H.J.; Lee, C.-H.; Yang, J.I.; Kim, W.; Kim, Y.J.; Yoon, J.-H.; Cho, S.-H.; Sung, M.-W.; et al. Hepatic Steatosis Index: A Simple Screening Tool Reflecting Nonalcoholic Fatty Liver Disease. Dig. Liver Dis. 2010, 42, 503–508. [Google Scholar] [CrossRef] [Scilit]
  16. Fujiwara, Y.; Kuroda, H.; Abe, T.; Ishida, K.; Oguri, T.; Noguchi, S.; Sugai, T.; Kamiyama, N.; Takikawa, Y. The B-Mode Image-Guided Ultrasound Attenuation Parameter Accurately Detects Hepatic Steatosis in Chronic Liver Disease. Ultrasound Med. Biol. 2018, 44, 2223–2232. [Google Scholar] [CrossRef] [Scilit]
  17. Alberti, K.G.M.M.; Zimmet, P.; Shaw, J. Metabolic Syndrome—A New World-Wide Definition. A Consensus Statement from the International Diabetes Federation. Diabet. Med. 2006, 23, 469–480. [Google Scholar] [CrossRef] [Scilit] [PubMed]
  18. Piscaglia, F.; Salvatore, V.; Mulazzani, L.; Cantisani, V.; Colecchia, A.; Di Donato, R.; Felicani, C.; Ferrarini, A.; Gamal, N.; Grasso, V.; et al. Differences in Liver Stiffness Values Obtained with New Ultrasound Elastography Machines and Fibroscan: A Comparative Study. Dig. Liver Dis. 2017, 49, 802–808. [Google Scholar] [CrossRef] [Scilit]
  19. Ferraioli, G.; De Silvestri, A.; Lissandrin, R.; Maiocchi, L.; Tinelli, C.; Filice, C.; Barr, R.G. Evaluation of Inter-System Variability in Liver Stiffness Measurements. Ultraschall Med. 2019, 40, 64–75. [Google Scholar] [CrossRef] [Scilit] [PubMed]
  20. Zhou, X.; Rao, J.; Wu, X.; Deng, R.; Ma, Y. Comparison of 2-D Shear Wave Elastography and Point Shear Wave Elastography for Assessing Liver Fibrosis. Ultrasound Med. Biol. 2021, 47, 408–427. [Google Scholar] [CrossRef] [Scilit]
  21. Facciorusso, A.; Del Prete, V.; Turco, A.; Buccino, R.V.; Nacchiero, M.C.; Muscatiello, N. Long-Term Liver Stiffness Assessment in Hepatitis C Virus Patients Undergoing Antiviral Therapy: Results from a 5-Year Cohort Study. J. Gastroenterol. Hepatol. 2018, 33, 942–949. [Google Scholar] [CrossRef] [Scilit] [PubMed]
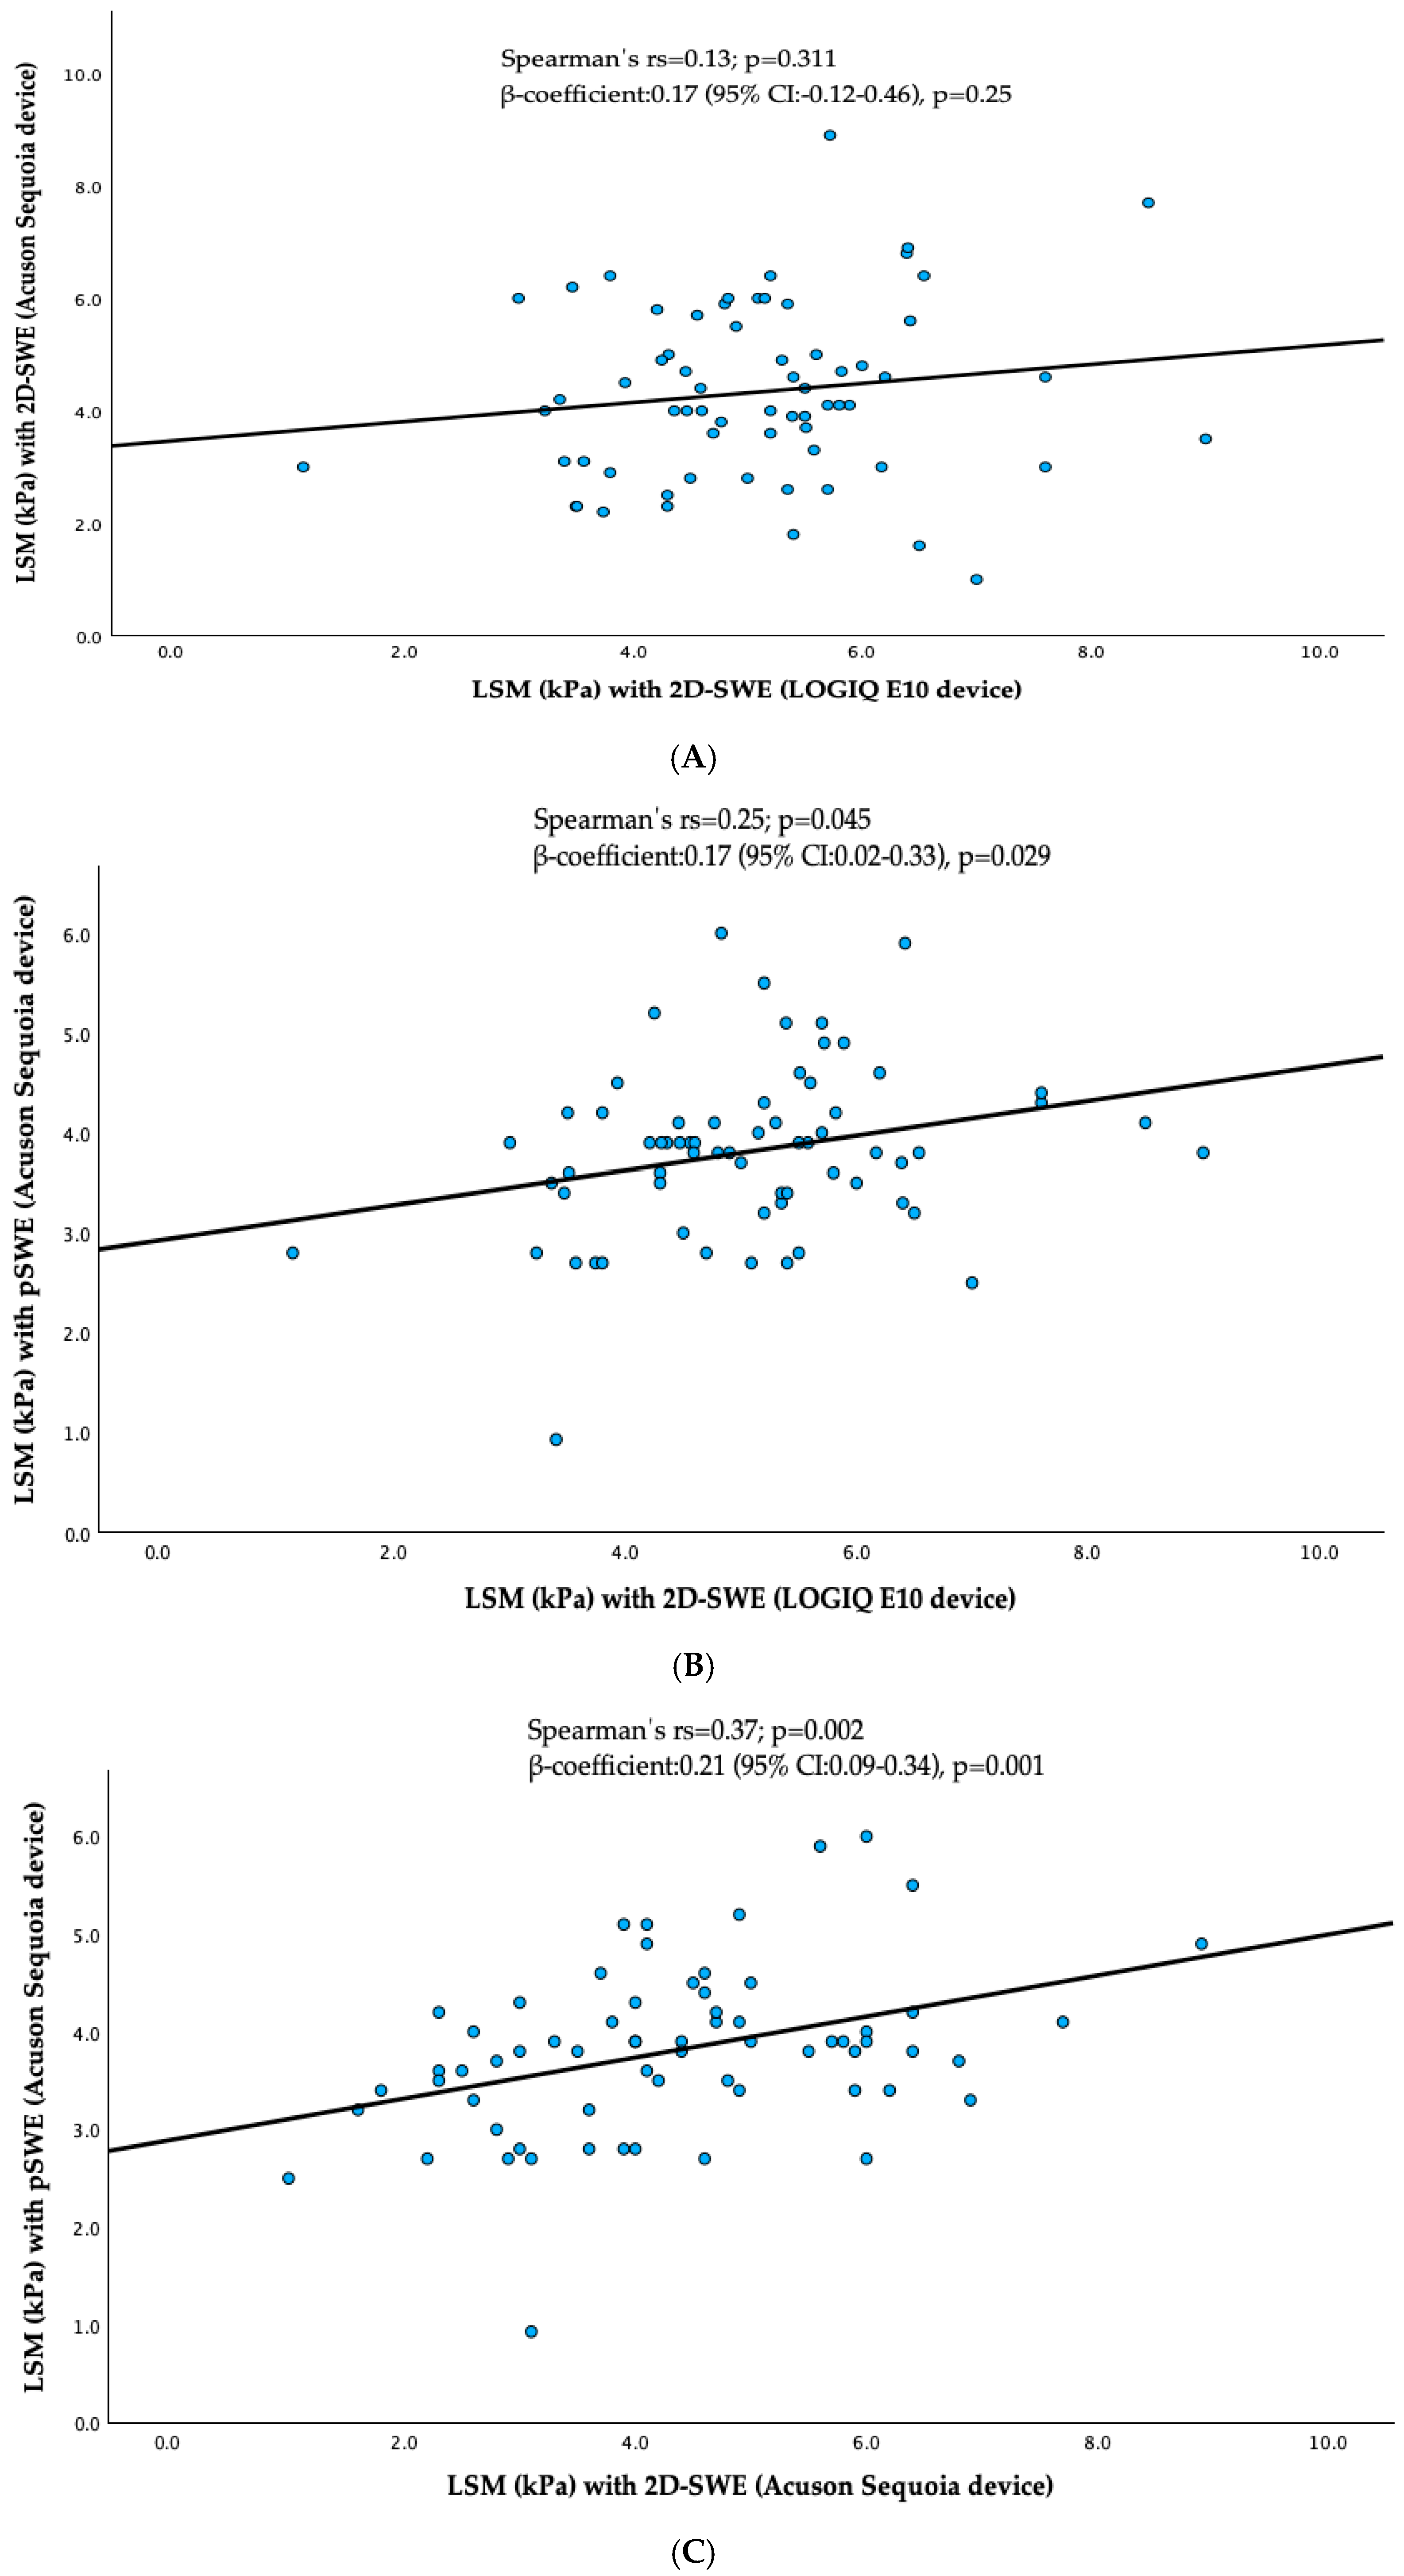
Figure 1. Scatterplots of LS measurements between different US elastography techniques and manufacturers. (A) No correlation for 2D-SWE between LOGIQ™ E10 and Acuson Sequoia device. (B) Low correlation of LS measurements between 2D-SWE on the LOGIQ™ E10 device and pSWE on the Acuson Sequoia device. (C) Moderate correlation of LS measurements between 2D-SWE and pSWE on the same Acuson Sequoia device. Spearman’s rs and linear regression β-coefficient with 95% Confidence Intervals (CI) are shown.
Livers 06 00053 g001
Figure 2. Bland–Altman analysis showing agreement between the different US elastography techniques and manufacturers. The x-axis represents the mean and the y-axis represents the difference of LS measurements obtained with two different methods in each plot. The solid central line represents the mean difference (bias) between the two methods, while the upper and lower horizontal dashed red lines indicate the 95% limits of agreement (LoA). (A) Bland–Altman plot for agreement between 2D-SWE on LOGIQ™ E10 and on Acuson Sequoia. There is a moderate positive bias (mean = 0.8 kPa). LoA range from −2.9 to 4.5 kPa, indicating considerable variability between the two methods (moderate to poor agreement). (B) Bland–Altman plot for agreement between 2D-SWE on LOGIQ™ E10 and pSWE on Acuson Sequoia. There is a positive bias (mean = 1.3 kPa). LoA range from −1.4 to 3.9 kPa, indicating moderate to poor agreement between the two methods. (C) Bland–Altman plot for agreement between 2D-SWE and pSWE on Acuson Sequoia. There is a small bias (mean = 0.5 kPa). LoA range from −2 to 3.4 kPa, indicating a moderate agreement between the two methods.
Livers 06 00053 g002aLivers 06 00053 g002b
Table 1. Main characteristics of the study participants.
Main Characteristics
Age (years)65.5 ± 8.6
BMI (kg/m2)29.0 ± 4.5
WC (cm)95 ± 11
Obesity26 (38%)
Hypertension37 (54%)
Dyslipidemia50 (74%)
T2DM4 (6%)
MetS40 (59%)
UGAP (dB/m)0.63 ± 0.07
LSM by 2D-SWE (kPa; LOGIQ™ E10)5.1 ± 1.3
LSM by 2D-SWE (kPa; Acuson Sequoia)4.3 ± 1.5
LSM by pSWE (kPa; Acuson Sequoia)3.8 (0.8)
Continuous variables are expressed as mean ± SD or median (IQR) values; categorial variables are presented as numbers (%). Abbreviations: BMI, body mass index; LSM, liver stiffness measurement; pSWE, point shear wave elastography; T2DM, type 2 diabetes mellitus, UGAP, ultrasound-guided attenuation parameter; 2D-SWE, two-dimensional shear wave elastography.
Disclaimer/Publisher’s Note: The statements, opinions and data contained in all publications are solely those of the individual author(s) and contributor(s) and not of MDPI and/or the editor(s). MDPI and/or the editor(s) disclaim responsibility for any injury to people or property resulting from any ideas, methods, instructions or products referred to in the content.