Article

Association Between Phase Angle as an Indicator of Sarcopenia and Steatotic Liver Disease in the General Population

1
Department of Gastroenterology, Hematology, and Clinical Immunology, Hirosaki University Graduate School of Medicine, Hirosaki 036-8562, Japan
2
Hirosaki University Graduate School of Medicine and School of Medicine, Hirosaki 036-8562, Japan
3
Division of Endoscopy, Hirosaki University Hospital, Hirosaki 036-8563, Japan
4
Department of Preemptive Medicine, Innovation Center for Health Promotion, Hirosaki University Graduate School of Medicine, Hirosaki 036-8562, Japan
5
Research Institute of Health Innovation, Hirosaki University, Hirosaki 036-8562, Japan
*
Author to whom correspondence should be addressed.
Livers 2026, 6(3), 51; https://doi.org/10.3390/livers6030051
Submission received: 20 March 2026 / Revised: 24 May 2026 / Accepted: 5 June 2026 / Published: 12 June 2026

Abstract

Background: Steatotic liver disease (SLD) and sarcopenia are lifestyle-related conditions for which prevention is critical. The phase angle, which is derived from impedance, reactance, and resistance values obtained via bioelectrical impedance analysis, has emerged as a potential marker of sarcopenia. Additionally, amino acids have been implicated in the pathogenesis of both SLD and sarcopenia. This epidemiological study investigated the association between SLD and sarcopenia in a general population cohort. Methods: This cross-sectional study included 281 participants with metabolic dysfunction-associated steatotic liver disease (MASLD), 72 with metabolic alcohol-associated liver disease (MetALD), and 54 with alcohol-associated liver disease (ALD). Associations between phase angle, Mac-2-binding protein glycosylation isomer (M2BPGi) as a marker of liver fibrosis, and serum amino acid levels were analyzed. Results: The phase angle was significantly higher in the MetALD group than in the MASLD and ALD groups. Multivariate analysis identified MASLD as an independent risk factor for a low phase angle compared with MetALD. M2BPGi levels were lower in MetALD than in MASLD, and M2BPGi showed a negative correlation with the phase angle. Furthermore, MetALD was characterized by lower serine and glutamine levels than MASLD, with serine demonstrating a negative correlation with the phase angle. Conclusions: Although the possibility of residual confounding factors cannot be excluded, the present study suggests that phase angle may serve as a sensitive marker for the early decline in muscle mass in patients with SLD, comparable to grip strength and skeletal muscle mass index.

1. Introduction

In 2023, a condition formerly referred to as non-alcoholic fatty liver disease (NAFLD) was renamed metabolic dysfunction–associated steatotic liver disease (MASLD) [1]. A diagnosis of MASLD requires the presence of hepatic steatosis together with at least one of the following five cardiometabolic criteria: obesity or central obesity, hyperglycemia or diabetes, hypertension, hypertriglyceridemia, or low high-density lipoprotein (HDL) cholesterol levels. This redefinition reflects growing recognition of MASLD as a lifestyle-related disease. In addition to MASLD, steatotic liver disease (SLD) is currently classified into metabolic alcohol-associated liver disease (MetALD) in moderate alcohol consumers, alcohol-associated liver disease (ALD) in heavy alcohol consumers, specific-etiology SLD, and cryptogenic SLD. MASLD, MetALD, and ALD are lifestyle-related conditions with an increasing prevalence worldwide [2]. Both MetALD and ALD are characterized by the presence of cardiometabolic criteria; however, they are distinguished by the level of alcohol consumption. MetALD is defined by an alcohol intake of 30–60 g/day in males and 20–50 g/day in females, whereas ALD is defined by an alcohol intake of ≥60 g/day in men and ≥50 g/day in women. Among patients with SLD who do not meet the cardiometabolic criteria, cases with identifiable causes, such as medications or monogenic disorders, are classified as specific-etiology SLD, whereas cases without an identifiable cause are classified as cryptogenic SLD [1].
Regardless of etiology, fatty liver disease can progress to cirrhosis. In cirrhosis, sarcopenia develops through multiple mechanisms, including inflammatory cytokine activation, portal hypertension, impaired ammonia detoxification, disrupted glucocorticoid, insulin, and insulin-like growth factor-1 signaling, and alcohol exposure [3]. Sarcopenia frequently coexists with cirrhosis, is associated with complications such as hepatic encephalopathy, and adversely affects prognosis [4]. Accordingly, the Japan Society of Hepatology has established diagnostic criteria for sarcopenia based on grip strength and muscle mass measurements obtained by bioelectrical impedance analysis (BIA) and computed tomography, and advocates active therapeutic intervention through nutritional therapy centered on branched-chain amino acids and polyunsaturated fatty acids in combination with rehabilitation [5]. In addition, sarcopenia also encompasses age-related muscle loss, underscoring the importance of early prevention.
Prevention is critically important in both SLD and sarcopenia; however, epidemiological studies addressing these conditions from a preventive perspective are limited. One reason for this is that conventional sarcopenia assessments involving grip strength and skeletal muscle mass show minimal changes in the early stages and are therefore difficult to evaluate before substantial disease progression. Consequently, indicators capable of detecting early muscle mass reduction are required.
The phase angle is calculated using the impedance, reactance, and resistance values obtained using BIA. It is used to assess cellular integrity and fluid balance, and has been reported to be useful for diagnosing sarcopenia and predicting prognosis [6]. However, only a limited number of studies have examined the relationship between liver disease and the phase angle. In patients with liver cirrhosis, a low phase angle has been reported to be associated with reduced survival, and phase angle has been identified as an independent prognostic predictor of mortality that is not influenced by the presence of ascites [7,8]. Furthermore, phase angle has been reported to provide a simple and accurate assessment of nutritional status in patients with liver cirrhosis [9]. Although previous studies have primarily focused on patients with advanced liver cirrhosis, few studies have investigated the relationship between phase angle and sarcopenia in patients with SLD who have not progressed to cirrhosis.
Mac-2 binding protein glycosylation isomer (M2BPGi) is a relatively novel biomarker of liver fibrosis that detects alterations in glycan structures on proteins associated with fibrosis progression [10]. Mac-2 binding protein (M2BP) exists in the bloodstream as a glycosylated multimeric protein; however, as fibrosis progresses, aberrant glycan structures become increasingly prevalent. M2BPGi utilizes a lectin that specifically binds to these altered glycan structures, thereby enabling the detection of subtle glycosylation changes. M2BPGi levels increase significantly in accordance with the progression of fibrosis stage and have been reported to show good concordance with liver biopsy findings [10,11]. Although studies on M2BPGi have primarily focused on patients with liver cirrhosis, epidemiological investigations targeting earlier stages before fibrosis progression are also needed from a preventive perspective.
In patients with cirrhosis, branched-chain amino acid (BCAA) levels decrease, while aromatic amino acid levels increase. SLD, MASLD, and MetALD exhibit distinct amino acid profiles. Moreover, as hepatic fat accumulation increases in MASLD, leucine levels increase, whereas threonine, serine, and glycine levels decrease [12]. Amino acids play critical roles in the synthesis and maintenance of muscle proteins. Several studies have reported that supplementation with leucine-enriched essential amino acids is effective in maintaining and improving muscle strength in older adults [13,14]. In contrast, a systematic review suggested that the efficacy of amino acid supplementation in the treatment of sarcopenia remains inconclusive [15]. Furthermore, although previous studies have largely focused on leucine, the relationship between other amino acids and sarcopenia has not been sufficiently explored. While previous studies have examined the relationship between serum amino acid concentrations and either SLD or sarcopenia, there are no epidemiological studies from a preventive perspective on the impact of serum amino acids on the onset and progression of sarcopenia associated with SLD.
Accordingly, this study aimed to investigate the epidemiology of the association between SLD and sarcopenia in healthy residents of a local community, focusing on the phase angle, liver fibrosis, and serum amino acid profiles.

2. Materials and Methods

2.1. Study Subjects

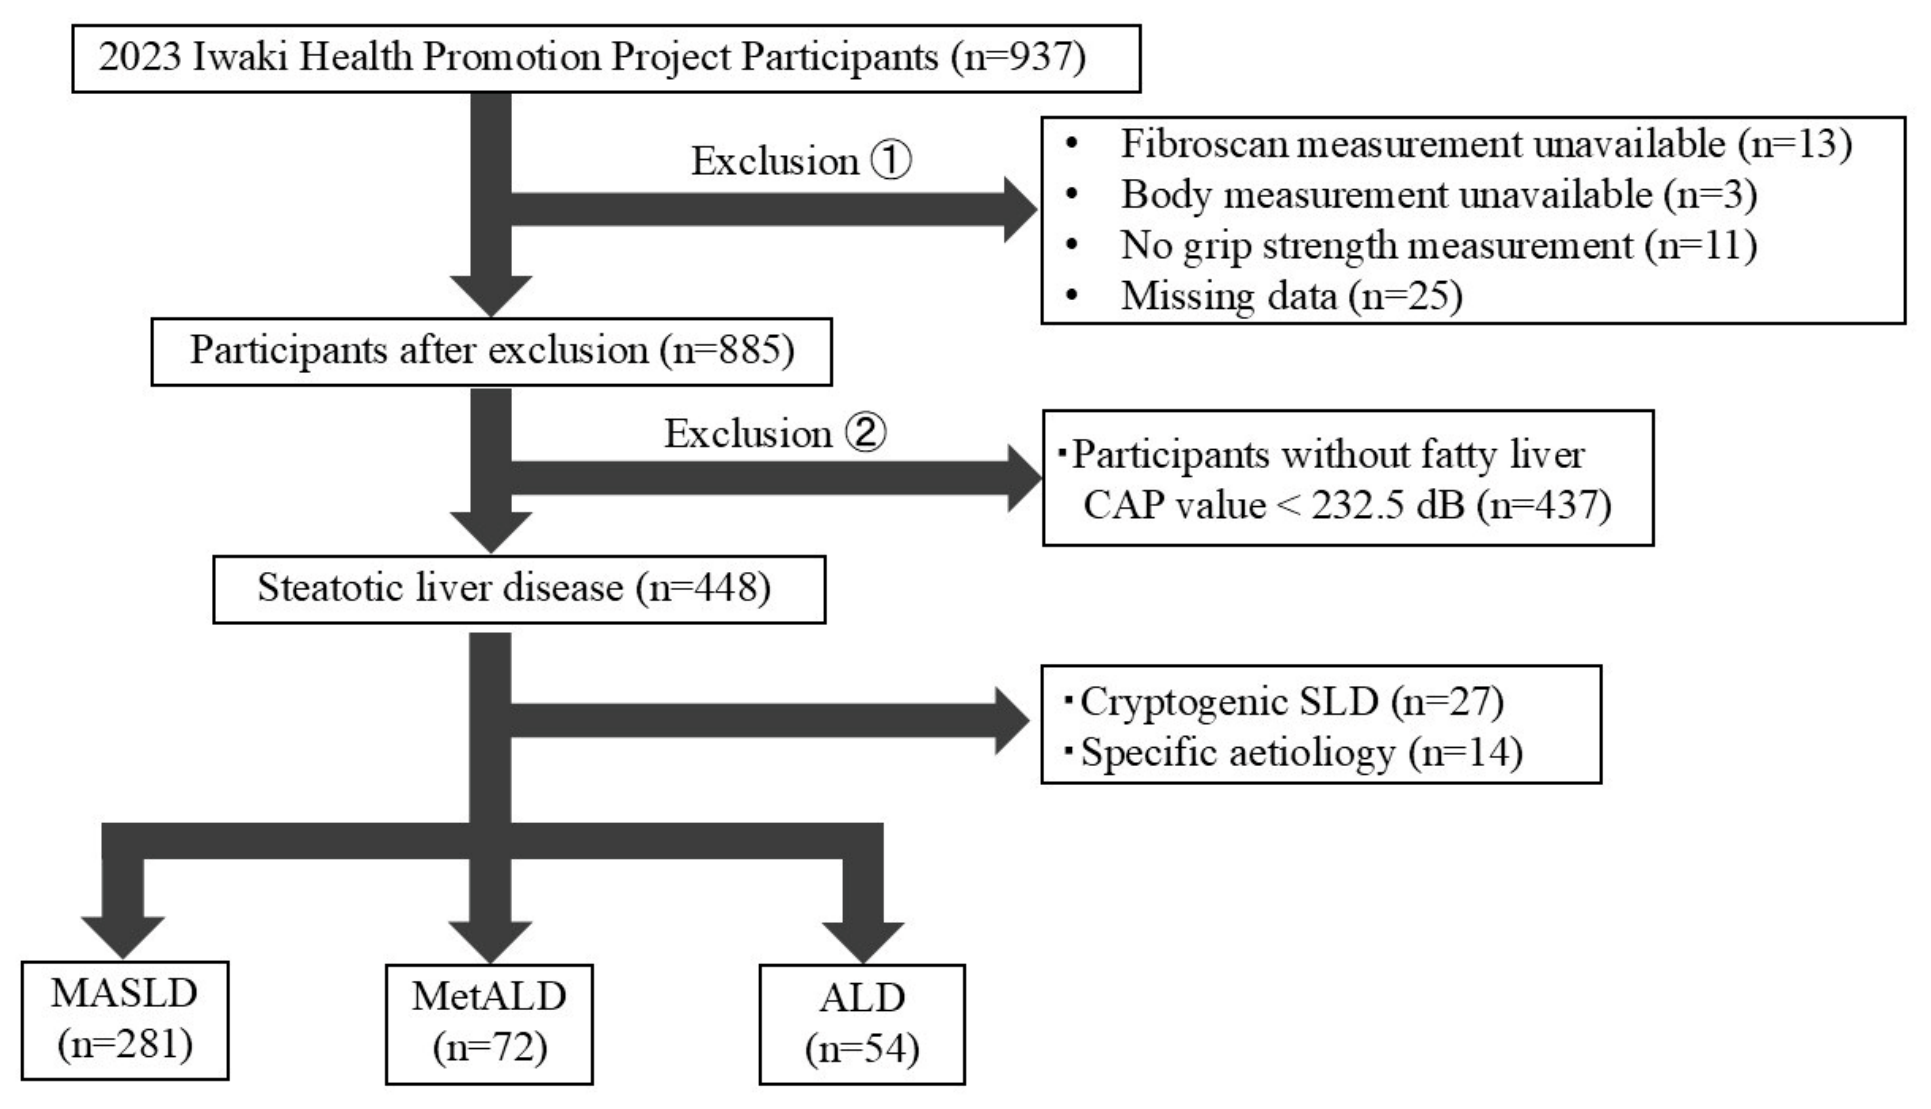
This study was conducted as part of the Iwaki Health Promotion Project, a community-based health promotion initiative targeting the general Japanese population. The project is implemented annually in June and provides residents of the Iwaki district in Hirosaki City, Aomori Prefecture, with comprehensive health check-ups [16]. All participants were adults aged 20–87 years, who voluntarily responded to a public recruitment campaign. After excluding individuals who were unable to undergo transient elastography (FibroScan), bioelectrical impedance analysis (BIA), or grip strength measurements, as well as those with missing data, 885 participants remain. Subsequently, 437 participants with controlled attenuation parameter (CAP) values <232.5 dB/m as measured by FibroScan were excluded as having no fatty liver. Among the 448 SLD participants, excluding those with excluded conditions and non-fatty liver disease, according to established diagnostic criteria, SLD is classified into metabolic dysfunction-associated steatotic liver disease (MASLD), metabolic alcohol-associated liver disease (MetALD), alcohol-associated liver disease (ALD), specific-etiology SLD, and cryptogenic SLD [1]. In this study, we analyzed data from 407 patients with representative subtypes of SLD, including MASLD (n = 281), MetALD (n = 72), and ALD (n = 54). (Figure 1).

2.2. Transient Elastography

CAP measurements were performed using a FibroScan 530 device (Echosens, Paris, France) equipped with M and XL probes. All examinations were performed by an experienced hepatologist. Measurements were considered unreliable and excluded if fewer than 10 valid acquisitions were obtained or if the interquartile range-to-median ratio exceeded 0.30. Based on a previous study comparing CAP values obtained by FibroScan with liver biopsy findings in Japanese population, SLD was defined in the present study as a CAP value ≥ 232.5 dB/m, which represented the cutoff value between mild and significant hepatic steatosis [17].

2.3. Phase Angle Measurement

The phase angle was assessed using a direct segmental multifrequency bioelectrical impedance analyzer (InBody; InBody Japan Inc., Tokyo, Japan). This device measures impedance at six frequencies (1–1000 kHz) across five body segments (right arm, left arm, trunk, right leg, and left leg), yielding 30 impedance values. The ratio of extracellular water to total body water reflects the proportion of extracellular water in the muscle, with higher values indicating poorer muscle quality. Phase angle at 50 kHz was calculated using the formula: Phase angle (θ) = arctan (reactance/resistance) × (180/π) (°), where reactance represents cellular resistance and increases with greater cell membrane integrity [18]. Therefore, the phase angle is regarded as an indicator of cellular health, reflecting membrane integrity, fluid balance, and nutritional status. Lower values indicate reduced muscle mass. Based on previous reports, a phase angle ≤5° was defined as indicative of sarcopenia risk [6,19,20]. In addition, the skeletal muscle index (SMI, kg/m2) was calculated by dividing the appendicular skeletal muscle mass by height squared.

2.4. Clinical Parameters

The following clinical variables were recorded on the day of the health examination: sex, age, height, body mass index (BMI; kg/m2), waist circumference, hepatitis B surface antigen and anti-hepatitis C virus status, and serum levels of aspartate aminotransferase, alanine aminotransferase, γ-glutamyl transpeptidase, glucose, hemoglobin A1c (HbA1c), high-density lipoprotein (HDL) cholesterol, low-density lipoprotein (LDL) cholesterol, triglycerides, and M2BPGi. Exercise and smoking habits were assessed using self-administered questionnaires. Participants engaged in exercise at least once per week were classified as having an exercise habit, and current smokers were classified as having a smoking habit. Grip strength was measured twice for each hand, and the maximum value was used for analysis.

2.5. Serum Amino Acid Profiles

Fasting blood samples were collected from all participants on the morning of the examination. Serum amino acid profiles were analyzed using high-performance liquid chromatography at LSI Medience Corporation (Tokyo, Japan). Sulfosalicylic acid was added to the plasma samples at a final concentration of 5%, and the samples were incubated on ice for 15 min. Protein precipitates were removed by centrifugation, and the supernatants were analyzed using an amino acid analyzer [21]. The concentrations of 23 measurable serum amino acids were included in this analysis.

2.6. Calculation of Alcohol Intake

Daily alcohol consumption, alcohol intake by beverage type, and total energy intake were assessed using the long-form food frequency questionnaire (FFQ) developed by Educational Software (Tokyo, Japan). This FFQ was based on the Next Generation Japan Center-based Prospective Study, a large cohort study examining the associations between lifestyle, environmental factors, and diseases in the Japanese population [22]. The questionnaire consisted of 185 items and enabled the estimation of habitual dietary and nutrient intake from a single survey.

2.7. Statistical Analysis

Statistical analyses were performed using the Statistical Package for the Social Sciences (SPSS) version 28.0 (IBM Corp., Chicago, IL, USA). Categorical variables were presented as frequencies, and continuous variables were presented as medians with interquartile ranges (25th–75th percentiles). Alcohol intake, which exhibited substantial interindividual variability, was presented as the mean ± standard deviation. Group comparisons were conducted using the Kruskal–Wallis test, followed by the Steel–Dwass post hoc test. Associations between the phase angle and SLD subtype were evaluated using univariate and multivariate analyses, with MASLD, the most prevalent SLD subtype, serving as the reference category. Spearman’s rank correlation coefficients were calculated to assess the relationship between M2BPGi, serum amino acids, and sarcopenia-related indices. Multiple regression analyses incorporating M2BPGi, amino acids, and sarcopenia indicators were performed to identify predictive factors. Independent variables included age, sex, smoking status, exercise habits, total energy intake, and cardiometabolic criteria (obesity or central obesity, hyperglycemia or diabetes, hypertension, hypertriglyceridemia, and reduced HDL cholesterol). All continuous variables were log-transformed (natural logarithm) before regression analyses to approximate normal distributions, and alcohol intake was log-transformed after adding 1 to account for zero values. Statistical significance was defined as p < 0.05, while values of p < 0.1 were considered to indicate a statistical trend.

2.8. Ethics Statement

This study was conducted in accordance with the ethical standards of the Declaration of Helsinki and was approved by the Ethics Committee of Hirosaki University School of Medicine (approval number and date: 2023-032, approved on 2 May 2023). Informed consent was obtained from all the participants. All participants were provided with comprehensive information regarding the objectives and methodologies of the study, and written informed consent was obtained from all participants prior to participation.

3. Results

3.1. Participants’ Characteristics

The clinical characteristics of the study participants are summarized in Table 1. The MASLD group included a higher proportion of females (males 38.4%, females 61.6%), whereas the MetALD (males 65.3%, females 34.7%) and ALD (males 79.6%, females 20.4%) groups were predominantly composed of males. Compared with MASLD, both MetALD and ALD exhibited higher levels of aspartate aminotransferase, γ-glutamyl transpeptidase, blood pressure, and high-density lipoprotein cholesterol. The average number of cardiometabolic criteria met was three for MASLD and MetALD, and two for ALD; no statistically significant difference was observed (p-value 0.276). Patients with MASLD and MetALD had a higher proportion of hyperglycemia or diabetes, whereas patients with MetALD and ALD had a higher proportion of high blood pressure. With respect to sarcopenia-related indices, participants with MetALD demonstrated higher phase angle, grip strength, and skeletal muscle index (SMI) than those in the other groups. No significant differences in controlled attenuation parameter values were observed between the groups.
Table 2 presents the sex-specific characteristics of the study population. Although significant sex-related differences were observed for many variables, no significant difference was identified in CAP values. In contrast, M2BPGi levels were higher in females. Compared with females, males exhibited higher phase angle, grip strength, and skeletal muscle mass index (SMI) values. MASLD was more prevalent among females, whereas MetALD and ALD were more frequently observed in males.
Table 3 summarizes alcohol intake and beverage types by group. Although no statistically significant difference was observed, the MetALD group showed higher wine consumption than the ALD group.

3.2. Univariable and Multivariate Analysis of Risk Factors for Low Phase Angle

Table 4 presents the results of the univariate and multivariate analyses performed to investigate risk factors for a low phase angle. The variables included in the analyses were sex, age, cardiometabolic criteria, energy intake, exercise habits, smoking status, and SLD subgroups. In the multivariate analysis, all variables were entered regardless of their statistical significance in the univariate analysis. Univariate analyses identified female sex, advanced age, absence of obesity or central obesity, hypertension, non-smoking status, and MASLD status compared with MetALD and ALD as risk factors for a low phase angle. In multivariate analyses, the independent risk factors for a low phase angle were female sex, advanced age, absence of obesity or central obesity, lack of exercise, and MASLD status compared with MetALD (Table 4).

3.3. Relationship Between Liver Fibrosis Biomarker M2BPGi, Steatotic Liver Diseases, and Sarcopenia Assessment Indicators

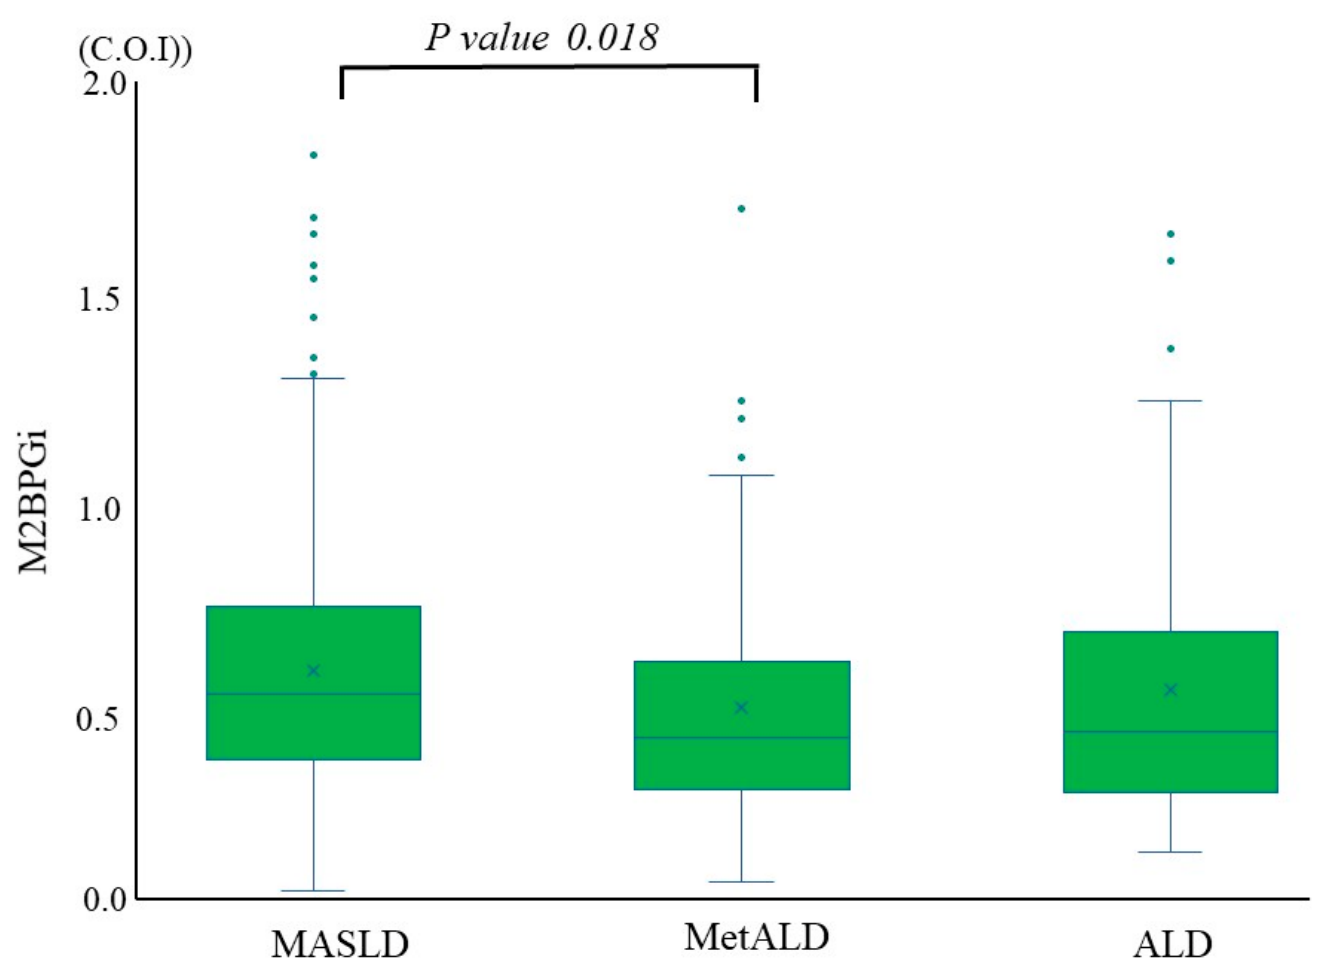
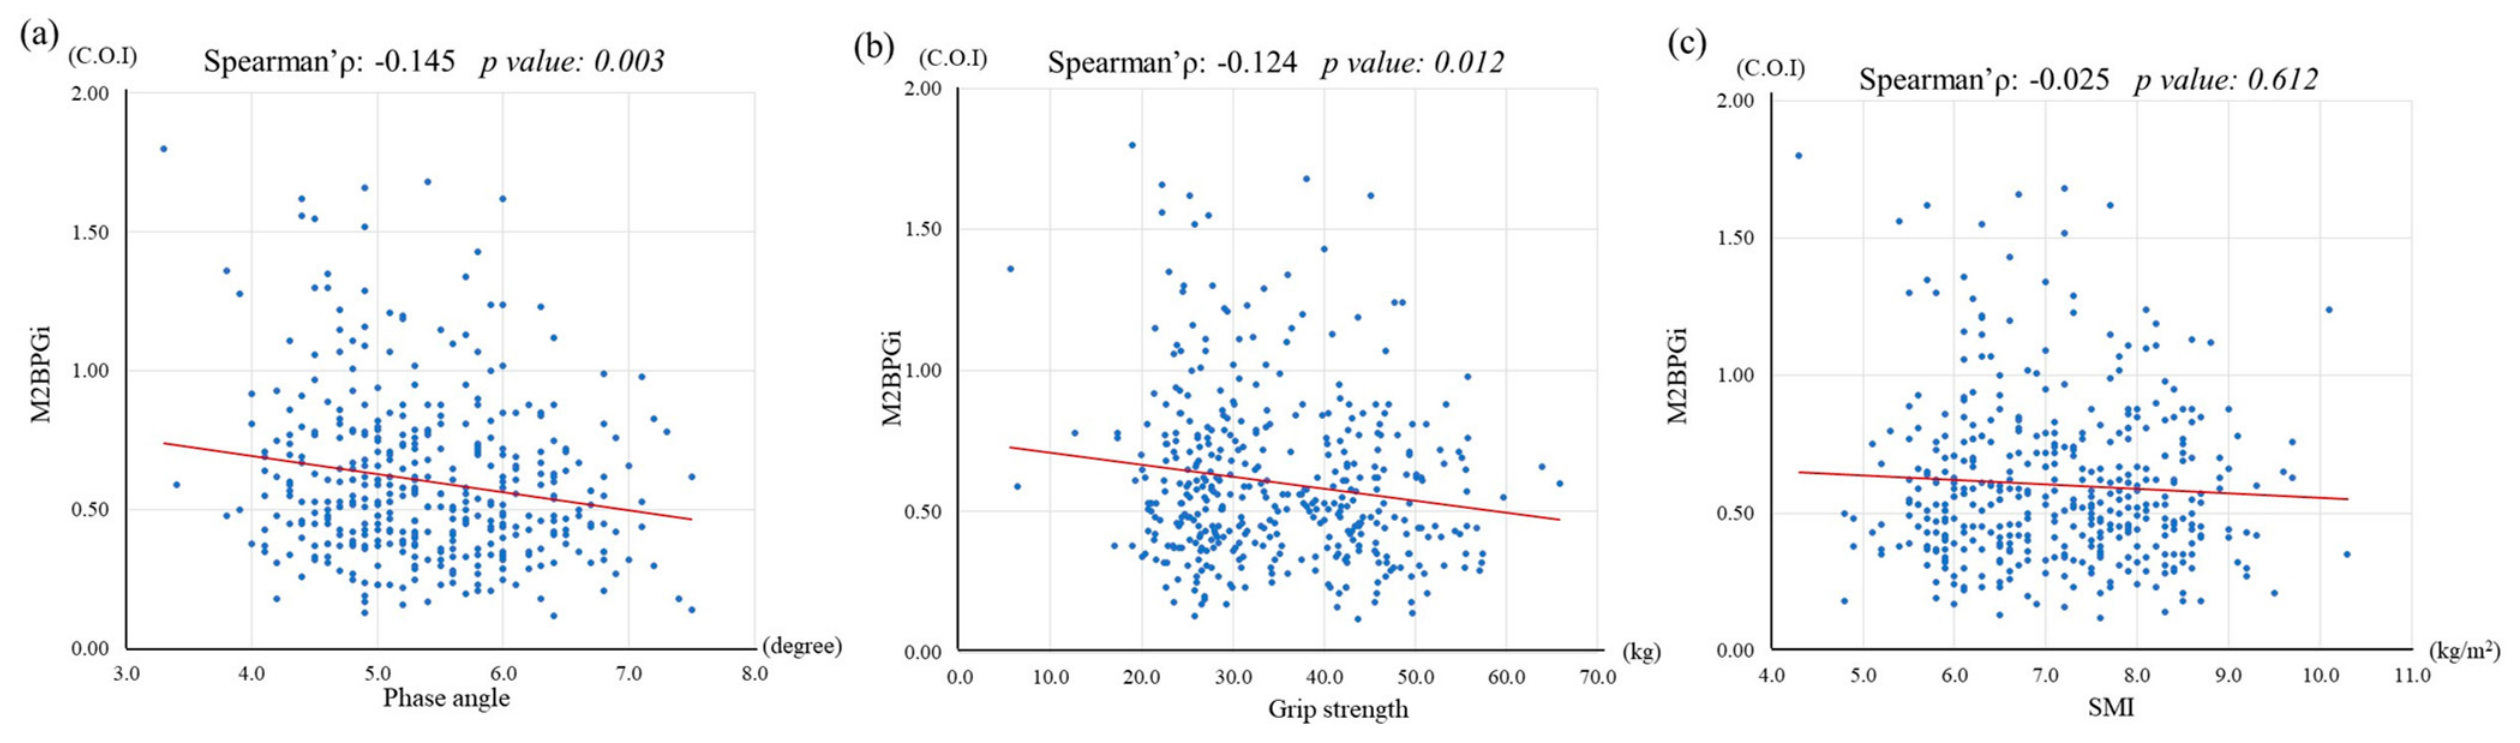
The level of the liver fibrosis marker M2BPGi was significantly lower in the MetALD group than in the MASLD group (Figure 2). Single correlation analyses demonstrated significant negative correlations between M2BPGi and phase angle, and grip strength (Figure 3). Multiple regression analyses were subsequently performed with sarcopenia-related indices as dependent variables, and age, sex, smoking and exercise habits, total energy intake, cardiometabolic criteria (obesity or central obesity, hyperglycemia or diabetes, hypertension, hypertriglyceridemia, and reduced HDL cholesterol), and M2BPGi as independent variables. Phase angle and grip strength remained significantly and inversely associated with M2BPGi in the adjusted model (Model 1, Table 5). These associations persisted even after further adjustments for alcohol intake (Model 2; Table 5).

3.4. Serum Amino Acid Levels and Steatotic Liver Diseases

Table 6 presents comparisons of serum concentrations of 23 amino acids across SLD subtypes. The MetALD group exhibited significantly lower levels of serine and glutamine than the MASLD group. In contrast, the ALD group showed higher levels of leucine, methionine, threonine, tryptophan, and tyrosine compared with the MASLD group.

3.5. Relationship Between Serine, Glutamine, and Sarcopenia Assessment Indicators

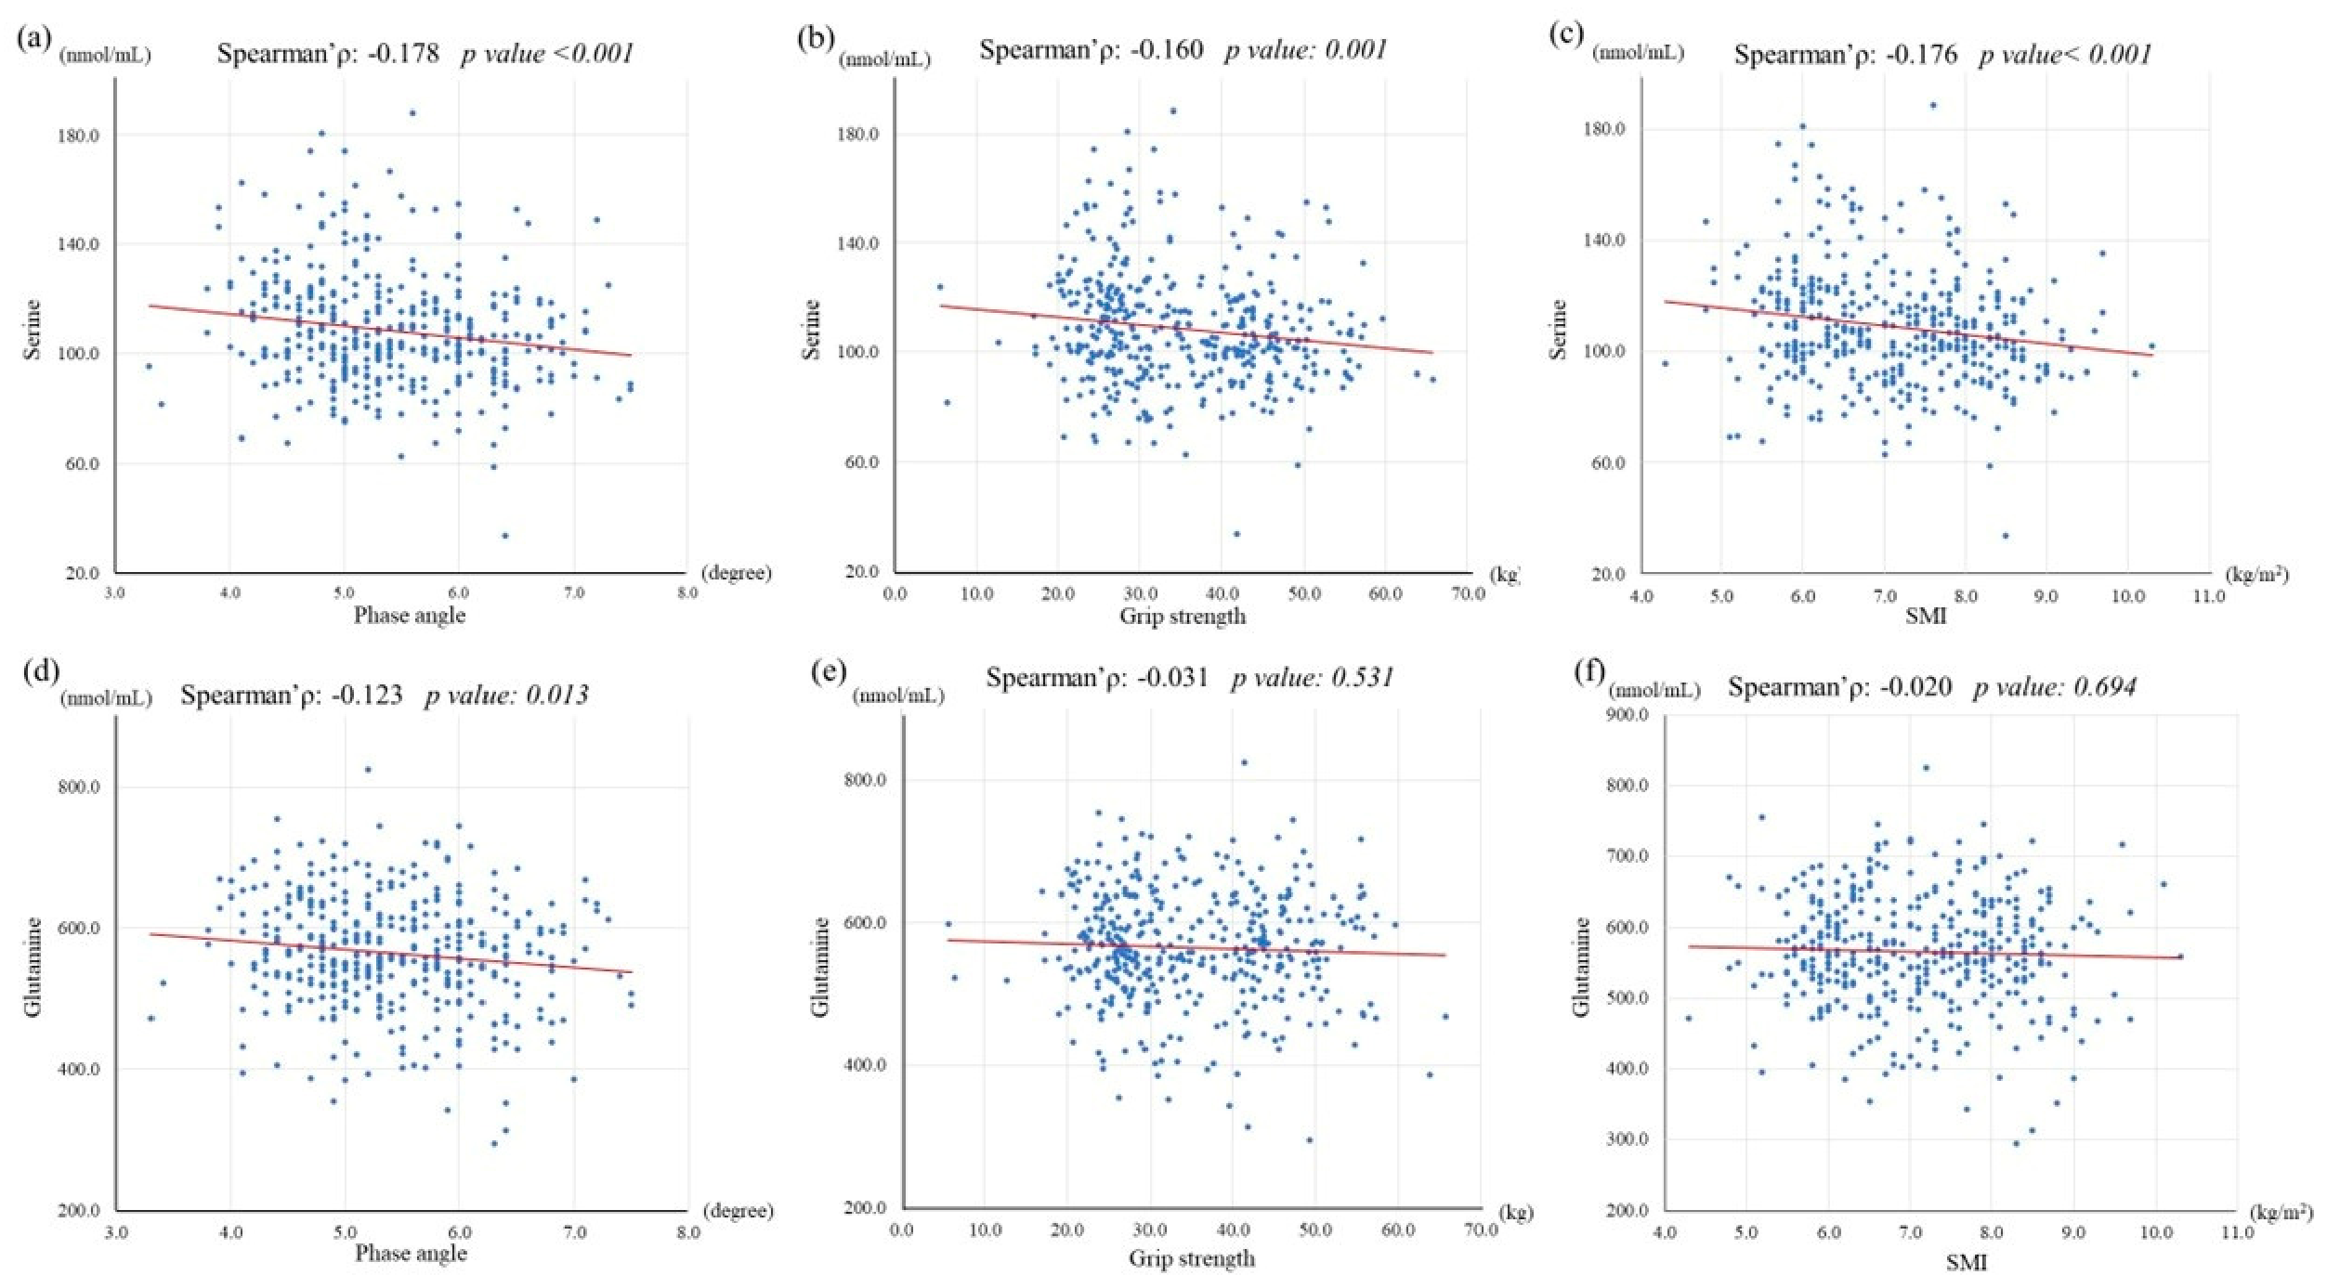
Univariate analyses revealed significant negative correlations between serum serine levels and phase angle, grip strength, and SMI (Figure 4). In contrast, serum glutamine levels showed a negative correlation only with phase angle. Subsequently, multivariate analyses were performed using Model 1, adjusted for age, sex, smoking status, exercise habits, and cardiometabolic criteria associated with sarcopenia in SLD, and Model 2, which additionally included alcohol intake. Multivariate analyses revealed a negative correlation trend between serum serine levels and phase angle in both Model 1 (adjusted for age, sex, smoking, exercise habits, and cardiometabolic criteria) and Model 2 (Model 1 with alcohol intake). Conversely, serum glutamine levels were positively correlated trend with SMI (Table 7).

4. Discussion

In this study, MetALD was associated with a significantly higher phase angle among the SLD groups, and this association remained robust after adjusting for age, sex, lifestyle factors, and the five cardiometabolic criteria. In addition, MetALD was characterized by lower liver fibrosis biomarker M2BPGi and reduced serum serine levels compared with MASLD, both of which were negatively correlated with the phase angle. In contrast, grip strength and SMI showed a weaker correlation with the phase angle. These findings suggest that the phase angle may be a more sensitive and informative indicator than grip strength or SMI in individuals with SLD, particularly in populations such as the present cohort, in whom liver fibrosis and sarcopenia were generally mild.
MetALD is distinguished from MASLD and ALD by moderate alcohol consumption. Notably, participants with MetALD in this study consumed more wine than those in the ALD group, despite having substantially lower total daily alcohol intake. Wine contains polyphenols with antioxidant and anti-inflammatory properties that can inhibit liver fibrosis [23]. Consistent with this finding, participants with MetALD exhibited lower levels of M2BPGi, a specific marker of liver fibrosis, than those with MASLD. Although the present study could not establish a causal relationship and the findings remain speculative, the potential antifibrotic effects of polyphenols may have been involved in the characteristics observed in the MetALD group.
The proportion of females was higher in the MASLD group than in the MetALD group. Similar to grip strength and SMI, the phase angle was lower in females than in males [24]. Simple group comparisons showed that MASLD, which included a greater proportion of women, had lower phase angle, grip strength, and SMI values than MetALD. However, even after adjusting for sex and other confounding factors in multivariate analyses, MetALD remained independently associated with a lower risk of phase angle reduction compared with MASLD.
Liver fibrosis is a well-established risk factor for sarcopenia, contributing to muscle loss through multiple mechanisms, including inflammatory cytokine production, portal hypertension, hyperammonemia, and impaired glucocorticoid, insulin, and insulin-like growth factor-1 signaling [3,25,26]. Although the participants in this study had a median M2BPGi value of 0.55 C.O.I., which falls within the normal range and indicates the absence of advanced fibrosis, a significant negative correlation was observed between M2BPGi and the phase angle. In contrast, no association was identified between M2BPGi and SMI in the multiple regression analysis. These findings suggest that sarcopenia-related changes may occur even in the setting of mild liver fibrosis, and that the phase angle can aid in the early detection of such alterations.
MASLD and MetALD exhibit distinct serum amino acid profiles. Previous studies have reported that compared with MASLD, MetALD is characterized by higher levels of glutamic acid, leucine, isoleucine, cysteine, and threonine and lower levels of glutamine and glycine, whereas serine levels are generally comparable between the two conditions [12]. However, in patients with MASLD, serine concentrations have been shown to decrease with increasing hepatic fat content and to increase in the presence of advanced fibrosis [12]. In this study, participants with MetALD exhibited lower levels of both serine and M2BPGi than those with MASLD, suggesting that reduced serum serine may not be specific to MASLD but may also characterize MetALD, particularly in the context of mild liver fibrosis.
Animal studies have demonstrated that serine supplementation ameliorates MASLD pathology, and serine plays an important role in the maintenance of muscle strength [12,27]. Conversely, the accumulation of ceramides and related metabolites that utilize serine as a substrate has been implicated in age-related loss of muscle mass and function through proteotoxic mechanisms [28]. Epidemiological studies have identified high serum serine levels as a risk factor for sarcopenia [29]. Although the mechanisms underlying reduced serum serine levels in MetALD remain unclear, the negative correlation observed in this study between serum serine concentration and the phase angle is consistent with previous findings, suggesting a complex and potentially adverse role of serine metabolism in muscle health rather than a uniformly protective effect.
In this study, serum glutamine levels exhibited a negative correlation with phase angle in univariate analyses, but this association was no longer evident after multivariate adjustment. Glutamine is an activator of the mTOR cellular signaling pathway, which promotes the initiation of protein synthesis in skeletal muscle [30]. However, glutamine has also been reported as a potential risk factor for sarcopenia [29]. In the multivariate analysis, glutamine demonstrated a positive association with the SMI, highlighting the complexity of its relationship with muscle mass. Overall, the role of glutamine in sarcopenia remains unclear and warrants further investigation.
In patients with cirrhosis, branched-chain amino acid levels typically decrease, whereas aromatic amino acids increase [31]. In contrast, the participants in the present study showed little evidence of advanced liver fibrosis, and the characteristic amino acid profile of cirrhosis was absent. Even among individuals with ALD, the median alcohol consumption was 83.7 g/day, and none met the criteria for alcoholism. Moreover, this study was conducted as part of a health promotion project, and all participants were independent in their activities of daily living. Therefore, only 11.3% of the study participants met the diagnostic criteria for sarcopenia proposed by the Japan Society of Hepatology, which are based on grip strength and bioelectrical impedance analysis [5]. Consequently, these findings cannot be directly extrapolated to patients with advanced cirrhosis or sarcopenia and should be interpreted primarily within a preventive context.
This study has several limitations. First, the diagnosis of SLD was based on FibroScan measurements, rather than liver biopsy. Although liver biopsy remains the gold standard, it is invasive and impractical for large-scale population studies involving health checkups. In this study, liver fibrosis was assessed using M2BPGi, a serum biomarker, rather than liver biopsy, and this should be taken into consideration when interpreting the results. In addition, this study defined SLD using a CAP threshold of ≥232.5 dB/m, whereas some reports recommend a higher cut-off of 248 dB/m, suggesting that the definition of SLD applied here may have been relatively permissive [32]. Because this study participants were members of the general population who underwent health examinations primarily for preventive purposes, a relatively lenient cutoff value for fatty liver was adopted in this study. Second, the study population was limited to the Iwaki district of Hirosaki City, Aomori Prefecture. Considering that fatty liver disease exhibits ethnic and racial differences related to genetic polymorphisms and other factors, the generalizability of these findings to other populations is limited [33]. Third, the observation that the MetALD group exhibited milder liver fibrosis and a higher phase angle than the MASLD group could be interpreted as indicating a potential effect of moderate alcohol consumption. Although the J-curve hypothesis proposes that low levels of alcohol intake may confer health benefits, this concept has been challenged by subsequent studies indicating that lower alcohol consumption is more advantageous [34,35]. Moreover, the J-curve hypothesis suggests an optimal intake of approximately 20 g/day, whereas the participants with MetALD in this study consumed approximately 40 g/day. Consistent with this, MetALD participants exhibited higher levels of aspartate aminotransferase and γ-glutamyl transpeptidase than those with MASLD, indicating that moderate alcohol consumption cannot be considered protective. Fourthly, despite adjusting for multiple confounders, including age, sex, smoking status, and exercise habits, residual confounding by social and behavioral factors such as occupation and physical activity level may have influenced the results. Indeed, although based on univariate analysis, our study identified non-smoking status as a risk factor for a low phase angle, which differs from findings reported in previous studies. Given that sarcopenia and SLD are influenced by numerous confounding factors, including lifestyle habits, genetic predisposition, and socioeconomic background, and that the present study population consisted of patients with mild SLD without advanced liver fibrosis or sarcopenia, the observed associations should be regarded as potential relationships and interpreted with caution. Fifth, caution is warranted regarding the assessment of alcohol consumption and the measurement of serum amino acid concentrations. In this study, alcohol intake was estimated using a long-form food frequency questionnaire FFQ; however, because this questionnaire-based method relies on self-reporting, recall bias may have been present. In addition, serum amino acid levels were measured only once. Although all measurements were performed in the fasting state during the morning, the single-time-point assessment may still have been influenced by recent dietary intake or alcohol consumption.


5. Conclusions

We analyzed sarcopenia-related parameters, including serum amino acid concentrations, among SLD subgroups and found that patients with MetALD exhibited a higher phase angle, along with lower levels of liver fibrosis biomarker M2BPGi and reduced serum serine concentrations compared to those with MASLD. Although the possibility of residual confounding cannot be excluded, our findings suggest that phase angle may serve as a sensitive marker reflecting early muscle loss in patients with SLD, comparable to grip strength and SMI. Furthermore, the health checkup project underlying the present study is scheduled to continue in the future. Therefore, longitudinal follow-up of the study participants over multiple years is expected to facilitate elucidation of the mechanisms underlying sarcopenia associated with SLD and contribute to the development of preventive and therapeutic strategies. FibroScan and BIA, which are minimally invasive and rapid, may be incorporated into routine health checkups and clinical practice for smoother preventive screening. BIA is widely used in health checkups because of its simplicity and the relatively reasonable cost of the equipment. In contrast, FibroScan is expensive and requires specialized training to ensure accurate measurements. Therefore, in routine health screening settings, it may be more practical to screen for fatty liver using serum ALT levels and B-mode ultrasonography, while reserving FibroScan for secondary evaluation at specialized medical institutions.

Author Contributions

Conceptualization, S.S.; methodology, S.S. and C.I.; validation, S.S.; investigation, S.S., D.C., K.M. (Keita Mikami), M.T., N.I., K.F., K.M. (Kaede Miyashiro), K.Y., C.I., T.M., S.N., K.M. (Koichi Murashita) and H.S.; data curation, S.S., C.I. and M.M.; writing—original draft preparation, S.S. and M.M.; writing—review and editing, S.S., M.M. and H.S.; supervision, S.N., K.M. (Koichi Murashita) and H.S.; and funding acquisition, T.M., K.M. (Koichi Murashita) and S.N. All authors have read and agreed to the published version of the manuscript.

Funding

This work was supported by JST COI, Grant Numbers JPMJCE1302, JPMJCA2201, JPMJPF2210, and JSPS KAKENHI (grant numbers 25K13559).

Institutional Review Board Statement

This study was conducted in accordance with the ethical standards of the Declaration of Helsinki and was approved by the Ethics Committee of Hirosaki University School of Medicine (approval number and date: 2023-032, approved on 2 May 2023).

Informed Consent Statement

Informed consent was obtained from all the participants involved in the study.

Data Availability Statement

The original contributions of this study are included in this article. Further inquiries can be directed to the corresponding author.

Acknowledgments

This study was based on the Iwaki Health Promotion Project of the Hirosaki University Graduate School of Medicine in collaboration with the Aomori Health Evaluation and Promotion Center and the Hirosaki City Office of the Department of Health Promotion.

Conflicts of Interest

The authors declare no conflicts of interest.

Abbreviations

The following abbreviations are used in this manuscript:
SLDSteatotic liver disease
CAPControlled attenuation parameter
MASLDMetabolic dysfunction-associated steatotic liver disease
MetALDMetabolic alcohol-associated liver disease.
ALDAlcohol-associated liver disease
BMIBody mass index
B2BPGiMac-2-binding protein glycosylation isomer
HDLHigh-density lipoprotein
LDLLow-density lipoprotein
HbA1cHemoglobin A1c
SMISkeletal muscle index

References

  1. Rinella, M.E.; Lazarus, J.V.; Ratziu, V.; Francque, S.M.; Sanyal, A.J.; Kanwal, F.; Romero, D.; Abdelmalek, M.F.; Anstee, Q.M.; Arab, J.P.; et al. A multisociety Delphi consensus statement on new fatty liver disease nomenclature. Hepatology 2023, 78, 1966–1986. [Google Scholar] [CrossRef] [Scilit] [PubMed]
  2. Riazi, K.; Azhari, H.; Charette, J.H.; Underwood, F.E.; King, J.A.; Afshar, E.E.; Swain, M.G.; Congly, S.E.; Kaplan, G.G.; Shaheen, A.-A. The prevalence and incidence of NAFLD worldwide: A systematic review and meta-analysis. Lancet Gastroenterol. Hepatol. 2022, 7, 851–861. [Google Scholar] [CrossRef] [Scilit] [PubMed]
  3. Ebadi, M.; Bhanji, R.A.; Mazurak, V.C.; Montano-Loza, A.J. Sarcopenia in cirrhosis: From pathogenesis to interventions. J. Gastroenterol. 2019, 54, 845–859. [Google Scholar] [CrossRef] [Scilit] [PubMed]
  4. Nishikawa, H.; Shiraki, M.; Hiramatsu, A.; Moriya, K.; Hino, K.; Nishiguchi, S. Japan Society of Hepatology guidelines for sarcopenia in liver disease (1st edition): Recommendation from the working group for creation of sarcopenia assessment criteria. Hepatol. Res. 2016, 46, 951–963. [Google Scholar] [CrossRef] [Scilit]
  5. The Japan Society of Hepatology Website. Available online: https://www.jsh.or.jp/medical/guidelines/jsh_guidlines/sarcopenia.html (accessed on 27 December 2025). (In Japanese)
  6. Di Vincenzo, O.; Marra, M.; Di Gregorio, A.; Pasanisi, F.; Scalfi, L. Bioelectrical impedance analysis (BIA)—Derived phase angle in sarcopenia: A systematic review. Clin. Nutr. 2021, 40, 3052–3061. [Google Scholar] [CrossRef] [Scilit]
  7. Selberg, O.; Selberg, D. Norms and correlates of bioimpedance phase angle in healthy human subjects, hospitalized patients, and patients with liver cirrhosis. Eur. J. Appl. Physiol. 2002, 86, 509–516. [Google Scholar] [CrossRef] [Scilit]
  8. Ruiz-Margáin, A.; Xie, J.J.; Román-Calleja, B.M.; Pauly, M.; White, M.G.; Chapa-Ibargüengoitia, M.; Campos-Murguía, A.; González-Regueiro, J.A.; Macias-Rodríguez, R.U.; Duarte-Rojo, A. Phase Angle From Bioelectrical Impedance for the Assessment of Sarcopenia in Cirrhosis With or Without Ascites. Clin. Gastroenterol. Hepatol. 2021, 19, 1941–1949. [Google Scholar] [CrossRef] [Scilit]
  9. Fernandes, S.A.; de Mattos, A.A.; Tovo, C.V.; Marroni, C.A. Nutritional evaluation in cirrhosis: Emphasis on the phase angle. World J. Hepatol. 2016, 8, 1205–1211. [Google Scholar] [CrossRef] [Scilit]
  10. Kuno, A.; Ikehara, Y.; Tanaka, Y.; Ito, K.; Matsuda, A.; Sekiya, S.; Hige, S.; Sakamoto, M.; Kage, M.; Mizokami, M.; et al. A serum “sweet-doughnut” protein facilitates fibrosis evaluation and therapy assessment in patients with viral hepatitis. Sci. Rep. 2013, 3, 1065. [Google Scholar] [CrossRef] [Scilit]
  11. Toshima, T.; Shirabe, K.; Ikegami, T.; Yoshizumi, T.; Kuno, A.; Togayachi, A.; Gotoh, M.; Narimatsu, H.; Korenaga, M.; Mizokami, M.; et al. A novel serum marker, glycosylated Wisteria floribunda agglutinin-positive Mac-2 binding protein (WFA(+)-M2BP), for assessing liver fibrosis. J. Gastroenterol. 2015, 50, 76–84. [Google Scholar] [CrossRef] [Scilit]
  12. Mino, M.; Kakazu, E.; Sano, A.; Tsuruoka, M.; Matsubara, H.; Kakisaka, K.; Kogure, T.; Sekine, K.; Aoki, Y.; Imamura, M.; et al. Comprehensive analysis of peripheral blood free amino acids in MASLD: The impact of glycine-serine-threonine metabolism. Amino Acids 2024, 57, 3. [Google Scholar] [CrossRef] [Scilit] [PubMed]
  13. Kim, H.K.; Suzuki, T.; Saito, K.; Yoshida, H.; Kobayashi, H.; Kato, H.; Katayama, M. Effects of exercise and amino acid supplementation on body composition and physical function in community-dwelling elderly Japanese sarcopenic women: A randomized controlled trial. J. Am. Geriatr. Soc. 2012, 60, 16–23. [Google Scholar] [CrossRef] [Scilit] [PubMed]
  14. Børsheim, E.; Bui, Q.U.; Tissier, S.; Kobayashi, H.; Ferrando, A.A.; Wolfe, R.R. Effect of amino acid supplementation on muscle mass, strength and physical function in elderly. Clin. Nutr. 2008, 27, 189–195. [Google Scholar] [CrossRef] [Scilit]
  15. Cruz-Jentoft, A.J.; Landi, F.; Schneider, S.M.; Zúñiga, C.; Arai, H.; Boirie, Y.; Chen, L.K.; Fielding, R.A.; Martin, F.C.; Michel, J.P.; et al. Prevalence of and interventions for sarcopenia in ageing adults: A systematic review. Report of the International Sarcopenia Initiative (EWGSOP and IWGS). Age Ageing 2014, 43, 748–759. [Google Scholar] [CrossRef] [Scilit]
  16. Nakaji, S.; Ihara, K.; Sawada, K.; Parodi, S.; Umeda, T.; Takahashi, I.; Murashita, K.; Kurauchi, S.; Tokuda, I. Social innovation for life expectancy extension utilizing a platform-centered system used in the Iwaki health promotion project: A protocol paper. SAGE Open Med. 2021, 9, 20503121211002606. [Google Scholar] [CrossRef] [Scilit]
  17. Masaki, K.; Takaki, S.; Hyogo, H.; Kobayashi, T.; Fukuhara, T.; Naeshiro, N.; Honda, Y.; Nakahara, T.; Ohno, A.; Miyaki, D.; et al. Utility of controlled attenuation parameter measurement for assessing liver steatosis in Japanese patients with chronic liver diseases. Hepatol. Res. 2013, 43, 1182–1189. [Google Scholar] [CrossRef] [Scilit]
  18. Barbosa-Silva, M.C.; Barros, A.J. Bioelectrical impedance analysis in clinical practice: A new perspective on its use beyond body composition equations. Curr. Opin. Clin. Nutr. Metab. Care 2005, 8, 311–317. [Google Scholar] [CrossRef] [Scilit]
  19. Uemura, K.; Doi, T.; Tsutsumimoto, K.; Nakakubo, S.; Kim, M.J.; Kurita, S.; Ishii, H.; Shimada, H. Predictivity of bioimpedance phase angle for incident disability in older adults. J. Cachexia Sarcopenia Muscle 2020, 11, 46–54. [Google Scholar] [CrossRef] [Scilit]
  20. Kajiyama, S.; Nakanishi, N.; Yamamoto, S.; Ichikawa, T.; Okamura, T.; Hashimoto, Y.; Kitagawa, N.; Hamaguchi, M.; Fukui, M. The Impact of Nutritional Markers and Dietary Habits on the Bioimpedance Phase Angle in Older Individuals. Nutrients 2023, 15, 3599. [Google Scholar] [CrossRef] [Scilit] [PubMed]
  21. Terrlink, T.; van Leeuwen, P.A.; Houdijk, A. Plasma amino acids determined by liquid chromatography within 17 minutes. Clin. Chem. 1994, 40, 245–249. [Google Scholar] [CrossRef] [Scilit]
  22. Yokoyama, Y.; Takachi, R.; Ishihara, J.; Ishii, Y.; Sasazuki, S.; Sawada, N.; Shinozawa, Y.; Tanaka, J.; Kato, E.; Kitamura, K.; et al. Validity of Short and Long Self-Administered Food Frequency Questionnaires in Ranking Dietary Intake in Middle-Aged and Elderly Japanese in the Japan Public Health Center-Based Prospective Study for the Next Generation (JPHC-NEXT) Protocol Area. J. Epidemiol. 2016, 26, 420–432. [Google Scholar] [CrossRef] [Scilit]
  23. Niu, C.; Zhang, J.; Okolo, P.I. The possible pathogenesis of liver fibrosis: Therapeutic potential of natural polyphenols. Pharmacol. Rep. 2024, 76, 944–961. [Google Scholar] [CrossRef] [Scilit] [PubMed]
  24. Barbosa-Silva, M.C.; Barros, A.J.; Wang, J.; Heymsfield, S.B.; Pierson, R.N., Jr. Bioelectrical impedance analysis: Population reference values for phase angle by age and sex. Am. J. Clin. Nutr. 2005, 82, 49–52. [Google Scholar] [CrossRef]
  25. Harring, M.; Golabi, P.; Paik, J.M.; Shah, D.; Racila, A.; Cable, R.; Srishord, M.; Younossi, Z.M. Sarcopenia Among Patients With Nonalcoholic Fatty Liver Disease (NAFLD) Is Associated With Advanced Fibrosis. Clin. Gastroenterol. Hepatol. 2023, 21, 2876–2888.e2875. [Google Scholar] [CrossRef] [Scilit]
  26. Kuchay, M.S.; Martínez-Montoro, J.I.; Kaur, P.; Fernández-García, J.C.; Ramos-Molina, B. Non-alcoholic fatty liver disease-related fibrosis and sarcopenia: An altered liver-muscle crosstalk leading to increased mortality risk. Ageing Res. Rev. 2022, 80, 101696. [Google Scholar] [CrossRef] [Scilit]
  27. Thalacker Mercer, A.; Blum, J.; Gheller, B. The essentiality of serine and glycine for skeletal muscle regeneration. FASEB J. 2019, 33, 590.5. [Google Scholar] [CrossRef] [Scilit]
  28. Poisson, J.; Daskalaki, I.; Potluri, V.; Morel, J.D.; Rodriguez-Lopez, S.; De Masi, A.; Benegiamo, G.; Jain, S.; Lima, T.; Auwerx, J. Safe and Orally Bioavailable Inhibitor of Serine Palmitoyltransferase Improves Age-Related Sarcopenia. ACS Pharmacol. Transl. Sci. 2025, 8, 203–215. [Google Scholar] [CrossRef] [Scilit]
  29. Yeung, S.S.Y.; Zhu, Z.L.Y.; Kwok, T.; Woo, J. Serum Amino Acids Patterns and 4-Year Sarcopenia Risk in Community-Dwelling Chinese Older Adults. Gerontology 2022, 68, 736–745. [Google Scholar] [CrossRef] [Scilit]
  30. He, W.; Connolly, E.D.; Cross, H.R.; Wu, G. Dietary protein and amino acid intakes for mitigating sarcopenia in humans. Crit. Rev. Food Sci. Nutr. 2025, 65, 2538–2561. [Google Scholar] [CrossRef] [Scilit]
  31. Zhang, Y.; Zhan, L.; Zhang, L.; Shi, Q.; Li, L. Branched-Chain Amino Acids in Liver Diseases: Complexity and Controversy. Nutrients 2024, 16, 1875. [Google Scholar] [CrossRef] [Scilit] [PubMed]
  32. Karlas, T.; Petroff, D.; Sasso, M.; Fan, J.G.; Mi, Y.Q.; de Lédinghen, V.; Kumar, M.; Lupsor-Platon, M.; Han, K.H.; Cardoso, A.C.; et al. Individual patient data meta-analysis of controlled attenuation parameter (CAP) technology for assessing steatosis. J. Hepatol. 2017, 66, 1022–1030. [Google Scholar] [CrossRef] [Scilit] [PubMed]
  33. Rich, N.E.; Oji, S.; Mufti, A.R.; Browning, J.D.; Parikh, N.D.; Odewole, M.; Mayo, H.; Singal, A.G. Racial and Ethnic Disparities in Nonalcoholic Fatty Liver Disease Prevalence, Severity, and Outcomes in the United States: A Systematic Review and Meta-analysis. Clin. Gastroenterol. Hepatol. 2018, 16, 198–210.e192. [Google Scholar] [CrossRef] [Scilit] [PubMed]
  34. Holman, C.D.; English, D.R.; Milne, E.; Winter, M.G. Meta-analysis of alcohol and all-cause mortality: A validation of NHMRC recommendations. Med. J. Aust. 1996, 164, 141–145. [Google Scholar] [CrossRef] [Scilit] [PubMed]
  35. Alcohol use and burden for 195 countries and territories, 1990–2016: A systematic analysis for the Global Burden of Disease Study 2016. Lancet 2018, 392, 1015–1035. [CrossRef] [Scilit]
Figure 1. Study enrollment flowchart. CAP, controlled attenuation parameter. SLD, steatotic liver disease. MASLD, metabolic dysfunction-associated steatotic liver disease. MetALD, metabolic alcohol-associated liver disease. ALD, alcohol-associated liver disease.
Livers 06 00051 g001
Figure 2. Comparison of the M2BPGi among the SLD groups. MASLD, metabolic dysfunction-associated steatotic liver disease. MetALD, metabolic alcohol-associated liver disease. ALD, alcohol-associated liver disease.
Livers 06 00051 g002
Figure 3. Correlation between M2BPGi and sarcopenia assessment indicators. M2BPGi, mac-2-binding protein glycosylation isomer. (a) Phase angle, (b) Grip strength, (c) SMI. SMI, skeletal muscle index.
Livers 06 00051 g003
Figure 4. Correlation between serine or glutamine and sarcopenia assessment indicator. (a) Serine and phase angle, (b) Serine and grip strength, (c) Serine and SMI, (d) Glutamine and phase angle, (e) Glutamine and grip strength, (f) Glutamine and SMI. SMI, skeletal muscle index.
Livers 06 00051 g004
Table 1. The characteristics of the participants.
MASLDMetALDALDMASLD vs. MetALDMASLD vs. ALD
n = 281n = 72n = 54p-Valuep-Value
Sex, male108 (38.4%)47 (65.3%)43 (79.6%)<0.001
Age (year)54.0 (44.0–65.0)54.0 (46.0–64.0)53.0 (42.8–66.0)0.6730.974
Waist circumference (cm)87.4 (82.7–93.3)89.5 (83.1–93.6)91.1 (85.5–97.3)0.6410.060
BMI (kg/m2)24.4 (22.6–27.2)25.0 (23.0–26.3)24.2 (22.4–26.8)0.9930.889
Aspartate aminotransferase21.0 (17.0–25.0)22.5 (19.0–30.0)25.5 (20.0–39.3)0.009<0.001
Alanine aminotransferase21.0 (15.0–32.5)21.0 (17.3–30.0)25.5 (18.8–36.3)0.984<0.001
γ-Glutamyl transpeptidase25.0 (17.0–42.0)37.5 (24.3–64.0)55.5 (31.5–103.8)<0.001<0.001
Energy intake (1000 kcal)1.97 (1.60–2.46)2.20 (1.91–2.75)2.17 (2.48–2.90)0.007<0.001
Exercise habit81 (28.8%)14 (19.4%)12 (22.2%)0.209
Smoking habit43 (15.3%)20 (27.8%)19 (35.2%)<0.001
Alcohol intake (g/day)0.0 (0.0–4.5)40.3 (34.5–46.8)83.7 (70.1–112.5)<0.001<0.001
Systolic blood pressure (mmHg)129.0 (116.5–141.0)137.8 (123.9–150.6)134.3 (125.3–147.5)0.0030.011
Diastolic blood pressure (mmHg)81.5 (74.3–88.5)87.0 (80.8–94.4)86.0 (81.0–97.6)<0.0010.001
Fasting blood sugar (mg/dL)98.0 (91.0–106.5)100.5 (93.0–112.8)97.0 (91.8–105.3)0.3050.769
HbA1c (%)5.7 (5.5–5.9)5.6 (5.4–5.9)5.5 (5.2–5.7)0.436<0.001
Triglycerides (mg/dL)97.0 (69.5–143.0)93.0 (72.5–207.0)103.0 (64.8–209.8)0.3940.899
HDL cholesterol (mg/dL)59.0 (51.0–74.5)67.0 (52.3–81.5)68.0 (53.8–83.0)0.0140.045
CAP (dB/m)278.0 (250.0–311.0)273.0 (249.0–292.5)275.5 (247.8–314.8)0.2500.861
Phase angle (°)5.2 (4.7–5.9)5.6 (5.1–6.1)5.2 (5.7–6.0)0.0070.021
Grip strength (kg)30.0 (25.6–41.0)37.7 (27.9–45.8)34.5 (42.5–49.6)0.004<0.001
Skeletal Muscle Index (kg/m2)6.8 (6.1–7.8)7.5 (6.4–8.2)6.8 (7.7–8.4)0.021<0.001
Cardiometabolic risk factors
Obesity/central obesity234 (83.3%)59 (81.9%)40 (74.1%)0.276
Hyperglycemia or diabetes186 (66.2%)48 (66.7%)24 (44.4%)0.008
High blood pressure173 (61.6%)56 (77.8%)42 (77.8%)0.006
High triglycerides92 (32.7%)32 (44.4%)21 (38.9%)0.156
Reduced HDL cholesterol34 (12.1%)5 (6.9%)3 (5.6%)0.205
Risk factor numbers3320.276
Data are presented as numbers (%) or median (range, 25th–75th percentiles). MASLD, metabolic dysfunction-associated steatotic liver disease. MetALD, metabolic alcohol-associated liver disease. ALD, alcohol-associated liver disease. BMI, body mass index. HDL, high-density lipoprotein. CAP, controlled attenuation parameter.
Table 2. Sex-specific characteristics of the participants.
MalesFemales
n = 198n = 209p-Value
Age (year)52.0 (43.0–64.0)56.0 (45.0–65.0)0.154
Waist circumference (cm)91.4 (86.0–96.5)85.1 (80.4–91.4)<0.001
BMI (kg/m2)25.2 (23.3–27.1)23.9 (21.8–26.8)0.001
Aspartate aminotransferase24.0 (20.0–30.0)20.0 (17.0–23.5)<0.001
Alanine aminotransferase28.0 (20.8–39.5)17.0 (13.0–23.0)<0.001
γ-Glutamyl transpeptidase42.0 (27.8–73.3)21.0 (15.0–32.0)<0.001
Energy intake (1000 kcal)2.3 (1.8–2.7)2.0 (1.6–2.5)0.001
Exercise habit49 (24.7%)58 (27.8%)0.565
Smoking habit61 (30.8%)21 (10.0%)<0.001
Alcohol intake (g/day)23.4 (0.0–54.1)0.0 (0.0–7.0)<0.001
Systolic blood pressure (mmHg)130.8 (121.0–144.0)131.0 (116.0–144.8)0.408
Diastolic blood pressure (mmHg)84.8 (78.0–92.1)82.0 (73.8–89.3)0.004
Fasting blood sugar (mg/dL)99.5 (93.0–108.3)97.0 (91.0–106.0)0.122
HbA1c (%)5.6 (5.4–5.9)5.7 (5.4–5.9)0.327
Triglycerides (mg/dL)115.5 (80.0–187.0)84.0 (63.0–131.5)<0.001
HDL cholesterol (mg/dL)56.0 (48.8–68.0)68.0 (54.5–81.0)<0.001
CAP (dB/m)277.5 (247.0–313.0)274 (252.5–305.0)0.962
M2BPGi0.52 (0.38–0.71)0.57 (0.41–0.78)0.046
Phase angle (°)6.0 (5.5–6.4)4.9 (4.5–5.2)<0.001
Grip strength (kg)43.3 (39.8–48.5)26.5 (23.9–29.5)<0.001
Skeletal Muscle Index (kg/m2)7.9 (7.5–8.4)6.2 (5.9–6.7)<0.001
Cardiometabolic risk factors
Obesity/central obesity163 (82.3%)170 (81.3%)0.898
Hyperglycemia or diabetes127 (64.1%)131 (62.7%)0.839
High blood pressure133 (67.2%)138 (66.0%)0.889
High triglycerides86 (43.4%)59 (28.2%)0.002
Reduced HDL cholesterol14 (7.1%)28 (13.4%)0.053
Risk factor numbers330.126
MASLD108 (54.5%)173 (82.8%)<0.001
MetALD47 (23.7%)25 (12.0%)
ALD43 (21.7%)11 (5.3%)
Data are presented as numbers (%) or median (range, 25th–75th percentiles). MASLD, metabolic dysfunction-associated steatotic liver disease. MetALD, metabolic alcohol-associated liver disease. ALD, alcohol-associated liver disease. BMI, body mass index. HDL, high-density lipoprotein. CAP, controlled attenuation parameter. (M2BPGi), Mac-2 binding protein glycosylation isomer.
Table 3. Alcohol consumption by type of beverage.
MASLDMetALDALDMASLD vs. MetALDMASLD vs. ALDMetALD vs. ADL
n = 281n = 72n = 54p-Valuep-Valuep-Value
Beer (g/day)56.5 ±128.8 501.8 ± 486.9529.3 ± 715.8<0.001<0.0010.925
Shochu (g/day)2.9 ± 12.949.3 ± 72.1332.2 ± 254.20.001<0.001<0.001
Japanese sake (g/day)2.1 ± 13.839.1 ± 93.464.2 ± 132.4<0.001<0.0010.782
Wine (g/day)3.2 ± 18.725.0 ± 64.817.1 ± 68.90.0040.4390.509
Whiskey (g/day)0.6 ± 4.012.2 ± 30.011.4 ± 31.0<0.001<0.0010.991
Data are presented as mean ± Standard Deviation. MASLD, metabolic dysfunction-associated steatotic liver disease. Met ALD, metabolic alcohol-associated liver disease. ALD, alcohol-associated liver disease.
Table 4. Univariable and multivariate analysis of risk factors for low phase angle (phase angle <5°).
UnivariableMultivariable
OR95%CIp-ValueOR95%CIp-Value
Female21.612.138.9<0.00144.620.099.3<0.001
Age1.061.041.07<0.0011.081.051.11<0.001
Obesity/central obesity0.470.280.780.0030.320.150.680.003
High blood pressure2.111.353.310.0011.660.863.200.128
Hyperglycemia or diabetes1.510.992.320.0561.300.682.510.432
High triglycerides0.670.441.030.0700.870.451.680.674
Reduced HDL cholesterol1.020.531.980.9430.890.352.250.807
Energy intake0.960.791.170.7090.910.701.180.480
Exercise habit0.750.471.190.2250.360.180.710.003
Smoking habit0.280.150.51<0.0010.710.301.680.433
Fatty liver groups
MASLD1.00 1.00
MetALD0.300.160.56<0.0010.370.160.860.020
ALD0.390.200.760.0061.640.614.460.330
OR, odds ratio; CI, confidence interval. MASLD, metabolic dysfunction-associated steatotic liver disease. MetALD, metabolic alcohol-associated liver disease. ALD, alcohol-associated liver disease.
Table 5. Multiple Regression Analysis of M2BPGi and sarcopenia assessment items.
Adjusted Model 1Adjusted Model 2
βpR2βpR2
Phase angle−0.0780.0300.586−0.0780.0310.586
Grip strength−0.0880.0120.604−0.0850.0160.605
Skeletal Muscle Index−0.0200.5130.698−0.0200.5240.698
β, standardized coefficient; R2, coefficient of determination. Adjusted model 1: this multivariate analysis was adjusted for age, sex, smoking habit, exercise habit, energy intake, obesity/central obesity, hyperglycemia or diabetes, high blood pressure, high triglycerides, reduced HDL cholesterol. Adjusted model 2: adjusted for mode l plus alcohol intake.
Table 6. Serum amino acid levels and steatotic liver disease.
MASLDMetALDALDMASLD vs. MetALDMASLD vs. ALD
n = 281n = 72n = 54p-Valuep-Value
Valine212.7 (184.9–240.2)207.5 (179.4–236.5)216.6 (194.2–243.1)0.7090.811
Leucine113.2 (96.6–129.8)115.1 (100.1–130.8)125.0 (108.4–134.8)0.5550.035
Isoleucine57.8 (48.8–68.9)57.8 (49.5–69.4)63.1 (55.3–71.3)0.9300.114
Methionine21.4 (19.1–23.9)21.7 (19.2–24.4)23.0 (21.2–25.9)0.7190.009
Lysine194.4 (173.5–213.9)198.8 (180.7–217.0)194.6 (168.4–218.7)0.5490.975
Phenylalanine56.8 (52.5–62.4)57.3 (52.6–61.2)60.2 (54.3–63.4)0.9800.077
Histidine78.9 (73.8–85.5)81.0 (75.5–90.4)81.3 (72.8–89.3)0.0860.499
Threonine115.7 (104.8–135.2)125.5 (109.3–144.2)130.8 (114.8–146.0)0.0620.009
Tryptophan53.8 (48.0–59.7)54.5 (45.4–61.1)56.9 (51.4–68.0)0.9540.024
Tyrosine62.6 (54.9–69.6)63.8 (55.5–70.6)69.0 (61.8–76.9)0.752<0.001
Glycine204.0 (179.3–245.2)193.7 (173.6–222.4)194.8 (172.9–221.8)0.1690.236
Alanine347.3 (291.3–408.2)330.9 (303.2–378.7)336.3 (298.5–420.6)0.8271.000
Serine109.4 (98.7–121.9)100.9 (90.4–109.2)103.1 (92.8–115.2)<0.0010.064
Arginine82.3 (70.1–95.0)80.6 (70.1–92.8)80.3 (67.6–88.6)0.8600.336
Cystine24.0 (19.0–30.8)24.6 (18.5–33.3)25.5 (19.6–36.6)0.9960.207
Asparagine42.8 (38.2–46.8)42.8 (39.3–48.1)43.5 (39.3–46.3)0.8710.929
Glutamine571.4 (532.4–627.7)540.2 (505.6–578.7)560.9 (482.6–610.8)<0.0010.211
Proline140.4 (117.4–166.8)136.2 (113.5–163.9)148.4 (126.8–166.6)0.9110.563
Glutamate61.1 (46.7–75.9)65.2 (55.2–82.4)68.0 (48.1–79.9)0.0660.180
Ornithine72.7 (64.9–84.1)71.5 (62.0–80.9)73.7 (63.0–82.6)0.5920.970
Taurin71.9 (56.6–93.0)72.8 (56.0–89.3)63.1 (52.9–79.9)0.9370.095
Citrulline29.2 (25.0–33.9)28.1 (25.3–33.8)28.5 (23.7–31.4)0.8910.253
Alpha-amino-n-butyric acid19.8 (16.4–23.6)20.9 (17.4–26.9)22.3 (17.1–26.9)0.2860.073
Data are presented as median (range). MASLD, metabolic dysfunction-associated steatotic liver disease. MetALD, metabolic alcohol-associated liver disease. ALD, alcohol-associated liver disease.
Table 7. Multiple regression analyses of serum serine and glutamine levels and sarcopenia assessment items.
Serine
Adjusted model 1Adjusted model 2
βpR2βpR2
Phase angle−0.0570.0960.584−0.0570.0990.584
Grip strength−0.0210.5380.5870.0380.3090.599
Skeletal Muscle Index−0.0330.2510.6990.0010.9750.699
Glutamine
Adjusted model 1Adjusted model 2
βpR2βpR2
Phase angle−0.0080.8250.581−0.0080.8200.581
Grip strength0.0100.7710.5980.0240.5060.599
Skeletal Muscle Index0.0510.0920.6920.0590.0570.701
β, standardized coefficient; R2, coefficient of determination. Adjusted model 1: this multivariate analysis was adjusted for age, sex, smoking habit, exercise habit, energy intake, obesity/central obesity, hyperglycemia or diabetes, high blood pressure, high triglycerides, reduced HDL cholesterol. Adjusted model 2: adjusted for mode l plus alcohol intake.
Disclaimer/Publisher’s Note: The statements, opinions and data contained in all publications are solely those of the individual author(s) and contributor(s) and not of MDPI and/or the editor(s). MDPI and/or the editor(s) disclaim responsibility for any injury to people or property resulting from any ideas, methods, instructions or products referred to in the content.