Article

The MRI Signature of Neuroendocrine Liver Metastases: Toward a Radiologic Identikit

1
Department of Radiology, Candiolo Cancer Institute (FPO-IRCCS), Viale Della Ricerca 7, 10060 Candiolo, Italy
2
Radiology Unit, Department of Diagnostic Imaging and Interventional Radiology, A.O.U. Città Della Salute e Della Scienza di Torino, University of Torino, Via Genova 3, 10126 Turin, Italy
3
Department of Surgical Sciences, A.O.U. Città Della Salute e Della Scienza di Torino, University of Torino, Corso Bramante 88, 10126 Turin, Italy
4
Radiology Service, Mauriziano Umberto I Hospital, 10128 Turin, Italy
5
Radiology Unit, Department of Surgical Sciences, A.O.U. Città Della Salute e Della Scienza di Torino, University of Torino, Via Genova 3, 10126 Turin, Italy
*
Author to whom correspondence should be addressed.
Deceased author.
Livers 2026, 6(3), 41; https://doi.org/10.3390/livers6030041
Submission received: 18 February 2026 / Revised: 27 March 2026 / Accepted: 29 April 2026 / Published: 12 May 2026

Abstract

Background: Neuroendocrine neoplasms are frequently diagnosed after the detection of liver metastases, often when the primary tumor remains occult. Accurate non-invasive differentiation of neuroendocrine liver metastases (NELMs) from other focal hepatic lesions is therefore crucial. This study aimed to characterize the magnetic resonance imaging (MRI) features of NELMs using hepatocyte-specific contrast agents and to identify a potential radiologic “signature” that may suggest a neuroendocrine origin. Methods: This retrospective study included three cohorts: patients with histologically confirmed NELMs (n = 51; 146 lesions), patients with colorectal cancer liver metastases (n = 18; 46 lesions), and patients with benign hepatic hemangiomas (n = 28; 51 lesions). All subjects underwent standardized liver MRI with Gd-EOB-DTPA. Lesions were evaluated for size, diffusion-weighted imaging characteristics, apparent diffusion coefficient values, arterial-phase enhancement, T2-weighted signal, hepatobiliary-phase appearance, and hemorrhagic components. Statistical analyses included univariate and multivariate testing and receiver operating characteristic curve analysis. Results: NELMs commonly demonstrated arterial hyperenhancement, diffusion restriction, and variable T2 and hepatobiliary-phase signal heterogeneity. Compared with colorectal metastases and hemangiomas, NELMs showed distinctive patterns, particularly higher rates of hepatobiliary-phase heterogeneity and arterial enhancement. Lesion size, ADC metrics, T2 heterogeneity, and hemorrhage were significant discriminators. Conclusions: Hepatocyte-specific MRI enables identification of characteristic imaging features of NELMs. An integrated assessment of morphologic, diffusion, and hepatobiliary-phase findings may facilitate early recognition of neuroendocrine metastases, even when the primary tumor is unknown, improving diagnostic confidence and clinical management.

1. Introduction

Neuroendocrine neoplasms (NENs) comprise a heterogeneous group of rare tumors arising from cells with both endocrine and neural features, capable of synthesizing and secreting bioactive amines and peptides with hormonal activity. These cells are distributed throughout multiple organs―including the gastro-entero-pancreatic (GEP) tract, endocrine glands, lungs, skin, thyroid, and genitourinary system―contributing to the wide biological and clinical diversity of NENs [1,2,3].
The majority occur in the GEP tract (over 60%) and lungs (22–27%). NENs are classified as functioning when they produce hormones causing specific clinical syndromes (e.g., Cushing’s, Verner–Morrison, or Zollinger–Ellison syndromes), or non-functioning, typically asymptomatic until advanced stages [2,4].

1.1. Epidemiology and Classification

The annual incidence of NENs is below 6 cases per 100,000 people, though the rate has increased in recent years due to improved diagnostic capabilities and clinical awareness. Prevalence is estimated at under 200,000 cases, with a slight female predominance. Most NENs are sporadic, but a subset is associated with hereditary syndromes such as MEN-1, MEN-2, Von Hippel–Lindau (VHL), Neurofibromatosis type 1 (NF1), and Tuberous Sclerosis (TSC) [1,5,6].
The World Health Organization (WHO, 2022) classifies NENs into:
  • NET (neuroendocrine tumors)—well-differentiated epithelial tumors (graded G1–G3 based on Ki-67 index and mitotic count);
  • NEC (neuroendocrine carcinomas)—poorly differentiated, high-grade aggressive tumors;
  • MiNEN (mixed neuroendocrine–non-neuroendocrine neoplasms)—tumors exhibiting dual histological components.
NETs display typical “nested” or “trabecular” architecture, granular “salt-and-pepper” chromatin, and immunoreactivity for Chromogranin A (CgA) and Synaptophysin (Syn), whereas NECs show nuclear atypia, marked mitotic activity, and variable neuroendocrine marker expression [3,7,8].

1.2. Molecular Characteristics

Molecular profiling reveals site-specific genetic patterns. Pancreatic NETs frequently harbor mutations affecting the mTOR pathway (MEN1, DAXX, ATRX, PTEN, TSC2) and VEGF/HIF signaling, supporting the use of targeted inhibitors. Gastrointestinal NETs often display CDKN1B alterations, while NECs show mutations in TP53, RB1, KRAS, and SMAD4, similar to other epithelial malignancies. Medullary thyroid carcinoma (MTC) is linked to RET mutations associated with worse prognosis, and pulmonary NETs may carry FGF or KIT variants. These advances have fostered target-based therapeutic strategies [2,9].

1.3. Clinical Features and Main Subtypes

  • GEP-NETs are the most frequent, often incidentally discovered. They include appendiceal, gastric (types I–IV), duodenal (gastrinomas, somatostatinomas), and colorectal forms, managed surgically according to size and invasion.
  • Pancreatic NETs (pNETs) arise from the islets of Langerhans and may be functioning (insulinoma, gastrinoma, VIPoma, glucagonoma, somatostatinoma) or non-functioning. Treatment involves surgery, somatostatin analogs (SSA), proton-pump inhibitors, and targeted drugs (everolimus, sunitinib) for advanced disease.
  • Pulmonary NETs (~25% of primary lung tumors) include typical and atypical carcinoids (low/intermediate grade), and high-grade forms (LCNEC and SCLC). Management ranges from conservative surgery to chemoradiotherapy.
  • Genitourinary and rare NETs originate in the bladder, ovaries, cervix, or prostate and are typically aggressive; therapy includes surgery and multimodal systemic approaches [1,3,10].

1.4. Functional Syndromes

The carcinoid syndrome (CS) is the most common functional manifestation, mainly in intestinal and pulmonary NETs, caused by excessive serotonin secretion. It presents with flushing, diarrhea, bronchospasm, and right-sided valvular fibrosis. Diagnosis relies on urinary 5-HIAA and serum CgA; treatment includes SSA and tumor-debulking strategies. Acute carcinoid crises during surgery require specialized management [3,11].

1.5. Hepatic Metastases and Prognosis

The liver is the predominant site of metastasis, affecting 30–90% of patients and representing the main survival determinant. Based on Frilling’s classification, hepatic metastases are categorized as
  • Type I: single, resectable;
  • Type II: dominant lesion with smaller satellites;
  • Type III: diffuse bilobar involvement.
Treatment options include surgical resection, local ablation, trans-arterial embolization (TAE) or radioembolization (TARE), and liver transplantation in selected cases [2,12,13].

1.6. Diagnosis and Staging

Diagnosis requires an integrative assessment combining clinical features, biochemical markers, histopathology, and multimodal imaging. Key biomarkers include CgA, 5-HIAA, NT-proBNP, and hormone assays (gastrin, insulin, VIP, glucagon) [14,15].
Triphasic CT and high-resolution MRI are essential morphological tools, while endoscopic ultrasound (EUS) is the most sensitive for pNETs [8,9,10,11,12,13,14,15,16,17,18,19,20].
Functional imaging with 68Ga-DOTA-peptide PET/CT is now the gold standard for well-differentiated NETs, whereas 18F-FDG PET/CT is preferred for high-grade NECs, with both aiding in therapy selection (e.g., PRRT candidates) [2,3,4,5,6,7,8,9,10,11,12,13,14,15,16,17,18,19,20,21].

1.7. Therapeutic Management

NEN management is personalized and multidisciplinary, depending on primary site, grade, and hormonal activity. Treatment strategies include
  • Curative or debulking surgery when feasible;
  • Locoregional therapies (embolization, ablation, TARE);
  • Systemic therapies (chemotherapy, mTOR, and VEGF inhibitors);
  • Somatostatin analogs and PRRT for symptom and tumor control;
  • Liver transplantation in selected advanced cases.
Symptomatic control (flushing, diarrhea, hypoglycemia) often requires SSA, telotristat, serotonergic antagonists, proton-pump inhibitors, and other specific agents [2,22].

1.8. Clinical Features and Imaging Importance

Clinically, NENs present a wide range of behaviors, from indolent, slow-growing lesions to rapidly progressive, high-grade malignancies. The liver is the most frequent site of metastatic spread, observed in up to 90% of patients with advanced disease, and the extent of hepatic involvement is a key prognostic factor [2,15,18,23].
Hepatic metastases may be the first clinical manifestation of an otherwise occult neuroendocrine tumor, often identified incidentally during imaging performed for unrelated reasons. Early and accurate detection of these secondary lesions is essential, as treatment strategies—ranging from surgical resection with curative intent to locoregional or systemic therapies—depend heavily on the burden and distribution of hepatic disease [24,25].
Radiology plays a pivotal role throughout the diagnostic pathway. Cross-sectional imaging not only assists in identifying metastatic disease but also guides the search for the primary tumor, staging, and follow-up. Among imaging modalities, magnetic resonance imaging (MRI) is particularly valuable thanks to its superior soft-tissue contrast, functional capabilities, and absence of radiation exposure. Its sensitivity in detecting neuroendocrine liver metastases (NELMs) is consistently higher than CT, particularly when hepatobiliary contrast agents are used [4,26,27].

1.9. MRI Features of Neuroendocrine Liver Metastases

Contrast-enhanced MRI enables detailed assessment of the vascular and tissue characteristics of hepatic lesions. NELMs are typically hypervascular, demonstrating intense enhancement during the arterial phase and varying degrees of washout in later phases. In the hepatobiliary phase, they appear hypointense relative to the surrounding parenchyma, reflecting the absence of functioning hepatocytes and impaired uptake of hepatospecific contrast agents [6,12,28].
However, differential diagnosis can be challenging. These lesions may occasionally mimic both benign vascular entities—such as cavernous hemangiomas—and malignant metastases of other origins, most commonly from colorectal cancer. Overlapping imaging appearances can make a confident diagnosis difficult, especially in patients with unknown primary tumors [4,7,29].
MRI with hepatocyte-specific contrast agents (such as Gd-EOB-DTPA) has therefore become a key problem-solving tool for characterizing indeterminate hepatic lesions detected on ultrasound or CT. In younger patients, who represent the age group in which NETs arise more frequently, hepatobiliary MRI is often chosen as a first-line modality to better define focal findings while minimizing radiation exposure.
The non-invasive differentiation of NELMs from other common focal liver lesions has significant clinical implications. The identification of specific imaging patterns that may suggest a neuroendocrine origin could help expedite diagnosis, reduce the need for invasive procedures, and guide appropriate further imaging or targeted therapy [23,27,30].

1.10. Rationale and Aim of the Study

A substantial proportion of neuroendocrine tumors are first diagnosed after the detection of liver metastases, whereas the primary tumor remains occult. Accurate recognition of the metastatic pattern and reliable differentiation from other benign or malignant focal lesions are therefore essential.
The present study aims to characterize the MRI features of hepatic metastases from neuroendocrine tumors using hepatocyte-specific contrast agents, analyzing enhancement behavior and signal characteristics across different imaging phases. Findings will be compared with those of typical benign liver lesions, particularly cavernous hemangiomas, and with malignant metastases from non-neuroendocrine primaries, such as colorectal carcinoma.
The goal is to identify distinctive MRI signal and enhancement patterns that could suggest the neuroendocrine nature of the lesion, thus enabling radiologists to recognize possible NEN secondaries even in patients with unknown primaries. Developing a potential MRI “signature” or radiologic profile of neuroendocrine liver metastases could improve lesion characterization, assist in directing further diagnostic work-up, and ultimately support optimal clinical management.
By refining the understanding of NELM behavior on hepatocyte-specific MRI, this study seeks to strengthen the role of radiology in the early detection and non-invasive differentiation of neuroendocrine metastases from other focal hepatic lesions, providing valuable insights for everyday clinical practice.

2. Materials and Methods

2.1. Patient Selection

Three study populations were retrospectively identified:
  • Patients with neuroendocrine neoplasms (NENs) and histologically confirmed hepatic metastases;
  • Patients with colorectal cancer, also with histologically confirmed hepatic metastases;
  • Patients with benign hepatic hemangiomas.
The inclusion criteria and specific characteristics of each cohort are described below.

2.2. Cohort 1: Hepatic Metastases from Neuroendocrine Tumors (NETs)

This cohort included patients with histologically proven neuroendocrine tumors (confirmed either on surgical specimens or diagnostic histologic samples in non-surgical patients) and histologically confirmed hepatic metastases (based on surgical or biopsy findings).
Patients were followed at two tertiary referral centers:
  • Center 1: Azienda Ospedaliero–Universitaria “Città della Salute e della Scienza di Torino”, Presidio Molinette;
  • Center 2: Azienda Ospedaliera “Ordine Mauriziano di Torino”.
All patients underwent upper-abdominal MRI with hepatocyte-specific contrast agent (Gd-EOB-DTPA, Primovist, Bayer SpA, Milan, Italy) using a standardized liver protocol during the following periods:
  • Center 1: from 29 September 2016 to 26 September 2024
  • Center 2: from 31 December 2018 to 2 August 2024.
Exclusion criteria were:
  • presence of neuroendocrine tumor without hepatic involvement;
  • absence of MRI examination;
  • MRI performed without hepatocyte-specific contrast media;
  • lack of histologic confirmation of either the primary tumor or hepatic metastases;
  • absence of MRI prior to systemic therapies (e.g., somatostatin analogs).
Patients who developed hepatic metastases during follow-up after initial diagnosis and therapy were included if all the above criteria were fulfilled.
The final study population consisted of 51 patients (23 from Center 1 and 28 from Center 2; 27 women and 24 men), with a mean age of 58 ± 13 years and a total of 146 hepatic NET metastases identified. In 41% of cases (21/51), hepatic metastases represented the first incidental finding of disease on previous ultrasound or CT examinations performed for unrelated reasons.

2.3. Cohort 2: Hepatic Metastases from Colorectal Cancer

This comparative group included a limited sample of patients with histologically confirmed colorectal carcinoma (based on endoscopic biopsy or surgical specimen) and histologically confirmed hepatic metastases, followed at the Azienda Ospedaliero–Universitaria “Città della Salute e della Scienza di Torino”, Presidio Molinette.
All patients underwent an upper-abdominal MRI with Gd-EOB-DTPA (Primovist) as part of their initial staging work-up, using a dedicated protocol for liver evaluation.
The cohort included 18 patients (7 women and 11 men; 46 hepatic lesions in total). The primary tumors originated from the colon in 11 patients and from the rectum in 9 patients.

2.4. Cohort 3: Benign Hepatic Hemangiomas

The control group consisted of patients with angiomatous liver lesions, examined at the same institution (Center 1). All underwent upper-abdominal MRI with Gd-EOB-DTPA (Primovist) using the same hepatobiliary protocol.
The cohort included 28 patients (22 women, 6 men) with a total of 51 angiomatous liver lesions, classified as
  • 44 cavernous hemangiomas (9 with thrombosed appearance);
  • 7 capillary hemangiomas.

2.5. MRI Protocol and Image Analysis

All examinations were performed on 1.5 T MRI scanners (Achieva, Philips Medical Systems, Center 1; and Ingenia, Philips Medical Systems, Center 2), using phased-array body coils and the following standardized protocol:
  • Axial T1-weighted gradient-echo (in-phase and out-of-phase) sequences;
  • Axial fat-suppressed 3D T1-weighted gradient-echo (THRIVE) sequences acquired before and after intravenous Gd-EOB-DTPA (Primovist) injection in a multiphasic dynamic protocol;
  • T2-weighted turbo spin-echo (TSE) sequences acquired on axial and coronal planes: TR = 10,498 ms (Center 1), 9171 ms (Center 2); TE = 80 ms (both), with and without fat suppression;
  • Diffusion-weighted imaging (DWI) sequences acquired with multiple b-values:
    Center 1: 0, 50, 600, 1000 s/mm2,
    Center 2: 0, 300, 600, 800 s/mm2,
    • Corresponding ADC maps were automatically generated (50–1000 and 0–800 range, respectively).
  • Delayed hepatobiliary-phase T1-weighted fat-suppressed gradient-echo sequences (axial and coronal) acquired ~20 min after injection (flip angle = 20° for Center 1, 10° for Center 2).
For image analysis, the following datasets were reviewed for each patient: axial T1-weighted, T2-weighted, DWI, ADC maps, and THRIVE images acquired in both the arterial and hepatobiliary phases.
The parameters evaluated for each lesion were as follows (for NET metastases):
  • hepatic segment (Couinaud classification, S1–S8);
  • lesion size (mm);
  • DWI signal increase (absent = 0, present = 1);
  • ADC value and ADC ratio (lesion/adjacent liver);
  • presence of arterial-phase wash-in (present = 1, absent = 0);
  • T2-weighted signal intensity (homogeneous = 0, heterogeneous = 1);
  • hepatobiliary-phase signal intensity (homogeneous = 0, heterogeneous = 1);
  • evidence of hemorrhage on T1-weighted images (absent = 0, present = 1).
For colorectal metastases, similar features were recorded—segment location, size, DWI signal, arterial wash-in, T2 and hepatobiliary signal patterns, and presence of hemorrhagic components.
For hemangiomas: parameters included segment location, size, DWI signal, presence of typical centripetal enhancement pattern (“nodular peripheral enhancement with progressive fill-in”) in dynamic phases (present = 1, absent = 0), T2 and hepatobiliary-phase signal intensity, and presence of hemorrhage (present = 1, absent = 0).

2.6. Statistical Analysis

Statistical analysis was performed using Microsoft Excel (Microsoft, MacOS) and StatPlus for Mac, version 8.0 (AnalystSoft Inc., Walnut, CA, USA).
  • Continuous variables were tested for normality using the Shapiro–Wilk test. Normally distributed variables were expressed as mean ± standard deviation and compared using Student’s t-test. Variables with non-Gaussian distribution were expressed as median (Q1–Q3) and compared using the Mann–Whitney U-test. Results were visualized using box plots.
  • Categorical variables (binary 0/1 and multi-class) were expressed as a number (percentage). Dichotomous variables were analyzed in 2 × 2 contingency tables via the chi-square test with Yates’ correction or Fisher’s exact test when appropriate. Larger contingency tables (RxC) for multi-class variables were analyzed using the chi-square test.
    Agreement between two binary distributions was assessed using Cohen’s Kappa coefficient.
  • For continuous variables that demonstrated statistical significance, discriminatory ability between two conditions was evaluated using receiver operating characteristic (ROC) curve analysis, plotting sensitivity versus (1 − specificity).
    The area under the curve (AUC) quantified diagnostic performance: values > 0.75 were considered indicative of good discriminative power.
    The optimal cutoff between conditions corresponded to the value maximizing both the harmonic mean (HRM) and Youden’s index (J = sensitivity + specificity − 1), while minimizing the Euclidean distance (D2 = (1 − SNS)2 + (1 − SPC)2) from the upper-left corner (0, 1) of the ROC plot.
  • Variables that remained statistically significant after univariate testing were entered into a multivariate binary logistic regression model, yielding p-values, odds ratios (OR), and 95% confidence intervals (CI).
    Statistical significance was defined as p < 0.05 and an OR 95% CI not including 1.

3. Results

3.1. Descriptive Statistics

  • Cohort 1—Neuroendocrine Tumor (NET) Liver Metastases (Figure 1)
The NET cohort consisted of 51 patients (27 women, 53%; 24 men, 47%) with a mean age of 58 ± 13 years.
A total of 146 hepatic metastatic lesions were analyzed: 72 (49%) originated from small-bowel (ileal) primaries, 54 (37%) from pancreatic primaries, and 20 (14%) from other sites (including medullary thyroid carcinoma, atypical pulmonary carcinoid, one gastric NET, and one occult primary tumor).
Based on histopathologic grading, 15 patients had G1, 32 patients had G2, and four patients had G3 tumors, with a median Ki-67 of 4% (IQR: 2.1–10). In 21 of 51 patients (41%), the hepatic metastases represented an incidental first manifestation of disease on imaging (ultrasound or CT performed for unrelated reasons).

3.2. Lesion Characteristics

  • Median lesion size: 10.5 mm (IQR 7–16.5).
  • Diffusion restriction was observed in 124 lesions (85%).
  • Median ADC value: 0.755 × 10⁻³ mm2/s (IQR 0.65–0.89).
  • Median ADC ratio (lesion/liver): 0.59 (IQR 0.5–0.72).
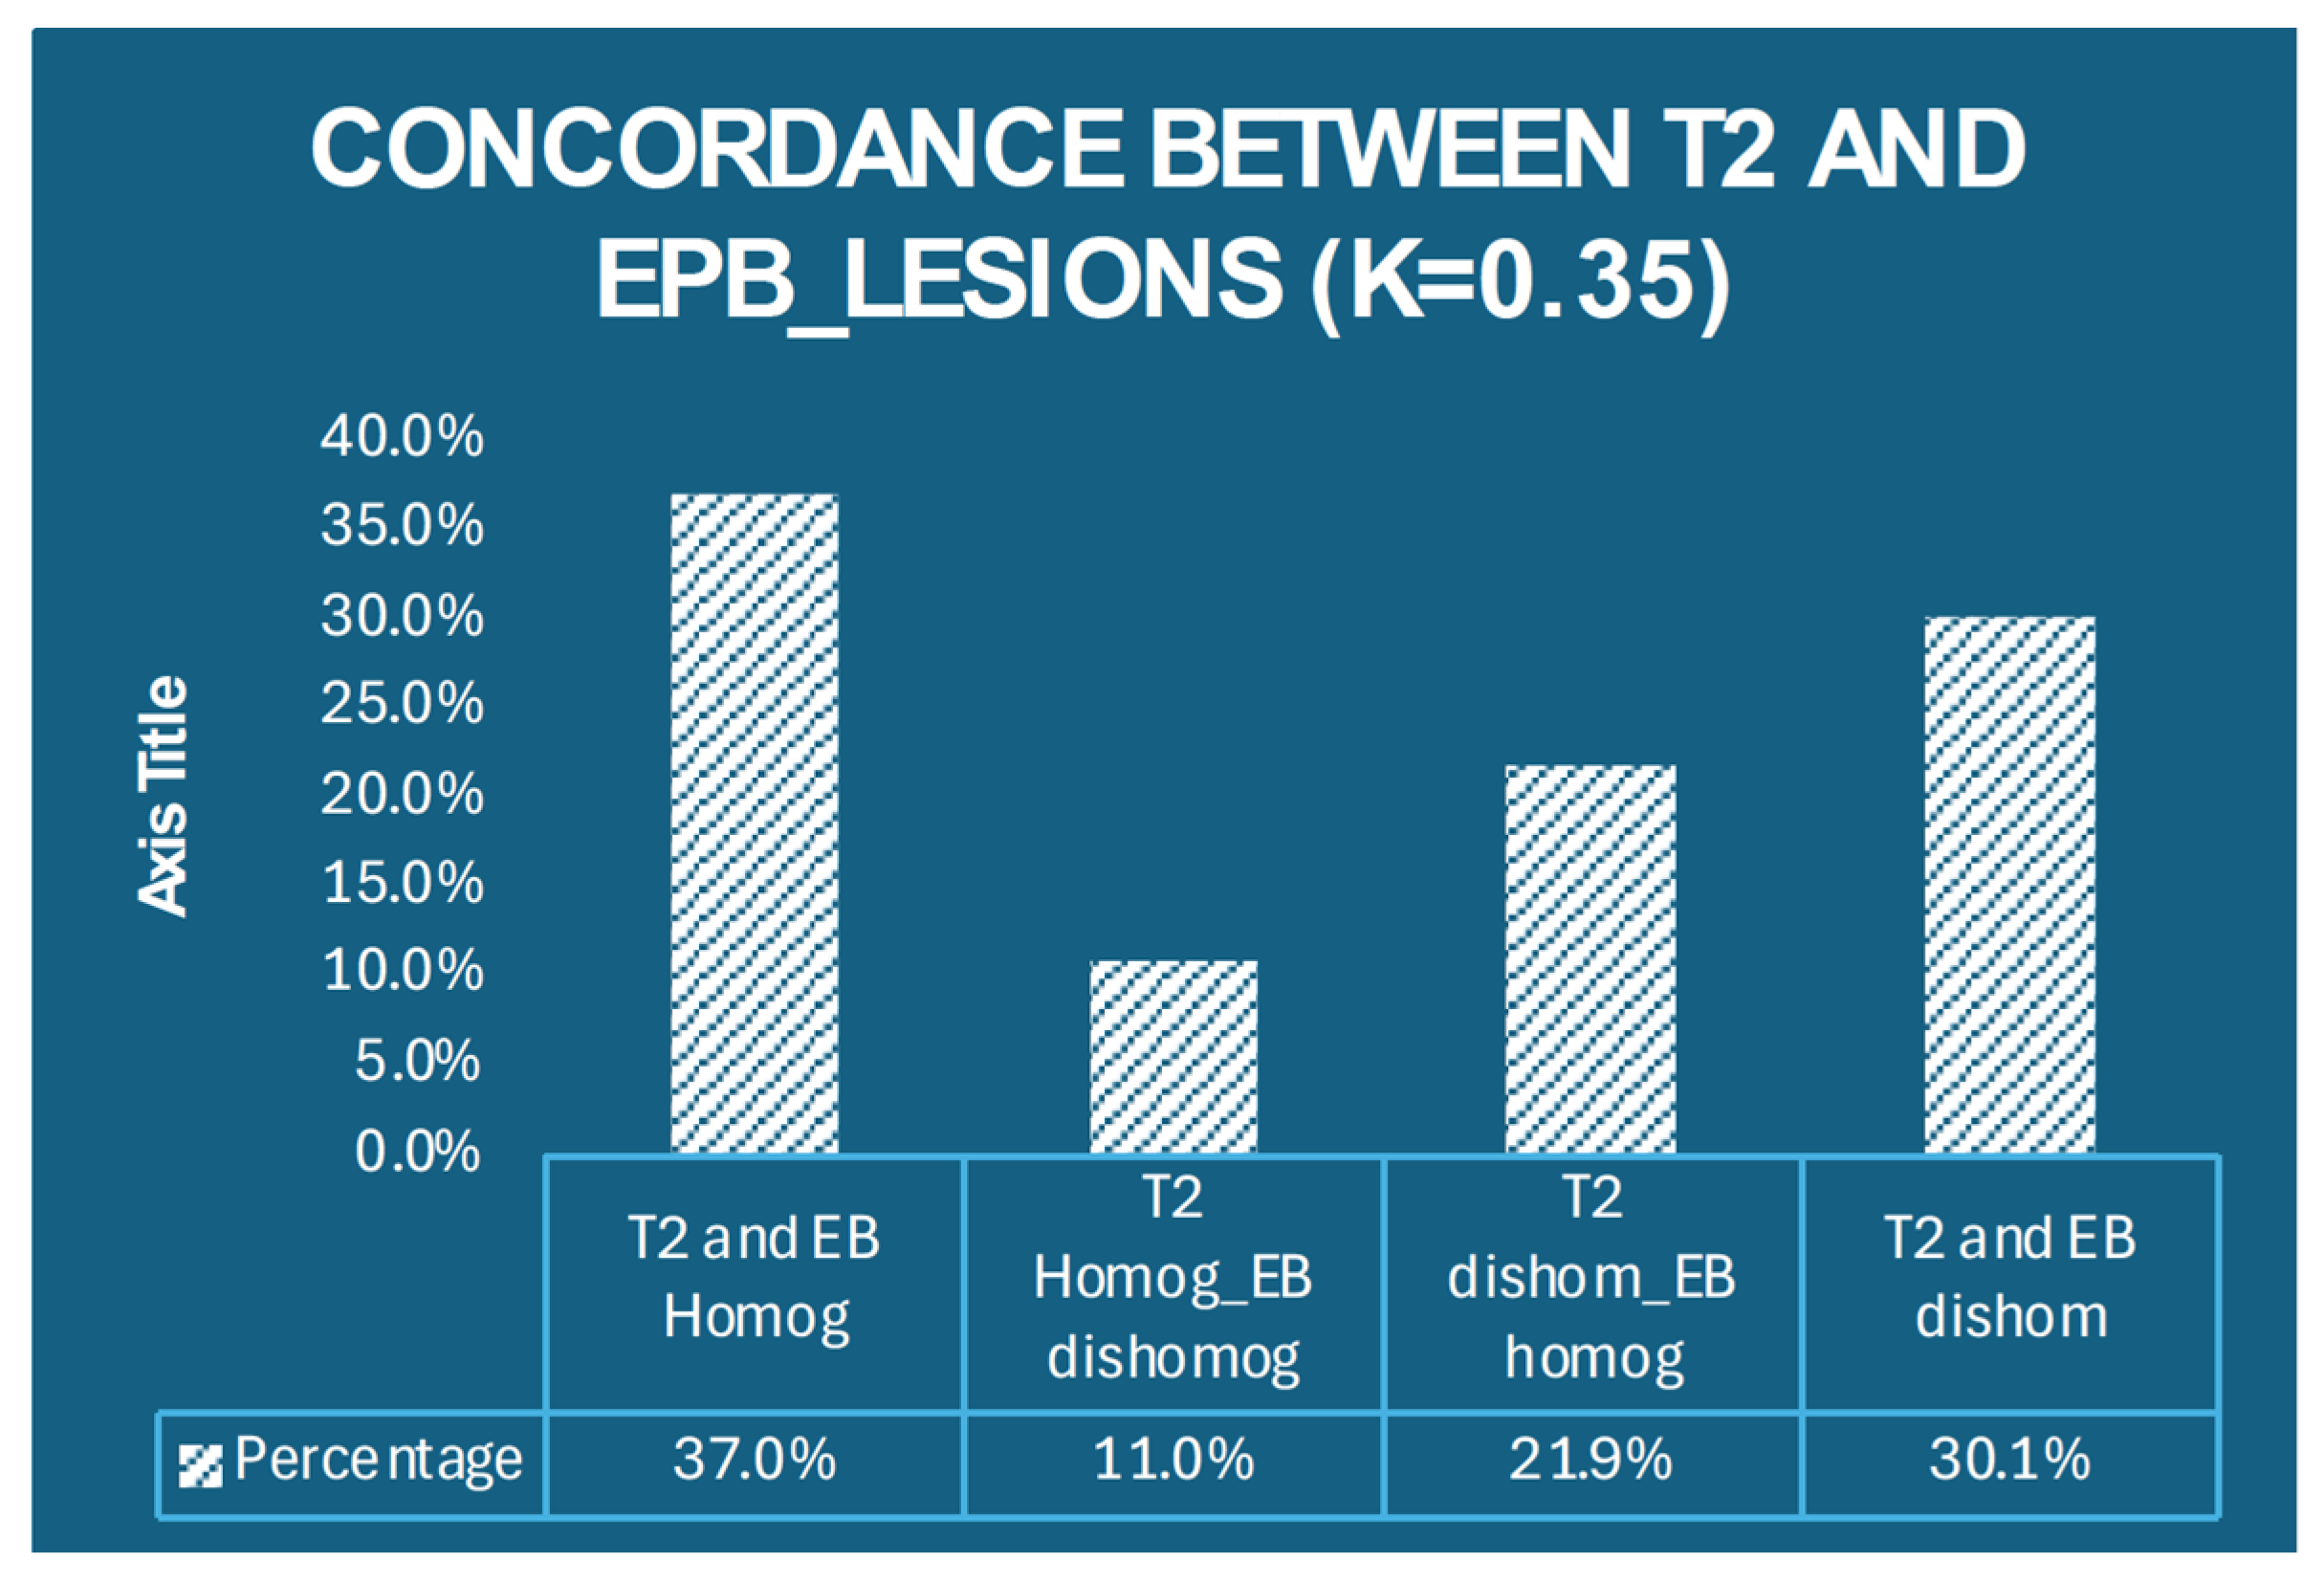
Regarding signal characteristics, 76 lesions (52%) demonstrated heterogeneous signal on T2-weighted imaging, and 60 lesions (41%) showed heterogeneous signal in the hepatobiliary phase (HBP).
Agreement between these dichotomous variables, assessed using Cohen’s Kappa coefficient, was 0.35, indicating moderate concordance between T2 and HBP signal homogeneity.
Signs of intralesional hemorrhage were observed in 17 lesions (12%), while 84 lesions (58%) exhibited homogeneous arterial-phase enhancement.
  • Cohort 2—Colorectal Cancer Liver Metastases (Figure 2)
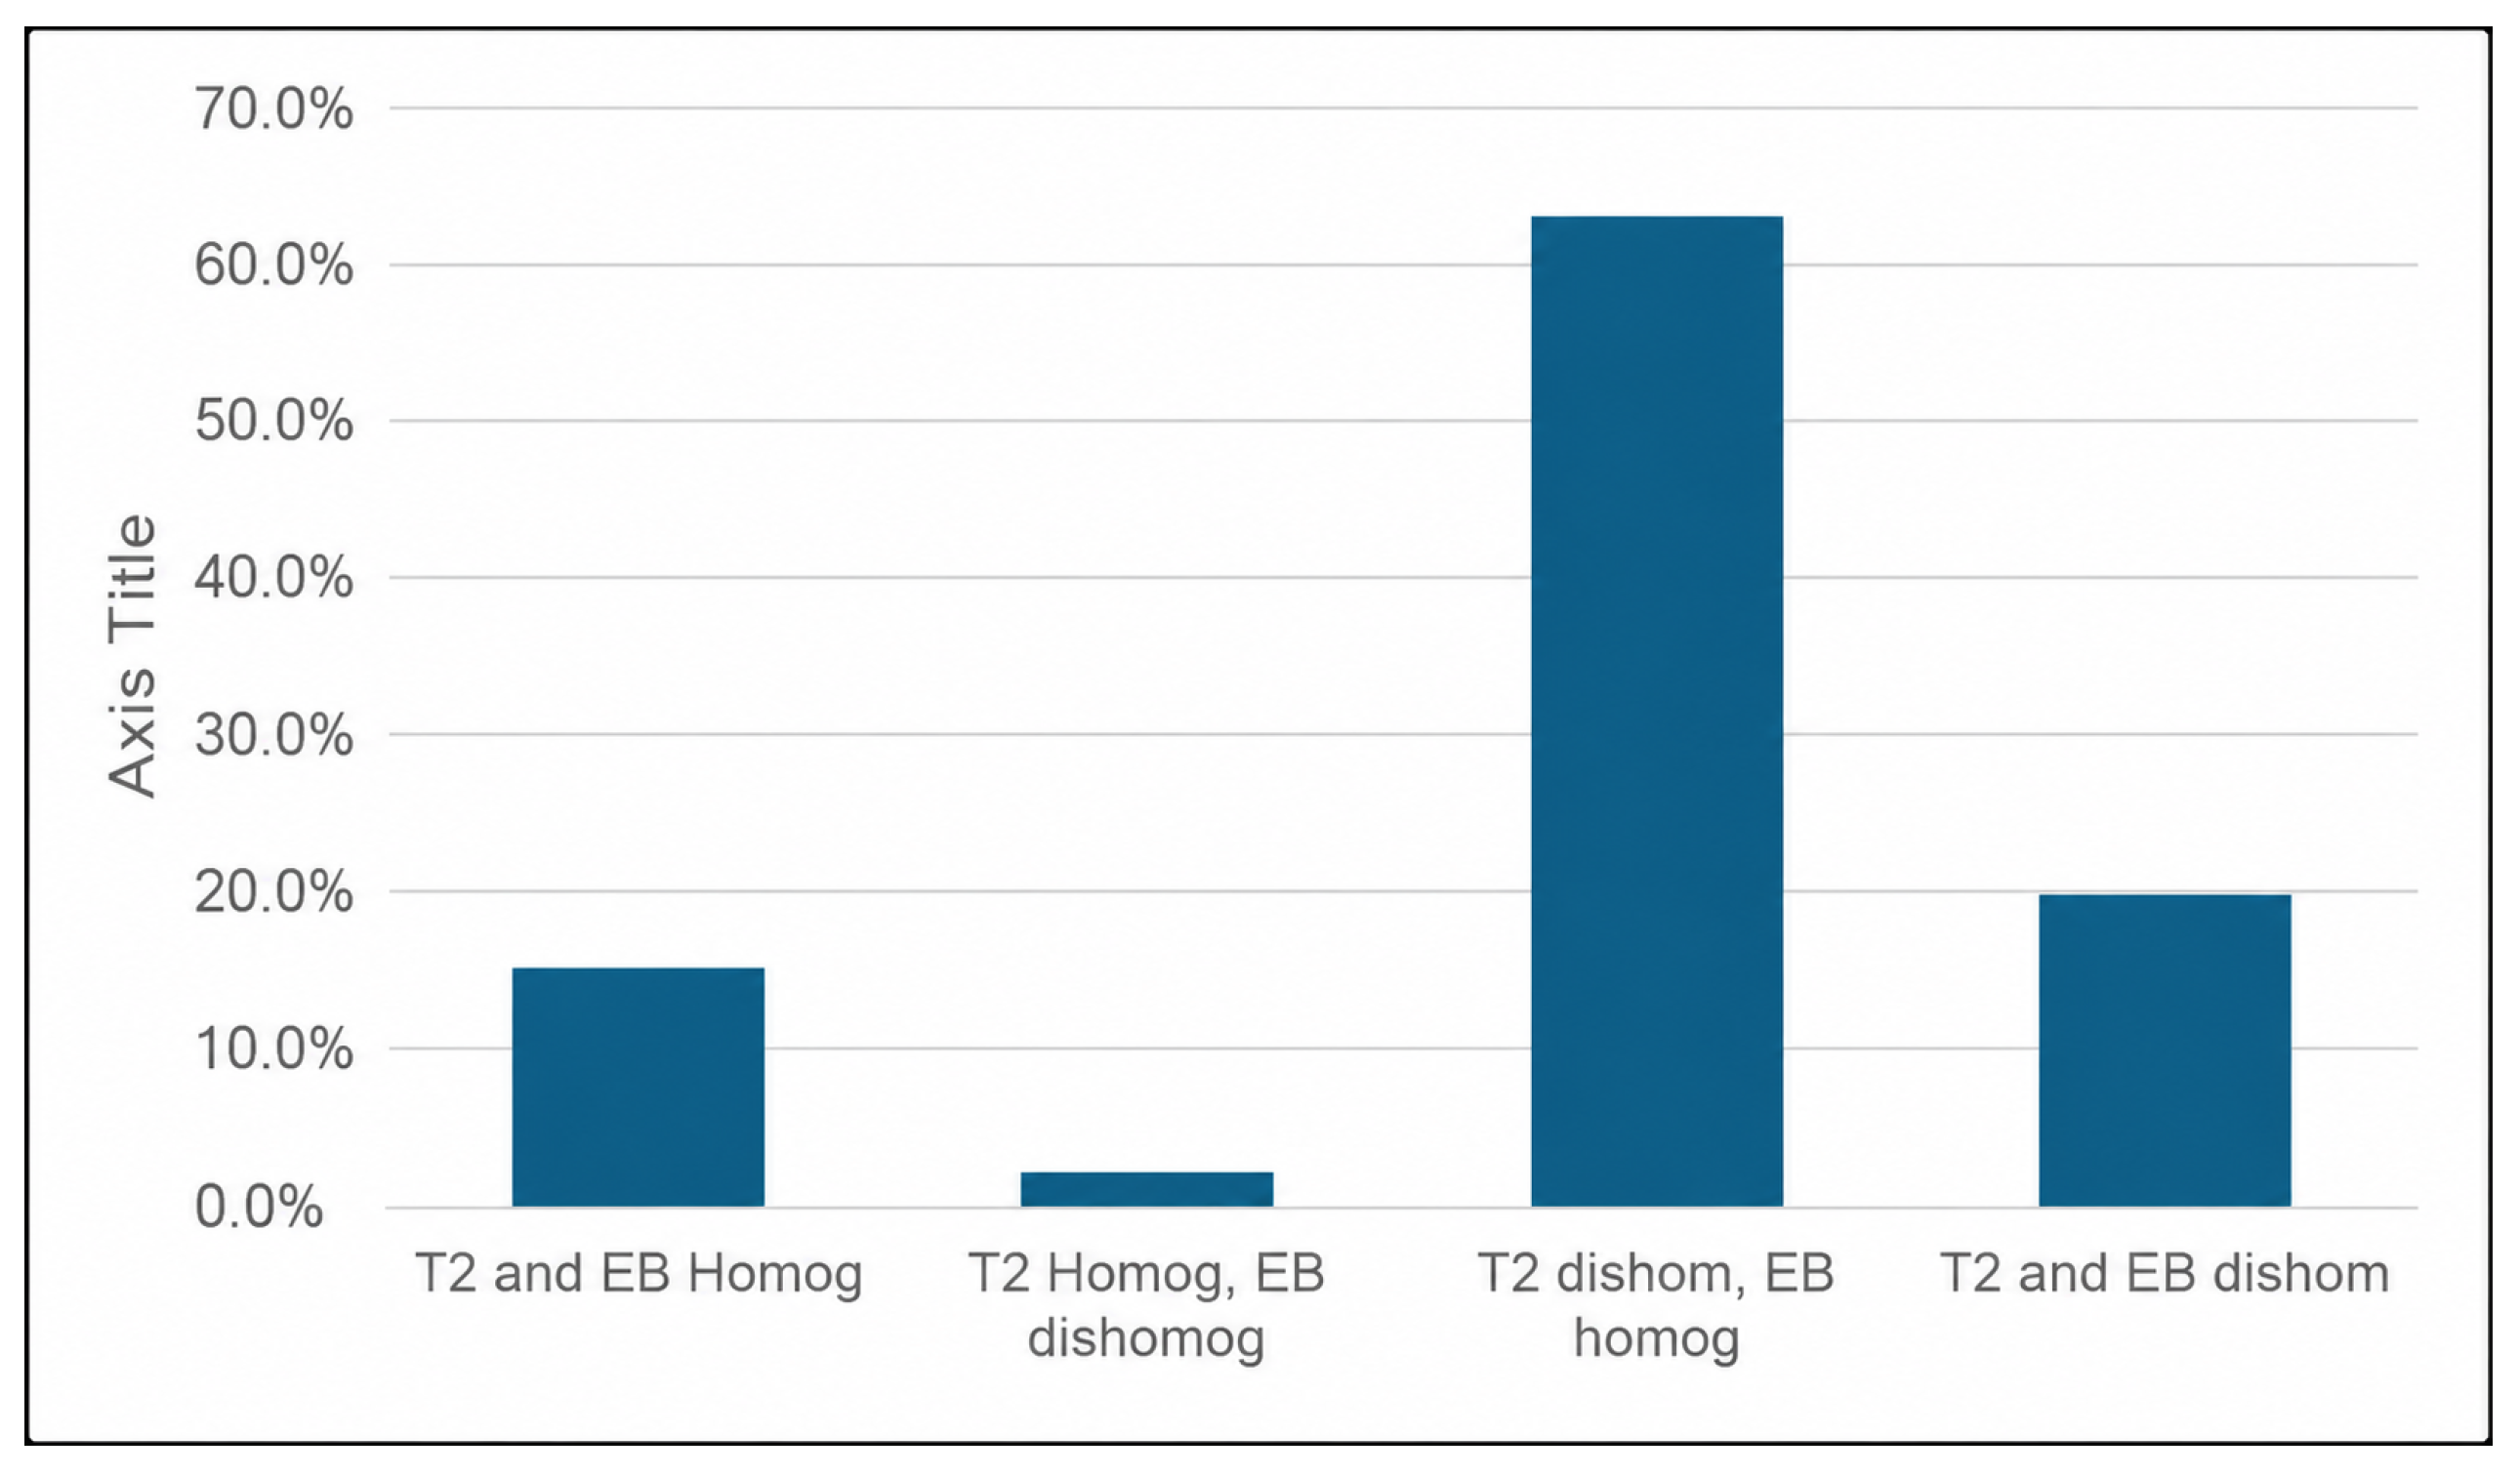
Figure 2. Concordance between T2 signal characteristics and the hepatobiliary phase in colorectal cancer liver metastases (κ = 0.05).
Livers 06 00041 g002
The second study cohort comprised 46 hepatic metastases from 18 patients with colorectal carcinoma.
Median lesion size was 16 mm (IQR 9.25–25.25).
All lesions (100%) exhibited restricted diffusion on DWI, and T2-weighted heterogeneity was observed in 38 lesions (83%).
In the hepatobiliary phase, 10 lesions (22%) appeared heterogeneous, with poor agreement between T2 and HBP homogeneity (Cohen’s Kappa = 0.05).
T1-weighted heterogeneity due to hemorrhage was identified in five lesions (11%).
No lesion (100%) demonstrated arterial-phase enhancement.
  • Cohort 3—Hepatic Hemangiomas (Figure 3)
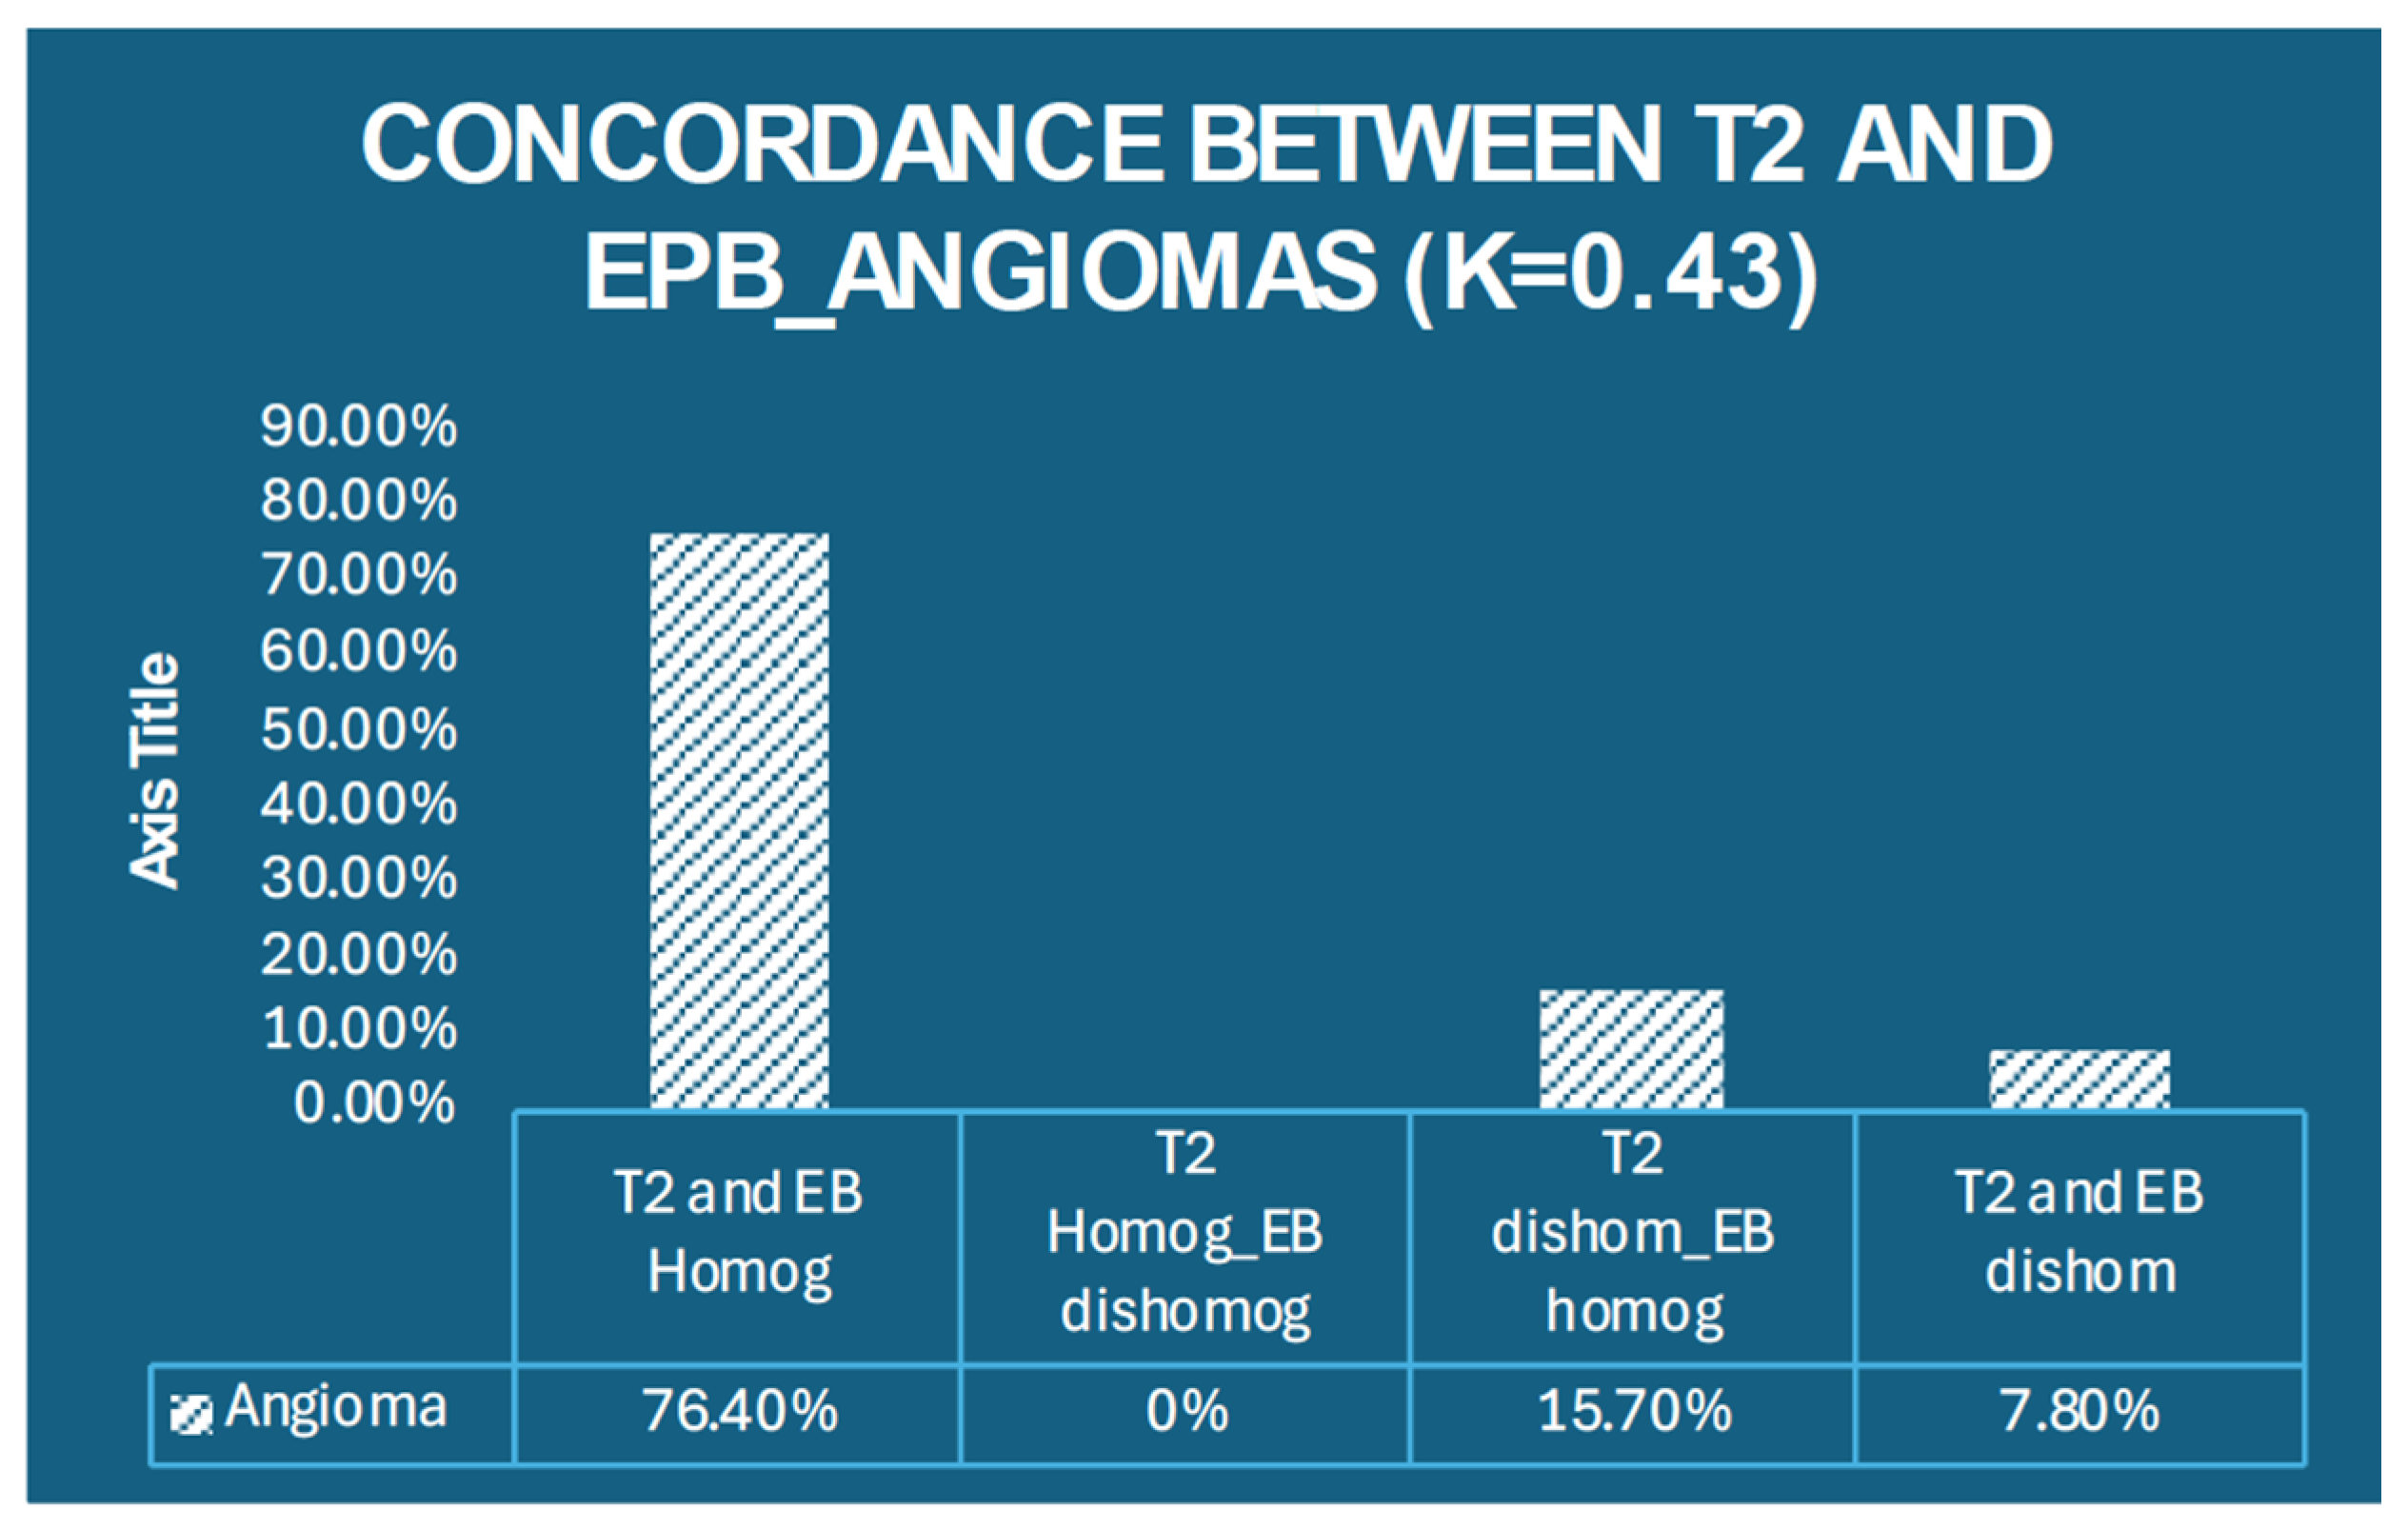
Figure 3. Concordance between T2 signal characteristics and the hepatobiliary excretory phase in hemangiomas (κ = 0.43).
Livers 06 00041 g003
The control group comprised 51 angiomatous hepatic lesions from 28 patients, including 7 capillary (14%) and 44 cavernous hemangiomas (nine thrombosed).
Median lesion size was 20 mm (IQR 10–39.5).
None of the lesions (0%) demonstrated diffusion restriction on DWI.
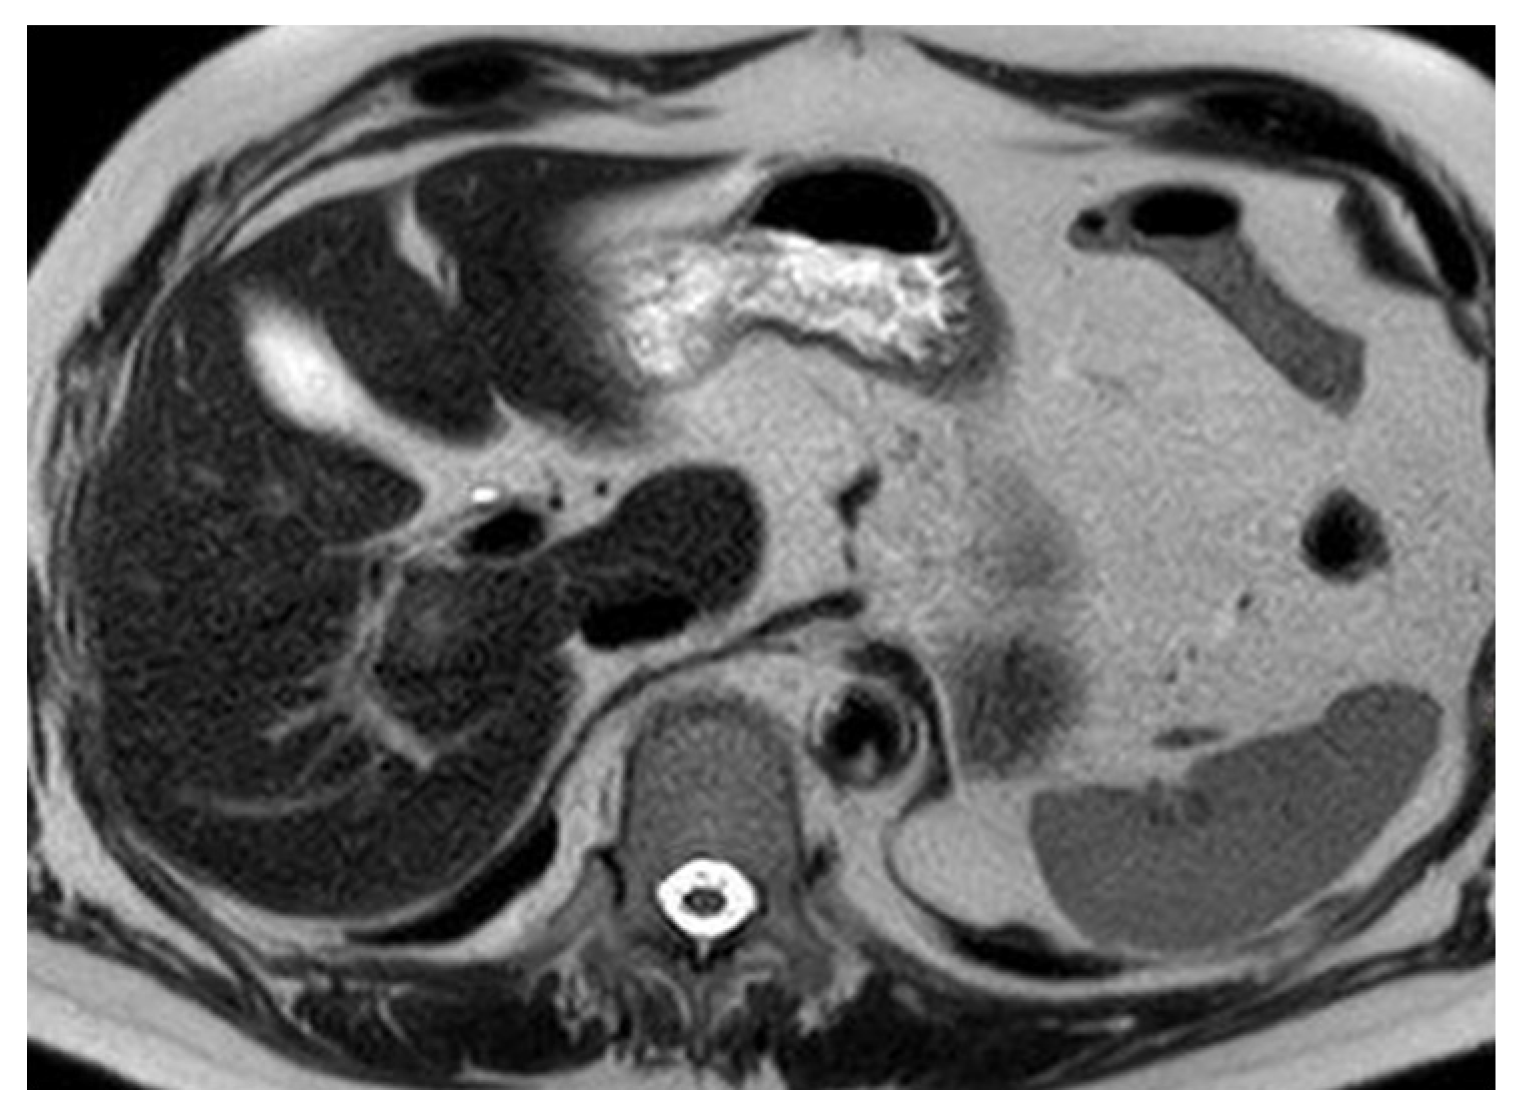
T2-weighted heterogeneity was seen in 17 lesions (34%), and hepatobiliary-phase heterogeneity in 12 lesions (24%), with moderate agreement between these variables (Cohen’s Kappa = 0.43, Figure 4).
Hemorrhage signs were reported in four cases (8%), and the typical peripheral nodular, centripetal enhancement pattern of cavernous hemangioma was evident in 44 lesions (86%).

3.3. Univariate Analysis (Figure 5, Figure 6 and Figure 7)

Univariate analysis was performed by grouping the 146 NET lesions according to T2-weighted signal homogeneity (homogeneous n = 70, heterogeneous n = 76) and comparing all other MRI parameters.
Statistically significant differences (p < 0.05) were found for:
  • Lesion size (p < 0.0001): median 13 mm in heterogeneous lesions vs. 9 mm in homogeneous ones.
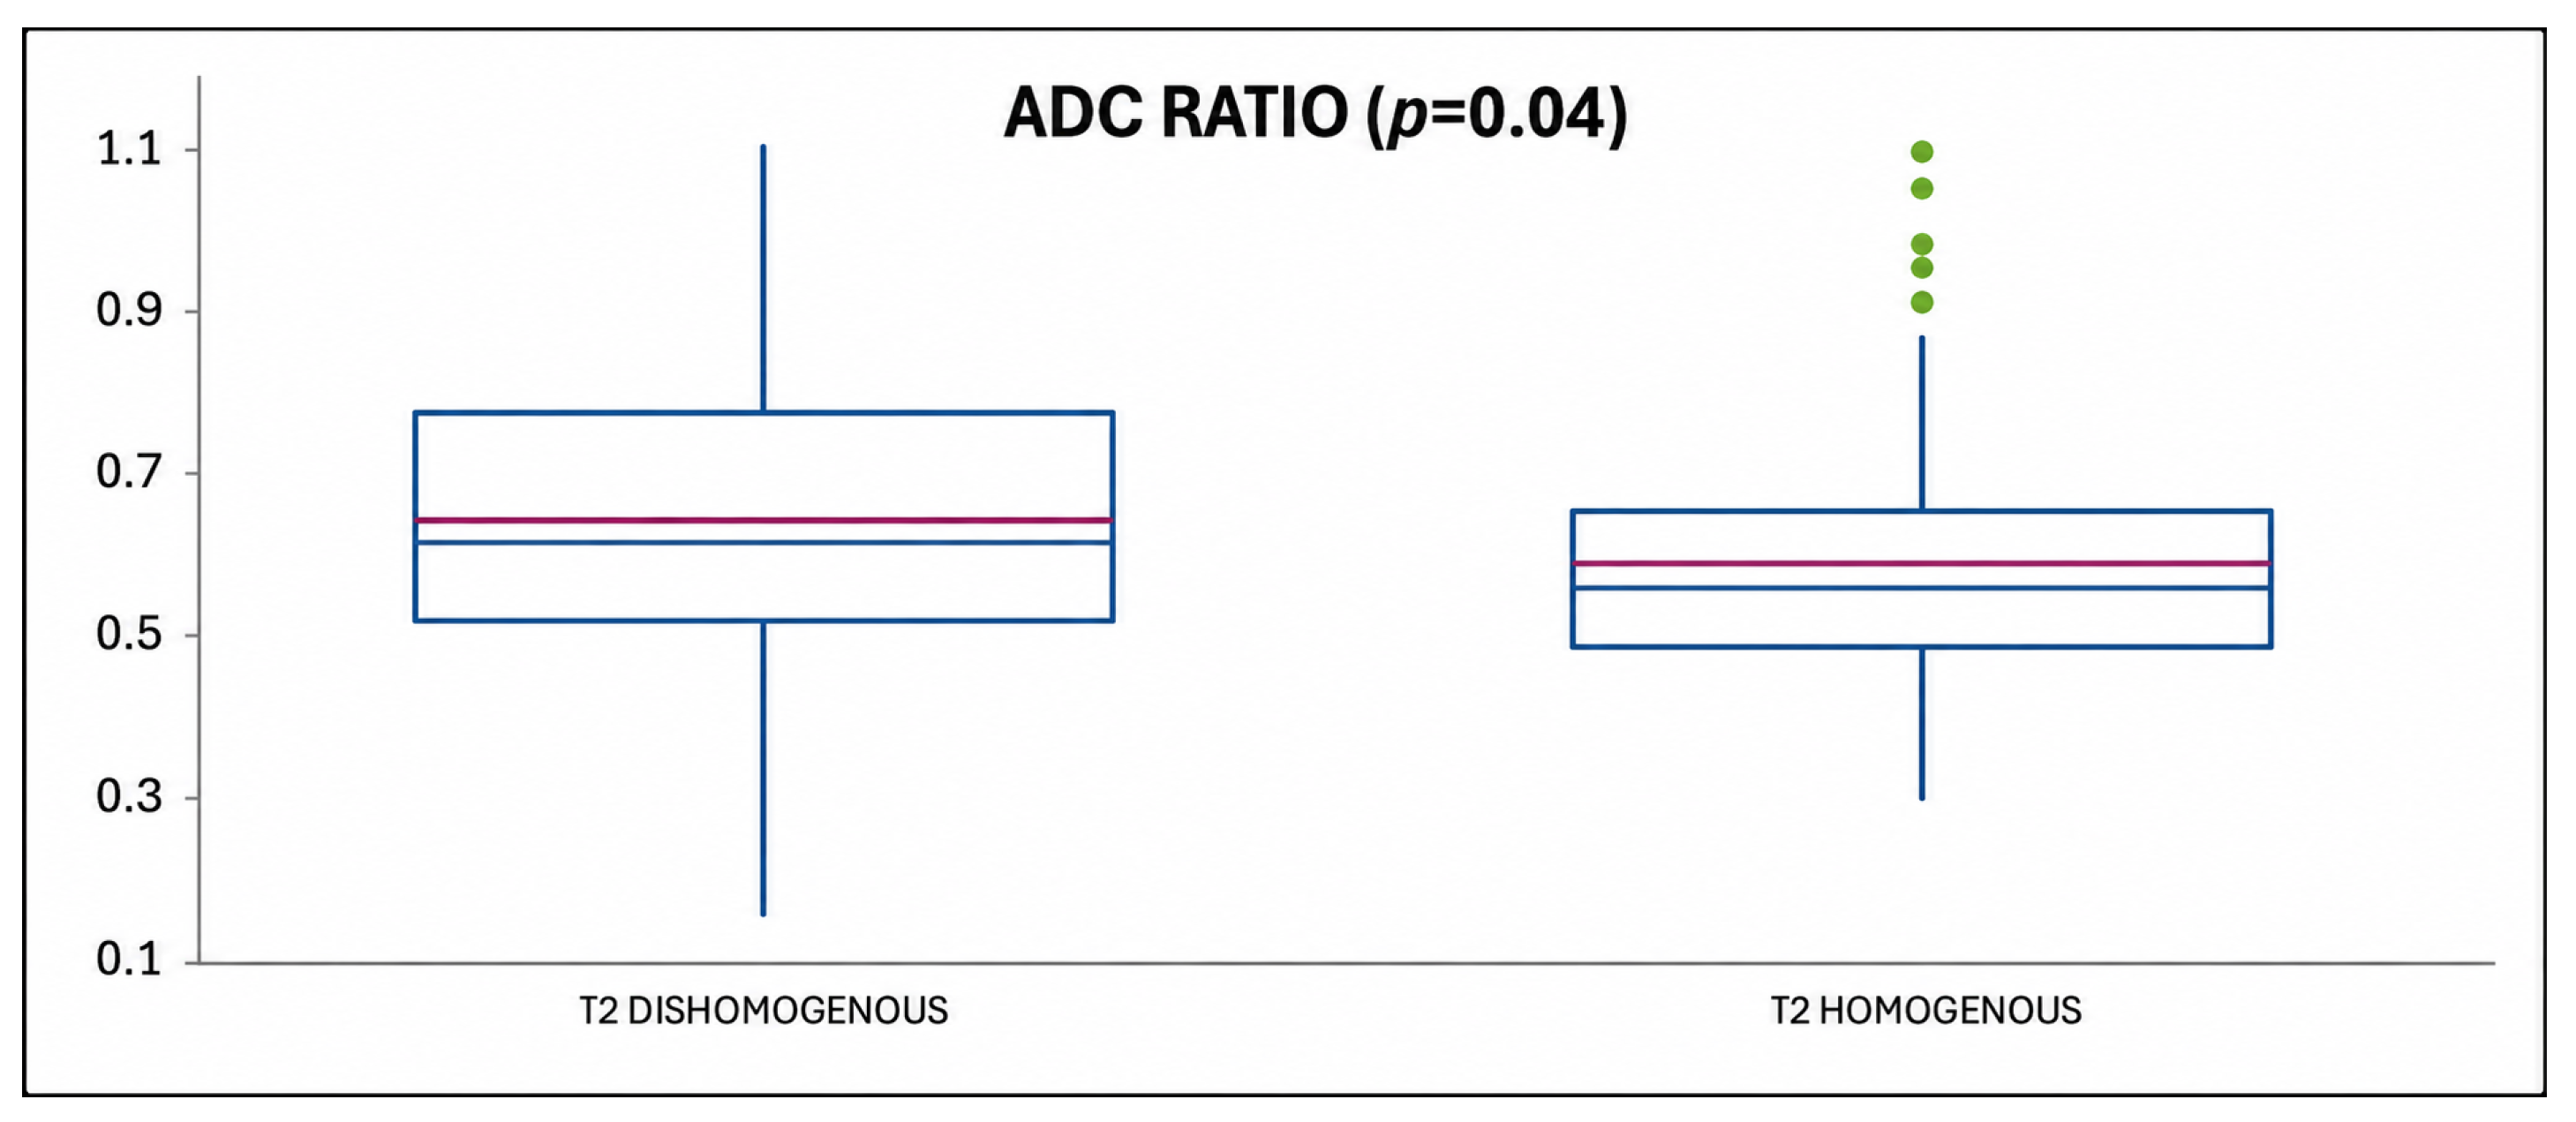
  • ADC ratio (p = 0.04): median 0.615 (mean 0.644) in heterogeneous vs. median 0.555 (mean 0.587) in homogeneous lesions (Figure 8).
  • Hepatobiliary-phase signal heterogeneity (p < 0.0001): dis-homogeneous in 58% of T2-heterogeneous lesions vs. 23% of T2-homogeneous ones.
  • Presence of hemorrhage (p < 0.0001): 21% in T2-heterogeneous lesions vs. 1% in homogeneous lesions.
When classifying NET lesions according to hepatobiliary-phase (HBP) signal (homogeneous n = 86, heterogeneous n = 60), significant differences (p < 0.05) were found for:
  • Lesion size (p = 0.001): median 14 mm (heterogeneous HBP) vs. 10 mm (homogeneous HBP).
  • Diffusion restriction (DWI) presence (p = 0.01).
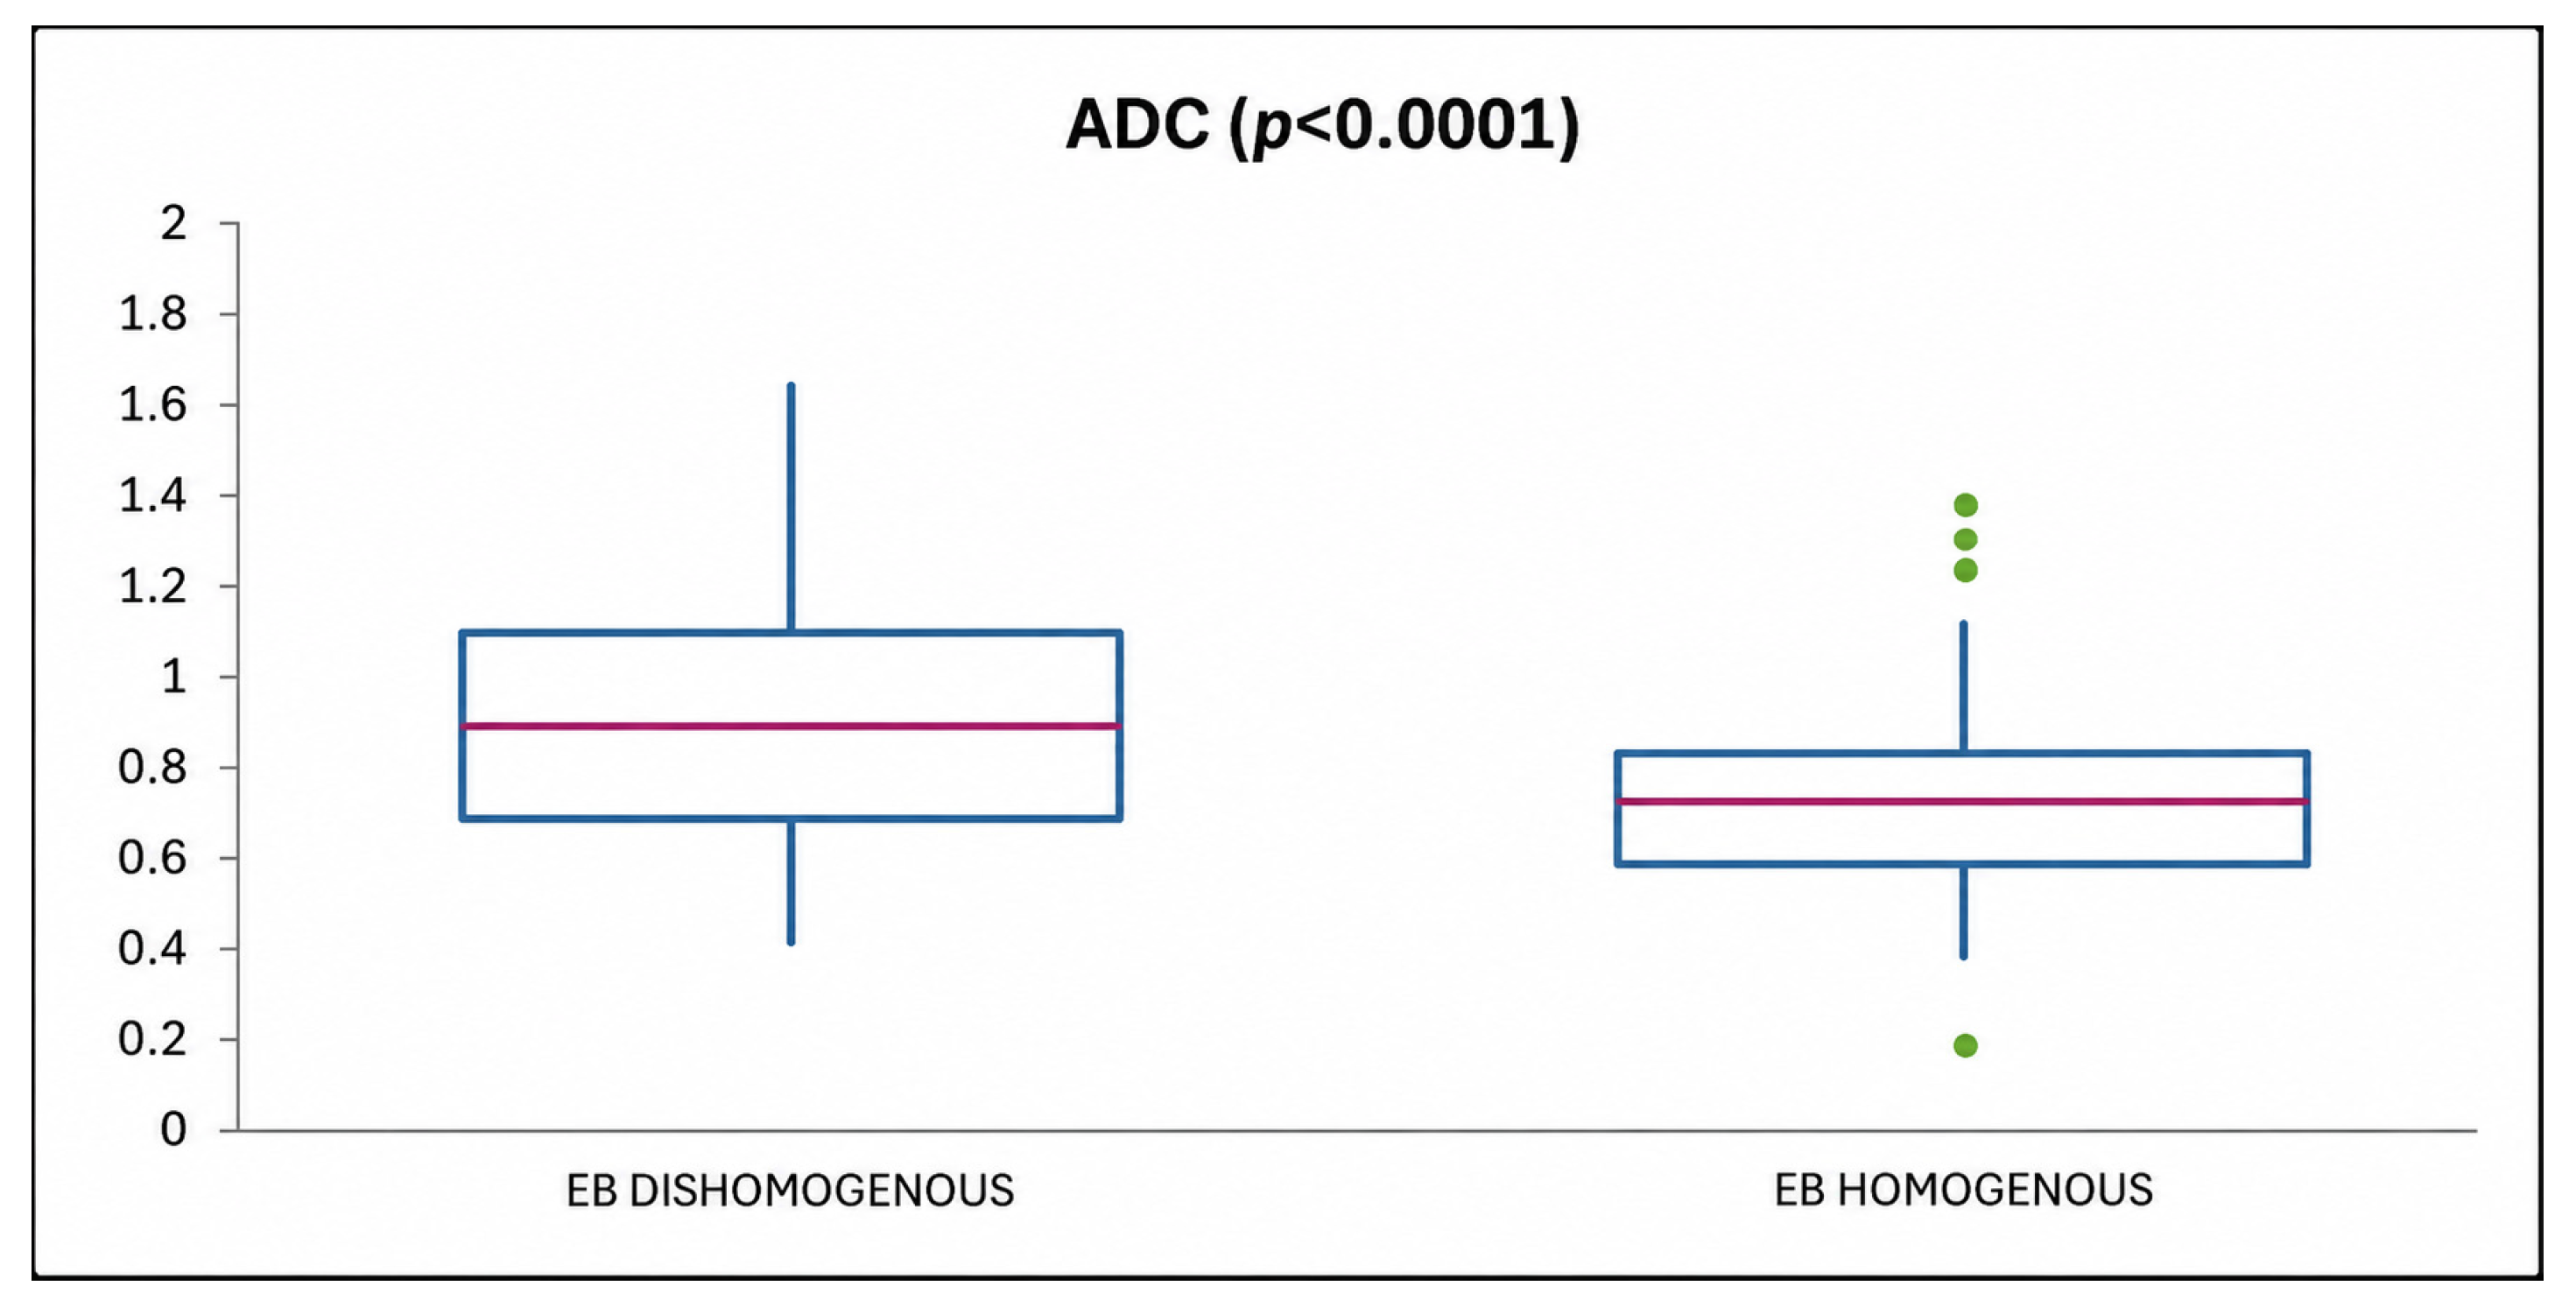
  • ADC value (p < 0.0001): median 0.84 × 10⁻³ mm2/s (mean 0.896) for heterogeneous vs. median 0.735 × 10⁻³ mm2/s (mean 0.736) for homogeneous lesions (Figure 9).
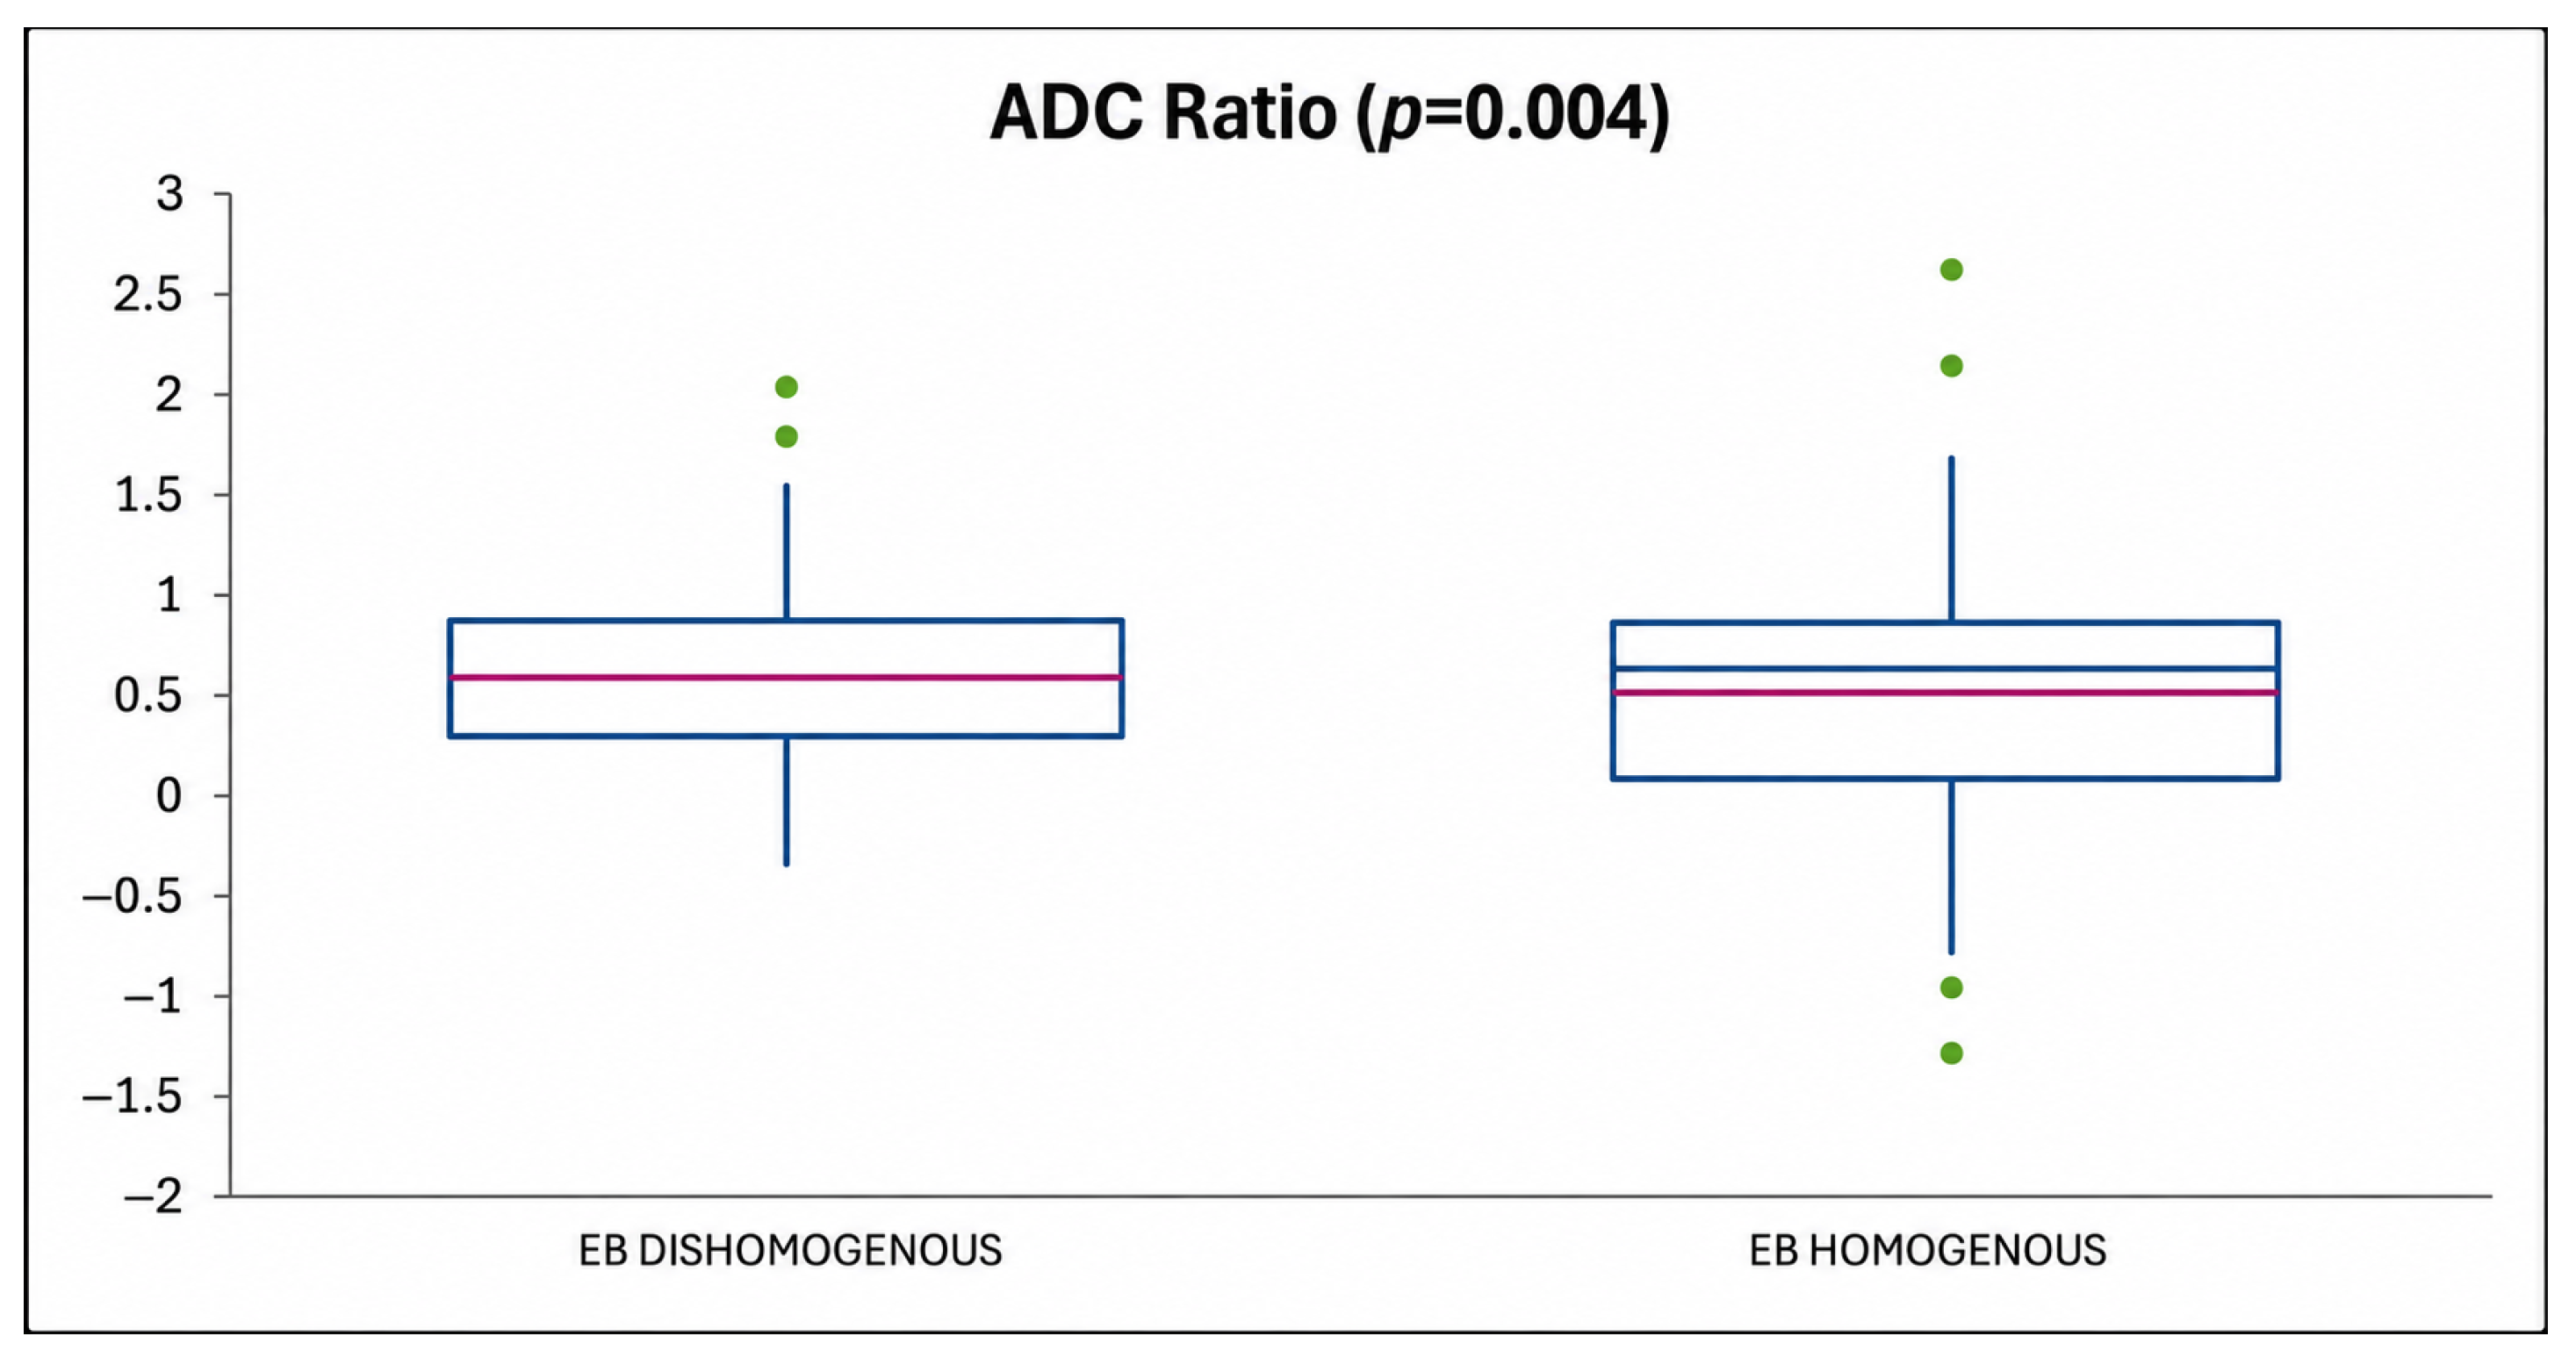
  • ADC ratio (p = 0.004): median 0.585 (mean 0.566) vs. 0.615 (mean 0.505), respectively (Figure 10).
  • T2 signal (homogeneous/heterogeneous, p < 0.0001).
  • Hemorrhage presence (p < 0.0001).
When stratifying the NET lesions by incidental vs. non-incidental detection, significant differences emerged for
  • Lesion size (p = 0.006);
  • HBP signal heterogeneity (p < 0.0001);
  • Presence of hemorrhage (p = 0.0007).
Comparing ileal vs. pancreatic primary NET metastases demonstrated statistically significant differences for:
  • Arterial-phase enhancement (p = 0.007): present in 70% of pancreatic NET metastases and 44% of ileal ones.
Among continuous variables found to be statistically different in univariate analysis, lesion size and ADC ratio were tested with ROC curves to determine discriminatory ability.
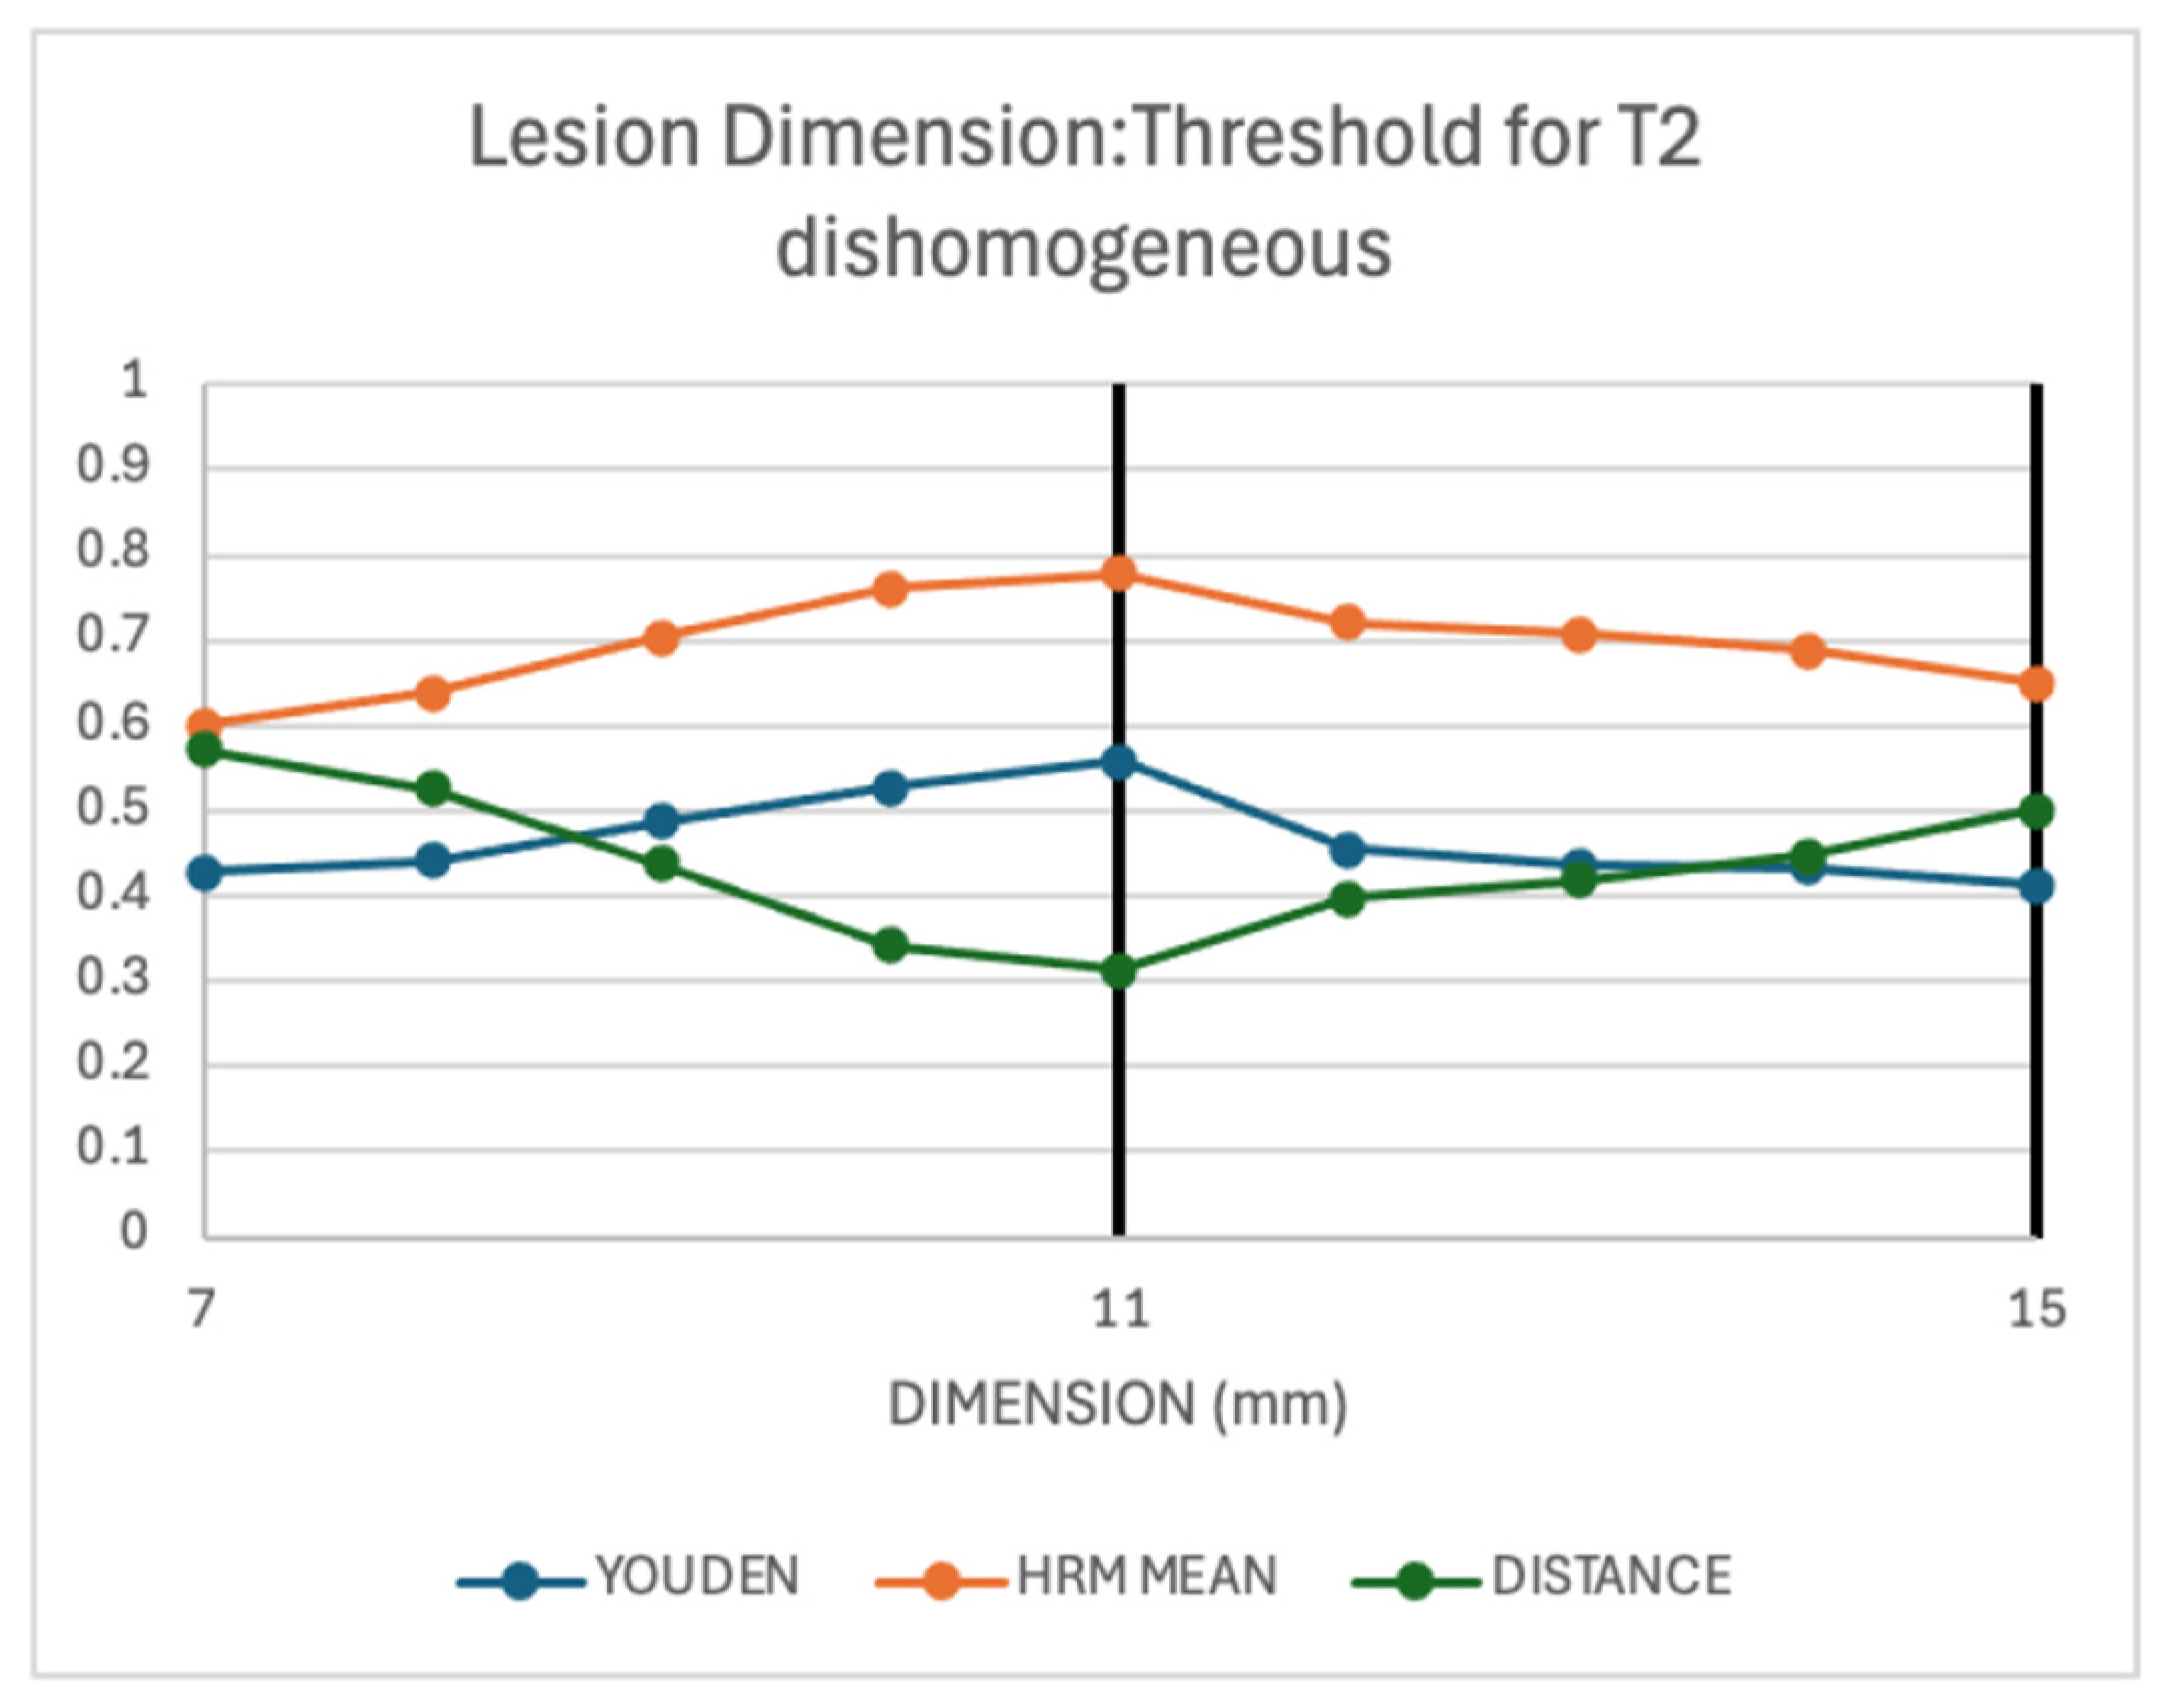
  • For T2 signal homogeneity discrimination, lesion size demonstrated good performance (AUC = 0.85) with 78% sensitivity and specificity at a cutoff of 11 mm, determined using three estimation methods (Figure 12).
  • For hepatobiliary-phase signal discrimination, ADC value showed good performance (AUC = 0.80) with a threshold of 0.88 × 10⁻³ mm2/s, above which lesions tended to exhibit heterogeneous HBP signal.
  • For incidental vs. non-incidental detection, lesion size had limited discriminative capacity (AUC = 0.70).

3.4. Multivariate Analysis

Multivariate logistic regression was applied to variables showing statistical significance in the univariate analysis.
For T2-weighted signal heterogeneity (Table 1),
Significant associations were found with
  • Lesion > 11 mm (p = 0.003, OR = 3.05, 95% CI 1.48–6.29);
  • HBP heterogeneous signal (p = 0.0002, OR = 4.06, 95% CI 1.93–8.54).
For hepatobiliary-phase (HBP) heterogeneity (Table 2),
Significant predictors were
  • ADC > 0.88 × 10⁻³ mm2/s (p = 0.0001, OR = 5.02, 95% CI 2.15–11.72);
  • T2-weighted heterogeneity (p = 0.005, OR = 3.19, 95% CI 1.43–7.12);
  • Presence of hemorrhage (p = 0.006, OR = 9.36, 95% CI 1.91–45.75).
Finally, for incidental vs. non-incidental lesions, multivariate analysis showed a significant association with HBP heterogeneity (p = 0.0001, OR = 5.31).
NET metastases vs. hemangiomas (Cohort 1 vs. 3):
Significant differences were observed for
  • Lesion size (p < 0.0001): median 20 mm (hemangiomas) vs. 10.5 mm (NET metastases);
  • DWI restriction (p = 0.007): absent in hemangiomas, present in 85% of NET lesions;
  • HBP heterogeneity (p < 0.0001): 24% in hemangiomas vs. 41% in NET metastases;
  • Hemorrhage (p < 0.0001): 8% in hemangiomas vs. 12% in NET metastases.
NET metastases vs. colorectal cancer metastases (Cohort 1 vs. 2):
Statistically significant differences were found for
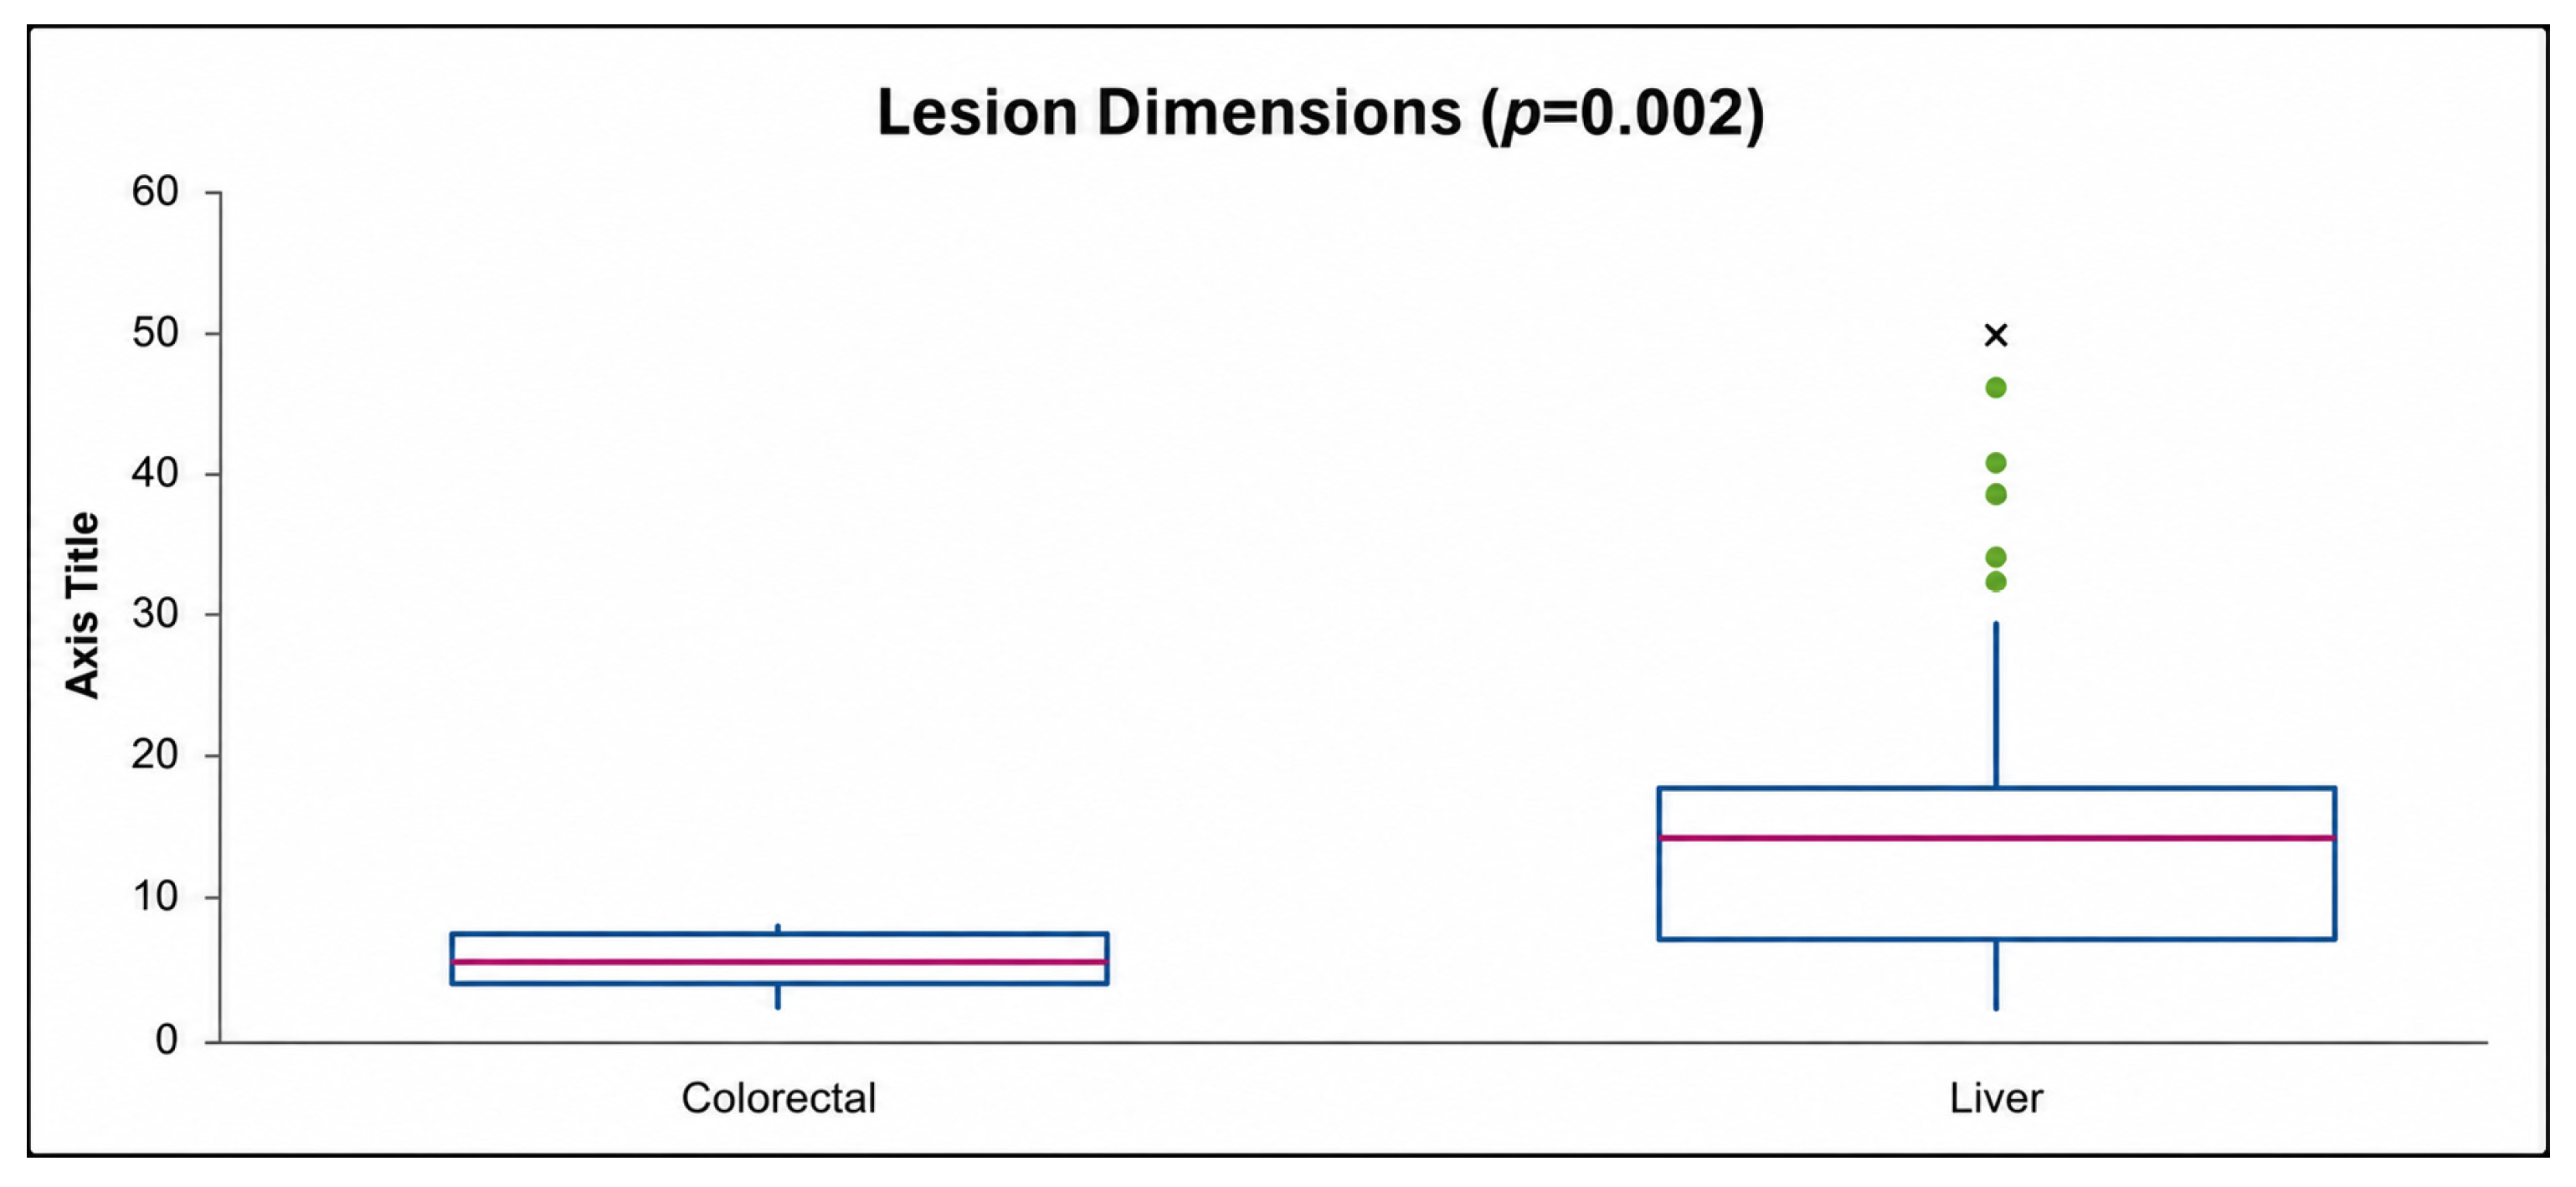
  • Lesion size (p = 0.002): median 10.5 mm (NET) vs. 16 mm (colorectal);
  • Diffusion restriction (p < 0.0001): 85% (NET) vs. 100% (colorectal);
  • T2 signal heterogeneity (p < 0.0001): 52% (NET) vs. 83% (colorectal);
  • HBP heterogeneity (p < 0.00001): 41% (NET) vs. 22% (colorectal);
  • T1-weighted heterogeneity (hemorrhage) (p < 0.0001): 12% (NET) vs. 11% (colorectal);
  • Arterial-phase enhancement (p < 0.0001): present in NET lesions, absent in all colorectal metastases.

4. Discussion

As summarised in Table 3, this study aimed to characterize hepatic metastases from neuroendocrine tumors (NETs) based on their magnetic resonance (MR) signal characteristics using hepatocyte-specific contrast agents, and to evaluate whether these features differ from those of other secondary liver lesions, such as metastases from colorectal carcinoma or benign vascular lesions such as hepatic hemangiomas. The ultimate objective was to identify specific MR features that might help radiologists recognize the neuroendocrine nature of a primary tumor, thereby establishing a potential “imaging signature” of NET liver metastases. Beyond confirming previously described imaging characteristics, the present study provides a direct comparative evaluation across three clinically relevant entities—NET metastases, colorectal metastases, and hemangiomas—highlighting how specific variables differ across these groups and how their combined interpretation may support diagnostic orientation. Such a profile could guide subsequent diagnostic investigations and enable earlier identification of the primary tumor, a factor known to correlate with improved prognosis—even in metastatic disease, where the extent and distribution of liver involvement determine therapeutic strategy. Furthermore, this approach may prove particularly useful in patients who undergo MRI for the characterization of incidental focal liver lesions, especially younger individuals in whom MRI often replaces CT to avoid radiation exposure.

4.1. Signal Characteristics and Comparative Analysis

Analysis of categorical variables revealed that NET metastases exhibited homogeneous T2-weighted signal in 48% of cases, more frequently than colorectal metastases (17%) but less often than hepatic hemangiomas (67%). In the hepatobiliary phase (HBP), 41% of NET metastases demonstrated heterogeneous signal, compared with 22% of colorectal metastases and 24% of hemangiomas [4,9,19].
The higher rate of HBP heterogeneity observed in NET metastases is consistent with previously reported findings. This imaging pattern, manifested as either iso-to-hyperintense central areas with a peripheral hypointense rim (“cloud-like” or “target” appearance) or as a ring-shaped enhancement, may correspond to distinct histopathologic substrates. The cloud-like appearance is thought to reflect a greater intratumoral fibrotic component typical of certain NETs, whereby hepatobiliary contrast material becomes entrapped within the extracellular or fibrotic stromal matrix. Conversely, the ring-shaped pattern, characterized by a hyperintense peripheral rim and central hypointensity, is usually associated with peritumoral hyperplasia, biliary reaction, or compression of adjacent hepatic parenchyma. Importantly, this feature acquires greater diagnostic relevance when interpreted together with other parameters, rather than in isolation, particularly in differentiating NET metastases from both colorectal metastases and benign vascular lesions.
Regarding the T2-weighted signal, the greater heterogeneity observed in colorectal metastases likely results from their mixed internal composition, including areas of liquefactive necrosis interspersed with fibrosis or microhemorrhage, surrounded by a peripheral rim of viable, slightly hyperintense tissue, giving the characteristic heterogeneous or “target-like” appearance. In contrast, the more frequently homogeneous, hyperintense T2 appearance of NET metastases may be attributable to two principal factors: first, the typically well-differentiated architectural pattern of low-grade tumors; and second, the tendency of higher-grade lesions to develop necrotic or cystic degeneration, responsible for the so-called “light bulb” hyperintensity.
The moderate agreement found between T2 and HBP signal (Cohen’s Kappa = 0.35) supports a partial concordance between these two imaging parameters, with approximately one-third of lesions showing consistent homogeneity or heterogeneity in both sequences. This relationship likely reflects the underlying tissue composition: HBP heterogeneity generally corresponds to a fibrous or scirrhous architecture, whereas T2 heterogeneity may indicate necrosis, cystic degeneration, or higher tumor grade.
In benign angiomatous lesions—vascular malformations composed of tangled veins and capillaries—the T2-weighted signal was homogeneous in nearly 70% of cases, and the HBP signal was homogeneous in 80% of cases. The remaining cases exhibiting heterogeneity can be explained by the inclusion of thrombosed hemangiomas (nine in our sample) and the natural tendency of larger lesions to undergo degenerative changes such as cystic, hemorrhagic, calcific, or hyaline transformation. The concordance between T2 and HBP appearance in this group was moderate (Kappa = 0.43), with simultaneous homogeneity of both parameters in approximately 76% of lesions [19,26,29].

4.2. Diffusion and Contrast Enhancement Patterns

NET metastases, characterized by high cellularity, typically show restricted diffusion on ADC maps and reduced ADC values compared with the surrounding liver parenchyma. Lower ADC values are known to correlate with higher tumor grades, reflecting increased cellular density. In our analysis of 146 MET lesions, the median ADC value was 0.755 × 10⁻³ mm2/s, slightly lower but in line with previously published data. Literature comparisons between NET and colorectal metastases have shown lower ADC values in NETs, consistent with their denser cellular architecture. Although a direct comparison was not performed in this study due to the smaller colorectal metastasis sample, this trend is supported by our findings [8,19,30,31].
Analysis of diffusion-weighted sequences revealed restricted diffusion in 100% of colorectal metastases and in 85% of NET lesions, whereas hemangiomas—non-cellular vascular malformations—showed no diffusion restriction. The slightly lower rate of restricted diffusion in NETs may be explained by the more frequent occurrence of necrotic or cystic degeneration in these lesions.
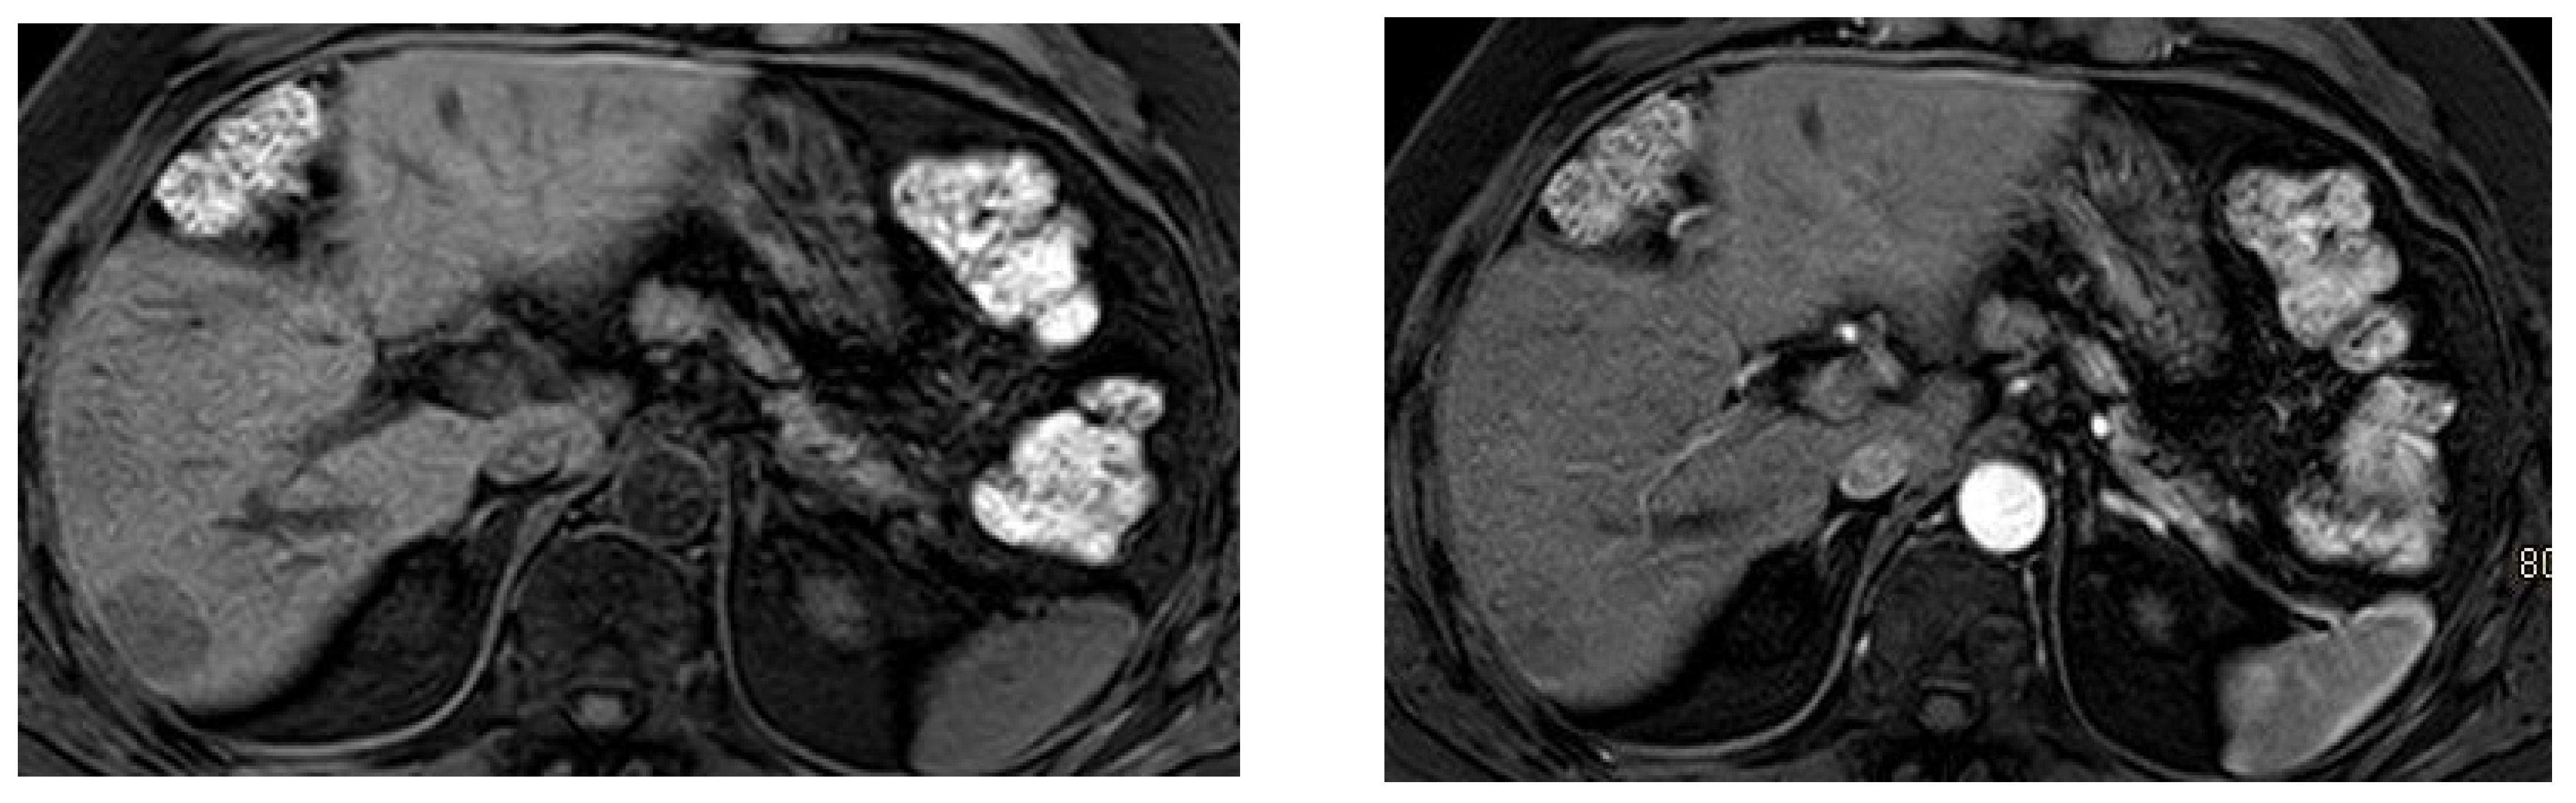
Contrast enhancement profiles followed expected patterns: all colorectal metastases were hypovascular on arterial-phase imaging, whereas 58% of NET metastases exhibited homogeneous arterial enhancement, consistent with their typical hypervascular behavior. The remaining NET lesions lacked homogeneous enhancement due to necrotic or cystic areas or displayed hypovascular components (as shown in Figure 14). Evidence of intralesional hemorrhage was found in 21% of NET metastases, a feature more common in rapidly growing tumors and likely related to fragile vascular architecture, particularly within larger lesions. Size comparisons across the three cohorts demonstrated statistically significant differences: hemangiomas were generally larger than NET metastases, whereas colorectal metastases were smaller within this sample population [19,32]. Taken together, vascular behavior, diffusion characteristics, lesion size, and signal heterogeneity provide complementary information that may help differentiate these entities when evaluated jointly.

4.3. Correlations Within the NET Subsets

Univariate analysis across NET subgroups revealed several noteworthy relationships. When lesions were stratified by T2 signal homogeneity, a significant correlation emerged with the hepatobiliary-phase signal: 77% of T2-homogeneous lesions were also homogeneous in HBP, while 58% of T2-heterogeneous lesions were heterogeneous in HBP. These results corroborate the hypothesis that HBP heterogeneity corresponds to a fibrotic or scirrhous architecture, whereas T2 heterogeneity results from necrosis, cystic changes, or higher grade. Larger lesions and those with hemorrhage were more frequently heterogeneous, reflecting the general principle that increasing lesion size is associated with necrotic and hemorrhagic transformation. ROC curve analysis identified a lesion diameter > 11 mm as an optimal cutoff, with good sensitivity and specificity for distinguishing between homogeneous and heterogeneous T2 signal patterns. Furthermore, lesions with homogeneous T2 signal showed slightly lower ADC ratios, supporting the concept that greater homogeneity aligns with higher cellular density and therefore lower ADC values. Among the variables entered into the multivariate logistic regression model, only lesion size > 11 mm and hepatobiliary-phase heterogeneity maintained independent statistical significance in differentiating between homogeneous and heterogeneous T2 signals.
When lesions were grouped by hepatobiliary-phase appearance, significant associations were observed with T2 heterogeneity, hemorrhage, and ADC metrics. Specifically, 73% of lesions with heterogeneous HBP signal also showed heterogeneous T2 signal, while hemorrhage was more frequent (25%) in lesions with HBP heterogeneity. Both ADC value and ADC ratio were statistically different, being lower in homogeneous lesions, again confirming that decreased diffusivity correlates with greater cellularity. ROC analysis identified an ADC threshold of 0.88 × 10⁻³ mm2/s as a reliable cutoff for differentiating homogeneous versus heterogeneous HBP signal.
Multivariate analysis confirmed ADC > 0.88 × 10⁻³ mm2/s, T2 heterogeneity, and hemorrhage presence as significant predictors of HBP heterogeneity. When classified according to incidental versus non-incidental detection, NET metastases that were incidentally discovered were significantly larger, more frequently exhibited HBP heterogeneity (59%) and hemorrhage (22%), reflecting the indolent course of neuroendocrine tumors: lesions detected at a later stage are typically larger and more prone to internal degeneration and bleeding. Although ROC analysis confirmed a difference in lesion size between the two subgroups, size alone lacked strong discriminative capability, suggesting that HBP heterogeneity may also reflect factors other than dimension, possibly random variability.
Comparison by primary histology (pancreatic vs. ileal NETs) revealed one statistically significant difference: arterial enhancement was observed in 70% of pancreatic but only 44% of ileal metastases. This finding, closely aligned with previous reports, reflects the hypervascular behavior of pancreatic NETs, where arterial enhancement patterns resemble those of other hypervascular hepatic lesions (e.g., focal nodular hyperplasia and hepatocellular carcinoma). MRI, through the combined use of diffusion-weighted and hepatobiliary-phase sequences, may allow a more confident differentiation among these entities than CT [13,17,20,21].

4.4. Pathophysiological Correlation of MRI Findings

The imaging features observed in neuroendocrine liver metastases (NELMs) can be directly explained by their underlying tumor biology. The frequent arterial-phase hyperenhancement reflects the marked hypervascularity of neuroendocrine tumors, which are characterized by a dense capillary network and increased expression of angiogenic factors such as vascular endothelial growth factor (VEGF) [1,13]. This rich arterial supply results in rapid contrast uptake during the arterial phase [8].
Diffusion restriction, commonly observed in NELMs, is primarily related to their high cellular density and reduced extracellular space, which limit the movement of water molecules. This feature is particularly evident in well-differentiated but highly cellular tumors and may correlate with tumor grade [19].
Heterogeneity in the hepatobiliary phase (HBP) can be attributed to the absence of functioning hepatocytes within metastatic tissue, combined with variable degrees of fibrosis, necrosis, and stromal components [13,19]. Areas of relative hyperintensity within lesions may correspond to fibrotic stroma or contrast retention in the extracellular matrix, while hypointense regions reflect viable tumor tissue lacking hepatocyte-specific uptake [19].
Similarly, T2-weighted signal variability reflects the internal composition of the lesion: hyperintensity is associated with fluid content, necrosis, or cystic degeneration, whereas more homogeneous patterns may indicate compact cellular architecture [8,13]. Hemorrhagic components, when present, further contribute to signal heterogeneity and are likely related to the fragile vascular structure of these tumors [1].
Understanding these pathophysiological mechanisms strengthens the interpretation of MRI findings and supports a more biologically grounded radiologic assessment of NELMs.

4.5. Integrating Imaging Parameters for Diagnostic Orientation

Synthesizing these findings, the concept of an MRI “signature” should be interpreted as a pattern-based approach resulting from the interaction of multiple imaging features. In practical terms, the coexistence of arterial-phase hyperenhancement, diffusion restriction, relative T2 homogeneity, and hepatobiliary-phase heterogeneity may orient toward a neuroendocrine origin, particularly when compared with the hypovascular pattern of colorectal metastases and the typical benign features of hemangiomas. These findings suggest that, in the setting of newly identified liver lesions with atypical MR appearance, certain features may prompt suspicion of a neuroendocrine origin.
Parameters supporting this hypothesis include
  • Lesion size (typically slightly larger than colorectal metastases but smaller than hemangiomas);
  • Presence of restricted diffusion (common but not universal in NET metastases);
  • T2-weighted signal intensity (more often homogeneous in NETs, similar to hemangiomas);
  • Hepatobiliary-phase heterogeneity (more frequent in NET metastases);
  • Occurrence of hemorrhage (more common in NET metastases than in benign lesions).
An integrated evaluation of all these parameters, rather than reliance on a single feature, represents the most effective approach to accurate differential diagnosis. Combining morphologic, diffusion, and hepatobiliary information can direct the radiologist toward a diagnosis of hepatic metastases from a neuroendocrine tumor and subsequently guide appropriate diagnostic pathways, especially in patients in whom the primary tumor remains unknown or has not yet been identified by other modalities [24,25,26,29].

4.6. Limitations

Several limitations should be acknowledged in this study.
First, its retrospective design may have introduced a selection bias, particularly regarding the inclusion of patients with neuroendocrine tumors versus those with colorectal liver metastases. A prospective, multicenter study would help minimize this bias and allow better standardization across subgroups.
Second, patients were examined at two different institutions, using distinct MRI scanners and acquisition protocols. Variability in imaging equipment and sequence parameters may have contributed to data non-uniformity, potentially affecting certain quantitative measures such as ADC values or contrast-related signal behavior.
Another limitation concerns the sample size, particularly for cohorts two (colorectal metastases) and three (angiomas), which were relatively small. Expanding these groups would enhance statistical power and improve the reliability and generalizability of the results.
Moreover, this analysis was primarily based on a qualitative assessment of MR signal characteristics. With the exception of a few measurable variables—such as lesion size, ADC value, and ADC ratio—no quantitative evaluation of signal intensity across sequences was performed.
Finally, quantitative image analysis and advanced computational approaches, including radiomics and machine learning/deep learning methods, were not employed. These techniques are not yet widely implemented in daily clinical practice, and the study aimed to maintain an analytical framework applicable to current routine radiologic workflows. Future investigations incorporating such methods could further refine lesion characterization and improve reproducibility.

5. Conclusions

In conclusion, this study demonstrates that magnetic resonance imaging with hepatocyte-specific contrast agents represents a highly effective diagnostic tool for the characterization of hepatic metastases from neuroendocrine tumors (NETs) and for their differential diagnosis from other secondary or atypical benign hepatic lesions.
By integrating multiple morphologic and functional MRI sequences, it is possible to outline a characteristic imaging profile—or “identikit”—of NET liver metastases, merging information from T2-weighted, diffusion-weighted, dynamic contrast-enhanced, and hepatobiliary-phase sequences. Such an integrated evaluation may assist radiologists in recognizing the neuroendocrine nature of hepatic lesions, particularly in cases where liver metastases are detected incidentally before identification of the primary tumor.
This imaging-based approach can therefore accelerate diagnostic orientation and help guide further investigation toward a neuroendocrine etiology, an aspect of crucial clinical relevance, especially given that NET primaries are often small, indolent, and difficult to detect with other modalities such as contrast-enhanced CT.
In summary, hepatocyte-specific MRI provides a comprehensive and clinically valuable assessment framework for NET liver metastases, capable of improving diagnostic confidence, refining differential diagnosis, and potentially contributing to earlier and more targeted patient management.
While promising, the proposed imaging profile should be interpreted in light of the limitations of the present study and warrants further validation in larger, prospective, and multicenter cohorts.

Author Contributions

A.S.: Writing-review & editing, Writing-original draft, Methodology; C.G.: Investigation; L.B.: Formal analysis; S.C.: Investigation; T.G.: Investigation; M.G.: Methodology; P.F.: Supervision; R.F.: Conceptualization, Methodology. Author Riccardo Faletti passed away prior to the publication of this manuscript. All other authors have read and agreed to the published version of this manuscript.

Funding

This research received no external funding.

Institutional Review Board Statement

The study was conducted in accordance with the Declaration of Helsinki and approved by the Intercompany Ethics Committee of A.O.U. Città della Salute e della Scienza di Torino–A.O. Ordine Mauriziano–A.S.L. “Città di Torino” (protocol code No. 0098565, approved on 4 October 2018).

Informed Consent Statement

Informed consent was obtained from all subjects involved in the study.

Data Availability Statement

The raw data supporting the conclusions of this article will be made available by the authors on request.

Conflicts of Interest

The authors declare no conflicts of interest.

Abbreviations

The following abbreviations are used in this manuscript:
NELMsNeuroendocrine liver metastases
MRIMagnetic resonance imaging
NENsNeuroendocrine neoplasms
GEPGastro-entero-pancreatic
VHLVon Hippel–Lindau
NF1Neurofibromatosis type 1
TSCTuberous Sclerosis
NETNeuroendocrine Tumors
NECNeuroendocrine Carcinomas
MiNENMixed Neuroendocrine–Non-Neuroendocrine Neoplasms
WHOWorld Health Organization
CgAChromogranin A
SynSynaptophysin
CSCarcinoid syndrome
AUCArea under the curve

References

  1. Sultana, Q.; Kar, J.; Verma, A.; Sanghvi, S.; Kaka, N.; Patel, N.; Sethi, Y.; Chopra, H.; Kamal, M.A.; Greig, N.H. A Comprehensive Review on Neuroendocrine Neoplasms: Presentation, Pathophysiology and Management. J. Clin. Med. 2023, 12, 5138. [Google Scholar] [CrossRef]
  2. Sharma, A.; Muralitharan, M.; Ramage, J.; Clement, D.; Menon, K.; Srinivasan, P.; Elmasry, M.; Reed, N.; Seager, M.; Srirajaskanthan, R. Current Management of Neuroendocrine Tumour Liver Metastases. Curr. Oncol. Rep. 2024, 26, 1070–1084. [Google Scholar] [CrossRef] [PubMed]
  3. Oronsky, B.; Ma, P.C.; Morgensztern, D.; Carter, C.A. Nothing But NET: A Review of Neuroendocrine Tumors and Carcinomas. Neoplasia 2017, 19, 991–1002. [Google Scholar] [CrossRef] [PubMed]
  4. Rindi, G.; Mete, O.; Uccella, S.; Basturk, O.; La Rosa, S.; Brosens, L.A.A.; Ezzat, S.; de Herder, W.W.; Klimstra, D.S.; Papotti, M.; et al. Overview of the 2022 WHO Classification of Neuroendocrine Neoplasms. Endocr. Pathol. 2022, 33, 115–154. [Google Scholar] [CrossRef] [PubMed]
  5. Wu, P.; He, D.; Chang, H.; Zhang, X. Epidemiologic trends of and factors associated with overall survival in patients with neuroendocrine tumors over the last two decades in the USA. Endocr. Connect. 2023, 12, e230331. [Google Scholar] [CrossRef]
  6. Das, S.; Dasari, A. Epidemiology, Incidence, and Prevalence of Neuroendocrine Neoplasms: Are There Global Differences? Curr. Oncol. Rep. 2021, 23, 43. [Google Scholar] [CrossRef]
  7. Melone, V.; Salvati, A.; Palumbo, D.; Giurato, G.; Nassa, G.; Rizzo, F.; Palo, L.; Giordano, A.; Incoronato, M.; Vitale, M.; et al. Identification of functional pathways and molecular signatures in neuroendocrine neoplasms by multi-omics analysis. J. Transl. Med. 2022, 20, 306. [Google Scholar] [CrossRef] [PubMed]
  8. Sahani, D.V.; Bonaffini, P.A.; Fernández-Del Castillo, C.; Blake, M.A. Gastroenteropancreatic neuroendocrine tumors: Role of imaging in diagnosis and management. Radiology 2013, 266, 38–61. [Google Scholar] [CrossRef]
  9. Nagtegaal, I.D.; Odze, R.D.; Klimstra, D.; Paradis, V.; Rugge, M.; Schirmacher, P.; Washington, K.M.; Carneiro, F.; Cree, I.A. The 2019 WHO classification of tumours of the digestive system. Histopathology 2020, 76, 182–188. [Google Scholar] [CrossRef]
  10. Grossrubatscher, E.; Fanciulli, G.; Pes, L.; Sesti, F.; Dolci, C.; de Cicco, F.; Colao, A.; Faggiano, A. Advances in the management of medullary thyroid carcinoma: Focus on peptide receptor radionuclide therapy. J. Clin. Med. 2020, 9, 3507. [Google Scholar] [CrossRef]
  11. Mulders, M.C.F.; De Herder, W.W.; Hofland, J. What Is Carcinoid Syndrome? A Critical Appraisal of Its Proposed Mediators. Endocr. Rev. 2024, 45, 351–360. [Google Scholar]
  12. Dromain, C.; De Baere, T.; Baudin, E.; Galline, J.; Ducreux, M.; Boige, V.; Duvillard, P.; Laplanche, A.; Caillet, H.; Lasser, P.; et al. MR Imaging of Hepatic Metastases Caused by Neuroendocrine Tumors: Comparing Four Techniques. AJR Am. J. Roentgenol. 2003, 180, 121–128. [Google Scholar] [CrossRef]
  13. Houat, A.d.P.; Atzingen ACv Velloni, F.G.; Oliveira, R.A.S.D.; Torres, U.D.S.; D’ippolito, G. Hepatic neuroendocrine neoplasm: Imaging patterns. Radiol. Bras. 2020, 53, 195–200. [Google Scholar] [CrossRef]
  14. Cuthbertson, D.J.; Shankland, R.; Srirajaskanthan, R. Diagnosis and management of neuroendocrine tumours. Clin. Med. J. R. Coll. Physicians Lond. 2023, 23, 119–124. [Google Scholar] [CrossRef] [PubMed]
  15. Koffas, A.; Giakoustidis, A.; Papaefthymiou, A.; Bangeas, P.; Giakoustidis, D.; Papadopoulos, V.N.; Toumpanakis, C. Diagnostic work-up and advancement in the diagnosis of gastroenteropancreatic neuroendocrine neoplasms. Front. Surg. 2023, 10, 1064145. [Google Scholar] [CrossRef] [PubMed]
  16. Chiti, G.; Grazzini, G.; Cozzi, D.; Danti, G.; Matteuzzi, B.; Granata, V.; Pradella, S.; Recchia, L.; Brunese, L.; Miele, V. Imaging of pancreatic neuroendocrine neoplasms. Int. J. Environ. Res. Public Health 2021, 18, 8895. [Google Scholar] [CrossRef]
  17. Gupta, A.; Lubner, M.G.; Menias, C.O.; Mellnick, V.M.; Elsayes, K.M.; Pickhardt, P.J. Multimodality imaging of ileal neuroendocrine (carcinoid) tumor. Am. J. Roentgenol. 2019, 213, 45–53. [Google Scholar] [CrossRef]
  18. Navin, P.J.; Ehman, E.C.; Liu, J.B.; Halfdanarson, T.R.; Gupta, A.; Laghi, A.; Yoo, D.C.; Carucci, L.R.; Schima, W.; Sheedy, S.P. Imaging of Small-Bowel Neuroendocrine Neoplasms: AJR Expert Panel Narrative Review. AJR Am. J. Roentgenol. 2023, 221, 289–301. [Google Scholar] [CrossRef]
  19. Ozaki, K.; Higuchi, S.; Kimura, H.; Gabata, T. Liver Metastases: Correlation between Imaging Features and Pathomolecular Environments. Radiographics 2022, 42, 1994–2013. [Google Scholar] [CrossRef] [PubMed]
  20. Ronot, M.; Clift, A.K.; Baum, R.P.; Singh, A.; Kulkarni, H.R.; Frilling, A.; Vilgrain, V. Morphological and Functional Imaging for Detecting and Assessing the Resectability of Neuroendocrine Liver Metastases. Neuroendocrinology 2017, 106, 74–88. [Google Scholar] [CrossRef]
  21. Pellegrino, F.; Granata, V.; Fusco, R.; Grassi, F.; Tafuto, S.; Perrucci, L.; Tralli, G.; Scaglione, M. Diagnostic Management of Gastroenteropancreatic Neuroendocrine Neoplasms: Technique Optimization and Tips and Tricks for Radiologists. Tomography 2023, 9, 217–246. [Google Scholar] [CrossRef]
  22. Wahba, A.; Tan, Z.; Dillon, J.S. Management of functional neuroendocrine tumors. Curr. Probl. Cancer 2024, 52, 101130. [Google Scholar] [CrossRef]
  23. Gulpinar, B.; Peker, E.; Kul, M.; Elhan, A.H.; Haliloglu, N. Liver metastases of neuroendocrine tumors: Is it possible to diagnose different histologic subtypes depending on multiphasic CT features? Abdom. Radiol. 2019, 44, 2147–2155. [Google Scholar] [CrossRef] [PubMed]
  24. Hayoz, R.; Vietti-Violi, N.; Duran, R.; Knebel, J.F.; Ledoux, J.B.; Dromain, C. The combination of hepatobiliary phase with Gd-EOB-DTPA and DWI is highly accurate for the detection and characterization of liver metastases from neuroendocrine tumor. Eur. Radiol. 2020, 30, 6593–6602. [Google Scholar] [CrossRef] [PubMed]
  25. Maino, C.; Vernuccio, F.; Cannella, R.; Cortese, F.; Franco, P.N.; Gaetani, C.; Giannini, V.; Inchingolo, R.; Ippolito, D.; Defeudis, A.; et al. Liver metastases: The role of magnetic resonance imaging. World J. Gastroenterol. 2023, 29, 5180–5197. [Google Scholar] [CrossRef] [PubMed]
  26. Vernuccio, F.; Gagliano, D.S.; Cannella, R.; Ba-Ssalamah, A.; Tang, A.; Brancatelli, G. Spectrum of liver lesions hyperintense on hepatobiliary phase: An approach by clinical setting. Insights Imaging 2021, 12, 8. [Google Scholar] [CrossRef]
  27. Hui, C.L.; Mautone, M. Patterns of Enhancement in the Hepatobiliary Phase of Gadoxetic Acid-Enhanced MRI. Br. J. Radiol. 2020, 93, 20190989. [Google Scholar] [CrossRef] [PubMed]
  28. Dromain, C.; Déandréis, D.; Scoazec, J.Y.; Goere, D.; Ducreux, M.; Baudin, E.; Tselikas, L. Imaging of neuroendocrine tumors of the pancreas. Diagn. Interv. Imaging 2016, 97, 1241–1257. [Google Scholar] [CrossRef] [PubMed]
  29. Vernuccio, F.; Bruno, A.; Costanzo, V.; Bartolotta, T.V.; Vieni, S.; Midiri, M.; Salvaggio, G.; Brancatelli, G. Comparison of the Enhancement Pattern of Hepatic Hemangioma on Magnetic Resonance Imaging Performed with Gd-EOB-DTPA Versus Gd-BOPTA. Curr. Probl. Diagn. Radiol. 2020, 49, 398–403. [Google Scholar] [CrossRef]
  30. Besa, C.; Ward, S.; Cui, Y.; Jajamovich, G.; Kim, M.; Taouli, B. Neuroendocrine liver metastases: Value of apparent diffusion coefficient and enhancement ratios for characterization of histopathologic grade. J. Magn. Reson. Imaging 2016, 44, 1432–1441. [Google Scholar] [CrossRef] [PubMed]
  31. Gultekin, M.A.; Turk, H.M.; Yurtsever, I.; Cesme, D.H.; Seker, M.; Besiroglu, M.; Alkan, A. Apparent Diffusion Coefficient Values for Neuroendocrine Liver Metastases. Acad. Radiol. 2021, 28, S81–S86. [Google Scholar] [CrossRef] [PubMed]
  32. Horng, A.; Ingenerf, M.; Berger, F.; Steffinger, D.; Rübenthaler, J.; Zacherl, M.; Wenter, V.; Ricke, J.; Schmid-Tannwald, C. Synchronous neuroendocine liver metastases in comparison to primary pancreatic neuroendocrine tumors on MRI and SSR-PET/CT. Front. Oncol. 2024, 14, 1352538. [Google Scholar] [CrossRef]
Figure 1. Concordance between T2 signal characteristics and the hepatobiliary excretory phase.
Livers 06 00041 g001
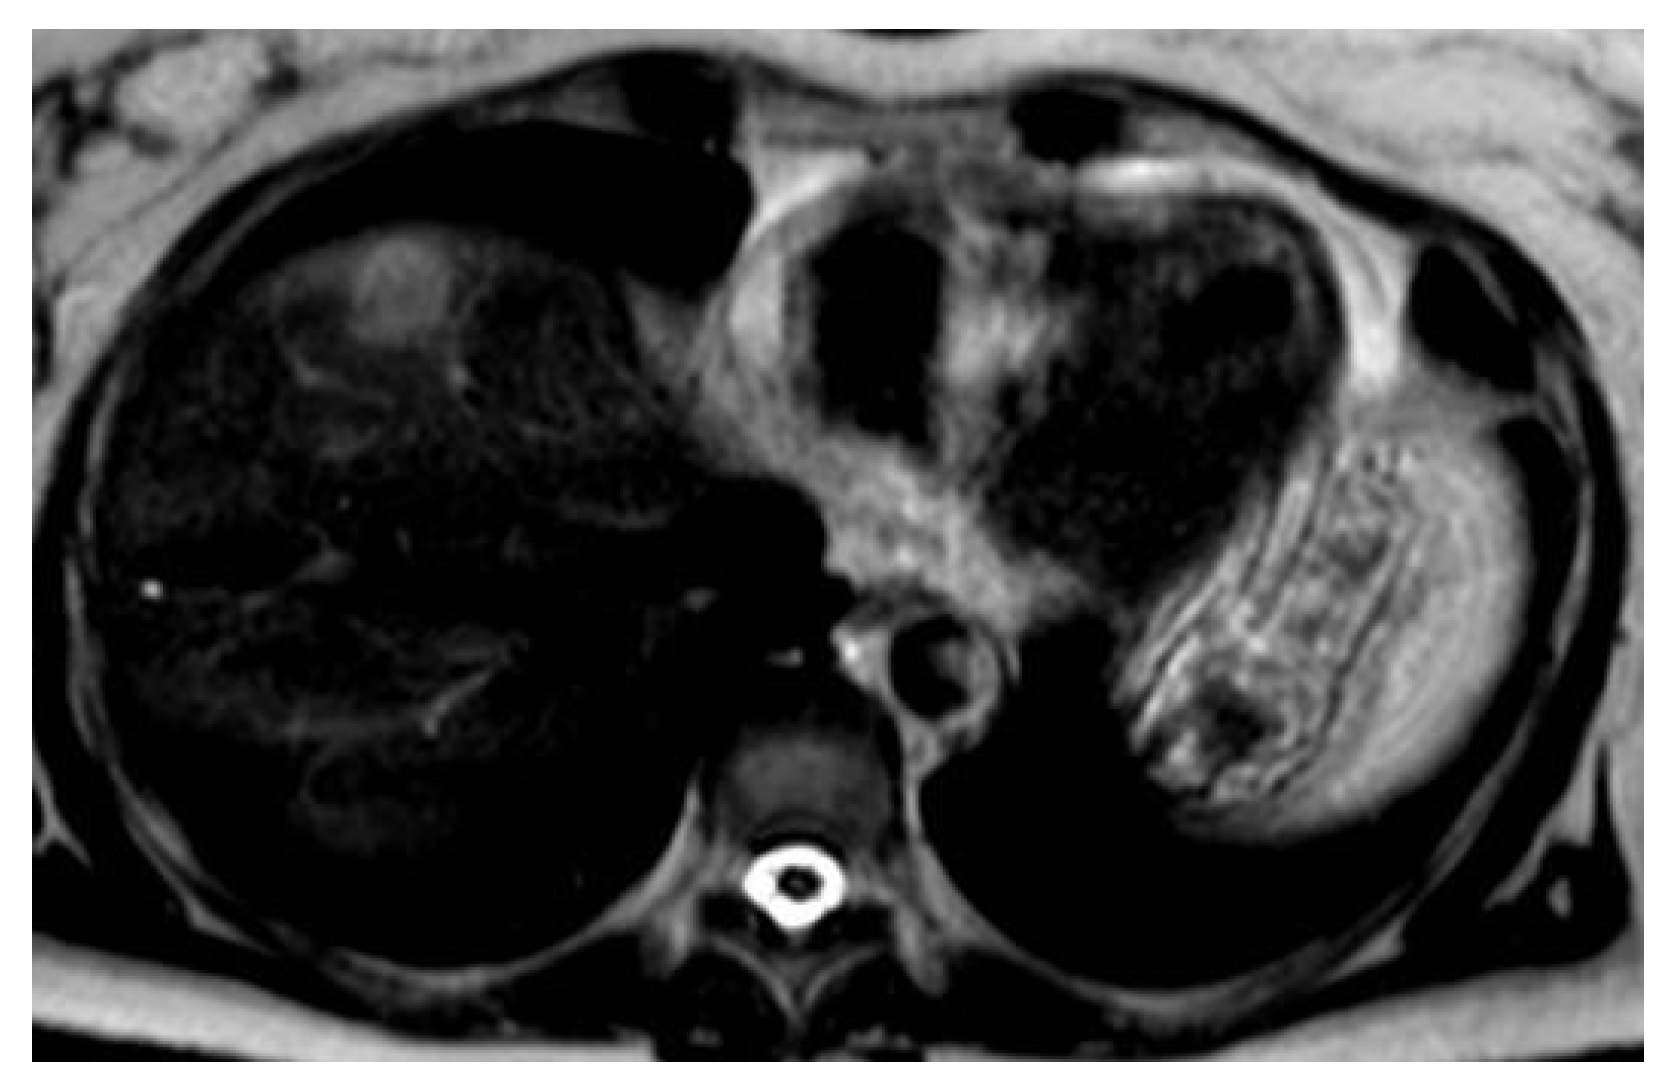
Figure 4. Heterogeneous secondary lesion on T2.
Livers 06 00041 g004
Figure 5. Box plot of ADC ratio according to T2 signal intensity (homogeneous vs. heterogeneous).
Livers 06 00041 g005
Figure 6. Box plot of ADC according to signal intensity in the hepatobiliary phase (homogeneous vs. heterogeneous).
Livers 06 00041 g006
Figure 7. Box plot of ADC ratio according to signal intensity in the hepatobiliary phase (homogeneous vs. heterogeneous).
Livers 06 00041 g007
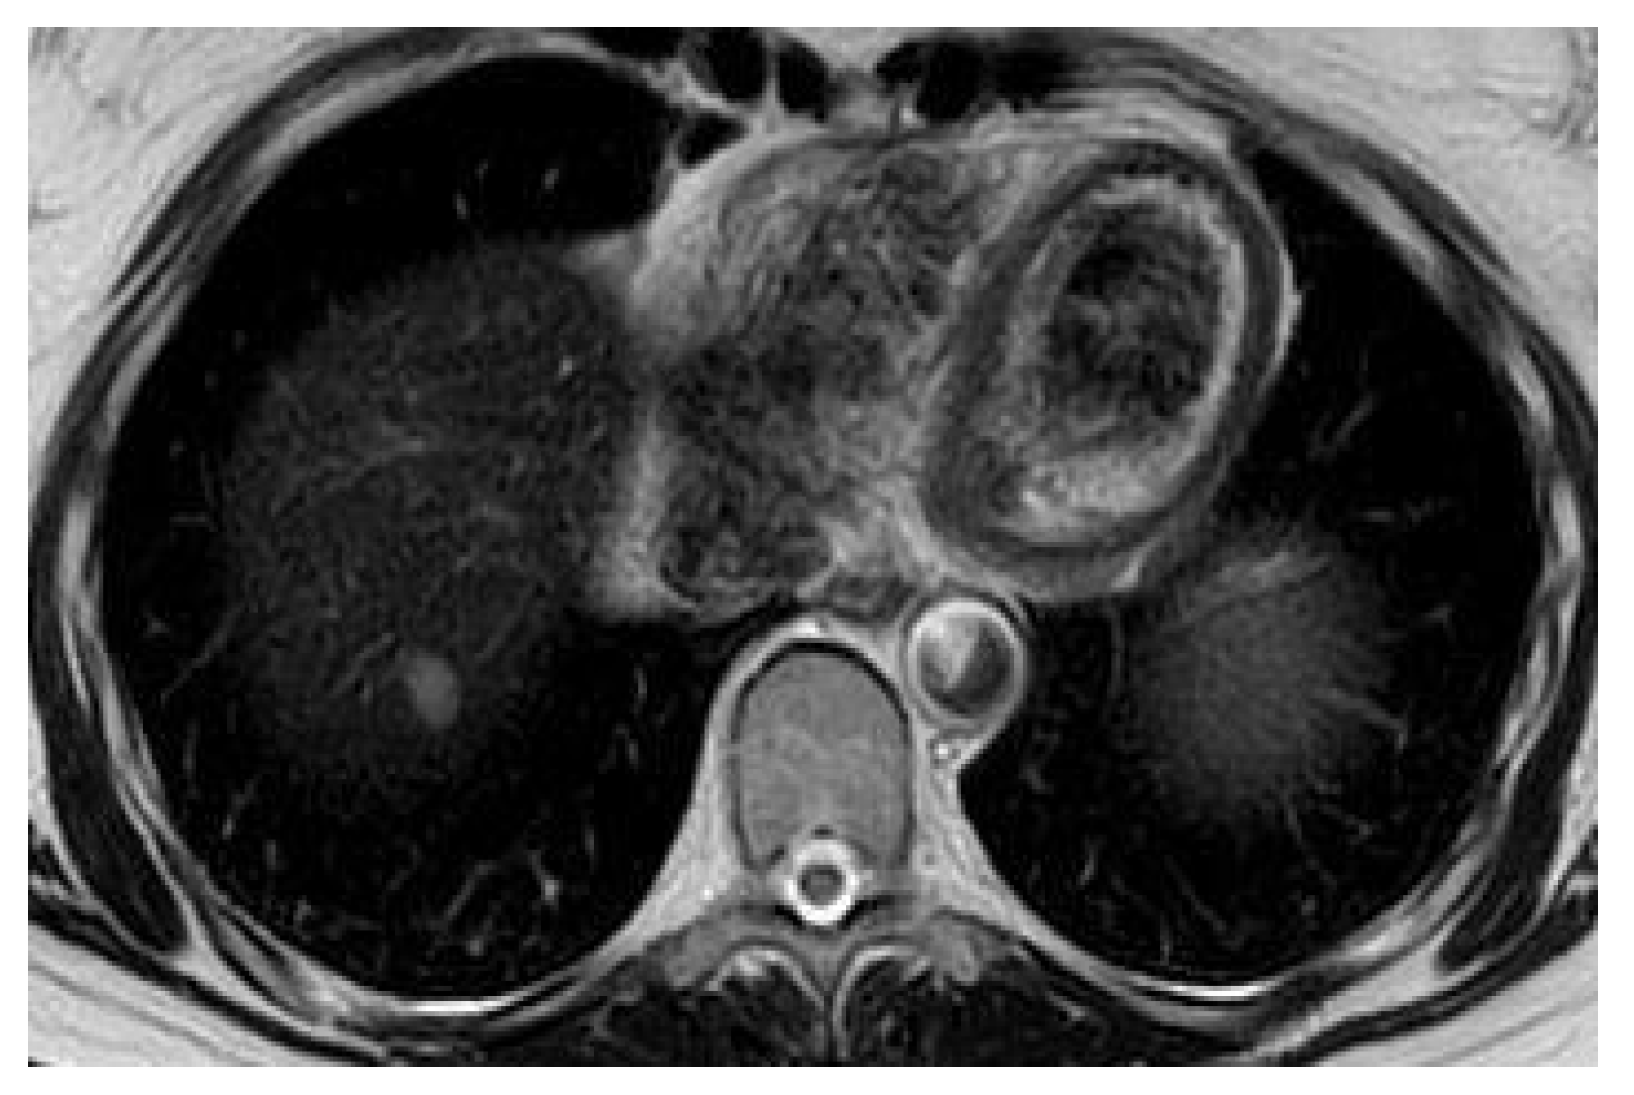
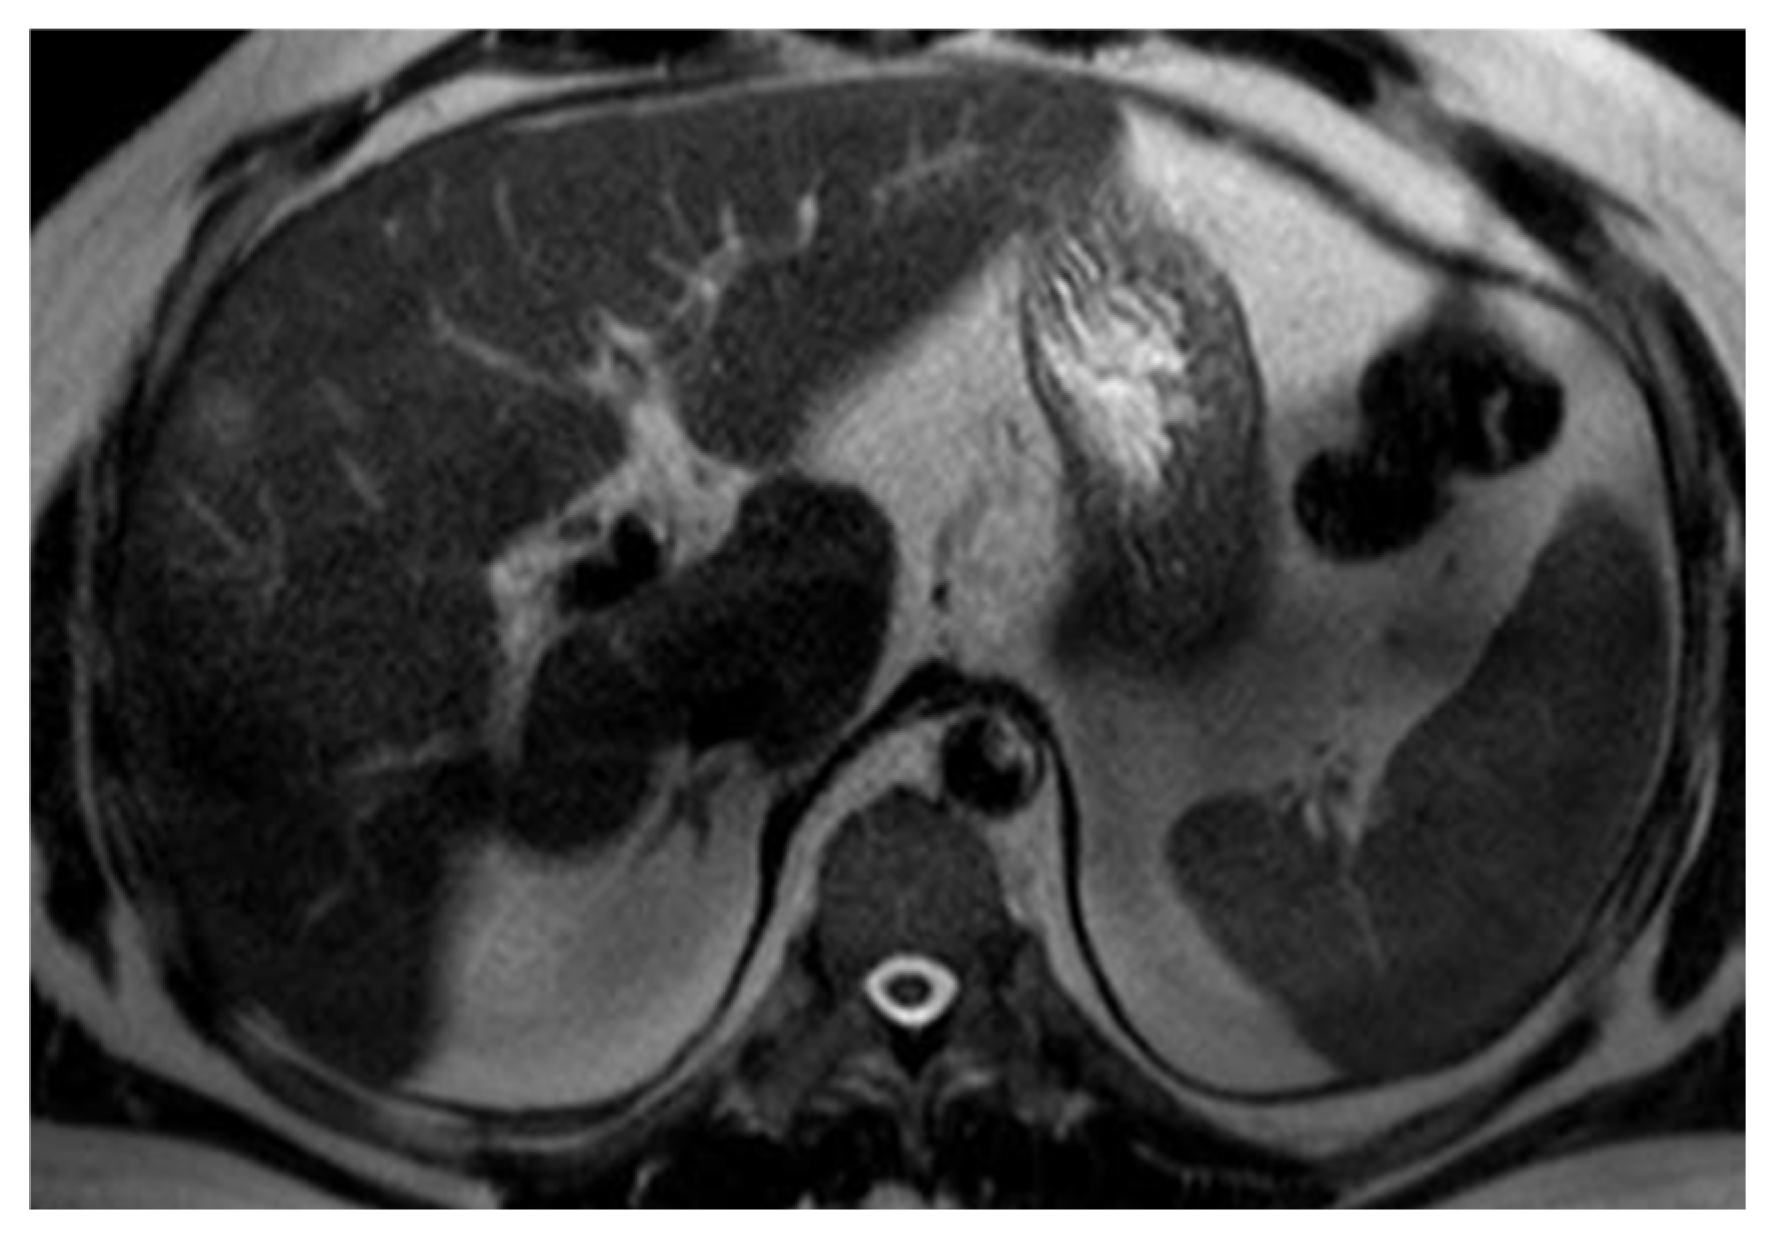
Figure 8. Homogeneous secondary lesion on T2.
Livers 06 00041 g008
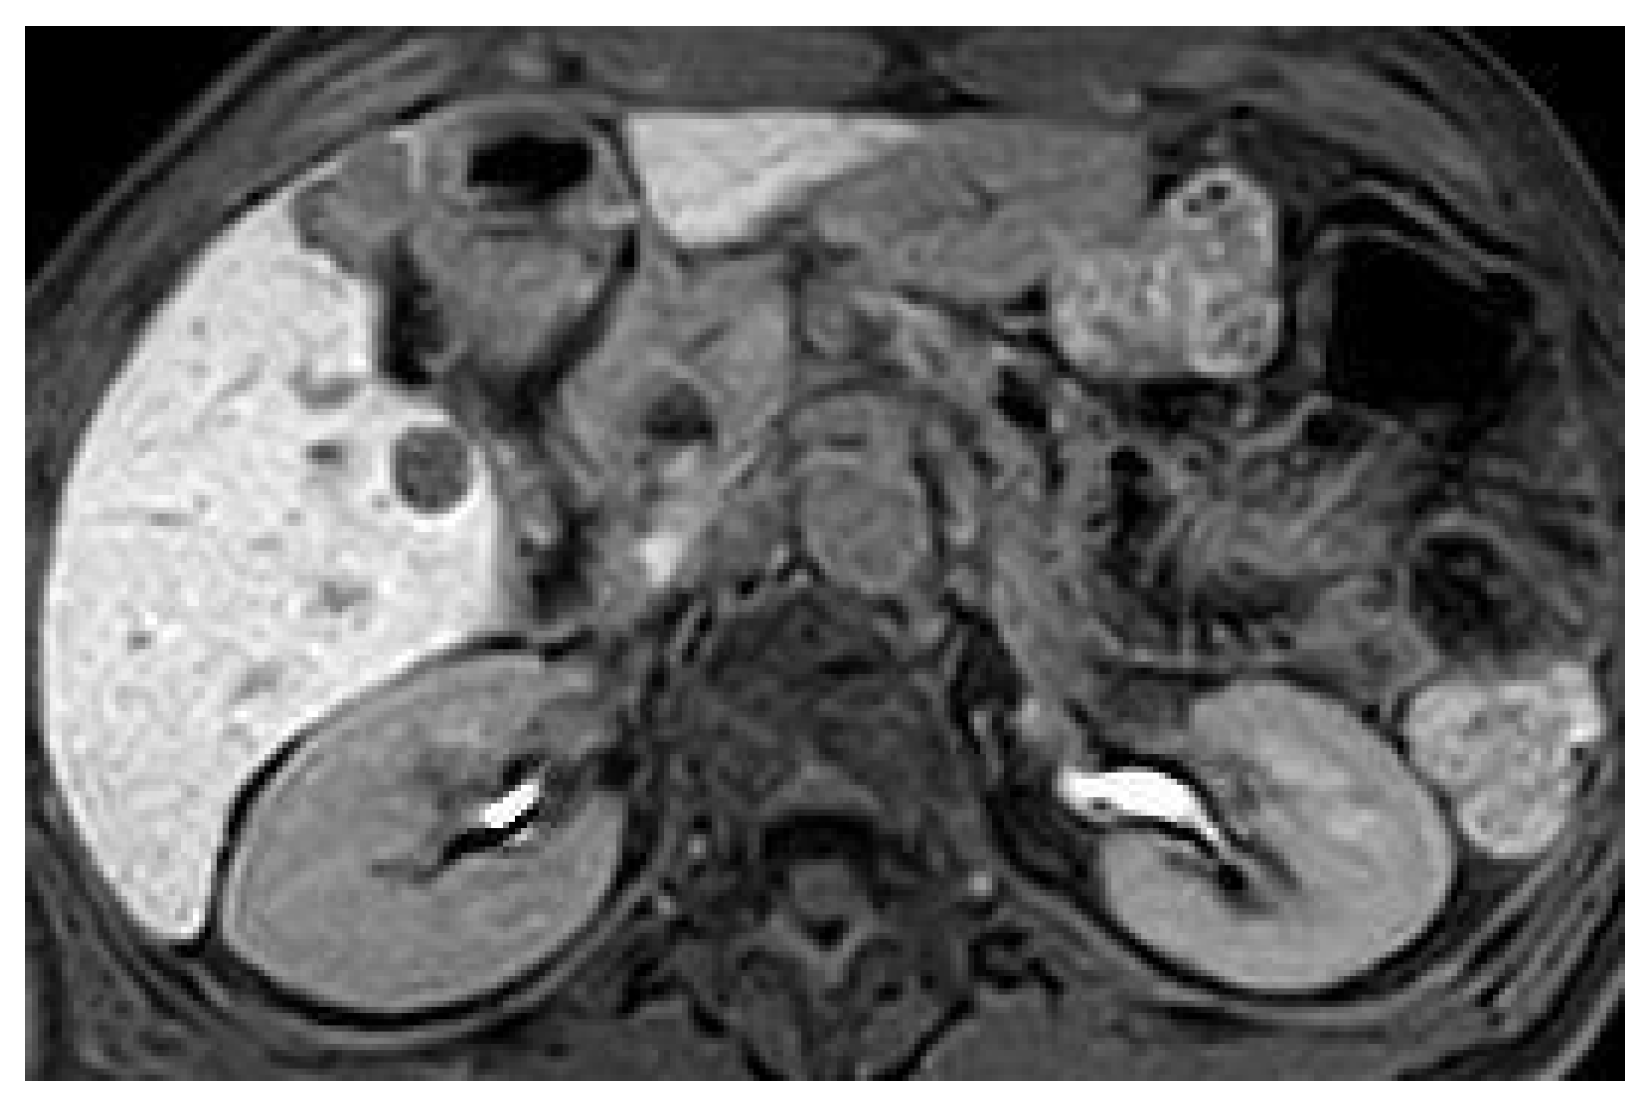
Figure 9. The lesion appears heterogeneous in the hepatobiliary excretory phase, with evidence of heterogeneously hyperintense components in the central portion.
Livers 06 00041 g009
Figure 10. Homogeneous colorectal secondary lesions on T2.
Livers 06 00041 g010
Figure 11. Determination of the size cut-off for discriminating between homogeneous and heterogeneous T2 signal using three different methods.
Livers 06 00041 g011
Figure 12. Homogeneous colorectal secondary lesions on T2.
Livers 06 00041 g012
Figure 13. Boxplot of secondary lesion sizes from colorectal cancer vs. NET metastases (liver).
Livers 06 00041 g013
Figure 14. Lesion evaluated on T1 3D THRIVE sequences before (left) and during (right) intravenous administration of paramagnetic contrast medium. The lesion shows no arterial-phase wash-in.
Livers 06 00041 g014
Table 1. Multivariate logistic regression analysis for T2 signal heterogeneity.
Variablep-ValueOdds Ratio95% CI (Lower–Upper)
Lesion > 11 mm0.0033.051.48–6.29
HBP heterogeneity (1 = yes)0.00024.061.93–8.54
Table 2. Multivariate logistic regression analysis for hepatobiliary phase heterogeneity.
Variablep-ValueOdds Ratio95% CI (Lower–Upper)
ADC > 0.88 × 10⁻³ mm2/s0.00015.022.15–11.72
T2 heterogeneity (1 = yes)0.0053.191.43–7.12
Hemorrhage (1 = yes)0.0069.361.91–45.75
Table 3. Key MRI features for differential diagnosis.
FeatureNELMsColorectal MetastasesHemangiomas
Arterial enhancementFrequentRare/absentPeripheral nodular
Diffusion restrictionCommon (85%)Constant (100%)Absent
T2 signalOften homogeneousHeterogeneousMarkedly hyperintense
HBP appearanceFrequently heterogeneousMostly homogeneousMostly homogeneous
HemorrhageOccasionalRareRare
Disclaimer/Publisher’s Note: The statements, opinions and data contained in all publications are solely those of the individual author(s) and contributor(s) and not of MDPI and/or the editor(s). MDPI and/or the editor(s) disclaim responsibility for any injury to people or property resulting from any ideas, methods, instructions or products referred to in the content.