Abstract
Starch is one of the leading nutritional carbohydrates in the human diet; its characteristics, such as digestion rate, depend on molecular structure, and in particular, the molecular composition, type and length of amylopectin chains, which are known to present a parabolic behavior with respect to digestion rate. Amylopectin with a higher density of small branches (Chains A) and those abundant in long chains (B2/B3) often present a marked resistance to digestion and could be a challenge in bread production since both fermentation and digestion could be further modulated in the presence of hydrocolloids or gluten. The objective of this work was to analyze different mixtures of starches (rice, potato, and corn) with hydrocolloids (guar and xanthan gum) and vital gluten to understand the relationship between chain length and molecular characteristics with respect to speed of digestion and glycemic index, and their incorporation into a bread loaf at 50 and 100% wheat flour substitution. A Plackett–Burman design was used to design the mixtures. Mixtures were characterized in terms of amylose/amylopectin content, fast, slow, and resistant (SDS, RS) starch digestion fractions, in vitro glycemic index, molecular weight (Mw), radius of gyration (Rz) of amylopectin, chain length distribution, and textural analysis. In the bread, a tendency to increase the SDS was observed when the mixtures included rice or potato, which can be related to the relationship between Mw and size and the prevalence of B2 and B3 chains. The Rz and RS content were related to average chain size and amylose content. The use of vital gluten was a determinant in achieving volume and textural characteristics in the final products and significantly affected the proportions of SDS and RS. By combining the molecular characteristics of starch with hydrocolloids, we can obtain food ingredients for specific applications, such as gluten-free products.
1. Introduction
Bread is one of the most widely consumed staple foods globally, providing a significant source of energy, dietary fiber, vitamins, and minerals. Its popularity is primarily attributed to its versatility, affordability, and cultural significance. The primary ingredients in bread include flour, water, yeast, and salt; however, variations in these ingredients, especially in starch, proteins, and hydrocolloids, can significantly influence the bread’s functionality and digestibility. Starch is the main carbohydrate component of bread and plays a pivotal role in its structure, texture, and digestibility. The ratio of amylose to amylopectin impacts the bread’s gelatinization, retrogradation, and digestibility. High amylose content is often linked to reduced starch digestibility and a lower glycemic index, making it desirable for developing low-GI bread products. On the other hand, amylopectin contributes to desirable texture but is more rapidly digested, leading to higher postprandial glucose responses [1]. Proteins, particularly gluten, play a crucial role in developing bread dough’s viscoelastic properties, which are essential for gas retention and loaf volume during baking. Gluten proteins form a network that traps the gas produced by yeast fermentation, allowing the dough to rise and retain its shape. This network also interacts with starch, influencing the overall texture and digestibility of the bread. Adding vital gluten can enhance the bread’s structure and reduce starch digestibility by limiting enzyme access to starch granules [2]. Hydrocolloids are polysaccharides used in bread formulations to improve texture, moisture retention, and shelf-life. Common hydrocolloids include guar gum, xanthan gum, and alginate, which interact with starch and water to form viscous solutions or gels. These interactions can delay starch gelatinization and swelling, thus slowing down enzymatic digestion and reducing the glycemic index of bread [3]. Incorporating hydrocolloids can also enhance dough rheology, improve loaf volume, and extend bread freshness by reducing staling rates [4]. Given these functional roles, this study hypothesizes that the molecular characteristics of starch, particularly amylopectin chain length, amylose content, and molecular weight, influence bread digestibility by modulating resistant starch (RS) and slowly digestible starch (SDS) content.
Additionally, hydrocolloids such as guar gum and xanthan gum may interact with starch and gluten to alter dough structure, water retention, and enzyme accessibility, ultimately affecting bread’s glycemic index. Furthermore, combining vital and non-vital gluten will affect starch–protein interactions, influencing bread’s textural properties and digestibility. The influence of starch, protein, and hydrocolloids on the functionality and digestibility of bread is critical in developing healthier cereal-based products with modified glycemic responses. Given the rising incidence of diet-related chronic diseases such as obesity, diabetes, and cardiovascular diseases, there is a growing demand for cereal-based products that offer enhanced nutritional benefits, such as lower GI and improved digestibility. By exploring the molecular interactions between these components, this research aims to contribute valuable insights into developing bread products that meet health and sensory expectations. This is particularly important as cereal-based foods, including bread, are key contributors to the global diet, and optimizing their composition can significantly impact public health. However, the impact of these ingredients on the GI of bread and their synergistic effects are not fully understood. Comprehensive studies are needed to compare the effects of various combinations of starches, hydrocolloids, and vital gluten on starch digestion and glycemic responses. Additionally, it is crucial to assess the feasibility and acceptability of incorporating these ingredients into bread formulations, as they can affect technological properties such as dough rheology, loaf volume, crumb structure, texture, and flavor, which are critical for consumer acceptance.
The objective of this study was to investigate the effects of different mixtures of starches (rice, potato, and corn) with hydrocolloids (guar gum and xanthan gum) and vital gluten on starch digestion and GI in bread at 50% and 100% wheat flour substitution levels. We hypothesized that varying the starch sources and incorporating hydrocolloids and vital gluten would significantly impact bread’s digestion rate and GI, developing low-GI bread with desirable technological and sensory properties. The findings of this study will provide valuable insights into the molecular interactions of starches, hydrocolloids, and proteins in breadmaking, guiding the development of nutritionally enhanced low-GI bread products.
2. Materials and Methods
2.1. Preparation of Starches, Hydrocolloids, and Gluten Mixtures
The native starches used in this study—rice starch (Remyline AX DR, Beneo, Mannheim, Germany), potato starch (Roquette, Ferés, France), and maize starch (Cargill, MN, USA)—were sourced from certified suppliers. Hydrocolloids included guar gum (Guar NT Powder, TIC Gums, MA, USA) and xanthan gum (Keltrol F, CP Kelco, Lille Skensved, Denmark). Protein sources were vital gluten (Manildra Group, Gladesville, Australia) and non-vital gluten (MGP Ingredients, Atchison, KS, USA). To ensure reproducibility, the starches were sieved to remove coarse particles and stored in airtight containers at room temperature (25 °C) until use. Both hydrocolloids (guar gum (G) and xanthan gum (X)) and proteins (vital gluten (V) and non-vital gluten (nV)) were incorporated into the formulations in powder form. These powders were sifted and manually mixed to ensure homogeneity before dough preparation.
2.2. Experimental Design and Specific Ratios
A Plackett–Burman experimental design was used to test various combinations of starches, hydrocolloids, and gluten. The ingredient proportions in different formulations are detailed in Table 1. All analyses were performed in triplicate.

Table 1.
Ingredient composition (%) for experimental bread formulations using different starches, hydrocolloids, and gluten sources.
2.3. Chemical Characterization
The moisture, protein, lipid, and ash contents were estimated via the AACC methods and determined as 925.10, 992.15, 922.06, and 923.03, respectively [5]. The carbohydrate content was calculated by difference.
2.4. Free Sugars
The methodology described by Kohajdová and Karovičova [6] was used; for this, samples (50 mg) were pulverized in liquid nitrogen and subsequently homogenized in 1 mL of nanopure water. The homogenate was centrifuged at 10,000× g for 15 min, and the supernatant was filtered through a 0.45 µm nylon membrane. The filtrate was analyzed in a Waters HPLC system equipped with a MetaCarb 87C column (Agilent Technologies, Santa Clara, CA, USA) and a guard column. Deionized water served as the mobile phase, and the flow rate was maintained at 0.5 mL/min. Soluble sugars were detected using a Waters 410 differential refractometer detector and quantified with Empower 3.7 software. Commercial standards of fructose, glucose, and sucrose were utilized for calibration.
2.5. Starch and Amylose Contents
Total starch (K-TSTA) and amylose (K-AMYL) contents were determined using Megazyme kits (Megazyme, Wicklow, Ireland) using 500 mg of sample, according to the method reported by de la Rosa-Millan [7]. The total starch procedure is based on the amylolysis of starch granules using a thermostable α-amylase, rendering soluble branched and unbranched maltodextrins; later, a glucoamylase converts those molecules to glucose that is quantified via glucose oxidase/peroxidase enzyme (GODPOD). In the case of amylose quantification, the starch samples were dissolved and reacted with Concanavalin-A (Con-A), which selectively bounds to the reducing end of amylopectin molecules, creating a complex that facilitates precipitation. Later, the supernatant was recovered and hydrolyzed with a mixture of α-amylase and glucoamylase, rendering glucose molecules quantified with GODPOD.
2.6. Starch Crystallinity
The diffraction patterns of starches were obtained using an Advance D8 diffractometer (Bruker, Coventry, UK) at 35 kV with a CuK-α radiation source (1.542 Å). The samples were scanned in the angular range of 4–35° (2Ɵ). The crystallinity percentage (%C) was determined from the diffractograms calculating the area corresponding to the crystalline peaks (Ap), specifically from the difference between the area under the curve and the area of the amorphous halo, the total area under the curve (At), and the instrumental noise (N) according to Equation (1)
%C = Ap/(At − N)
2.7. Starch and Protein In Vitro Digestibility
All samples’ in vitro digestion fractions were determined according to the Englyst et al. [8] protocol. For this, 400 mg (d.b.) of each material was hydrated with 10 mL of deionized water and heated in a boiling water bath for 20 min with vortexing every 5 min. The tubes were cooled at 37 °C, and 8 mL of pepsin dispersion (5.21 mg/mL) was added and incubated in a shaking water bath at 37 °C. Then, 8 mL of 0.5 M sodium acetate buffer (pH 5.2) was added and homogenized, followed by 4 mL of an enzyme solution (pancreatin, amyloglucosidase, and invertase) and seven glass beads (7 mm diameter). After 20 and 120 min of reaction, 1 mL aliquots were taken and mixed with 2 mL of 80% ethanol; the glucose content was quantified with the glucose oxidase-peroxidase reagent. Starch classifications based on the rate of hydrolysis were calculated with the following equations: rapidly digestible starch (RDS) (digested within 20 min) (Equation (2)), slowly digestible starch (SDS) (Equation (3)), and resistant starch (RS) (Equation (4)). G20 and G120 correspond to the reducing sugar fractions after digestion at 20 min and 120 min, respectively; FG is the weight of reducing sugar before, whereas TS is the weight of total starch in the sample.
RDS (%) = (G20 − FG) × 0.9 × 100/TS
SDS (%) = (G120 − G20) × 0.9 × 100/TS
RS (%) = 100% − SDS − RDS
In vitro Starch Digestion Rate and Predicted Glycemic Index
The method described by Goñi et al. [9], was employed to evaluate the in vitro rate of starch hydrolysis in cooked dispersions. The percentage of hydrolyzed starch by porcine pancreatic α-amylase at 30, 60, 90, 120, and 180 min was estimated. The hydrolysis index (HI) was calculated from the ratio between the area under the hydrolysis curve compared with a reference sample (white bread). The pGI was estimated from the HI, and relative values were calculated using Equation (5).
pGI = 39.71 + 0.549 (HI)
In vitro Protein Digestibility and Free Amino Nitrogen (FAN)
The protocol from Hsu [10] was used to estimate the protein digestibility of samples. A total of 50 mL of an aqueous suspension of the materials, considering a protein amount of 6.25 mg of protein/mL, was prepared. These solutions were adjusted to pH 8.0 with 0.1 N HCl or NaOH. A multienzyme solution of trypsin at 1.6 mg/mL (15 units/mg), chymotrypsin at 3.1 mg/mL (60 units/mg), and peptidase at 1.3 mg/mL (40 units/mg) was adjusted to pH 8.0 and maintained in an ice bath until use. The multienzyme solution (5 mL) was added to the protein suspension and incubated at 37 °C in a water bath with continuous magnetic stirring for 10 min. pH was monitored for 10 min, and the recorded values were used to estimate the In vitro protein digestibility. The free amino nitrogen (FAN) content was determined according to the approved AOAC method 945.30 L [11].
2.8. Bread Formulation and Substitution Design
Bread loaves were prepared using a standardized dough production protocol adapted from the AACC International Method 10-10.03 [5]. The control bread was formulated with 100% wheat flour, while experimental formulations included substitutions of 5%, 10%, and 15% with various starch–hydrocolloid–protein mixtures. Each formulation consisted of a dry blend of native starches (rice, potato, or maize), hydrocolloids (guar gum and xanthan gum), and protein sources (vital and non-vital gluten), which were manually homogenized. The dry mix was combined with water, yeast (3%), salt (2%), sugar (6%), shortening (3%), and non-fat dry milk solids (4%) based on flour weight. Doughs were mixed to optimal development using a mechanical mixer and subjected to fermentation at 30 °C and 85% relative humidity (RH) for 180 min, with intermediate punch-downs at 90 and 135 min. Following fermentation, the doughs were shaped, placed in standard loaf pans, and proofed at 38 °C and 85% RH for 55 min. Baking was carried out in a deck oven at 210 °C for 25 min. After baking, bread loaves were cooled at room temperature for 30 min and subsequently used for digestibility analyses and molecular characterization. This method ensured consistency and reproducibility across all tested formulations.
2.9. Molecular Characterization of Starch, Gums, and Proteins
2.9.1. Molecular Characteristics of Starch
To assess the molecular properties of starch, dried samples were dispersed in 90% DMSO to solubilize starch molecules. The solubilized starch was recovered by precipitation with four volumes of absolute ethanol, following the methodology described by Yoo and Jane [12]. A portion of 500 mg of starch powder was then redissolved in 10 mL of 90% DMSO. The molecular characteristics, including weight-average molecular weight (Mw) and z-average radius of gyration (Rz), were determined using high-performance size-exclusion chromatography coupled with multi-angle laser-light scattering and refractive index detection (HPSEC-MALLS-RI). The system comprised a Waters 1525 binary pump, a Dawn multi-angle laser-light scattering detector, and a Waters 2414 refractive index detector (Wyatt Technology, Santa Barbara, CA, USA). Separation was performed using a Shodex OH Pak KB-guard column and an SB-806 HQ analytical column (Showa Denko KK, JM Science, Ridgeville, SC, USA) with a 0.5 mL/min flow rate and a 4 mg/mL sample concentration.
2.9.2. Molecular Characterization of Gums
Gums (guar and xanthan gum) were extracted and analyzed to determine their molecular size and conformational behavior. Ethanol-insoluble fractions were dissolved in deionized water (2 mg/mL), filtered (0.45 µm), and injected into the same HPSEC-MALLS-RI system used for starch analysis. The hydrocolloid’s molecular weight (Mw) and Rz were calculated using pullulan standards (Agilent Technologies, Santa Clara, CA, USA) for calibration. These parameters provide insight into the hydrocolloids’ viscosity, water-holding capacity, and network-forming potential, which interact with starch and protein to modulate texture and digestion rates.
2.9.3. Molecular Characterization of Proteins
Proteins were analyzed using a sodium phosphate buffer (0.1 M, pH 7.0) containing 1% SDS to ensure vital and non-vital gluten solubilization. The supernatants were lyophilized after centrifugation (10,000× g, 15 min). The molecular weight and radius of gyration of proteins were analyzed using the same HPSEC-MALLS-RI setup. Sample concentrations were adjusted to 2 mg/mL, and a 0.5 mL/min flow rate was maintained. The analysis provided structural data on gluten proteins, such as gliadins and glutenins, which are essential for understanding their interaction with starch and gums, particularly their role in forming protein-starch matrices that affect digestibility and texture.
2.9.4. Amylopectin Debranching and Chain Length Distribution
The debranching of the starch was carried out according to the procedure described by Ao et al. [13], using 15 U of isoamylase (E-ISAMY, Megazyme, Wicklow, Ireland), followed a by 6 h incubation under constant stirring at 45 °C, a CLARET-IR system consisting of a Waters 1525 binary pump (Waters Corp, Milford, MA, USA), with a Waters 2414 refractive index detector, and two HR 10/30 columns connected simultaneously the first containing Superdex 200. The second was with Superdex 30 gel (Amersham Biosciences, Piscataway, NJ, USA), with a 0.4 mL/min flow rate, using deionized water (18 MΩ). Pullulan standards with known molecular weight were used (180, 738, 5900, 11,800, 22,800, 47,300, and 112,000 g/mol) (Agilent, Santa Clara, CA, USA). Each sample was analyzed sequentially using Empower 3 software (Milford, MA, Waters Corp.).
2.9.5. FTIR Analysis of Bread Digestion Residues
By measuring IR properties before and after digestion, we can track molecular breakdown and assess how much of the original structure remains resistant to enzymatic hydrolysis. For this analysis, 5 mL aliquots recovered after Englyst’s protocol at 20 and 120 min were mixed with four volumes of absolute ethanol and centrifuged at 11,000× g for 30 min. The supernatants were discarded and the pellets were re-suspended in 10 mL of absolute ethanol to remove all the hydrolyzed molecules; this step was repeated twice. The washed pellets were vacuum-dried for 12 h at 45 °C. Control bread dispersions (20% solids content) were prepared and incubated in a boiling water bath for 30 min under constant stirring to establish comparisons with undigested samples. Afterward, the samples were quickly frozen with liquid nitrogen and lyophilized. Once dried, all samples were grounded to pass a No. 70 US mesh and stored until analysis in an ATR-FTIR apparatus (Spectrum 1, Perkin Elmer, Norwalk, VA, USA). The molecular spectral data of control and digested samples were collected and corrected with the air background and further analyzed with the Spectrum software (ver. 5.3.0). The spectra were generated in absorption mode with mid-IR (ca. 4000–800 cm−1) with a resolution of 4 cm−1 by 20 scans. A half-band width of 15 cm−1 and a resolution enhancement factor of 1.5 with Bessel apodization were employed. All chemical functional groups were identified using published reports [14,15,16].
2.10. Statistical Analyses
All experiments and procedures described in this research were performed in triplicate. A one-way variance analysis was performed, and when significant differences were found at a significance level of 0.05, a Tukey test of multiple comparisons was used. A Principal Component Analysis (PCA) was also performed to explain the effect of the molecular composition and interactions. All data were analyzed using the Minitab software (Ver. 19.2020, Minitab, Chicago, IL, USA).
3. Results and Discussion
Table 2 provides data on mixtures, showcasing their total starch, amylose, amylopectin, protein, and gum content. The analysis of these components is crucial in understanding their influence on cereal-based products, particularly in terms of digestibility, texture, and overall functionality. Significant variations in starch composition, protein, and gum content were present, critical parameters influencing the functional properties of cereal-based products. The total starch content ranges from 23.52% to 63.53%. High starch content was observed in samples PM.X. (63.53%) and RM..nV (62.83%); this could be favorable for applications requiring high carbohydrate content, such as in bread and other baked goods where starch is a major structural component [17]. Amylose and amylopectin, the two main components of starch, play distinct roles in determining digestibility and functional properties. Amylose content varied from 20.49% to 26.11%, with amylose generally associated with reduced digestibility and a lower glycemic response due to its linear and less accessible structure [17]. The sample with the highest amylose content, P..VnV (26.11%), could be of interest for developing low-glycemic index products, which are increasingly sought for their potential health benefits in managing chronic conditions like diabetes [18]. Conversely, samples with high amylopectin content, such as R.X.VnV (80.98%), are expected to have higher digestibility and could be used where quick energy release is desired. However, this might lead to a higher glycemic response [1]. Protein content also showed substantial variation, ranging from 3.07% to 58.95%. Protein contributes to the structure and texture of bread products by forming gluten networks that trap gas, contributing to loaf volume and crumb structure [2]. The sample P..VnV, with the highest protein content (58.95%), could enhance dough strength and elasticity, making it suitable for products that require a robust structural network. Conversely, samples with lower protein content, such as RP.G. (3.07%), might produce softer, less chewy textures, which could be desirable in specific applications such as cakes or biscuits. Gums, or hydrocolloids, are essential in modifying cereal products’ texture, moisture retention, and shelf-life. High gum content, such as in the .GX.V sample (66.67%), can enhance viscosity, delay starch gelatinization, and improve the overall texture and mouthfeel of the product [19]. Hydrocolloids also interact with proteins and starches, affecting dough rheology and potentially reducing the glycemic index by slowing digestion rates [3]. The interplay between these components highlights the importance of understanding the specific contributions of starch, protein, and hydrocolloids in cereal science. The significant variability observed in this study underscores the potential to tailor cereal-based products to meet specific nutritional and functional requirements, catering to health-conscious consumers and those with dietary restrictions.
Table 2.
Composition of starch, gums, and protein mixtures.
- Starch and protein digestion
Digestibility parameters are essential for evaluating cereal-based products’ nutritional quality and functional performance, especially in developing foods with controlled starch digestion rates and favorable glycemic responses. Table 3 provides insight into the digestibility properties of different samples by measuring Rapidly Digestible Starch (RDS), Slowly Digestible Starch (SDS), Resistant Starch (RS), predicted Glycemic Index (pGI), and protein digestion percentages. These parameters are essential for evaluating cereal-based products’ nutritional quality and functional performance, especially in developing foods with controlled starch digestion rates and favorable glycemic responses. The RDS values in the samples ranged from 44.31% (RM..nV) to 61.65% (PM.X.), indicating substantial variability in how quickly starches are digested. Higher RDS is typically associated with a rapid postprandial glucose response, which can be undesirable for individuals with insulin sensitivity or diabetes [17]. Conversely, samples such as RPM.X.V (42.41% SDS) and RM..nV (39.46% SDS) demonstrated higher levels of SDS, suggesting slower digestion and a more gradual glucose release, which are beneficial for sustained energy and lower glycemic impacts [8]. The RS content, which ranged from 2.04% (PM.X.) to 19.39% (RPM.GX.VnV), is also crucial, as RS resists digestion in the small intestine and is associated with beneficial effects on gut health, including acting as a prebiotic [20].
Table 3.
Starch digestion and digestibility characteristics of starches, gums, and protein mixtures.
The Predicted Glycemic Index (pGI) values ranged from 81.41 (RM..nV) to 86.42 (PM.X.), indicating that most samples fall within a high-GI range. However, the differences in pGI values, though small, could have significant implications for product formulation aimed at glycemic control. The lower pGI values observed in samples such as RPM.X.V and RM..nV align with their higher SDS and RS content, supporting the role of these components in modulating postprandial glucose response [21]. In vitro protein digestion percentages varied widely among the samples, from as low as 0.32% (RP.G.) to as high as 81.65% (RPM.X.V). High protein digestibility is generally desirable as it ensures the bioavailability of essential amino acids necessary for various physiological functions [22]. However, samples with exceptionally low protein digestibility, such as RP.G. and PM.X., may have potential applications in products where reduced protein absorption is beneficial, such as in formulations targeted at individuals with specific dietary restrictions or conditions that require lower protein intake. The interactions between starch components, protein, and gums are pivotal in determining the digestibility characteristics observed.
For instance, the combination of high SDS and RS in RPM.X.V suggests an optimal matrix that delays starch breakdown and slows glucose release, likely due to the interplay between starch granules, protein networks, and hydrocolloids that limit enzyme accessibility [3]. The sample RP.GX.nV, with a balanced distribution of RDS, SDS, and RS, and moderate pGI, could offer a versatile profile suitable for various applications where moderate glycemic response is desired without compromising protein digestibility. The findings highlight the complexity of formulating cereal-based products that cater to specific nutritional needs. The observed variability in digestibility and glycemic properties among the samples underscores the potential to tailor products by strategically manipulating ingredient composition and processing techniques.
- Molecular structure characteristics of mixtures
Molecular weight and structure are critical in understanding the behavior of polysaccharides and proteins during processing and digestion, which can influence the final product’s textural, sensory, and nutritional properties. Table 4 presents molecular weight (Mw) and radius of gyration (Rz) data for starch, gums, and proteins in various samples, offering insights into the structural characteristics and potential functional implications for cereal-based formulations. The starch Mw ranged from 1.84 × 10⁸ g/mol in R.X.VnV to 2.91 × 10⁸ g/mol in P..VnV, indicating variability in starch chain length and branching, which are known to affect gelatinization, pasting behavior, and digestibility [23]. The Rz values for starch ranged from 163.07 nm (R.X.VnV) to 214.04 nm (P..VnV), which may reflect differences in the spatial conformation of the starch molecules. Larger Rz values suggest a more extended and less compact structure, which can impact the starch granules’ water absorption and swelling properties, influencing their gelatinization temperature and ultimately the textural characteristics of the food product [13].
Table 4.
Molecular and structural characteristics of starches, gums and protein mixtures.
Starch molecular weight (Mw) and radius of gyration (Rz) are critical determinants of digestibility, as they directly influence starch granule structure, enzyme accessibility, and gelatinization properties. High molecular weight starches, particularly those with extended amylopectin branches, tend to form more compact and less accessible granules, which reduce enzymatic hydrolysis rates and increase resistant starch (RS) content [24]. Additionally, larger Rz values indicate more expanded polymer chains, which may affect hydration properties and the degree of starch-protein interactions, further modulating digestion kinetics [1]. The present study’s findings align with previous research suggesting that starches with higher Mw and larger Rz exhibit slower digestion rates, contributing to a lower glycemic response [17]. These observations underscore the role of molecular structure in starch digestibility and emphasize the potential for tailoring starch-based food formulations for metabolic health benefits. The Mw of gums varied from 1.8 × 10⁶ g/mol (R.X.VnV) to 2.8 × 10⁶ g/mol (PM.G.V), with corresponding Rz values from 18.03 nm to 26.04 nm. Gums are often used in food formulations to modify viscosity, stabilize emulsions, and form gels. As Mw and Rz indicated, the molecular size and conformation directly influence their functional properties, such as water retention and interaction with other components (e.g., starch and proteins). Larger Mw and Rz values in gums can enhance viscosity and gelation properties, potentially leading to slower starch digestibility by creating a more resistant food matrix [25]. Protein Mw values ranged from 1.11 × 10⁶ g/mol (PM.X.) to 1.33 × 10⁶ g/mol (RPM.X.V), while Rz values ranged from 12.01 nm (M.G.X.nV) to 16.08 nm (GX.V).
These values suggest significant protein size and structure differences, which can influence their interaction with starch and gums, affecting the food product’s overall matrix stability and digestibility [26]. For instance, proteins with larger Rz values may form more extensive networks that can encapsulate starch granules, potentially slowing digestion and reducing the glycemic response [27]. The combined effects of starch, gums, and proteins on the food matrix are complex and interdependent. For example, the sample PM.G.V, which has relatively high Mw for both starch and gums, shows potential for creating a denser, more viscous matrix that could slow starch digestion.
In contrast, R.X.VnV, with the lowest starch Mw and Rz, might result in a more readily digestible product with a higher glycemic index due to the less complex starch structure and reduced gum content. Overall, the data underscore the importance of considering the molecular characteristics of individual components when designing cereal-based products with specific functional and nutritional profiles. The ability to manipulate Mw and Rz through ingredient selection and processing conditions allows for the customization of product properties, such as texture, digestibility, and glycemic response, which are critical in meeting consumer demands for healthier food options.
The molecular weight and structure are critical in understanding the behavior of polysaccharides and proteins during processing and digestion, which can influence the final product’s textural, sensory, and nutritional properties. Table 3 presents molecular weight (Mw) and radius of gyration (Rz) data for starch, gums, and proteins in various samples, offering insights into the structural characteristics and potential functional implications for cereal-based formulations. The starch Mw ranged from 1.84 × 10⁸ g/mol in R.X.VnV to 2.91 × 10⁸ g/mol in P..VnV, indicating variability in starch chain length and branching, which are known to affect gelatinization, pasting behavior, and digestibility [23]. The Rz values for starch ranged from 163.07 nm (R.X.VnV) to 214.04 nm (P..VnV), which may reflect differences in the spatial conformation of the starch molecules. Larger Rz values suggest a more extended and less compact structure, which can impact the starch granules’ water absorption and swelling properties, influencing their gelatinization temperature and ultimately the textural characteristics of the food product [13]. The Mw of gums varied from 1.8 × 10⁶ g/mol (R.X.VnV) to 2.8 × 10⁶ g/mol (PM.G.V), with corresponding Rz values from 18.03 nm to 26.04 nm. Gums are often used in food formulations to modify viscosity, stabilize emulsions, and form gels. As Mw and Rz indicated, the molecular size and conformation directly influence their functional properties, such as water retention and interaction with other components (e.g., starch and proteins). Larger Mw and Rz values in gums can enhance the viscosity and gelation properties, potentially leading to slower starch digestibility by creating a more resistant food matrix [25]. Protein Mw values ranged from 1.11 × 10⁶ g/mol (PM.X.) to 1.33 × 10⁶ g/mol (RPM.X.V), while Rz values ranged from 12.01 nm (M.G.X.nV) to 16.08 nm (GX.V).
These values suggest significant protein size and structure differences, which can influence their interaction with starch and gums, affecting the food product’s overall matrix stability and digestibility [26]. For instance, proteins with larger Rz values may form more extensive networks that can encapsulate starch granules, potentially slowing digestion and reducing the glycemic response [27]. The combined effects of starch, gums, and proteins on the food matrix are complex and interdependent. For example, the sample PM.G.V, which has relatively high Mw for both starch and gums, shows potential for creating a denser, more viscous matrix that could slow starch digestion. In contrast, R.X.VnV, with the lowest starch Mw and Rz, might result in a more readily digestible product with a higher glycemic index due to the less complex starch structure and reduced gum content. Overall, the data underscore the importance of considering the molecular characteristics of individual components when designing cereal-based products with specific functional and nutritional profiles. The ability to manipulate Mw and Rz through ingredient selection and processing conditions allows for the customization of product properties, such as texture, digestibility, and glycemic response, which are critical in meeting consumer demands for healthier food options.
- Principal component analysis of mixtures
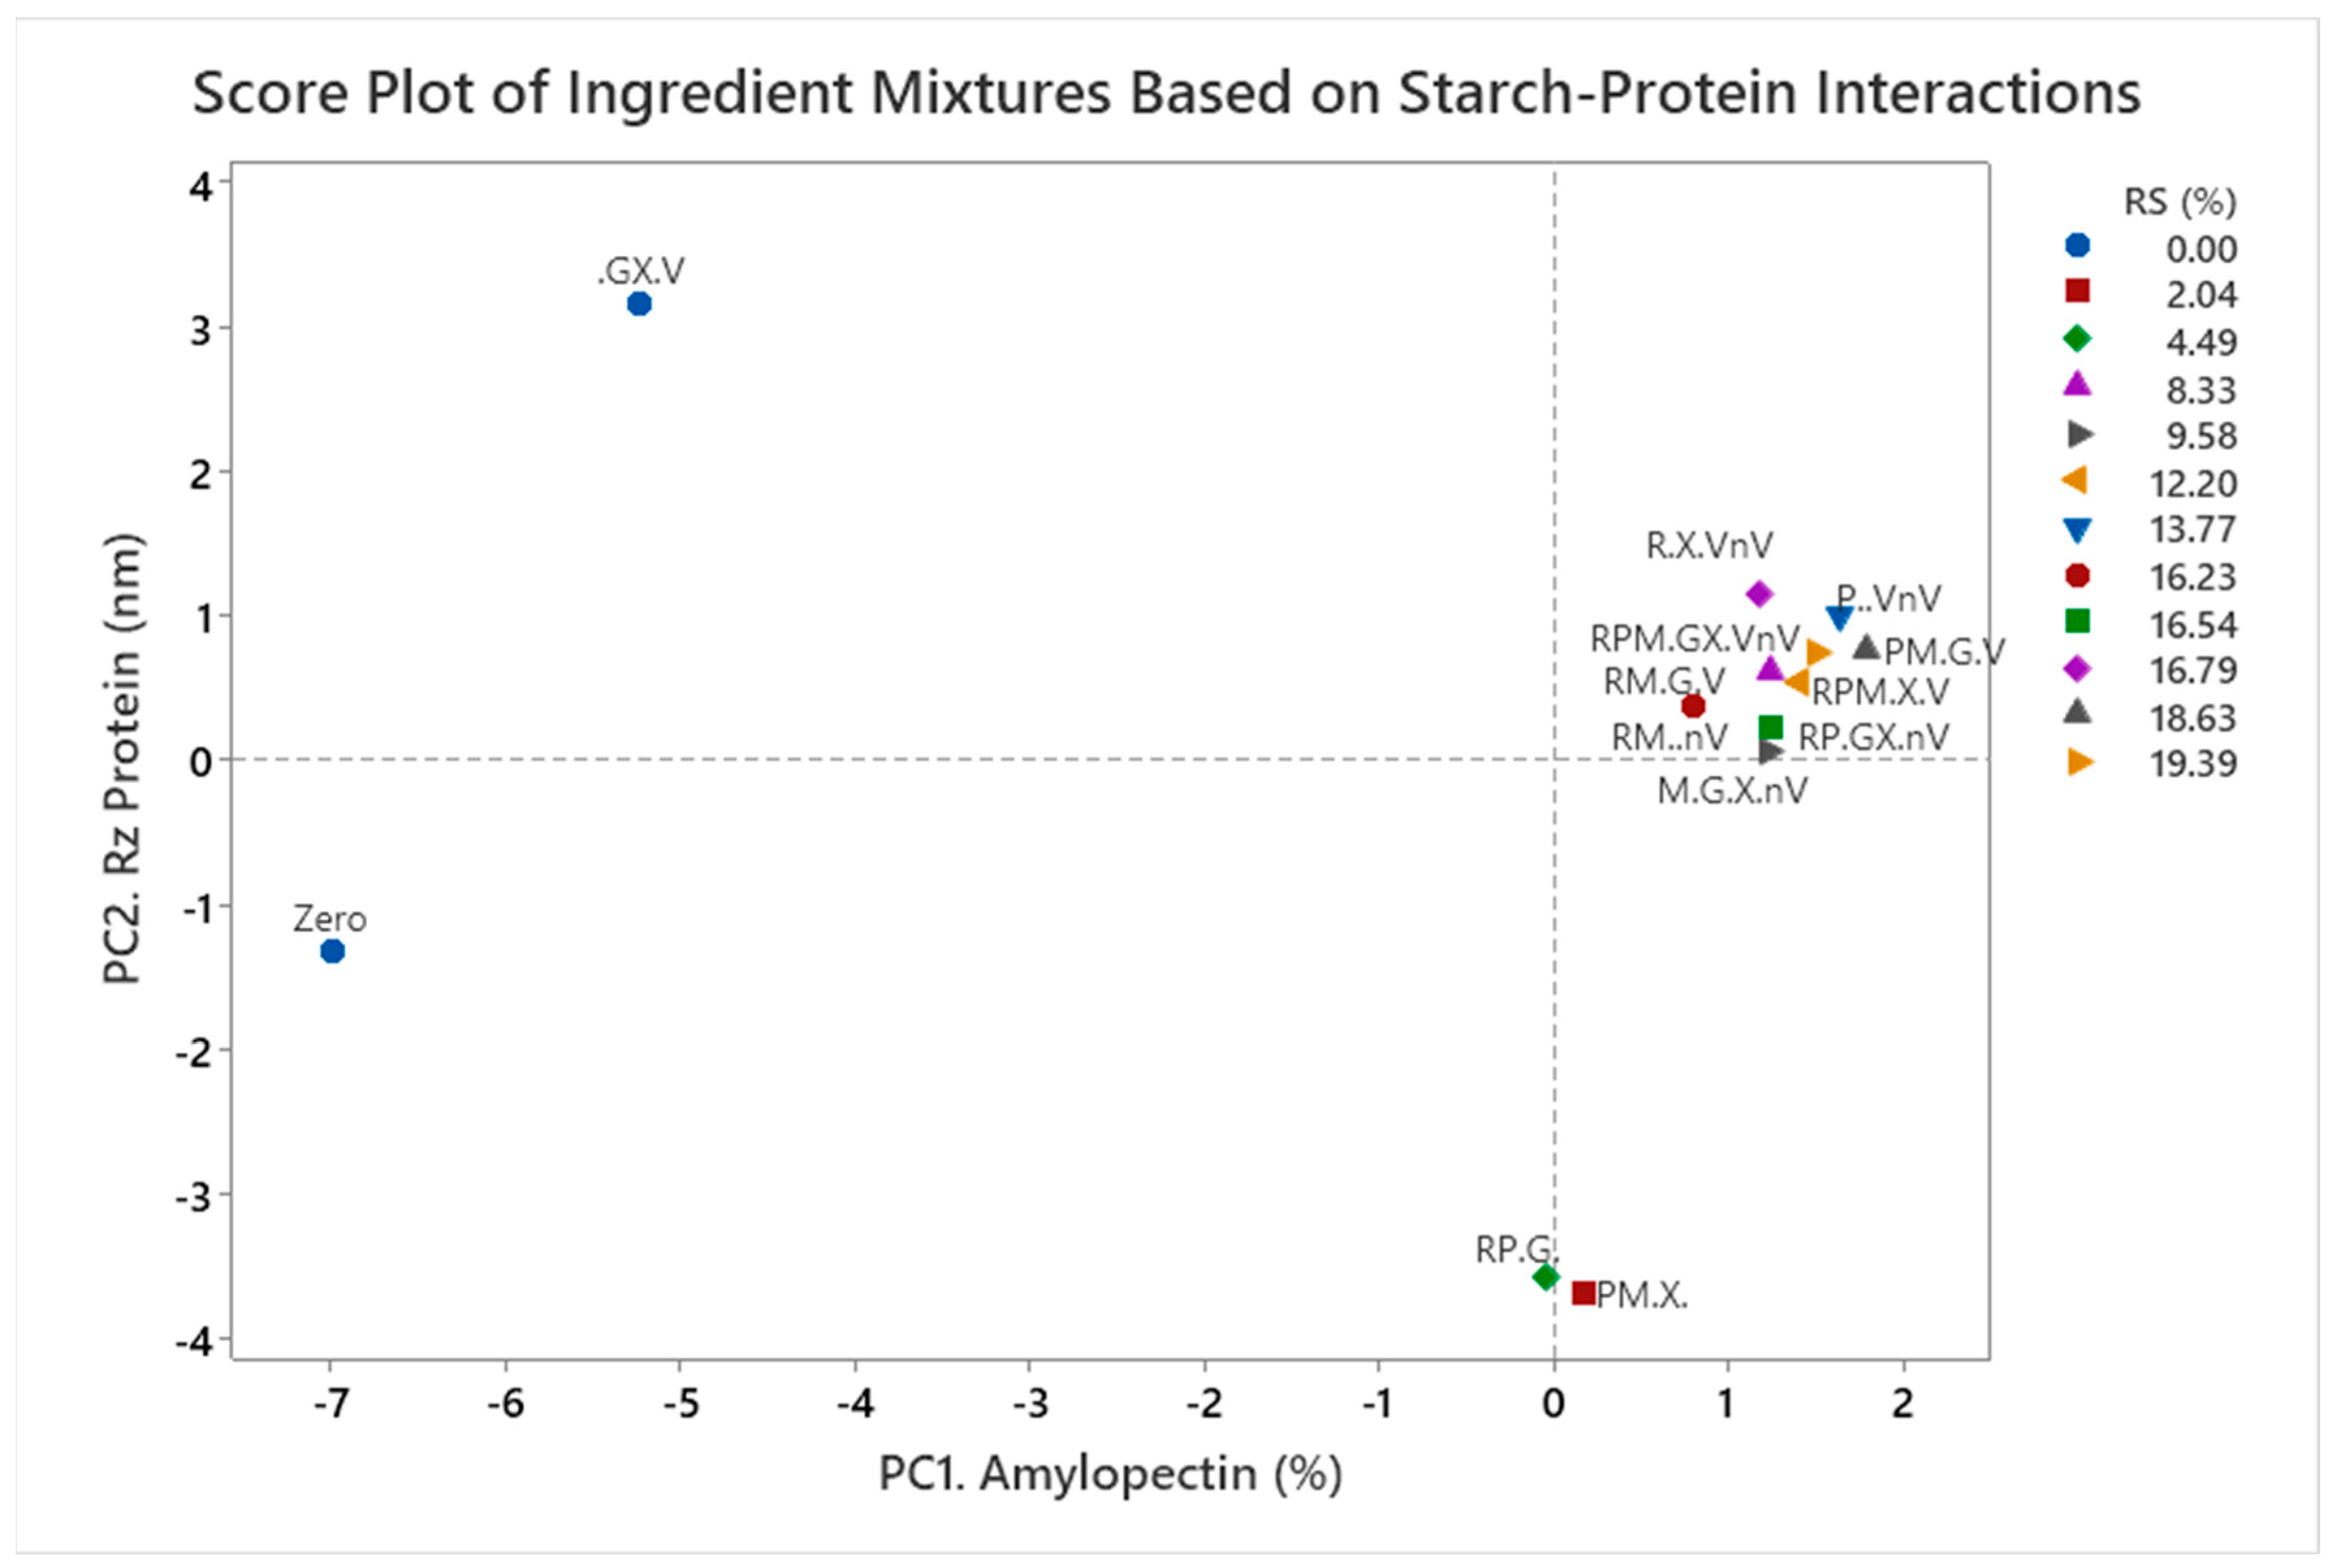
The PCA score plot visually summarizes the relationship between amylopectin, protein, and RS content across various mixtures of starches, gums, and proteins (Figure 1). The central cluster suggests that mixtures with balanced amylopectin and protein contents tend to yield higher resistant starch levels, while outliers might represent specific conditions with atypical RS formation potential. This analysis could guide further exploration of optimal combinations for desired RS content in food formulations. Samples with moderate amylopectin and protein levels in the central cluster generally display higher RS content. This may suggest that specific combinations of starches, gums, and proteins support resistant starch formation. The variance along PC1 implies that amylopectin content significantly differentiates the samples, potentially influencing their RS content when combined with other components. Outliers like “G.X.V” (high on PC2) and “Zero” (low on both axes) could provide insight into formulations with either unusual RS profiles or minimal RS presence, valuable for understanding non-conducive conditions for RS development. Based on this information, samples representing a range of resistant starch (RS) levels were selected to assess their impact on bread formulations. These samples were incorporated into the bread recipe at substitution levels of 5%, 10%, and 15% wheat flour.
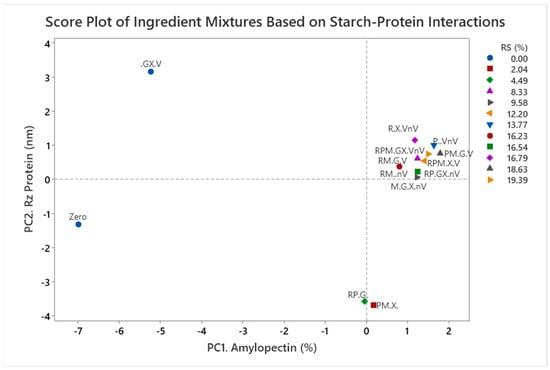
Figure 1.
Principal Component Analysis (PCA) score plot showing clustering of mixtures based on amylopectin (%) (PC1) and protein Rz (nm) (PC2). Each symbol represents a unique formulation of starch, gums, and proteins, with color-coded points indicating resistant starch (RS) content (%). Higher RS values correspond to samples with greater enzyme resistance. The Zero formulation serves as a reference control.
- Bread chemical composition
The data presented in Table 5 explore the impact of varying concentrations of hydrocolloids and protein inclusions. This information is critical for understanding the functional properties of these components, especially product texture, nutritional value, and digestibility. The total starch content generally decreases as the level of hydrocolloids and protein fortification increases, which is particularly noticeable in the RPM.GX.VnV samples with 5%, 10%, and 15% fortifications, where starch decreased from 72.45% to 64.82%. This reduction can be attributed to the dilution effect caused by adding protein and hydrocolloids, which replace a portion of the starch in the formulation. Lower starch content can lead to decreased gelatinization, potentially affecting the texture and firmness of the final product [28]. There is a consistent increase in protein content with higher levels of fortification across the samples, from 12.27% in the control to as high as 15.06% in RPM.GX.VnV 15%. This enhancement in protein levels is significant because proteins can interact with starch and gums, modifying the dough’s rheological properties and potentially increasing the nutritional value by providing a richer amino acid profile [25].
Table 5.
Bread chemical composition using mixtures of starches, gums and proteins.
The increased protein may also interact with starch to form more complex networks that could alter the digestibility of the product, with potential applications in designing lower glycemic index foods [29]. The lipid content decreases slightly across all formulations, from 5.14% in the control to as low as 3.12% in .GX.V 15%. This decrease might influence the overall mouthfeel and palatability of the products, as lipids contribute to the softness and richness of texture [30]. Moreover, lipids can also play a role in starch-protein interactions by creating a barrier around starch granules, which may impact the rate of starch digestion. Ash content, which represents the mineral composition, increases significantly with higher fortification levels, reaching up to 16.47% in RPM.GX.VnV 15%. This rise indicates an improved mineral profile, which can be advantageous for enhancing the nutritional quality of the product. High ash content may also correlate with increased inorganic content from the added hydrocolloids, which can influence the dough’s ionic strength and hydration properties [3]. Gums, as hydrocolloids, are added in increasing amounts in the fortified samples, with content rising to 6.50% in RPM.GX.VnV 15%. Including gums affected the viscosity and stability of the dough matrix. This can lead to improved water retention and modification of the digestibility of starch and proteins, contributing to a potential reduction in the glycemic index of the product [25]. These changes can be leveraged to tailor the product’s digestibility, texture, and nutritional profile, offering pathways for developing healthier cereal foods with specific functional benefits, such as improved satiety or controlled glucose release.
- Bread digestibility
This table presents data on rapidly digestible starch (RDS), slowly digestible starch (SDS), resistant starch (RS), predicted glycemic index (pGI), protein digestion, free sugars, and free amino nitrogen (FAN) across various formulations of cereal-based products
Table 6). The analysis provides insights into the nutritional and functional modifications associated with different levels of hydrocolloids and protein fortification. The free sugar content generally increases with fortification, rising from 6.36% in control to 9.86% in RP.GX.nV 15%. While free sugars can enhance the palatability of food products, they also necessitate careful consideration due to their impact on the glycemic response and overall caloric intake. The RDS content, which reflects the fraction of starch rapidly hydrolyzed into glucose, decreases significantly with higher fortification levels.
Table 6.
Starch and protein digestion characteristics of bread using mixtures of starches, gums and proteins.
For instance, RDS drops from 87.21% in the control to 61.12% in RP.GX.nV 15%. This trend suggests that increased hydrocolloid and protein content leads to a slower rate of starch hydrolysis, which could lower the glycemic response of the products. Hydrocolloids are known to form viscous gels that can entrap starch granules, thereby reducing their accessibility to digestive enzymes [17]. The SDS and RS content generally increase with fortification, indicating enhanced starch resistance to enzymatic digestion. For example, SDS increases from 10.63% in the control to 23.23% in RP.GX.nV 15%, while RS rises from 2.16% to 15.65%. The increase in RS, in particular, is beneficial as RS is not digested in the small intestine and thus functions as dietary fiber, contributing to improved gut health and glycemic control [31]. The formation of RS can be promoted by interactions between starch, proteins, and gums, which alter the crystalline structure of starch. The pGI values decrease with increasing fortification, from 94.06 in control to 83.83 in RP.GX.nV 15%. A lower pGI suggests a slower release of glucose into the bloodstream, which is advantageous for managing blood sugar levels. This reduction in pGI aligns with the observed increases in SDS and RS, as both contribute to a slower digestion rate and a more gradual glucose release [32]. Protein digestion slightly improves with fortification, increasing from 81.21% in the control to 85.63% in RP.GX.nV 15%. Enhanced protein digestibility could be due to the protective effects of hydrocolloids, which can reduce protein aggregation and maintain a more soluble and digestible protein structure [33]. Improved protein digestion is crucial for bioavailability and utilization of essential amino acids.
The FAN levels, indicative of protein degradation and amino acid availability, increase notably across the samples, reaching 42.22% in .GX.V 15%, up from 21.41% in control. High FAN values suggest an increase in the availability of free amino acids, which can improve the nutritional quality of the products. This increase is likely due to the enhanced enzymatic hydrolysis of proteins facilitated by hydrocolloid interactions that prevent protein denaturation and aggregation [34]. The compositional shifts observed across these fortified cereal products highlight the potential of hydrocolloids and proteins to modulate starch digestibility, glycemic response, and protein bioavailability. By increasing SDS and RS content and reducing the pGI, these modifications can contribute to the development of healthier cereal-based foods with extended satiety and reduced impact on blood glucose levels.
- Principal component and cluster statistical analyses
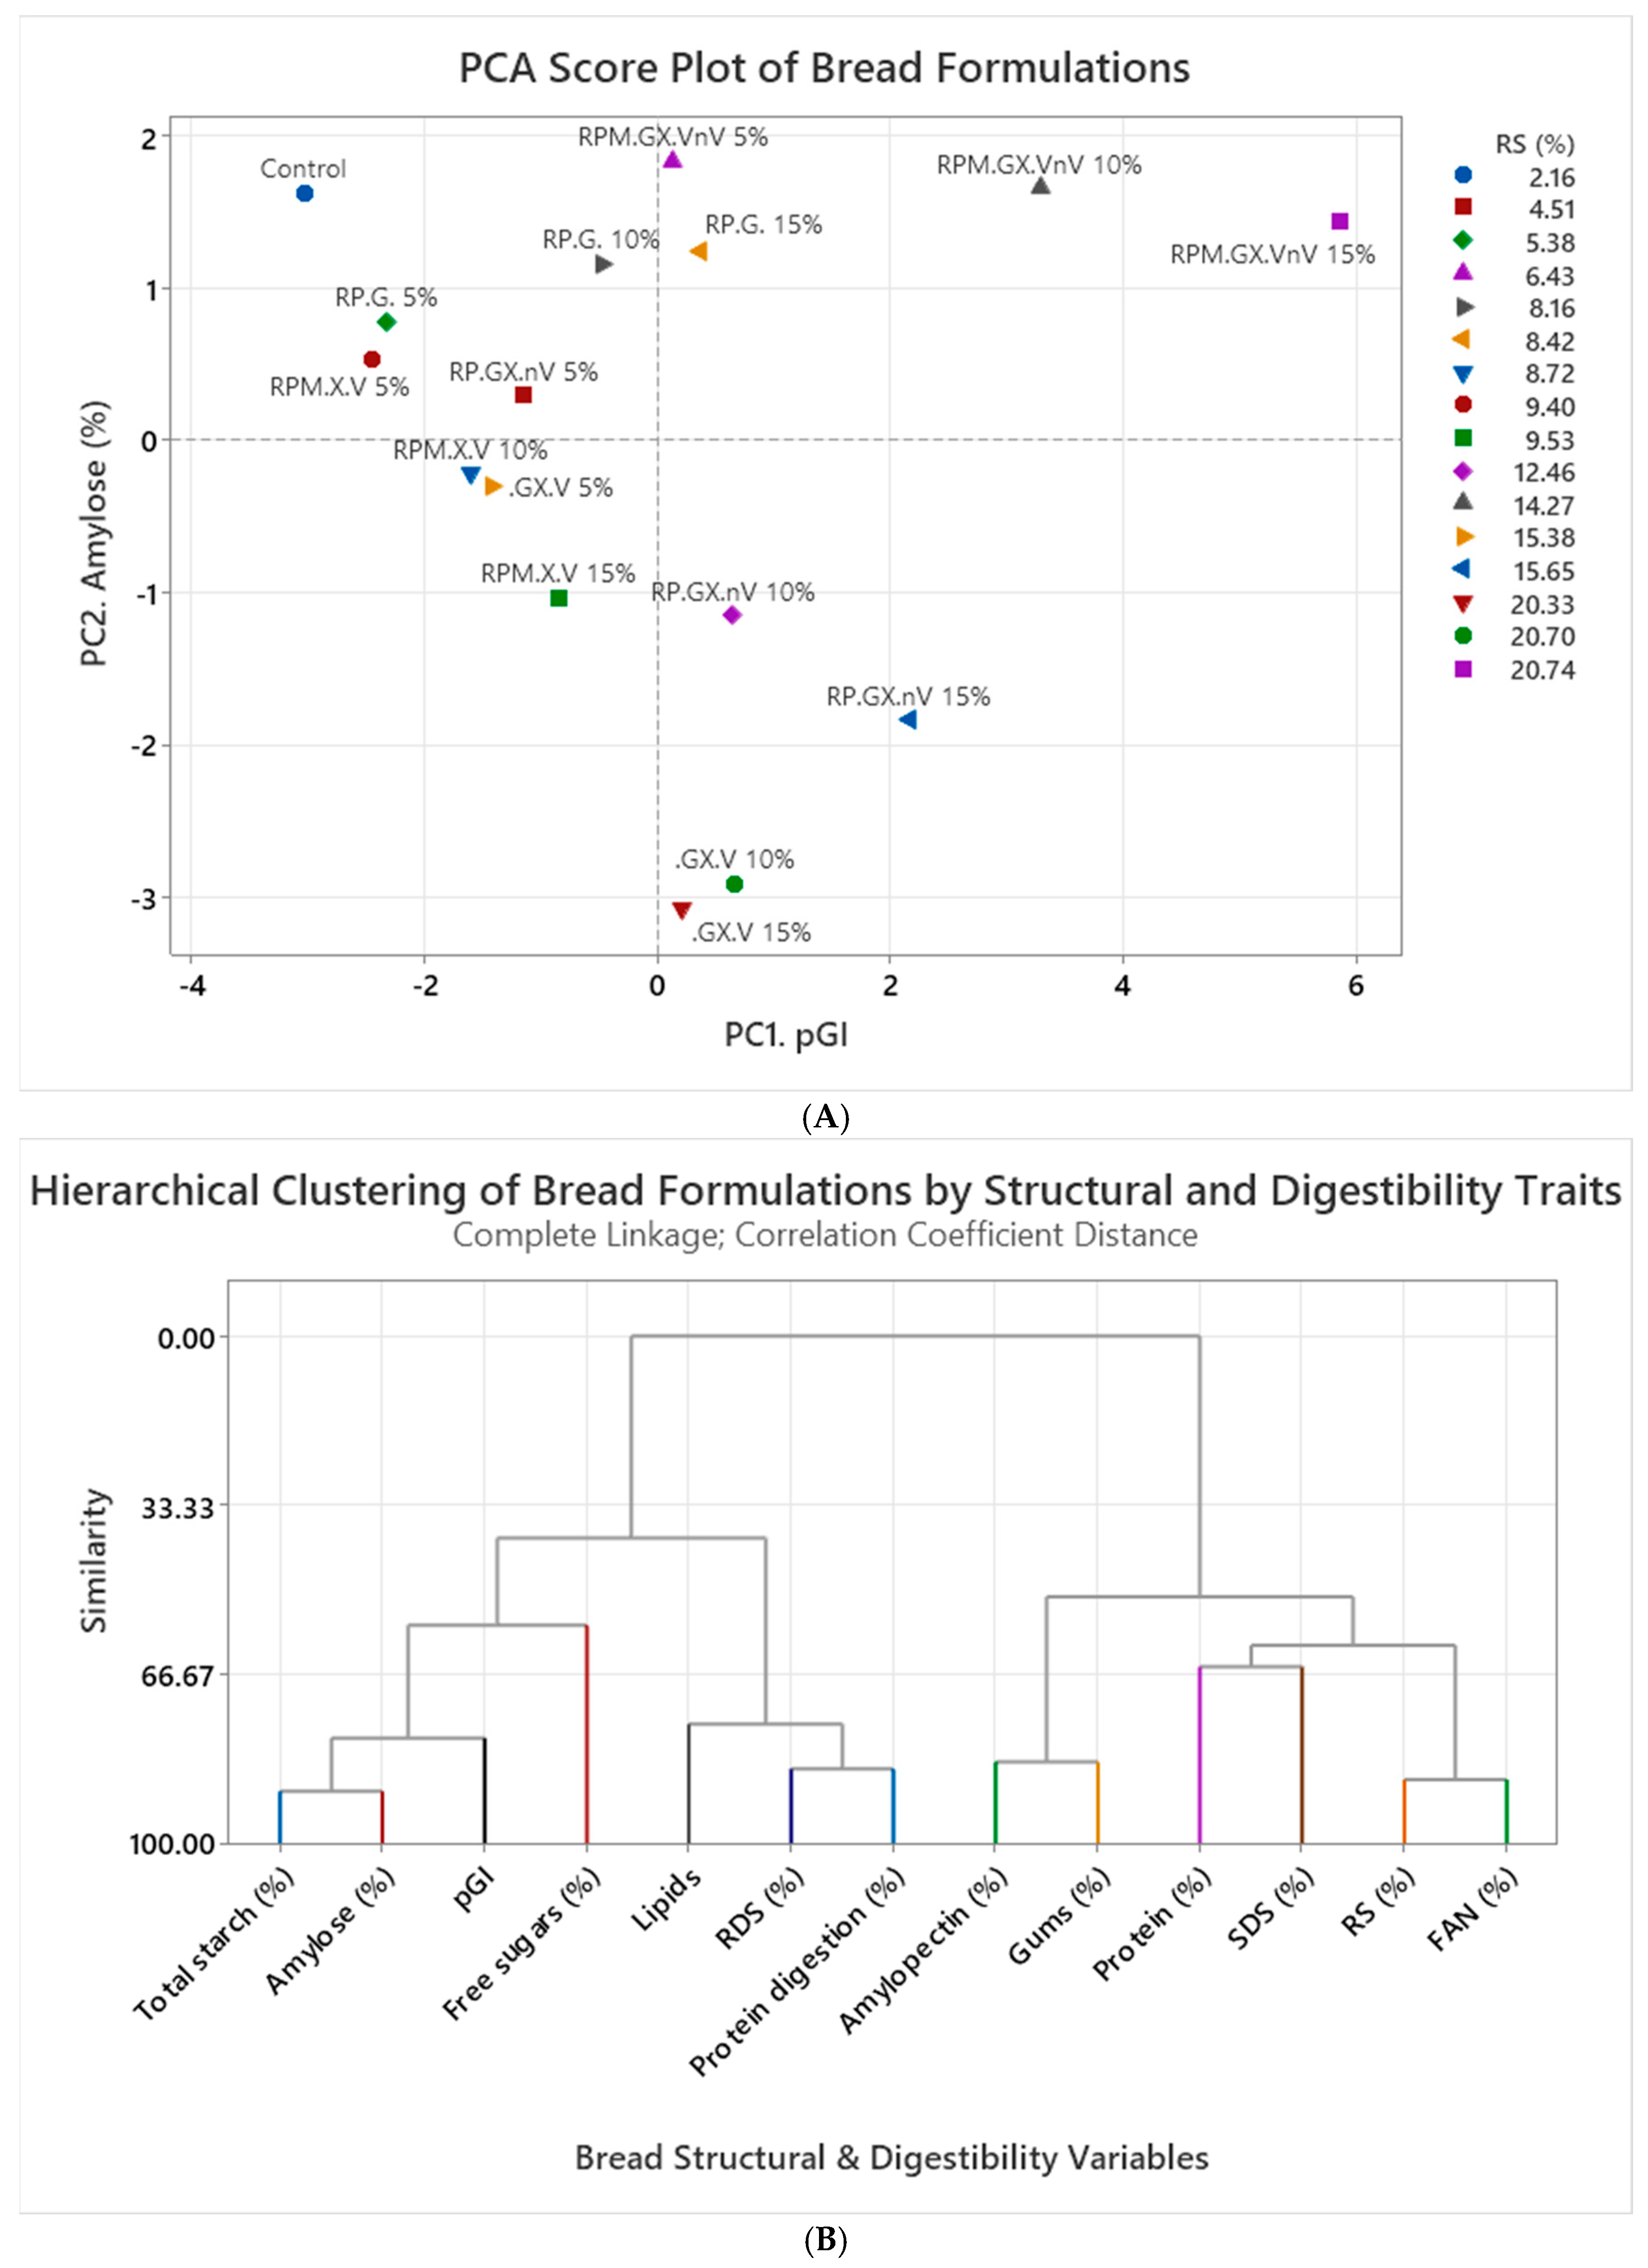
The PCA score plot in Figure 2A presents an overview of bread samples with varying percentages of starch–gum–protein mixtures. It is visualized according to their two main principal components: PC1, which reflects properties related to glycemic index potential, and PC2, associated with amylose content. The score plot shows the clustering and separation of samples based on these two key attributes. Bread samples with higher PC1 values are generally associated with increased pGI, suggesting a stronger postprandial glucose response. This response can be modulated by amylose content, where higher levels of amylose may reduce digestibility and favor resistant starch (RS) formation. For example, the control sample, lacking additional functional ingredients, is positioned in the upper-left quadrant and displays moderate pGI and amylose levels.
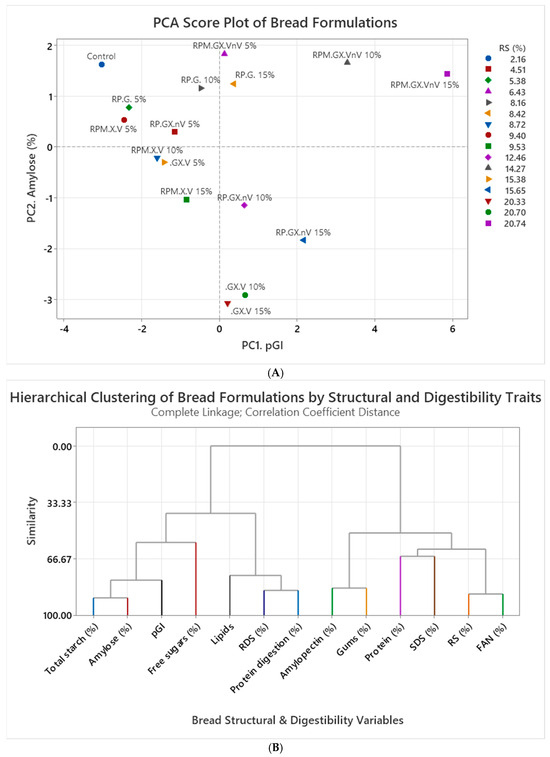
Figure 2.
Multivariate analysis of bread formulations based on starch, hydrocolloids, and protein substitutions: (A) Principal Component Analysis (PCA) score plot showing relationships between predicted glycemic index (pGI) and amylose content; (B) dendrogram clustering based on structural and digestibility parameters.
In contrast, the RPM.GX.VnV 15% formulation appears in the upper-right quadrant with the highest RS content (20.74%), implying that specific combinations of starch, protein, and hydrocolloids can generate a matrix more resistant to enzymatic digestion. Higher RS values were also observed in samples such as RPM.GX.VnV 10% and RPM.X.V 15%, indicating that elevated substitution levels of these mixtures may promote RS formation through enhanced interactions between starch, proteins, and gums. These results are consistent with reports from the literature describing the role of hydrocolloids and proteins in modulating starch gelatinization and retrogradation behaviors [35]. Conversely, samples like GX.V 10% and GX.V 15% clustered in the lower-left quadrant, showing lower RS content—likely a consequence of lower amylose concentrations or less synergistic matrix formation [36]. It is worth noting that PCA is primarily an exploratory technique used to reduce data dimensionality and detect multivariate patterns rather than a method for quantifying direct relationships between variables. This study applied PCA to complement univariate and bivariate statistical tools by revealing broader structural relationships that emerge from the interplay among starch type, protein content, and functional additives.
Complementary to the PCA, the hierarchical clustering analysis in Figure 2B further organizes variables based on shared variance. For instance, the second cluster—free sugars, lipids, RDS, and protein digestibility—relates to rapid energy release and structural disintegration. The third cluster, which includes amylopectin, gums, and protein content, aligns with functional and rheological contributions to dough behavior and crumb architecture [2,37]. The fourth cluster, linking SDS, RS, and free amino nitrogen (FAN), reveals nutritional interactions between starch digestibility and protein degradation, potentially affecting fermentation, satiety, and glycemic response. These multivariate groupings emphasize how ingredient selection and formulation strategies can simultaneously influence multiple technological and nutritional outcomes [38,39].
- Bread molecular characteristics during in vitro digestion
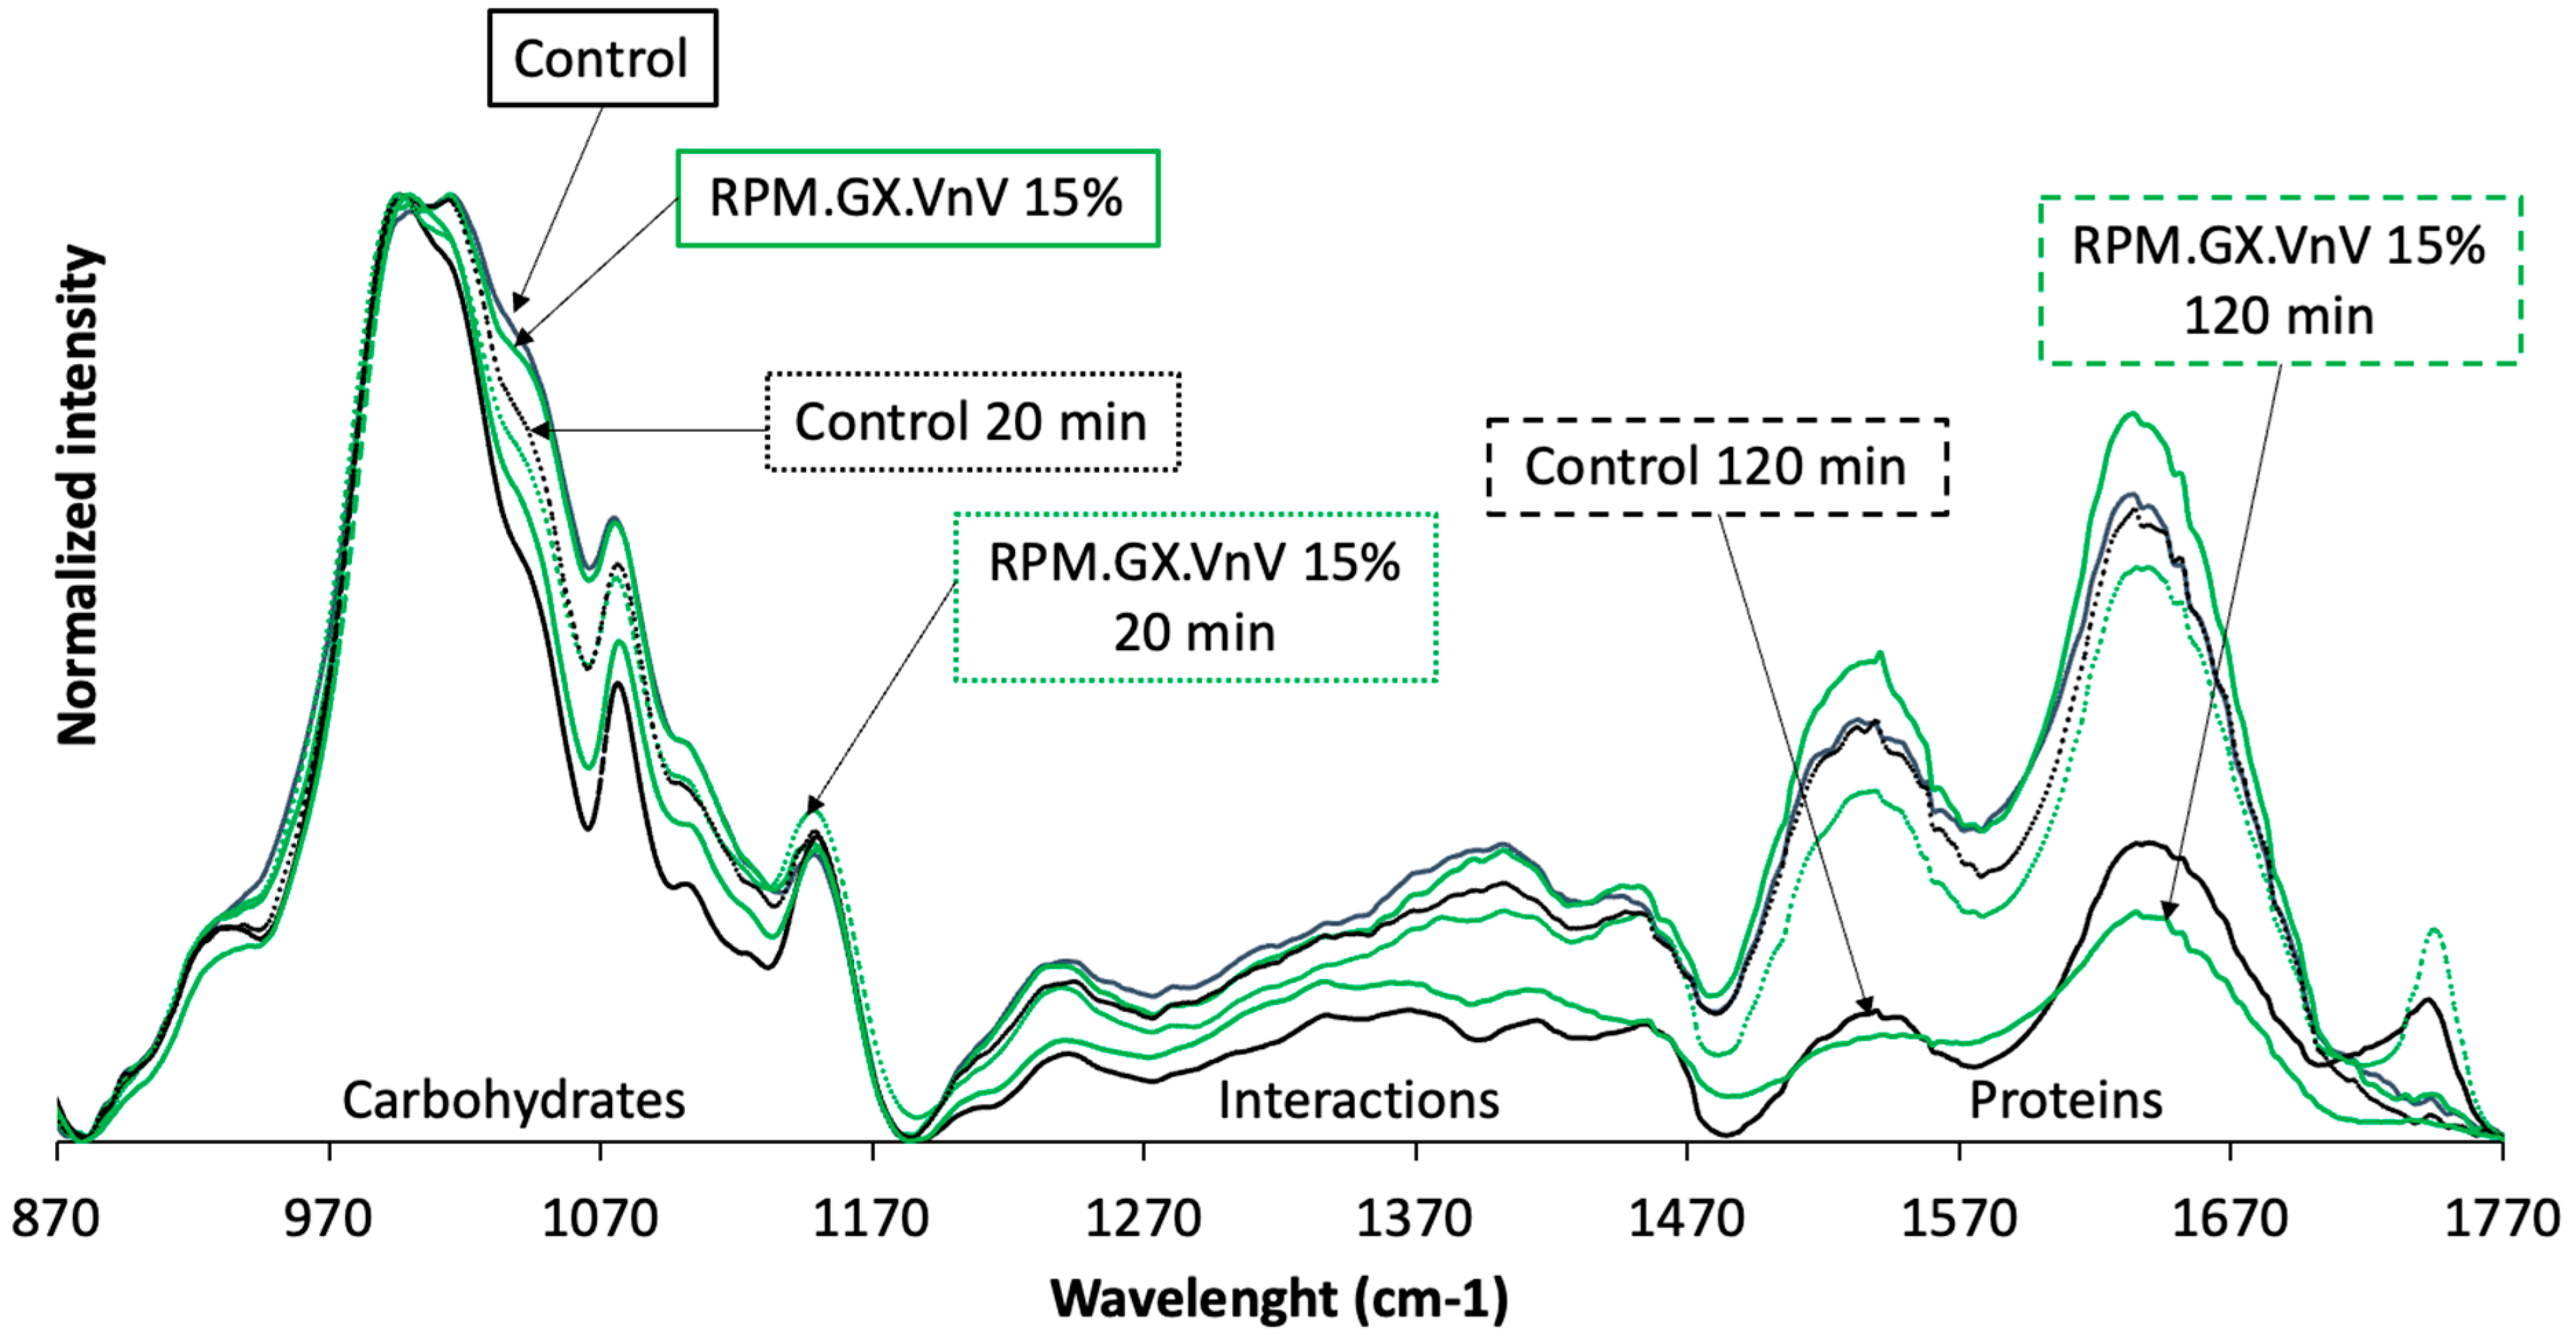
The FTIR graph illustrates molecular differences in bread samples and their digested residues at 20 and 120 min that correspond to the SDS and RS fractions from the Englyst protocol, highlighting the effects of RPM.GX.VnV (15%) treatment (Figure 3). Key regions include carbohydrates (900–1200 cm−1), molecular interactions (1200–1500 cm−1), and proteins (1500–1700 cm−1). In the carbohydrate region, a decrease in peak intensity over time indicates partial digestion, while RPM.GX.VnV-treated samples show slower degradation, suggesting that using proteins and gums alters the food matrix, potentially enhancing resistance to enzymatic breakdown [23,29].
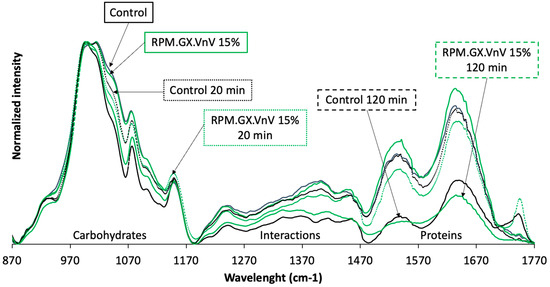
Figure 3.
FTIR spectroscopic analysis of digested bread residues highlighting structural changes in starch and protein.
In the interaction region, moderate spectral changes suggest rearrangements in protein–carbohydrate or protein–lipid interactions during digestion. RPM.GX.VnV treatment may stabilize these interactions, forming complexes that resist enzymatic activity [39]. The protein region reveals significant differences in the amide I (1650 cm−1) and amide II (1550 cm−1) bands, reflecting changes in protein secondary structures. The untreated control shows faster protein degradation, while the treated samples retain higher peak intensity, indicating slowed protein breakdown. These observations suggest that the vital and non-vital gluten within RPM.GX.VnV treatment modifies the food matrix, potentially through cross-linking or interaction with macromolecules, thereby reducing the accessibility of carbohydrates and proteins to digestive enzymes [27,39]. Comparative analysis shows that untreated samples exhibit faster digestion, while treated samples demonstrate slower breakdown across all molecular regions, highlighting the treatment’s potential to modulate digestion dynamics. This could have applications in developing functional bread formulations aimed at glycemic control or weight management by slowing carbohydrate and protein digestion. Further research should focus on quantifying digestion rates using peak intensity changes, correlating these with glycemic index measurements, and studying enzyme-specific interactions to confirm inhibitory effects.
4. Conclusions
This study investigated the influence of starch molecular structure, hydrocolloids, and gluten on bread digestibility, providing insights into the potential for developing low-glycemic index bread formulations. The findings demonstrated that starch molecular weight (Mw) and radius of gyration (Rz) significantly impact digestibility, with higher Mw and Rz values correlating with reduced enzymatic hydrolysis and increased resistant starch (RS) content. Adding hydrocolloids (guar gum and xanthan gum) modified the starch-protein matrix, changing gelatinization properties and digestibility kinetics. Furthermore, variations in vital and non-vital gluten content influenced starch-protein interactions, affecting the overall structure and enzymatic accessibility of bread formulations. This study demonstrates the potential of integrating hydrocolloids and proteins with different starch sources to modulate bread’s attributes. By combining rice, potato, and maize starches with guar gum, xanthan gum, and vital gluten, the study achieved significant improvements in glycemic response through increased RS and slowly digestible starch (SDS) fractions while reducing rapidly digestible starch (RDS). These modifications contributed to a lower predicted glycemic index (pGI), aligning with dietary strategies for managing metabolic disorders such as diabetes. The findings reveal that starch molecular characteristics, such as Mw and Rz, play a critical role in digestion dynamics. Adding hydrocolloids enhanced viscosity and created a resistant matrix, slowing enzyme access and starch hydrolysis. Similarly, gluten proteins contributed to dough structure and interacted with starch to form a matrix that delayed digestion. The principal component analysis (PCA) and hierarchical clustering provided a robust statistical framework for understanding the relationships between molecular characteristics and digestibility. Bread formulations with higher amylose content and structured hydrocolloid interactions exhibited a lower pGI, highlighting their potential for functional food applications aimed at glycemic control. Future research should focus on in vivo validating these findings through glycemic response trials, processing optimization to explore how fermentation or enzymatic modifications alter starch digestibility, and nutritional and sensory evaluations to assess consumer acceptability, texture, and shelf-life. Exploring novel starch sources (e.g., legume starches), alternative hydrocolloids, and protein sources could provide new strategies for designing healthier, low-GI bread products. Sensory evaluations and consumer acceptability studies will translate these formulations into commercially viable products that meet health and sensory quality demands. Overall, this research highlights the importance of molecular structure in food digestibility and lays the groundwork for future innovations in functional cereal-based products that cater to health-conscious consumers.
Funding
This research received no external funding.
Institutional Review Board Statement
Not applicable.
Data Availability Statement
Data is available upon request.
Acknowledgments
I wish to dedicate this work to the memory of Sergio Serna-Saldívar, whose profound knowledge, mentorship, and passion for cereal science and breadmaking left a lasting impact on my academic journey and personal growth. His generosity in sharing his expertise and his unwavering dedication to advancing food science continue to inspire me. I am deeply grateful for the many lessons he imparted—both in and out of the lab—which have shaped my approach to research, teaching, and innovation. His legacy lives on in the countless students and colleagues he influenced, myself among them.
Conflicts of Interest
The authors declare no conflict of interest.
References
- Copeland, L.; Blazek, J.; Salman, H.; Tang, M.C. Form and functionality of starch. Food Hydrocoll. 2009, 23, 1527–1534. [Google Scholar] [CrossRef]
- Gómez, M.; Ronda, F.; Blanco, C.A.; Caballero, P.A.; Apesteguía, A. Effect of dietary fibre on dough rheology and bread quality. Eur. Food Res. Technol. 2003, 216, 51–56. [Google Scholar] [CrossRef]
- Funami, T. Next target for food hydrocolloid studies: Texture design of foods using hydrocolloid technology. Food Hydrocoll. 2011, 25, 1904–1914. [Google Scholar] [CrossRef]
- Rosell, C.M.; Rojas, J.A.; de Barber, C.B. Influence of hydrocolloids on dough rheology and bread quality. Food Hydrocoll. 2001, 15, 75–81. [Google Scholar] [CrossRef]
- AACC International. Approved Methods of Analysis, 11th ed.; AACC International: St. Paul, MN, USA, 2010. [Google Scholar]
- Kohajdová, Z.; Karovičová, J. Application of hydrocolloids as baking improvers. Chem. Pap. 2009, 63, 26–38. [Google Scholar] [CrossRef]
- de la Rosa-Millán, J. Physicochemical, molecular, and digestion characteristics of annealed and heat–moisture treated starches under acidic, neutral, or alkaline pH. Cereal Chem. 2017, 94, 770–779. [Google Scholar] [CrossRef]
- Englyst, K.N.; Liu, S.; Englyst, H.N. Nutritional characterization and measurement of dietary carbohydrates. Eur. J. Clin. Nutr. 2007, 61, S19–S39. [Google Scholar] [CrossRef]
- Goñi, I.; Garcia-Alonso, A.; Saura-Calixto, F. A starch hydrolysis procedure to estimate glycemic index. Nutr. Res. 1997, 17, 427–437. [Google Scholar] [CrossRef]
- Hsu, H.W.; Vavak, D.L.; Satterlee, L.; Miller, G.A. A multienzyme technique for estimating protein digestibility. J. Food Sci. 1977, 42, 1269–1273. [Google Scholar] [CrossRef]
- AOAC. Official Methods of Analysis, 15th ed.; Association of Official Analytical Chemists: Washington, DC, USA, 1990. [Google Scholar]
- Yoo, S.H.; Jane, J.L. Molecular weights and gyration radii of amylopectins determined by high-performance size-exclusion chromatography equipped with multi-angle laser-light scattering and refractive index detectors. Carbohydr. Polym. 2002, 49, 307–314. [Google Scholar] [CrossRef]
- Ao, Z.; Simsek, S.; Zhang, G.; Venkatachalam, M.; Reuhs, B.L.; Hamaker, B.R. Starch with a slow digestion property produced by altering its chain length, branch density, and crystalline structure. J. Agric. Food Chem. 2007, 55, 4540–4547. [Google Scholar] [CrossRef] [PubMed]
- Susi, H.; Byler, D.M. Protein structure by Fourier transform infrared spectroscopy: Second derivative spectra. Biochem. Biophys. Res. Commun. 1983, 115, 391–397. [Google Scholar] [CrossRef] [PubMed]
- Yu, P.; McKinnon, J.J.; Christensen, C.R.; Christensen, D.A. Using synchrotron-based FTIR microspectroscopy to reveal chemical features of feather protein secondary structure: Comparison with other feed protein sources. J. Agric. Food Chem. 2004, 52, 7353–7361. [Google Scholar] [CrossRef]
- Vernon-Carter, E.J.; Hernandez-Jaimes, C.; Meraz, M.; Lara, V.H.; Lobato-Calleros, C.; Alvarez-Ramirez, J. Physico-chemical characterization and in vitro digestibility of gelatinized corn starch dispersion fractions obtained by centrifugation. Starch/Staerke 2015, 67, 701–708. [Google Scholar] [CrossRef]
- Singh, J.; Dartois, A.; Kaur, L. Starch digestibility in food matrix: A review. Trends Food Sci. Technol. 2010, 21, 168–180. [Google Scholar] [CrossRef]
- Denardin, C.C.; da Silva, L.P. Starch granules structure and its regards with physicochemical properties [Estrutura dos grânulos de amido e sua relação com propriedades físico-químicas]. Cienc. Rural 2009, 39, 945–954. [Google Scholar] [CrossRef]
- Lazaridou, A.; Biliaderis, C.G. Molecular aspects of cereal β-glucan functionality: Physical properties, technological applications and physiological effects. J. Cereal Sci. 2007, 46, 101–118. [Google Scholar] [CrossRef]
- Nugent, A.P. Health properties of resistant starch. Nutr. Bull. 2005, 30, 27–54. [Google Scholar] [CrossRef]
- Atkinson, F.S.; Foster-Powell, K.; Brand-Miller, J.C. International tables of glycemic index and glycemic load values: 2008. Diabetes Care 2008, 31, 2281–2283. [Google Scholar] [CrossRef]
- Gilani, G.S.; Xiao, C.W.; Cockell, K.A. Impact of antinutritional factors in food proteins on the digestibility of protein and the bioavailability of amino acids and protein quality. Br. J. Nutr. 2012, 108, S315–S332. [Google Scholar] [CrossRef]
- Yaskin Harush, M.; Shani Levi, C.; Lesmes, U. Potential of Process-Induced Modification of Potato Starch to Modulate Starch Digestibility and Levels of Resistant Starch Type III. Foods 2025, 14, 880. [Google Scholar] [CrossRef] [PubMed]
- Wang, S.; Copeland, L.; Wang, S. Molecular disassembly of starch granules during gelatinization and its effect on starch digestibility: A review. Food Funct. 2015, 6, 3360–3372. [Google Scholar] [CrossRef] [PubMed]
- Scott, G.; Awika, J. Effect of protein–starch interactions on starch retrogradation and implications for food product quality. Compr. Rev. Food Sci. Food Saf. 2023, 22, 2081–2111. [Google Scholar] [CrossRef]
- Yamul, Y.K.; Navarro, A.S. Effect of hydrocolloids on structural and functional properties of wheat/potato (50/50) flour dough. Food Struct. 2020, 24, 100138. [Google Scholar] [CrossRef]
- Tsai, P.-C.; Lai, L.-S. In Vitro Starch Digestibility, Rheological, and Physicochemical Properties of Water Caltrop Starch Modified with Cycled Heat-Moisture Treatment. Foods 2021, 10, 1687. [Google Scholar] [CrossRef]
- Zhu, P.; Wang, M.; Du, X.; Chen, Z.; Liu, C.; Zhao, H. Morphological and physicochemical properties of rice starch dry heated with whey protein isolate. Food Hydrocoll. 2020, 109, 106091. [Google Scholar] [CrossRef]
- Ronda, F.; Perez-Quirce, S.; Lazaridou, A.; Biliaderis, C.G. Effect of barley and oat β-glucan concentrates on gluten-free rice-based doughs and bread characteristics. Food Hydrocoll. 2015, 48, 197–207. [Google Scholar] [CrossRef]
- Miao, M.; Jiang, B.; Cui, S.W.; Zhang, T.; Jin, Z. Slowly digestible starch—A review. Crit. Rev. Food Sci. Nutr. 2015, 55, 1642–1657. [Google Scholar] [CrossRef]
- Fardet, A.; Leenhardt, F.; Lioger, D.; Scalbert, A.; Rémésy, C. Parameters controlling the glycaemic response to breads. Nutr. Res. Rev. 2006, 19, 18–25. [Google Scholar] [CrossRef]
- Fennema, O.R. Food Chemistry, 3rd ed.; Marcel Dekker, Inc.: New York, NY, USA, 1996. [Google Scholar]
- Schwenzer, A.-K.; Kruse, L.; Jooß, K.; Neusüß, C. Capillary electrophoresis-mass spectrometry for protein analyses under native conditions: Current progress and perspectives. Proteomics 2024, 24, e2300135. [Google Scholar] [CrossRef]
- Raigond, P.; Ezekiel, R.; Raigond, B. Resistant starch in food: A review. J. Sci. Food Agric. 2015, 95, 1968–1978. [Google Scholar] [CrossRef] [PubMed]
- Zhong, Y.; Tai, L.; Blennow, A.; Ding, L.; Herburger, K.; Qu, J.; Xin, A.; Guo, D.; Hebelstrup, K.; Xinxun, L. High-amylose starch: Structure, functionality and applications. Crit. Rev. Food Sci. Nutr. 2022, 63, 8568–8590. [Google Scholar] [CrossRef] [PubMed]
- Gómez, M.; Ronda, F.; Caballero, P.A.; Blanco, C.A.; Rosell, C.M. Functionality of different hydrocolloids on the quality and shelf-life of yellow layer cakes. Food Hydrocoll. 2007, 21, 575–581. [Google Scholar] [CrossRef]
- Jenkins, D.J.; Wolever, T.M.; Taylor, R.H.; Barker, H.; Fielden, H.; Baldwin, J.M.; Bowling, A.C.; Newman, H.C.; Jenkins, A.L.; Goff, D.V. Glycemic index of foods: A physiological basis for carbohydrate exchange. Am. J. Clin. Nutr. 1981, 34, 362–366. [Google Scholar] [CrossRef]
- Foster-Powell, K.; Holt, S.H.; Brand-Miller, J.C. International table of glycemic index and glycemic load values: 2002. Am. J. Clin. Nutr. 2002, 76, 5–56. [Google Scholar] [CrossRef]
- Wang, S.; Zhang, X.; Wang, S.; Copeland, L. Changes of multi-scale structure during mimicked DSC heating reveal the nature of starch gelatinization. Sci. Rep. 2016, 6, 28271. [Google Scholar] [CrossRef]
Disclaimer/Publisher’s Note: The statements, opinions and data contained in all publications are solely those of the individual author(s) and contributor(s) and not of MDPI and/or the editor(s). MDPI and/or the editor(s) disclaim responsibility for any injury to people or property resulting from any ideas, methods, instructions or products referred to in the content. |
© 2025 by the author. Licensee MDPI, Basel, Switzerland. This article is an open access article distributed under the terms and conditions of the Creative Commons Attribution (CC BY) license (https://creativecommons.org/licenses/by/4.0/).