Article

Functional Trait Coordination Among Dominant Tree Species in the Amazonia–Cerrado Transition Zone


by
Wendell V. de Carvalho
1,2,*,
Claire Fortunel
3,*,
Cristini da S. M. Fonseca
1,
André F. C. Silva
1,
Grazielle S. Teodoro
1,4,
Thaisa S. Michelan
1,4 and
Ely S. C. Gurgel
1
1
Graduate Program in Biological Sciences—Tropical Botany (PPGBOT), Av. Perimetral 1901, Terra Firme, Belem 66077-830, PA, Brazil
2
Federal University of Western Pará (UFOPA)-Juruti University Campus, Vereador José de Sousa Andrade Av., São Marcos, Juruti 68170-000, PA, Brazil
3
Botanique et Modélisation de l’Architecture des Plantes et des Végétations (AMAP), Université de Montpellier, CIRAD, CNRS, INRAE, IRD, 34000 Montpellier, France
4
Laboratory of Primary Producers Ecology (ECOPRO), Federal University of Pará (UFPA), Belem 66075-110, PA, Brazil
*
Authors to whom correspondence should be addressed.
Ecologies 2026, 7(2), 49; https://doi.org/10.3390/ecologies7020049 (registering DOI)

Submission received: 13 April 2026 / Revised: 22 May 2026 / Accepted: 28 May 2026 / Published: 30 May 2026

Abstract

In transitional tropical ecosystems such as the Amazonia–Cerrado ecotone, dominant tree species experience strong environmental heterogeneity, requiring coordinated functional strategies to cope with drought, nutrient limitation, and disturbance. However, how these species integrate leaf morphoanatomical traits and wood density to persist in such environments remains poorly understood. We assessed the coordination among leaf anatomical and morphological traits and their relationship with wood density in five dominant tree species across three savanna park sites in the Amazonia–Cerrado transition. Morphological traits included leaf thickness, specific leaf area, leaf dry matter content, and wood density, alongside 17 anatomical leaf traits. We analyzed inter- and intraspecific variation and covariation patterns to identify trait-based ecological strategies along the acquisitive–conservative spectrum. We found strong coordination among traits related to protection (e.g., cuticle thickness and trichomes) and resource use, as well as clear alignment between leaf and wood traits. Species identity explained most trait variation, although leaf thickness showed notable intraspecific plasticity. Species with conservative traits exhibited thicker leaves and higher wood density, whereas species with acquisitive strategy showed higher specific leaf area and lower leaf dry matter content. Overall, trait coordination reflects integrated ecological strategies shaped by environmental heterogeneity, highlighting the role of multi-trait syndromes in driving functional adaptation in ecotonal systems.

1. Introduction

The Amazonia–Cerrado transition zones are experiencing increasing tree mortality due to severe drought [1], agricultural expansion, fires, and extreme weather events [2,3], especially in southern Amazonia’s “arc of deforestation” [4]. Abiotic factors such as high radiance, elevated air temperature, low relative humidity, and pronounced rainfall seasonality [5] shape ecological filtering in the transition zone. This region experiences marked climatic heterogeneity, with annual precipitation ranging from approximately 500 mm in the Cerrado to over 2500 mm at the eastern Amazon boundary [6]. These gradients, combined with recurrent droughts, fire disturbances, and increasing dryness, exert strong ecological pressures on plant communities [7].
The abiotic drivers can increase mortality rates, eliminating species lacking the morphofunctional or ecophysiological traits needed to survive these conditions [8,9]. As a result, they select for a spectrum of ecological strategies along the leaf economic spectrum (LES), which ranges from acquisitive, fast-growing species with traits such as high specific leaf area (SLA), low leaf dry matter content (LDMC), and thin leaves that maximize resource acquisition and photosynthetic capacity, to conservative, slow-growing species characterized by greater structural investment and enhanced tolerance to environmental stress [10,11,12,13,14].
Leaf anatomical traits are fundamental to plant adaptation in seasonally dry and high-radiation environments like the Amazonia–Cerrado transition. Traits such as increased leaf thickness (LT), well-developed cuticles, dense trichomes and high stomatal density contribute to plant performance under environmental stress through coordinated effects on gas exchange, thermal regulation, and structural protection [15]. Thicker leaves often contain thinner boundary layers, enhancing water storage and structural integrity, while thicker cuticles reduce transpirational water loss [13]. These anatomical adjustments may enhance tolerance to seasonal drought and high-radiation conditions characteristic of the Amazonia–Cerrado transition [16]. However, despite their ecological relevance, empirical data on leaf anatomical trait variation across species and environments in the Amazonia–Cerrado ecotone remain scarce. Investigating the functional strategies of dominant woody species through a trait-based approach helps address key knowledge gaps regarding their ecological vulnerability in this transitional ecosystem [17].
Woody savanna plants typically adopt conservative strategies, frequently exhibiting combinations of structural investment and physiological traits associated with stress tolerance and resource-use strategies [18,19]. While broad trade-offs in leaf structure and morphology are well documented, the fundamental constraints underlying the LES remain unclear. Most functional trait studies have focused on tropical rainforests [20,21,22] or semi-deciduous forests [23,24], leaving a gap in understanding how dominant species in transition zones adjust morphoanatomically to shifting resource availability [25].
Beyond leaves, wood density (WD) offers key insights in the wood economics spectrum (WES), reflecting a fundamental trade-off between rapid resource acquisition and long-term structural investment [24,26,27]. Higher WD is typically associated with greater mechanical strength, increased resistance to embolism, and enhanced survival under drought, particularly in resource-limited environments [26]. Denser wood is generally linked to conservative strategies—greater mechanical strength, lower hydraulic conductivity, and increased resistance to embolism—making it a reliable indicator of ecological resilience [12,28,29]. While WD has been widely studied in relation to whole-plant performance, its coordination with leaf anatomical traits remains poorly understood. This is particularly relevant in transitional environments like the Amazon-Cerrado ecotone, where plants face simultaneous pressures on both hydraulic safety and photosynthetic efficiency [30].
The coordination between leaf and wood traits offers important insights into how plants in transitional ecosystems balance growth, resilience, and resource-use under fluctuating light and water conditions [31]. Key functional traits, such as leaf thickness (LT), wood density (WD), stomatal density (SD), and specific leaf area (SLA), reflect ecological strategies that range from drought resistance to efficient light capture, varying across species in response to environmental pressures [10,32,33]. These trait–trait relationships, as well as their trait contributions to plant performance, are influenced by environmental heterogeneity, as reflected in species differences in trait and production–trait linkages [34]. In ecotonal regions, where resource gradients intensify filtering processes, understanding how traits interact at both species and community levels is essential to revealing the selective pressures that drive functional diversity and species distributions [16] and strengthens our ability to predict plant responses to future environmental change [35].
We employed a trait-based approach to evaluate how leaf anatomical traits, leaf morphology, and wood density are coordinated in five dominant tree species across three Savanna Park formations in the Amazonia–Cerrado transition zone. This framework guided us in addressing the following questions.
(1)
How are leaf anatomical traits coordinated? We hypothesized that within a leaf organ, traits would be coordinated such that water, carbon and structural investment are used in a similar manner, ranging along a gradient from conservative to acquisitive. For example, if a plant had a high specific leaf area—SLA (e.g., high carbon assimilation and rapid resource acquisition), it would also tend to have a high stomatal index—SI (i.e., high-water use), with less structural investment (e.g., thinner abaxial and adaxial cuticle—LTabC and LTadC). The conservative end of the LES is characterized by thick leaves—LT (e.g., reducing transpirational water loss), high leaf dry-matter content—LDMC (e.g., carbon investment) and higher allocation to defenses (e.g., crystals—LCr; trichomes—LTrD; structural investment).
(2)
How are leaf anatomical traits coordinated with leaf morphological traits and wood density? We expected that traits would be coordinated across organs, such that species with conservative leaf traits would also exhibit higher wood density, reflecting greater structural investment. For example, species with lower stomatal pore opening (e.g., lower SPOmax) and reduced water loss at the leaf level would be associated with higher wood density (WD), indicating increased resistance to hydraulic failure and drought tolerance.
(3)
Which morphoanatomical traits exhibit high intraspecific variation and consistent patterns across species—making them reliable indicators of environmental responsiveness—and which traits show high interspecific variation, reflecting broader differences in species’ ecological strategies and functional roles? We hypothesized that variations in these traits would vary interspecifically, and that leaf morphological and anatomical traits would be coordinated in ways consistent with xerophytic strategies, characterized by conservative values such as high leaf dry matter content (LDMC), thicker leaves and mesophyll, lower specific leaf area (SLA), and reduced maximum stomatal pore opening (SPOmax).

2. Materials and Methods

2.1. Botanical Material Collection Area

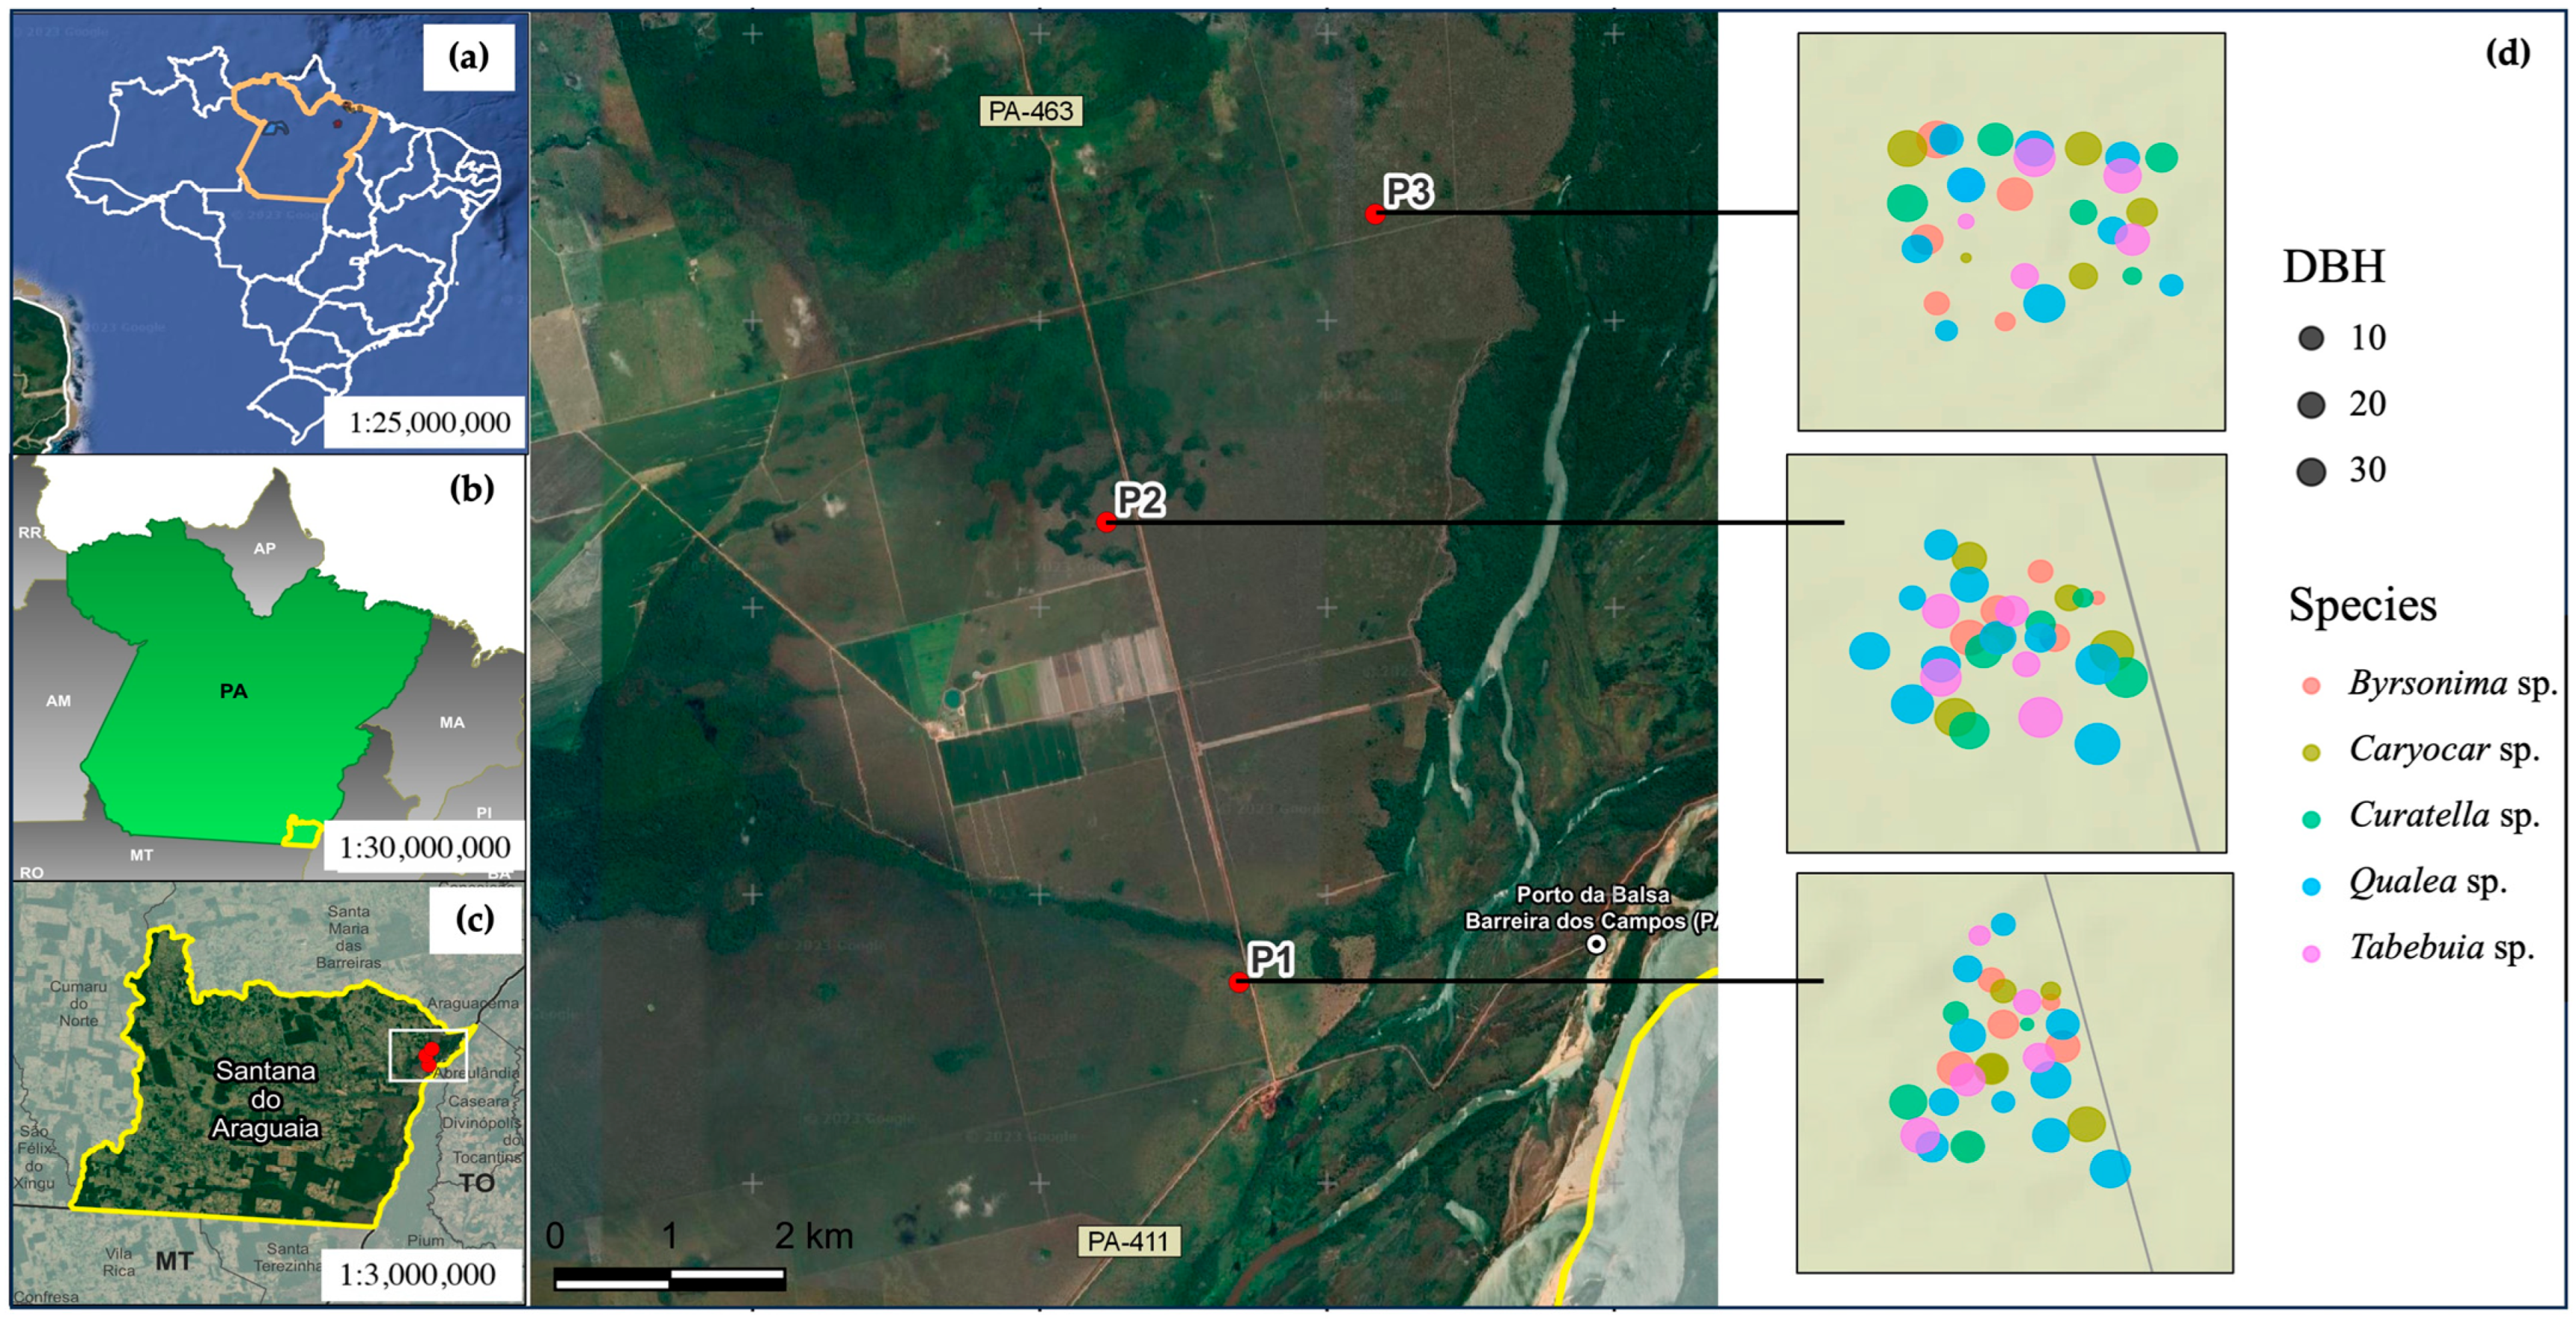
The study was conducted in three fixed plots (1000 m2 each; 50 m × 20 m) established in Savanna Park vegetation within the Araguaia River basin, in the southeastern Amazon biome, at the Barreira do Campo district, municipality of Santana do Araguaia. This region lies within the transition zone between the Amazonia and Cerrado biomes (Figure 1).
The areas feature substrates composed of sandy alluvial deposits [36] with low pH and high levels of exchangeable aluminum [37] with an average elevation of 1100 m [38], consisting of ecotones of Alluvial Semideciduous Seasonal Forest and Savanna (Cerrado) vegetation of the Savanna Park [39], or Cerrado Park [36], located at the boundary between the states of Pará and Tocantins, divided by the Araguaia River. The climate is classified as Aw—Tropical Wet and Dry (Köppen), with average temperatures around 24 °C and a dry period lasting from 5 to 8 months, with annual precipitation below 1600 mm. The area has two well-defined seasons, one characterized by a strong drought from May to September (total rainfall during this period < 150 mm) and a rainy season from October to April, when rainfall is concentrated (1200–1300 mm) [17].

2.2. Data Collection

Tree species were sampled in November 2022 within three fixed sampling plots (P1, P2, and P3), based on the Importance Value Coverage Index (IVC), which estimates the ecological importance of species within the plant community by summing their relative density and dominance [40]. We calculated dominance as the sum of the total basal area of individuals of each species per hectare, relative dominance as the proportion of dominance by the total basal area of all individuals sampled, and basal area as the sum of all transverse areas occupied by trees of the same species in a given space (plot) [41].
Our analyses focused on the five species with the highest IVC values: Byrsonima crassifolia (L.) Kunth—Malpighiaceae, Caryocar brasiliense Cambess.—Caryocaraceae, Curatella americana L.—Dilleniaceae, Qualea parviflora Mart.—Vochysiaceae e Tabebuia aurea (Silva Manso) Benth. Hook.f. ex S.Moore—Bignoniaceae, which together represent more than 50% of the community biomass (Table S1: List of tree species recorded in the three fixed sampling plots in the Amazonia–Cerrado transition zone).
All individuals within the three plots were mapped, and from this dataset, we randomly selected 15 adult individuals per species (DBH > 5 cm), resulting in a total of 75 sampled trees (15 individuals × 5 species). These individuals were distributed across the three plots, maintaining a minimum distance of 100 m between individuals to avoid autocorrelation. For each selected individual, we recorded basal area (BA) (Figure 1; Table S1: List of tree species recorded in the three fixed sampling plots in the Amazonia–Cerrado transition zone).
For each of the 15 individuals per species, we collected the healthiest upper branch and obtained fully expanded, sun-exposed mature leaves, avoiding young or damaged leaves [42]. This resulted in 15 leaf samples per species per plot (one leaf sample per individual). Leaf samples were obtained by climbing or using pole pruners and were stored in sealed plastic bags to prevent water loss [43].
From the same 15 individuals per species, we collected wood material from lateral branches (approximately 5 mm in diameter) located in the upper canopy, resulting in 9 stem samples per species per plot from a subset of the 15 individuals. This sampling approach was selected because it is a widely adopted, non-destructive method in functional trait studies, particularly when working with protected, monitored, or ecologically important woody individuals.
For leaf morphological traits and wood density, each sampled tree provided one observational unit per trait group. For leaf anatomical traits, three leaves per species per plot were collected, and leaves were further subdivided into 10 microscopic sections for anatomical measurements. This trait-specific design was used because anatomical processing is substantially more time- and labor-intensive than morphological and wood measurements.
Taxonomic classification followed APG IV [44], and species names were verified using the Flora e Funga do Brazil [45]. Voucher specimens were deposited in the Herbário João Murça Pires (MG; Museu Paraense Emílio Goeldi, Belém, PA, Brazil).

2.3. Morphological Traits

The measurement followed the protocol outlined in Pérez-Harguindeguy et al. [42] for calculating the following leaf and woody traits: leaf area (LA), specific leaf area (SLA), leaf thickness (LT), leaf dry matter content (LDMC), and wood density (WD) (Table S2: List of the measured traits in dominant tree species in the Amazonia–Cerrado transition zones, as well as their assignment to leaf or wood group).
Leaves and stems selected were stored in plastic bags with water to prevent dehydration. Leaf area (LA) (mm2) was measured by scanning the adaxial surface of 45 leaves (n = 15 individuals) using a ruler and an Epson Styllus TX210 (model C351E; Seiko Epson Corporation, Suwa, Japan) scanner at a resolution of 450 dpi. The scanned images were analyzed using ImageJ software (1.54g version) [46]. Specific leaf area (SLA) was calculated as the ratio of leaf area to leaf dry mass (mm2 mg−1). Leaves were dried at 70 °C for 48 h and weighed using a digital balance with 0.001 g precision [42].
Leaf thickness (LT) (mm) was measured at three points on the leaf blade (base, middle, and apex), avoiding major veins, using a digital micrometer (precision 0.01 mm). Leaves were hydrated for 24 h and weighed to obtain fresh mass, then dried at 70 °C for 48 h and weighed again to determine leaf dry matter content (LDMC), calculated as the ratio of leaf dry mass to fresh mass and expressed in mg g−1 [47].
Wood density (WD) (g cm−3) was estimated using Archimedes’ principle [42]. For this purpose, three 5 cm segments, without bark, per individual were submerged in water to determine displaced volume, while dry mass was obtained after oven-drying at 70 °C for 72 h [48]. WD was then calculated as the ratio between dry mass and displaced volume.
Initial processing of samples was carried out in the field, and final analyses were conducted at the Botany laboratories at the Research Campus of Museu Goeldi in Belém.

2.4. Leaf Anatomical Traits

Transverse sections of three leaves per species per plot, including the midrib and a portion of the lamina, were prepared using a rotary microtome (Leica® RM 2245, Leica® Biosystems, Heidelberg, Germany). The material was fixed in FAA 50% (formaldehyde, acetic acid, and 50% ethanol) [49], embedded in paraffin, and stained with Astra blue and Safranin [50] to measure adaxial epidermis thickness (LTadE), abaxial epidermis thickness (LTabE), adaxial cuticle thickness (LTadC) and abaxial cuticle thickness (LTabC), palisade parenchyma thickness (LTpP), spongy parenchyma thickness (LTsP), undifferentiated parenchyma thickness (LTuP), leaf blade-parenchyma ratio (LB:P), and number of crystals (LCr) (Table S2; Figure S1: Diagram illustrating leaf anatomical traits analyzed.).
For paradermal sections, rectangular leaf fragments (1 cm  ×  0.5 cm) were obtained and analyzed using the dissociated epidermis method [51] to determine stomatal density (SD), stomatal index (SI), stomatal size (SS), stomatal functionality (SF), maximum stomatal pore opening (SPOmax), theoretical maximum stomatal conductance (Sgmax), and trichome density (LTrD) (Table S2; Figure S1: Diagram illustrating leaf anatomical traits analyzed). Stomatal traits were measured while avoiding leaf veins. Stomatal traits were measured in interveinal regions of the leaf surface. Measurements were obtained from ten tissue samples per species using a 20× objective for transverse sections and a 40× objective for paradermal sections, with a DMC5400 camera coupled to a Leica DM6 optical microscope.
Stomatal size (SS) was calculated as the product of the polar diameter (PD) and equatorial diameter (ED) of guard cells (SS = PD × ED) and is expressed in µm2. Stomatal functionality (SF) was calculated as the ratio between polar and equatorial diameters (SF = PD/ED) [52]. Stomatal density (SD) was determined as the number of stomata per unit leaf area (mm−2) [53], and the stomatal index (SI, %) was calculated as SI = [S/(E + S)] × 100, where S is the number of stomata and E is the number of epidermal cells per unit area [54].
Maximum stomatal pore opening (SPOmax) was estimated as a proportional function of stomatal size (SPOmax = α × SS, where α = 0.12) expressed in μm2 [53]. Theoretical maximum stomatal conductance (Sgmax) was estimated as a proxy based on stomatal density and size (Sgmax ∝ SD × SS) [55], representing a relative index of potential conductance rather than a direct physical measurement [16]. Stomatal types were classified according to the system proposed by Metcalfe and Chalk [56]. Trichome density (LTrD) was quantified as the number of trichomes per unit area [15,16].
Leaf blade-parenchyma ratio (LB:P) was calculated as LB:P = (LTpP + LTsP)/LTL, where LTpP is palisade parenchyma thickness, LTsP is spongy parenchyma thickness, and LTL refers to leaf lamina thickness (μm). This ratio is dimensionless and represents the proportion of the leaf blade occupied by parenchyma tissue [57].
Photomicrographs were obtained using a DMC5400 camera attached to a Leica DM6 optical microscope (Leica Microsystems, Wetzlar, Germany). All measurements were conducted at the Microscopy Laboratory of the Museu Goeldi Research Campus, utilizing Leica Application Suite (LAS; Leica Microsystems, Wetzlar, Germany) [46]. Means and standard deviations were calculated for all variables.

2.5. Data Analysis

To examine trait-by-trait correlations among all 22 traits, we performed pairwise Pearson correlation tests. To assess redundancy between leaf thickness (LT, mm) and lamina thickness (LTL, μm), both functional traits reflecting foliar thickness in different units, we used a generalized linear model (GLM). LTL was converted to millimeters, and both traits were log-transformed to meet normality. A Gamma distribution with a log link function was tested for suitability by evaluating model residuals and homoscedasticity. The GLM was applied separately for each species and for all species combined. The coefficients for LTL varied in magnitude and direction but were consistently nonsignificant, indicating that limb thickness (LTL) does not significantly predict total leaf thickness (LT) across species (Figure S2: GLM testing the effect of leaf thickness (mm) and limb thickness (um) across dominant species in the Amazonia–Cerrado transition zone), as evidenced by minimal reductions in residual deviance (Table S3: Result of the Generalized Linear Mixed Models evaluating the relationship between leaf thickness and limb thickness across species).
To test the relationships both within and among traits defining plant strategies (objective 1 and 2), we performed an ordination based on a principal component analysis (PCA). The PCA was conducted using the rda() function from the vegan package in R v.4.2 [58], with a matrix that included the mean values of leaf anatomical and morphological functional traits for each species.
To evaluate the relative contribution of hierarchical levels (individual, sample, species, and plot) to trait variation (objective 3), we fitted linear mixed-effect models (LMMs) using the lme() function from the nlme package [59]. Because the sampling design differed among trait groups, the hierarchical structure also differed among analyses. For leaf morphological traits, the observational unit was the individual tree, with 15 trees sampled per species across the three plots; therefore, these models included individual trees nested within species, nested within plot. For wood density, the observational unit was the stem sample, with 9 stems sampled per species per plot from the selected trees; therefore, these models included the stem sample nested within species, nested within plot. For leaf anatomical traits, the observational unit was the leaf sample, with 3 leaves sampled per species per plot, and 10 tissue sections/subsamples analyzed in total for each leaf-sample set; therefore, these models included tissue section nested within leaf sample, nested within species, nested within plot. In each case, random effects were specified to match the corresponding sampling hierarchy, allowing us to partition variance among the relevant levels. Variance partitioning analyses were further performed using the ape package [60].
All statistical analyses were conducted in R v.4.2 [61]. The R packages, including ggplot2 [62] for data visualization and dplyr [63] for data manipulation, were employed.

3. Results

3.1. Leaf Morphoanatomical Characteristics Across Dominant Species

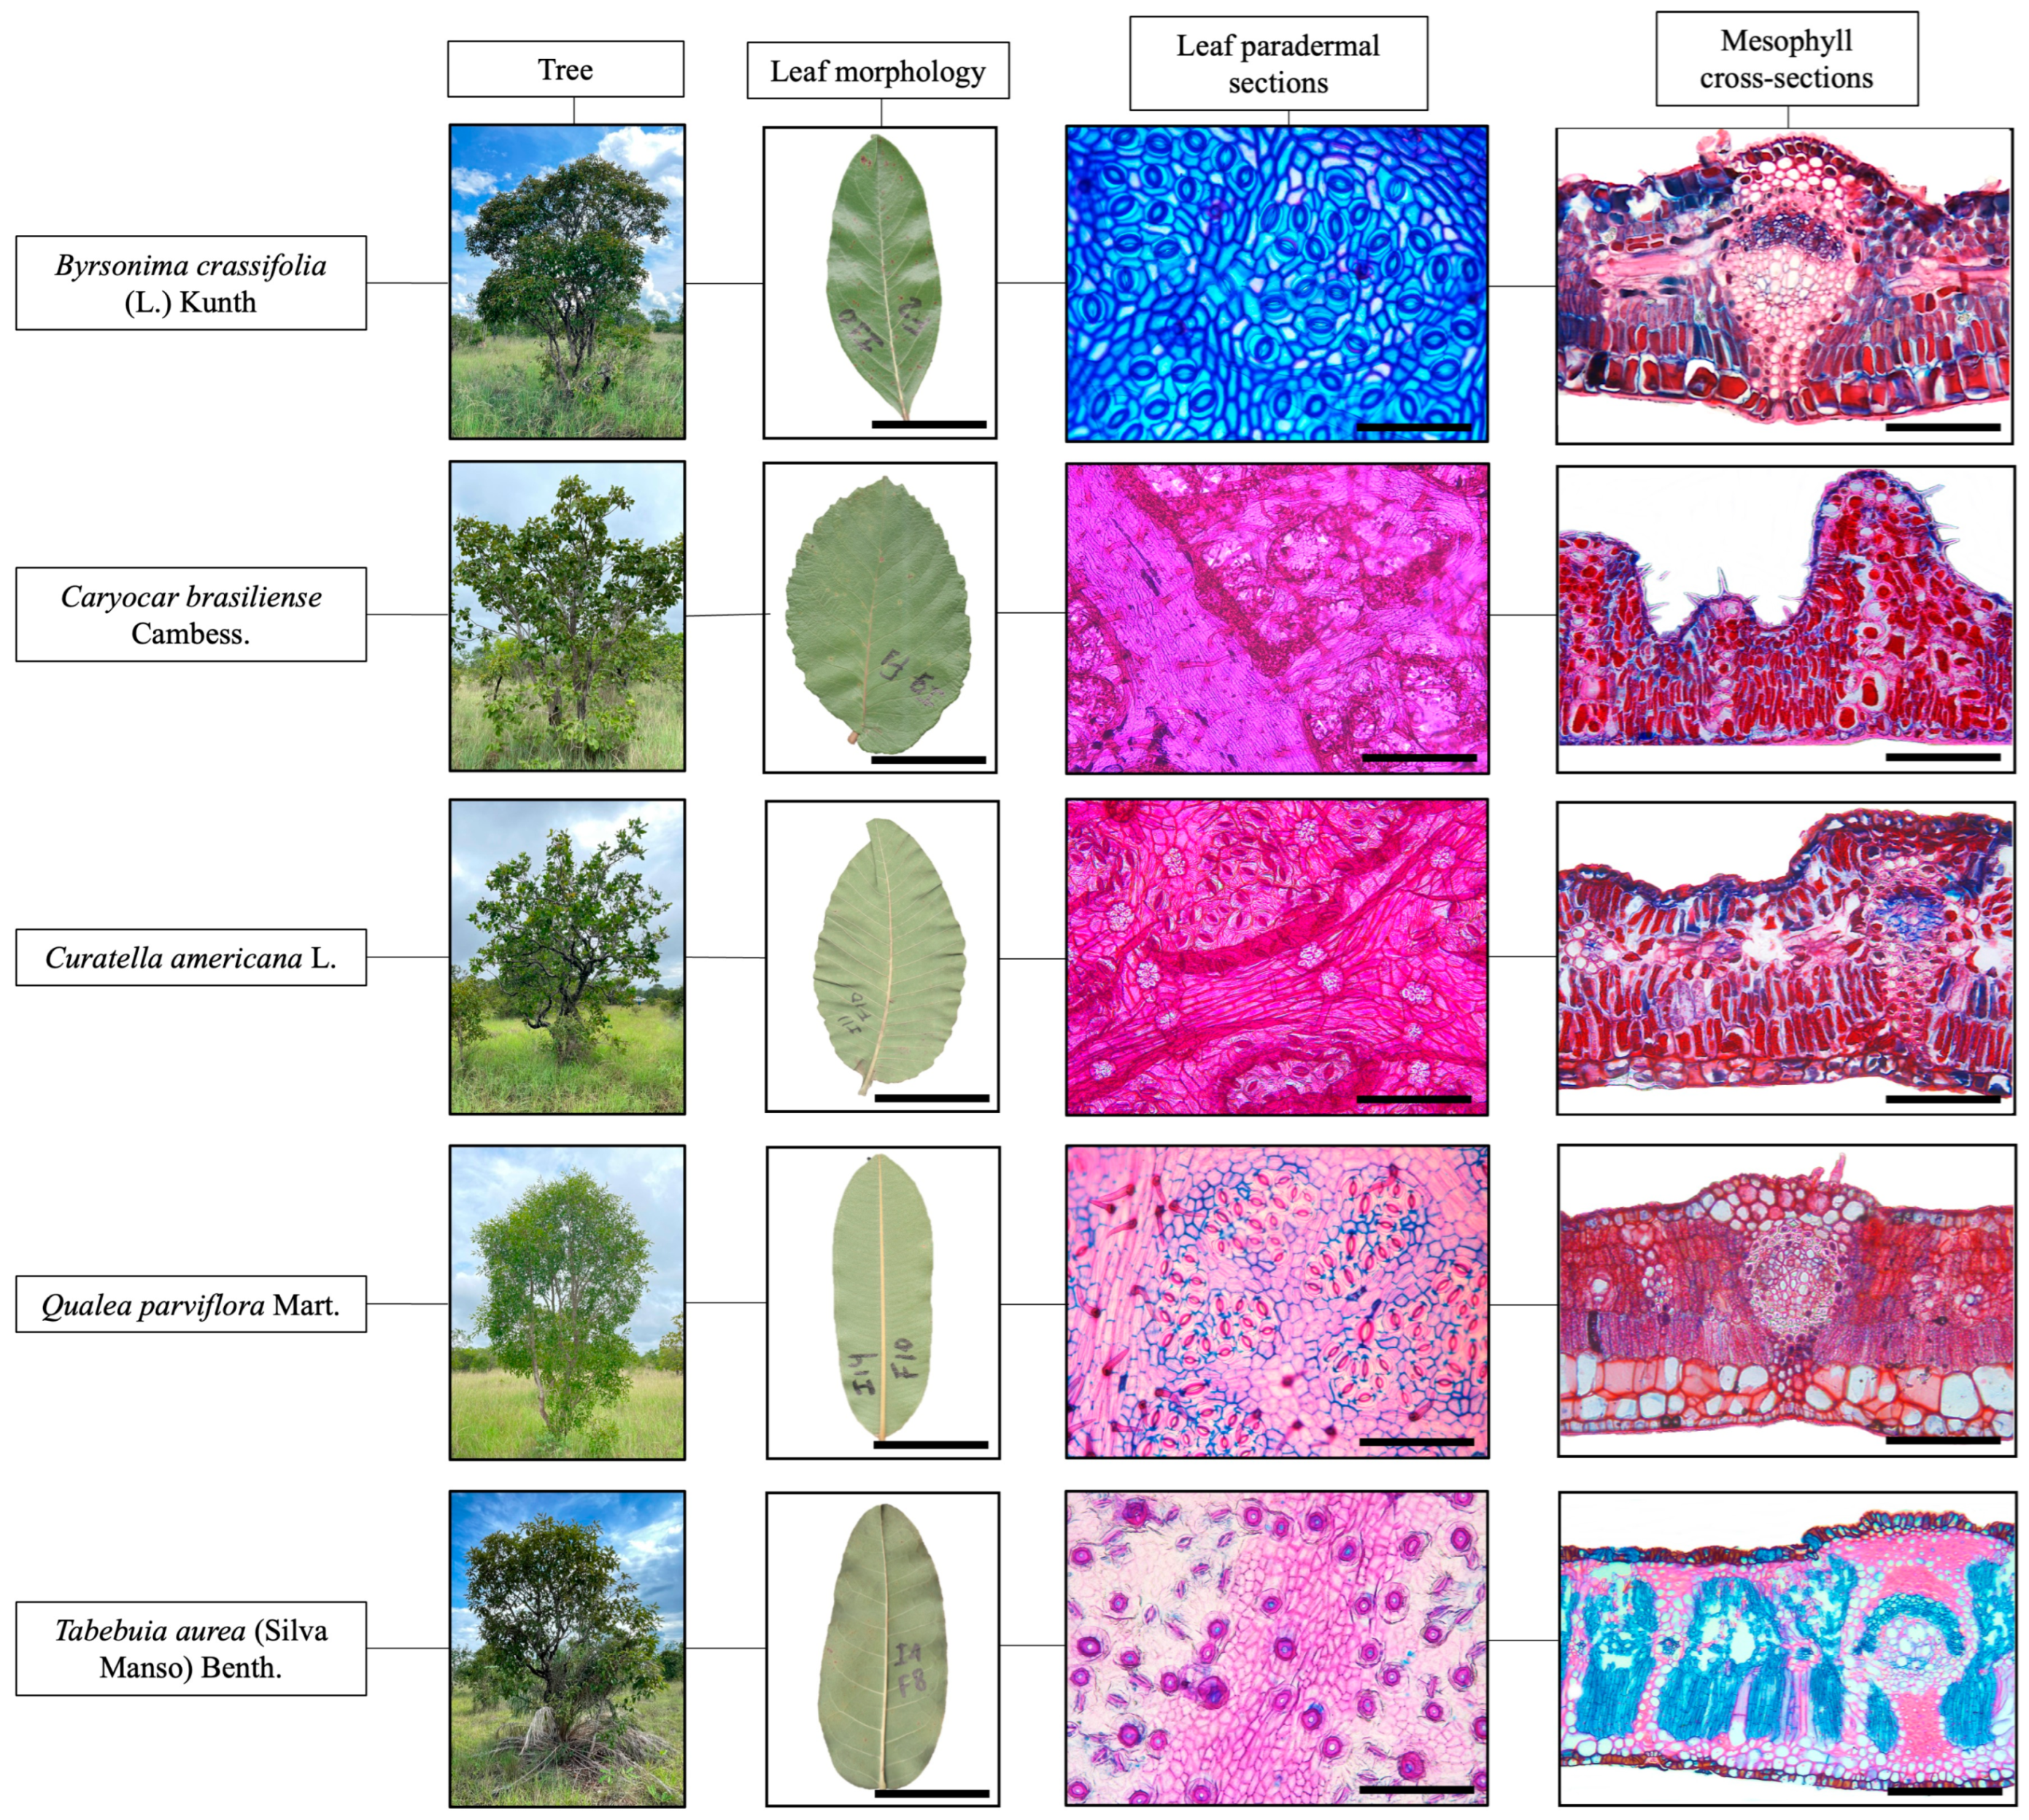
In cross-section, the epidermal cells were uniseriate, papillose, and likely secretory, except in Tabebuia, where this characteristic is absent. In Curatella, the epidermis ranges from unistratified to bistratified. All species exhibited a cuticle covering on both leaf surfaces. In the frontal view, the shape of epidermal cells on the adaxial surface ranges from rectangular to rounded, while on the abaxial surface, it varies from rectangular to undefined across species (Figure 2).
Leaves were hypostomatic, predominantly exhibiting paracytic stomata across the studied species. However, Tabebuia stands out by possessing anomocytic stomata. Trichomes occurred in all species, and it was observed that glandular trichomes were present only in Tabebuia. Unicellular tector trichomes were identified in Byrsonima and Qualea (only on the abaxial surface), while both unicellular and multicellular trichomes were present in Caryocar, positioned slightly above the other epidermal cells and protecting the stomata. In Curatella, stellate tector trichomes occur on both surfaces, whereas Tabebuia features peltate trichomes on both surfaces, with a multicellular secretory portion (Figure 2).
The mesophyll was isobilateral (symmetrical) in Byrsonima and Curatella. Conversely, Qualea and Tabebuia exhibited dorsiventral (asymmetrical) mesophyll. Only Caryocar has undifferentiated (homogeneous) mesophyll. All species, except Tabebuia, contain idioblastic cells with phenolic compounds. Idioblastic cells with crystals were less abundant in Curatella and absent in Caryocar. Secondary veins in the mesophyll formed collateral vascular bundles in Byrsonima, Caryocar, and Tabebuia, while Curatella and Qualea exhibited amphivasal vascular bundles. All species possess sclerenchyma sheath extensions around the vascular bundles, which extend to the epidermis (Figure 2). These anatomical patterns reflect contrasting ecological strategies: species investing in thicker epidermis, cuticle, and crystals are likely prioritizing structural defense and drought tolerance, while species with thinner tissues may emphasize resource capture and faster growth.

3.2. Pairwise Relationships Between Leaf Anatomy, Leaf Morphology and Wood Density

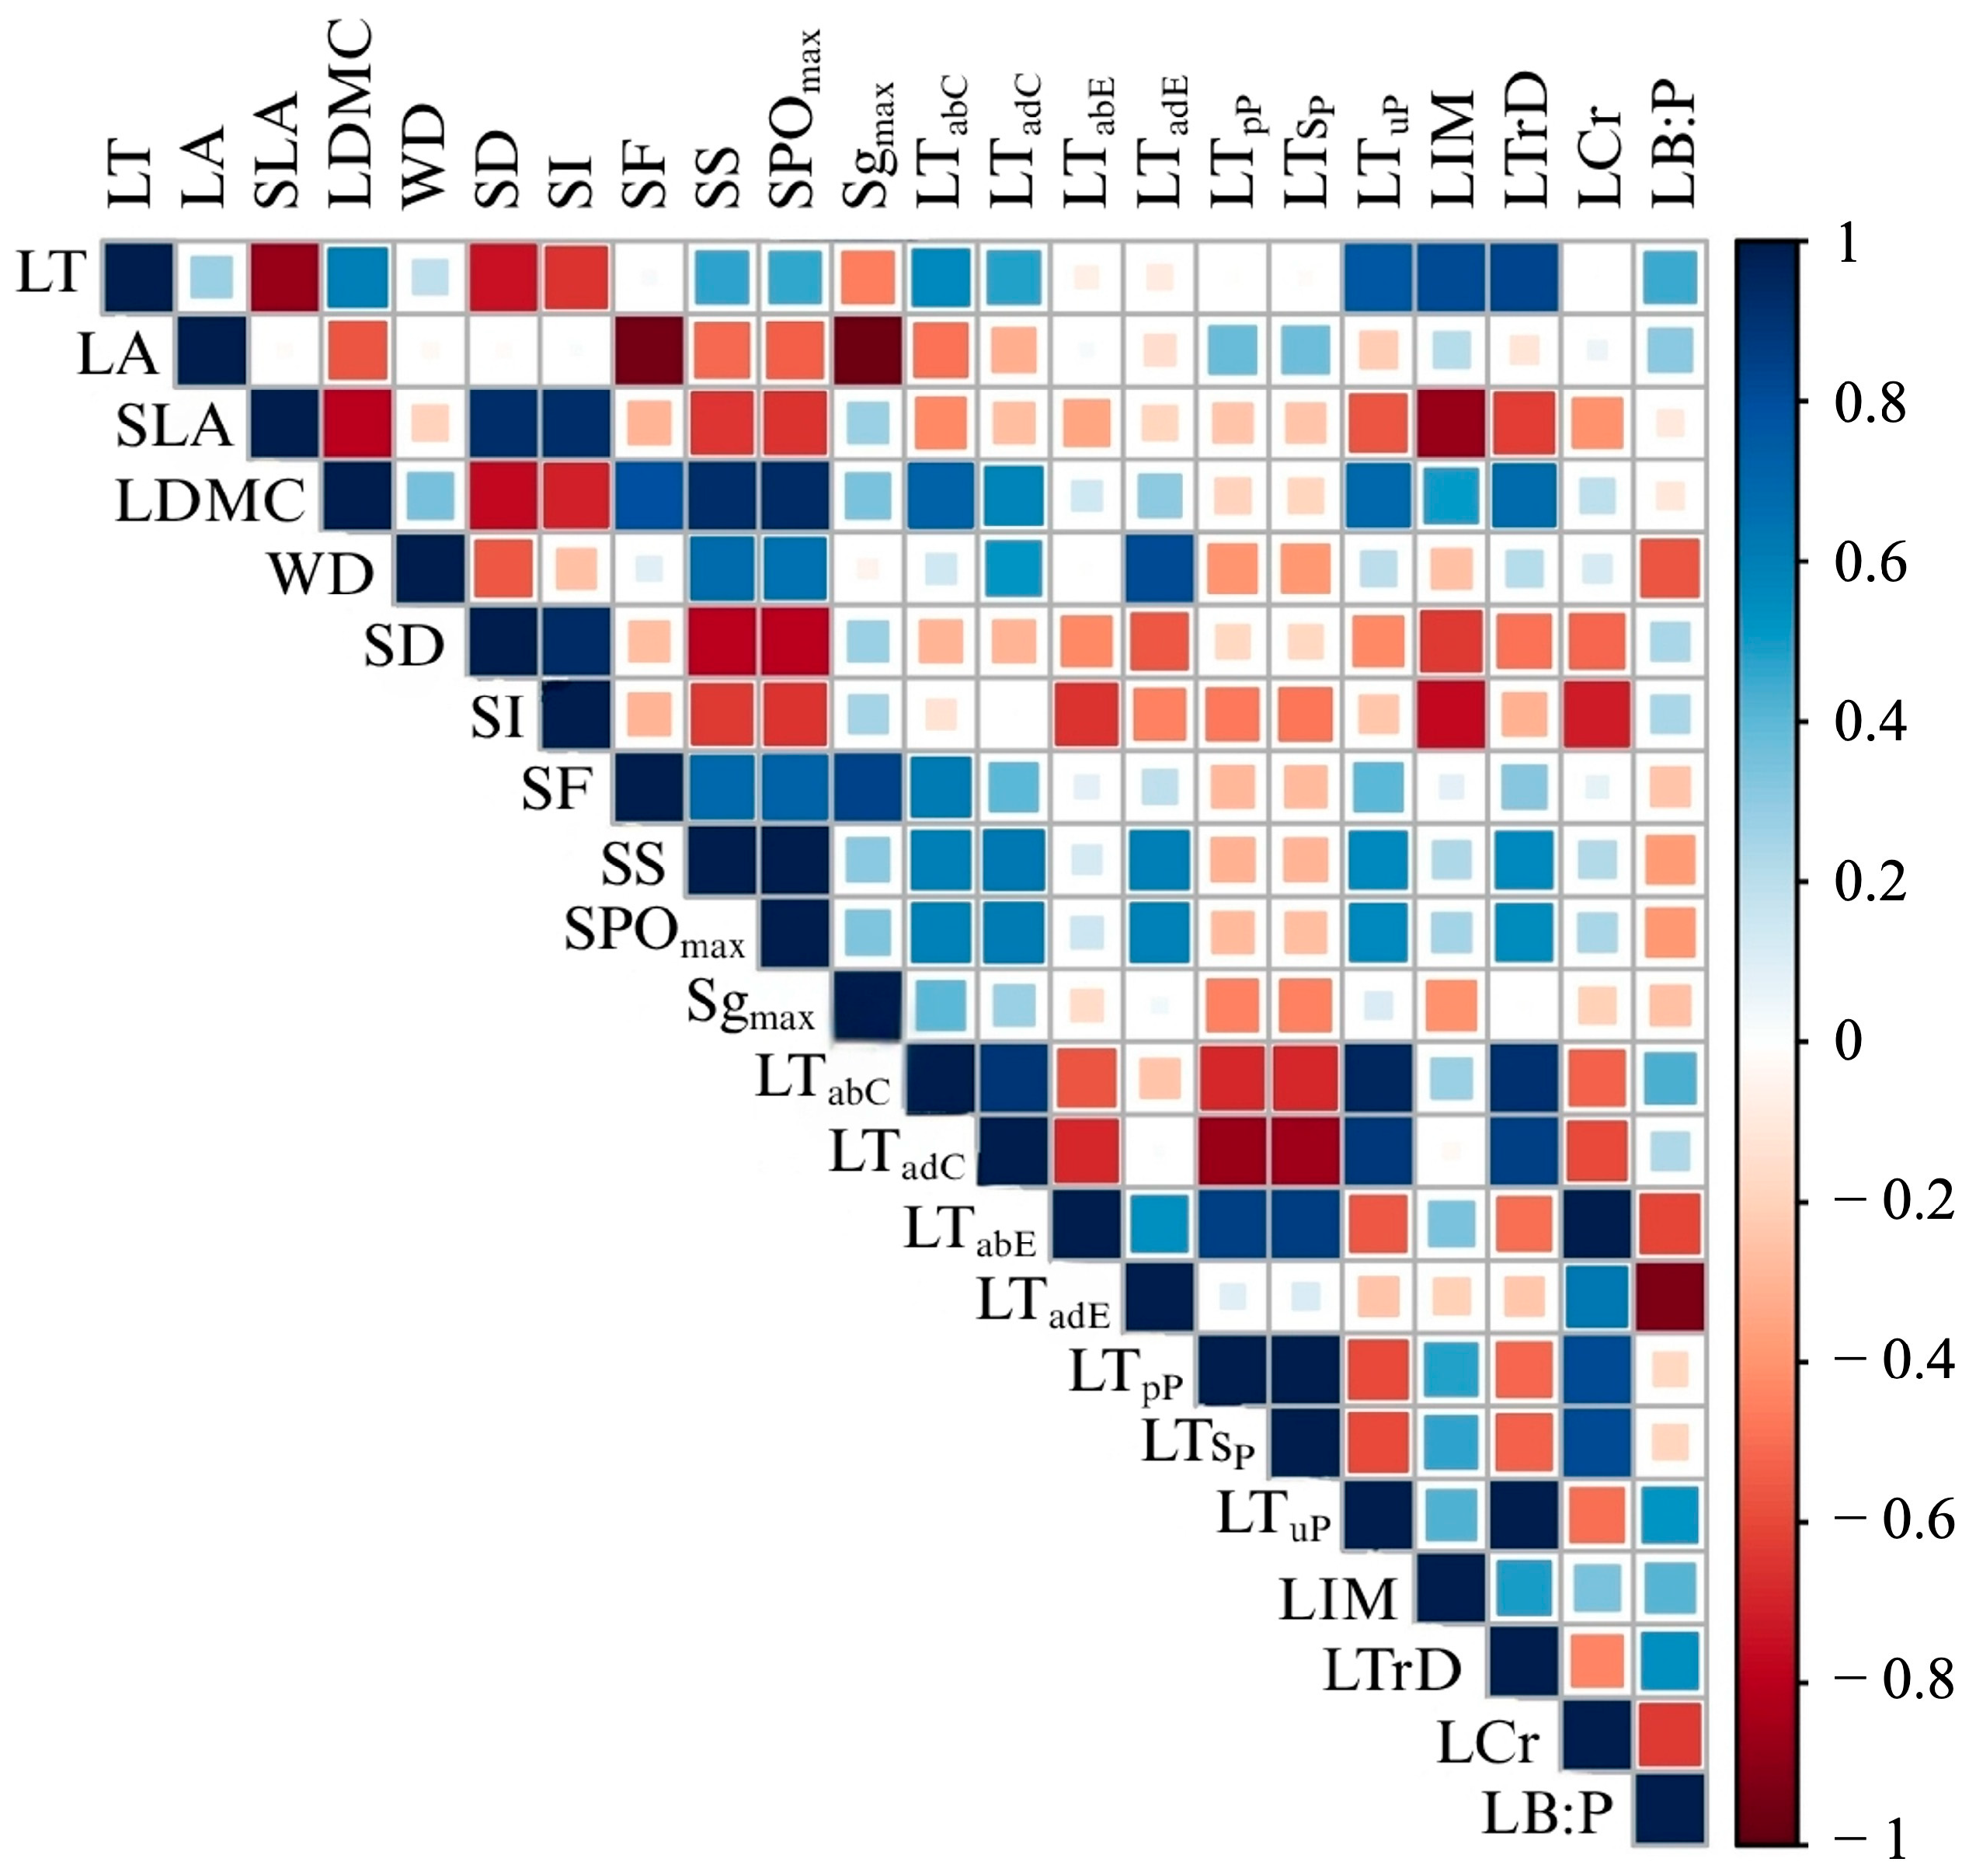
Leaf anatomical traits exhibited strong pairwise correlations. Adaxial epidermis thickness (LTadE) is positively correlated with the leaf blade-parenchyma ratio (LB:P). Similarly, abaxial epidermis thickness (LTabE) was associated with crystal presence (LCr). Abaxial cuticle thickness (LTabC) was correlated with both trichome density (LTrD) and adaxial cuticle thickness (LTadC), as expected for the coordination of anatomical traits. Within the mesophyll, we found coordinated anatomical investment, with strong correlation between palisade parenchyma thickness (LTpP) and spongy parenchyma thickness (LTsP), and between LTabC and undifferentiated parenchyma thickness (LTuP) (Figure 3).
We found strong pairwise relationships between leaf anatomy and leaf morphology. The one exception found between leaf anatomy and leaf morphology was the negative relationship between leaf area (LA) and theoretical maximum stomatal conductance (Sgmax). Leaf dry-matter content (LDMC) was associated with maximum stomatal pore opening (SPOmax), stomatal functionality (SF) with LA, while stomatal size (SS) correlated with both SPOmax and LDMC (Figure 3). Stomatal index (SI) was correlated with both specific leaf area (SLA) and stomatal density (SD), while SD was associated with SLA. As expected, specific leaf area (SLA), leaf thickness (LT) and limb thickness (LTL) were negatively related. Stem traits (WD) were not correlated with any other morphoanatomical leaf trait as hypothesized (Figure 3). This coordination suggests that species combine traits to optimize both mechanical protection and physiological efficiency, illustrating how leaf structure and function jointly respond to environmental pressures in the ecotone.

3.3. Principal Component Analysis of Morphofunctional Traits

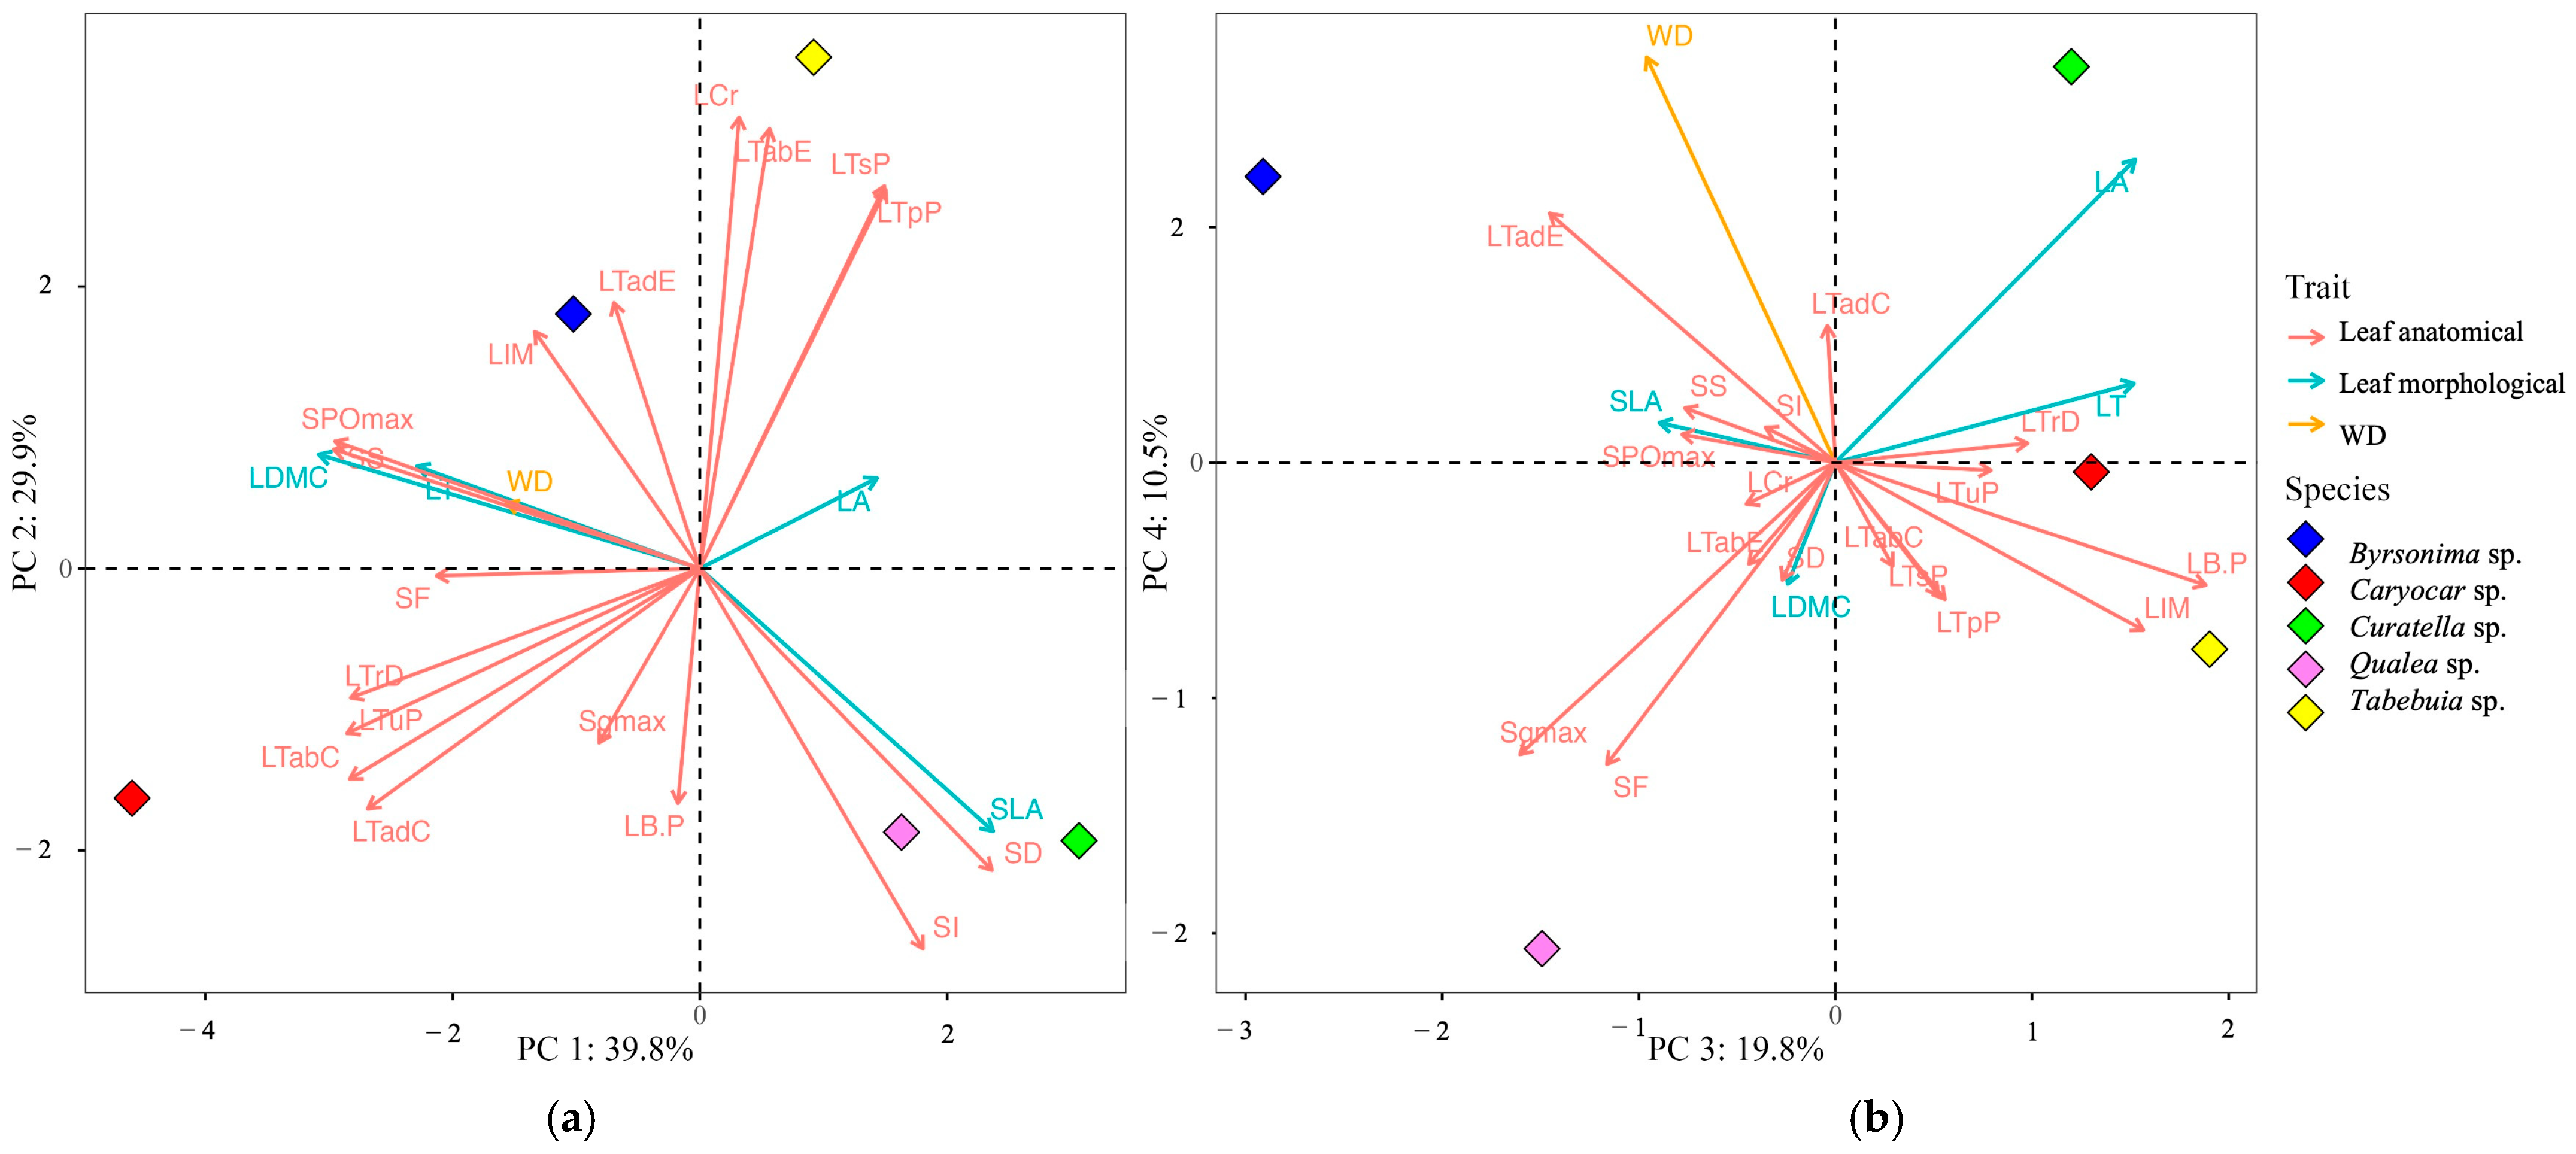
The PCA revealed that the first two axes collectively explained 69.7% of the total variation in the dataset and generally represented traits that had high interspecific variation, effectively distinguishing species based on their leaf morphological and anatomical traits, as well as wood density, into their positioning along the acquisitive–conservative spectrum (Figure 4).
PC1 accounted for 39.8% of the total variation, primarily separating species with traits indicative of an acquisitive strategy, such as specific leaf area (SLA), stomatal density (SD) and stomatal index (SI), which were strongly associated with Curatella and Qualea. These traits reflect adaptations for rapid resource acquisition and efficient gas exchange. On the other hand, Caryocar was associated with traits linked to a conservative strategy—such as trichome density (LTrD), undifferentiated parenchyma thickness (LTuP), and thicker abaxial and adaxial cuticles (LTabC and LTadC), aligning with its position in the negative region of PC1 (Figure 4; Table S6).
PC2 accounted for 29.9% of the total variation, contrasting species based on wood density (WD) and other traits associated with structural and defensive investment. Byrsonima, positioned in the positive region of PC2, was characterized by associations with WD, leaf dry matter content (LDMC), maximum stomatal pore opening (SPOmax), and stomatal size (SS), reflecting a strategy prioritizing resource conservation and mechanical reinforcement. Additionally, Tabebuia aligns with traits such as crystal presence (LCr) and abaxial epidermis thickness (LTabE), further emphasizing its defensive investments, while parenchyma tissue proportions (palisade parenchyma thickness—LTpP and spongy parenchyma thickness LTsP) also contribute to variation along this axis, highlighting additional structural adaptations.
PC3 and PC4 together explained 30.3% of the total trait variation. PCA3 was strongly associated with leaf blade-parenchyma ratio (LB:P), limb thickness (LTL), leaf area (LA) and leaf thickness (LT), while PC4 was negatively associated with theoretical maximum stomatal conductance (Sgmax), stomatal functionality (SF) and strongly associated with wood density (WD) (Figure 4; Table S6: Contribution of each variable (loading) to the formation of the axes, eigenvalues, proportions explained and cumulative proportions found in the PCA for morphological and anatomical leaf traits of each dominant species in the Amazonia–Cerrado transition zones. The highest values in each axis are highlighted in bold.).

3.4. Variance Partitioning for Leaf Anatomy, Morphology and Wood Density

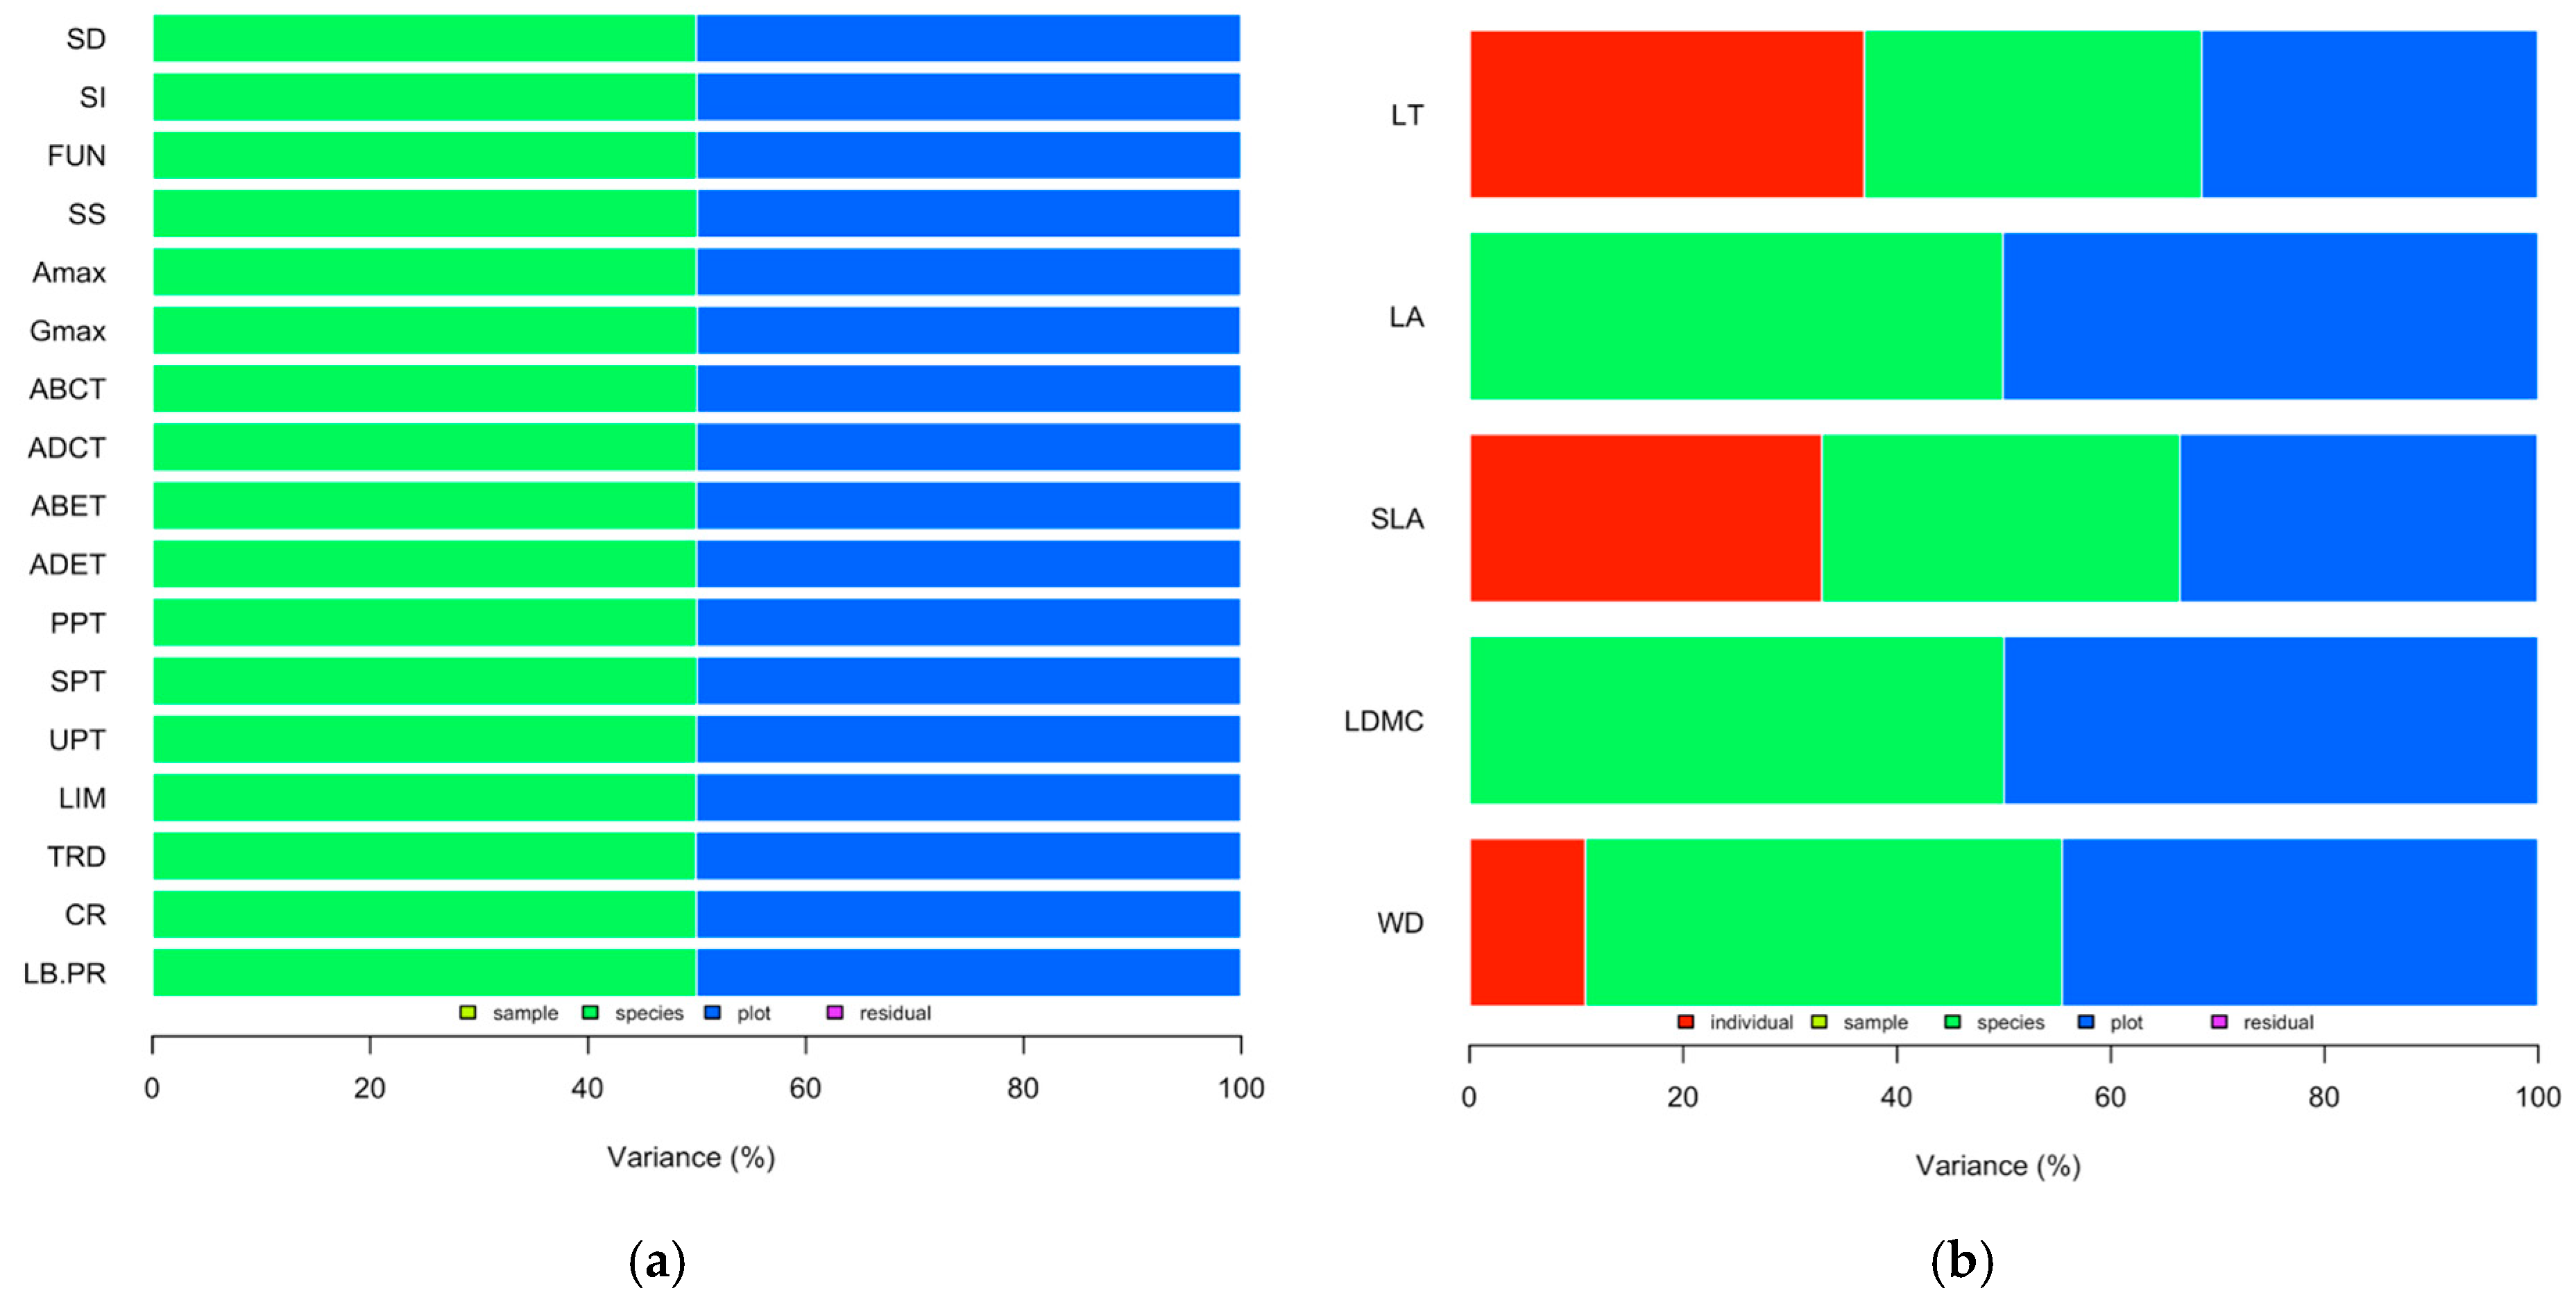
Across the studied traits, species identity explained approximately 50% of the total variance in all leaf anatomical traits (Figure 5a), and in some morphological traits, including LA, LDMC and WD (Figure 5b). For other morphological traits, including LT and SLA, species-level contributions ranged from 10–35% (Figure 5b). Plot-level effects explained 50% of the variance in leaf anatomical traits (Figure 5a) and 30–50% in leaf morphological traits and wood density (Figure 5b). Individual-level effects contributed 10–40% of the variance in LT, SLA, and WD (Figure 5b). Residual variance was very small relative to the modeled hierarchical levels, reflecting the trait-specific sampling structure (Figure 5). We emphasize that the hierarchical structure was not identical across trait groups, because the sampling effort and the level of measurement differed between morphological, wood, and anatomical traits.
The dominant contribution of species identity to trait variation points to evolutionary constraints shaping ecological strategies, while the substantial plot-level variation underscores the importance of local environmental heterogeneity in modulating trait expression. Together, these findings highlight that dominant trees in the Amazonia–Cerrado transition zone employ integrated morphological and anatomical strategies, balancing rapid resource capture with drought resistance, which likely contribute to their success and persistence in this heterogeneous ecosystem.

4. Discussion

Our findings reveal that dominant tree species in the Amazonia–Cerrado transition zone exhibit coordinated patterns among leaf anatomical and morphological traits, whereas the relationship with wood density was less consistent across species. These results suggest that trait integration reflects multiple dimensions of plant ecological strategies rather than a uniformly coordinated response across all functional traits. Specifically, traits associated with water retention and mechanical protection, such as thicker cuticles and higher LDMC, were aligned with higher wood density in conservative species, whereas acquisitive species combined thinner leaves and higher SLA, enhancing resource acquisition under favorable conditions. These patterns support our first two hypotheses (H1 and H2), suggesting that dominant species balance carbon gain and hydraulic safety through coordinated investment across organs. Moreover, significant intraspecific variation in traits such as leaf thickness and SLA suggests plastic responses to local environmental conditions, supporting our third hypothesis (H3) and highlighting the combined influence of evolutionary constraints and environmental filtering in shaping functional strategies.

4.1. Coordination of Leaf Anatomical Traits: Balancing Structure, Defense, and Water Use

The observed coordination among leaf anatomical traits suggests that species may invest either in mechanical protection or in physiological efficiency, reflecting different adaptive strategies. Leaves with thicker adaxial epidermis tended to exhibit a higher proportion of parenchyma in the leaf blade, indicating coordinated investment in both protective and photosynthetically active tissues. This pattern suggests that epidermal thickening may be functionally linked to internal tissue development, reflecting integrated structural strategies that support both mechanical stability and carbon assimilation [10].
Leaves with thicker abaxial epidermis also tended to accumulate more crystals, suggesting convergent structural adaptations related to mechanical defense [16,64]. In xeric environments, crystals may enhance protection against herbivory and environmental stress. Similarly, increased cuticle thickness was associated with higher trichome density, suggesting coordinated protective mechanisms commonly observed in xeromorphic species [65].
The positive association between cuticle thickness and undifferentiated parenchyma suggests coordinated investment in both external protective structures and internal tissues related to stress tolerance [66]. This pattern reinforces the structural integration between mesophyll organization and protective tissues under environmentally stressful conditions [67].
Furthermore, the coordination between palisade and spongy parenchyma layers indicates structural integration that supports both photosynthetic efficiency and water regulation [20]. Thicker mesophyll tissues may contribute to both increased photosynthetic capacity and adaptive advantage in seasonally dry environments [66].
The relationship between stomatal density (SD) and specific leaf area (SLA) suggests that stomatal traits may reflect adaptive responses to microenvironmental variation within transitional savanna systems. Understanding how plants allocate epidermal space to stomata is key to uncovering the functional balance between water use and carbon assimilation [68]. Species with higher SLA tend to invest in thinner, less dense tissues that maximize photosynthetic surface area, often accompanied by higher stomatal density to support gas exchange capacity [69,70]. This pattern is consistent with acquisitive ecological strategies, in which rapid carbon assimilation is prioritized over long-term tissue durability. However, SD is known to vary both inter- and intraspecifically and may respond plastically to environmental conditions such as light and water availability [71].
Overall, these findings emphasize that anatomical trait coordination reflects both structural reinforcement and resource use strategies. Supporting the view that xeromorphic plants tend to exhibit thicker protective layers to reduce water loss while maintaining mechanical integrity [72].

4.2. Functional Integration of Leaf and Stem Traits Across Plant Ecological Strategies

Here, we demonstrate a coordinated variation among leaf anatomical and morphological traits that reflects fundamental trade-offs between carbon gain and water conservation. Covariation patterns among functional traits have been extensively studied across species and ecosystems [32,73,74,75,76]. Larger leaf area (LA) was negatively associated with theoretical maximum stomatal conductance (Sgmax), suggesting that species with broader leaves may adopt more conservative stomatal strategies, potentially limiting gas exchange to reduce water loss risk [10,12]. This pattern is consistent with theoretical expectations that greater allocation of epidermal area to stomata may enhance gas exchange capacity but also incur structural and energetic costs, proposed by de Boer et al. [55].
The association between larger leaves and higher stomatal functionality (SF) suggests that some species may optimize resource acquisition under favorable conditions while retaining the capacity to regulate water loss under stress [77]. This coordination reflects adaptive strategies in which stomatal regulation complements leaf structural traits to balance photosynthetic efficiency and water conservation.
Similarly, the coordination among stomatal size (SS), maximum stomatal pore opening (SPOmax), and leaf dry-matter content (LDMC) reflects a functional spectrum in which species balance gas exchange efficiency and structural investment. Conservative species tended to exhibit higher LDMC and smaller stomata, whereas acquisitive species showed lower LDMC associated with larger stomata and wider pore openings, supporting contrasting patterns of resource use [34,78,79], enhancing carbon assimilation [12]. These leaf trait patterns align with physiological responses reported in Neotropical savanna species, where stomatal regulation acts as an important mechanism controlling photosynthetic performance under fluctuating environmental conditions [80,81,82]. Altogether, these findings support the existence of a coordinated trait continuum associated with differences in carbon acquisition and ecological performance across species.
This functional coordination extends to the internal mesophyll architecture: SLA was negatively associated with leaf thickness (LT) and limb thickness (LTL), reinforcing the well-established trade-off between acquisitive leaf design—thin, high-SLA tissues for rapid resource capture—and conservative design—thicker leaves with enhanced resistance to desiccation and physical stress [10,83]. These relationships are consistent with the LES framework, which describes coordinated variation in leaf traits along a continuum of resource-use strategies [12,26,84].
At the species level, acquisitive species such as Curatella and Qualea exhibited high SLA and stomatal density combined with lower wood density, favoring rapid resource acquisition under favorable conditions but potentially increasing vulnerability to drought [10,78,85]. In contrast, conservative species such as Byrsonima, Caryocar, and Tabebuia combined higher wood density with traits indicative of structural reinforcement and water conservation, including higher LDMC and greater trichome density (LTrD), as well as investment in internal tissues such as undifferentiated parenchyma thickness (LTuP) and thicker cuticles (LTabC and LTadC) [86,87].
The investment in structural protection also enhances long-term survival in resource-limited environments, supporting the idea that conservative species are more resilient to environmental stresses due to their slower metabolism and greater investment in mechanical tissues [88]. Our results support the concept that plants adapted to savanna-like environments or ecosystems with strong environmental variation need to balance between rapid growth and structural resistance to optimize their long-term survival [32] and the observed alignment between stomatal and mesophyll traits across our study species may reflect optimized allometric relationships, as previously reported for angiosperms [68], where stomatal spacing and size evolve to balance hydraulic efficiency and epidermal cost. These structural investments are consistent with recent findings [89] showing that high-WD genera tend to present lower SLA and nutrient concentrations, aligning with stress-tolerant strategies.
Although some patterns suggest associations between leaf and stem traits, coordination with wood density was not consistently detected across all analyses. This should not be interpreted as evidence that leaf and wood traits are functionally independent, but rather that these traits may respond differently depending on the ecological strategy of each species and the level at which variation is measured. Nevertheless, these patterns reinforce the importance of integrating leaf and stem traits to understand plant ecological strategies [90].
In transitional ecosystems, like the Amazon-Cerrado transition zone, where variation in water availability, nutrient status, and disturbance is high, these morphoanatomical trait combinations may allow species to occupy distinct functional niches under heterogeneous environmental conditions [90,91]. Understanding plant adaptation in these landscapes therefore requires considering multiple dimensions of trait variation, since coordinated trait syndromes can emerge across a wide range of environmental contexts [92].

4.3. Trait Variance Across Taxonomic Scales

Our results underscore that both species identity and plot-level effects contribute substantially to trait variation across leaf anatomy, morphology, and wood density. Traits such as leaf area (LA), LDMC, and wood density (WD) exhibited high interspecific variation, suggesting that they are relatively conserved and reflect core aspects of species-specific ecological strategies. For instance, WD and LA are often associated with resource-use strategies, where species adapted to drier or more resource-limited environments may exhibit traits such as higher WD and reduced LA to optimize water use and structural integrity [87].
In contrast, traits like leaf thickness (LT) and specific leaf area (SLA) exhibited lower species-level contributions and relatively higher variance at the individual and plot levels. However, because we sampled multiple individuals only for morphological traits and wood density—not for anatomical traits—individual-level variance could only be assessed for LT, SLA, and WD. This distinction is important, as it limits our ability to draw conclusions about intraspecific variability in anatomical traits. Still, the variation observed in LT and SLA among individuals suggests a higher degree of phenotypic plasticity, potentially reflecting short-term adjustments to environmental conditions such as light availability, ontogeny or water stress [10,42].
We highlight the strong influence of plot-level effects that explained a substantial portion of the variance across all traits, underscoring the influence of local environmental conditions, such as soil heterogeneity, and biotic interactions, in shaping trait expression. These findings support the role of environmental filtering operating at fine spatial scales, even in ecologically dominant species [93,94]. The presence of such spatially structured trait variation within species also underscores the importance of accounting for environmental diversity in trait-based community ecology studies [95,96].
Although this study focused on a limited number of species and traits, it contributes to a broader understanding of trait coordination across functional axes. While traits associated with the WES and LES have been shown to exhibit phylogenetic conservatism and interspecific coordination [10,26], little is known about how anatomical traits fit into these global patterns. Our data propose that leaf anatomical traits may follow a similar trend of evolutionary constraint, but more extensive sampling across environments and phylogenies is needed to validate this hypothesis.
In general, the covariation of trait variance across organs supports the idea that plant functional traits operate as integrated systems rather than independent attributes. According to Kleyer et al. [97], they co-vary as part of integrated plant strategies that balance longevity, support, water uptake, and carbon gain. Future studies incorporating broader taxonomic and environmental gradients should expand both trait and phylogenetic coverage to assess the extent to which the observed trait syndromes are generalizable across lineages. This approach will help untangle the relative contributions of evolutionary history, environmental drivers and developmental stages in shaping plant functional strategies, particularly in heterogeneous and transitional ecosystems.

5. Conclusions

This study demonstrates the coordinated variation in leaf morphoanatomical traits and wood density in dominant tree species in the Amazonia–Cerrado transition, highlighting the integration of ecological strategies across organs. Leaf anatomical traits reflect key trade-offs between structural reinforcement and water conservation, consistent with the leaf economics spectrum LES. The integration of leaf and wood traits underscores a functional gradient from acquisitive to conservative species. Species identity accounted for a substantial proportion of trait variation, indicating the role of evolutionary constraints, while significant plot-level effects highlight the influence of local environmental conditions, particularly on more plastic traits. Together, these findings improve our understanding of how dominant species in transitional savanna ecosystems adjust to environmental heterogeneity through coordinated trait syndromes, although the strength of coordination differs among organs and trait groups. More broadly, our results also offer a framework for predicting plant responses in tropical ecosystems, highlighting the importance of integrating multiple organs and trait dimensions in ecological studies.

Supplementary Materials

The following supporting information can be downloaded at https://www.mdpi.com/article/10.3390/ecologies7020049/s1. Figure S1. Diagram illustrating leaf anatomical traits analyzed. Figure S2. GLM testing the effect of leaf thickness (mm) and limb thickness (um) across dominant species in the Amazonia–Cerrado transition zone. Table S1. List of tree species recorded in the three fixed sampling plots in the Amazonia–Cerrado transition zone. The table includes the number of individuals (N) with diameter at breast height (DBH ≥ 5 cm), basal area (BA), relative dominance (%), and Importance Value Coverage Index (IVC). The five focal species selected for analysis together represent 52.85% of the total community importance across the sampled plots. Table S2. List of the measured traits in dominant tree species in the Amazonia–Cerrado transition zones, as well as their assignment to leaf or wood group. Table S3. Result of the Generalized Linear Mixed Models evaluating the relationship between leaf thickness and limb thickness across species. Table S4. Average values and standard deviations of morphological traits of each dominant species in the Amazonia–Cerrado transition zone. Leaf area (LA), leaf thickness (LT), specific leaf area (SLA), leaf dry-matter content (LDMC) and wood density (WD). Table S5. Average values and standard deviations of anatomical leaf traits for each dominant species in the Amazonia–Cerrado transition zone. Stomatal density (SD), Stomatal index (SI), Stomatal functionality (SF), Stomatal size (SS), Maximum stomatal pore opening (SPOmax), Theoretical maximum stomatal conductance (Sgmax), Abaxial cuticle thickness (LTabC), Adaxial cuticle thickness (LTadC), Abaxial epidermis thickness (LTabE), Adaxial epidermis thickness (LTadE), Palisade parenchyma thickness (LTpP), Spongy parenchyma thickness (LTsP), Undifferentiated parenchyma thickness (LTuP), Limb thickness (LTL), Trichome density (LTrD), Crystals (LCr) and Leaf blade-parenchyma ratio (LB:P). Table S6. Contribution of each variable (loading) to the formation of the axes, eigenvalues, proportions explained and cumulative proportions found in the PCA for morphological and anatomical leaf traits of each dominant species in the Amazonia–Cerrado transition zones. The highest values in each axis are highlighted in bold.

Author Contributions

Conceptualization, W.V.d.C., G.S.T., T.S.M. and E.S.C.G.; methodology, W.V.d.C., G.S.T. and E.S.C.G.; software, W.V.d.C. and C.F., validation, W.V.d.C., C.F., C.d.S.M.F., A.F.C.S. and E.S.C.G.; formal analysis, W.V.d.C., C.F. and G.S.T.; investigation, W.V.d.C., C.F., C.d.S.M.F., A.F.C.S., G.S.T. and E.S.C.G.; resources, E.S.C.G.; data curation, W.V.d.C., C.F. and G.S.T.; writing—original draft preparation, W.V.d.C., C.F., G.S.T. and E.S.C.G.; writing—review and editing, W.V.d.C., C.F., C.d.S.M.F., A.F.C.S., G.S.T., T.S.M. and E.S.C.G.; visualization, W.V.d.C., C.F. and G.S.T.; supervision, C.F., G.S.T., T.S.M. and E.S.C.G.; project administration, E.S.C.G.; funding acquisition, E.S.C.G. All authors have read and agreed to the published version of the manuscript.

Funding

This research received no external funding.

Institutional Review Board Statement

Not applicable.

Informed Consent Statement

Not applicable.

Data Availability Statement

All the data generated or analyzed during this study are included in this published article. The data that underlie this study are available upon request.

Acknowledgments

This research is part of the first author’s thesis and was supported by the ‘Coordenação de Aperfeiçoamento de Pessoal de Nível Superior (CAPES)’ [Finance code 001] and the Postgraduate Development Program-Legal Amazon (PDPG-AL), within the scope of the proposal: “Integrated studies of plant biodiversity for conservation and management of the Amazon” (CAPES/Process 88881.510208/2020-01, Grant 804/2020). We thank all collaborators who assisted with data collection in the transition zones, especially Dario Amaral and Carlos Alberto “Beleza”. We also acknowledge the financial and logistical support provided for field activities by PDPG-AL and the Museu Goeldi. In addition, this study benefited from the FEFACCION project (Fonds Equipe France—As mudanças climáticas: agindo juntos na Amazônia), which supported the mobility associated with this work through IRD, under the framework of the French Embassy in Brazil and CIRAD. During the preparation of this manuscript, W.V.d.C. used artificial intelligence-based tools, including ChatGPT (OpenAI, GPT-5.5 version) and Perplexity for structural suggestions and language improvement, as English is not his native language. The command provided to these tools was: ‘Correct the English grammar of the following text, ensuring cohesive readability’. The authors have reviewed and edited the output and take full responsibility for the content of this publication.

Conflicts of Interest

The authors declare no conflicts of interest.

References

  1. Marengo, J.A.; Jimenez, J.C.; Espinoza, J.-C.; Cunha, A.P.; Aragão, L.E.O. Increased Climate Pressure on the Agricultural Frontier in the Eastern Amazonia–Cerrado Transition Zone. Sci. Rep. 2022, 12, 457. [Google Scholar] [CrossRef]
  2. Leite-Filho, A.T.; Soares-Filho, B.S.; Davis, J.L.; Abrahão, G.M.; Börner, J. Deforestation Reduces Rainfall and Agricultural Revenues in the Brazilian Amazon. Nat. Commun. 2021, 12, 2591. [Google Scholar] [CrossRef] [PubMed]
  3. Lapola, D.M.; Pinho, P.; Barlow, J.; Aragão, L.E.O.C.; Berenguer, E.; Carmenta, R.; Liddy, H.M.; Seixas, H.; Silva, C.V.J.; Silva-Junior, C.H.L.; et al. The Drivers and Impacts of Amazon Forest Degradation. Science 2023, 379, eabp8622. [Google Scholar] [CrossRef]
  4. Nogueira, D.S.; Marimon, B.S.; Marimon-Junior, B.H.; Oliveira, E.A.; Morandi, P.; Reis, S.M.; Elias, F.; Neves, E.C.; Feldpausch, T.R.; Lloyd, J.; et al. Impacts of Fire on Forest Biomass Dynamics at the Southern Amazon Edge. Environ. Conserv. 2019, 46, 285–292. [Google Scholar] [CrossRef]
  5. Castro, S.A.B.d.; Kuster, V.C. Responses of Neotropical Savannah Plant Species to Abiotic Stresses: A Structural and Functional Overview. In Abiotic Stress in Plants; IntechOpen: London, UK, 2020; ISBN 978-1-83881-062-7. [Google Scholar]
  6. Marengo, J.A.; Souza, C.M.; Thonicke, K.; Burton, C.; Halladay, K.; Betts, R.A.; Alves, L.M.; Soares, W.R. Changes in Climate and Land Use Over the Amazon Region: Current and Future Variability and Trends. Front. Earth Sci. 2018, 6, 228. [Google Scholar] [CrossRef]
  7. Prestes, N.C.C.S.; Marimon, B.S.; Morandi, P.S.; Reis, S.M.; Junior, B.H.M.; Cruz, W.J.A.; Oliveira, E.A.; Mariano, L.H.; Elias, F.; Santos, D.M.; et al. Impact of the Extreme 2015-16 El Niño Climate Event on Forest and Savanna Tree Species of the Amazonia-Cerrado Transition. Flora 2024, 319, 152597. [Google Scholar] [CrossRef]
  8. Corrêa Scalon, M.; Maia Chaves Bicalho Domingos, F.; Jonatar Alves Da Cruz, W.; Marimon Júnior, B.H.; Schwantes Marimon, B.; Oliveras, I. Diversity of Functional Trade-offs Enhances Survival after Fire in Neotropical Savanna Species. J. Veg. Sci. 2020, 31, 139–150. [Google Scholar] [CrossRef]
  9. Tavares, J.V.; Oliveira, R.S.; Mencuccini, M.; Signori-Müller, C.; Pereira, L.; Diniz, F.C.; Gilpin, M.; Marca Zevallos, M.J.; Salas Yupayccana, C.A.; Acosta, M.; et al. Basin-Wide Variation in Tree Hydraulic Safety Margins Predicts the Carbon Balance of Amazon Forests. Nature 2023, 617, 111–117. [Google Scholar] [CrossRef]
  10. Wright, I.J.; Reich, P.B.; Westoby, M.; Ackerly, D.D.; Baruch, Z.; Bongers, F.; Cavender-Bares, J.; Chapin, T.; Cornelissen, J.H.C.; Diemer, M.; et al. The Worldwide Leaf Economics Spectrum. Nature 2004, 428, 821–827. [Google Scholar] [CrossRef]
  11. Méndez-Alonzo, R.; Paz, H.; Zuluaga, R.C.; Rosell, J.A.; Olson, M.E. Coordinated Evolution of Leaf and Stem Economics in Tropical Dry Forest Trees. Ecology 2012, 93, 2397–2406. [Google Scholar] [CrossRef]
  12. Reich, P.B. The World-wide ‘Fast–Slow’ Plant Economics Spectrum: A Traits Manifesto. J. Ecol. 2014, 102, 275–301. [Google Scholar] [CrossRef]
  13. Fauset, S.; Freitas, H.C.; Galbraith, D.R.; Sullivan, M.J.P.; Aidar, M.P.M.; Joly, C.A.; Phillips, O.L.; Vieira, S.A.; Gloor, M.U. Differences in Leaf Thermoregulation and Water Use Strategies between Three Co-occurring Atlantic Forest Tree Species. Plant Cell Environ. 2018, 41, 1618–1631. [Google Scholar] [CrossRef]
  14. Ren, Y.; Li, J.; Zhang, S.; Shao, J.; Li, X.; Zhong, Q.; Hu, D.; Cheng, D. Leaf Trait Networks of Subtropical Woody Plants Weaken along an Elevation Gradient. Plant Sci. 2025, 352, 112340. [Google Scholar] [CrossRef]
  15. Araújo, I.; Marimon, B.S.; Scalon, M.C.; Fauset, S.; Marimon Junior, B.H.; Tiwari, R.; Galbraith, D.R.; Gloor, M.U. Trees at the Amazonia-Cerrado Transition Are Approaching High Temperature Thresholds. Environ. Res. Lett. 2021, 16, 034047. [Google Scholar] [CrossRef]
  16. Simioni, P.F.; Emilio, T.; Giles, A.L.; Viana De Freitas, G.; Silva Oliveira, R.; Setime, L.; Pierre Vitoria, A.; Pireda, S.; Vieira Da Silva, I.; Da Cunha, M. Anatomical Traits Related to Leaf and Branch Hydraulic Functioning on Amazonian Savanna Plants. AoB Plants 2023, 15, plad018. [Google Scholar] [CrossRef] [PubMed]
  17. Cruz, W.J.A.; Machado, M.S.; Navarro-Rosales, F.; Carniello, M.A.; Andrade, M.L.F.; Oliveira, F.C.; Oliveras Menor, I. Deciphering Fire Tolerance of Trees at the Amazonia–Cerrado Transition by Trait-based Approach: Implications from Species to Communities. Am. J. Bot. 2025, 112, e70066. [Google Scholar] [CrossRef]
  18. Bieras, A.C.; Sajo, M.D.G. Leaf Structure of the Cerrado (Brazilian Savanna) Woody Plants. Trees 2009, 23, 451–471. [Google Scholar] [CrossRef]
  19. Rossatto, D.R.; Kolb, R.M.; Franco, A.C. Leaf Anatomy Is Associated with the Type of Growth Form in Neotropical Savanna Plants. Botany 2015, 93, 507–518. [Google Scholar] [CrossRef]
  20. Poorter, L.; Bongers, L.; Bongers, F. Architecture Of 54 Moist-Forest Tree Species: Traits, Trade-Offs, And Functional Groups. Ecology 2006, 87, 1289–1301. [Google Scholar] [CrossRef]
  21. Chazdon, R.L.; Finegan, B.; Capers, R.S.; Salgado-Negret, B.; Casanoves, F.; Boukili, V.; Norden, N. Composition and Dynamics of Functional Groups of Trees During Tropical Forest Succession in Northeastern Costa Rica. Biotropica 2010, 42, 31–40. [Google Scholar] [CrossRef]
  22. Anderegg, L.D.L.; Berner, L.T.; Badgley, G.; Sethi, M.L.; Law, B.E.; HilleRisLambers, J. Within-species Patterns Challenge Our Understanding of the Leaf Economics Spectrum. Ecol. Lett. 2018, 21, 734–744. [Google Scholar] [CrossRef]
  23. Prado-Junior, J.A.; Schiavini, I.; Vale, V.S.; Raymundo, D.; Lopes, S.F.; Poorter, L. Functional Traits Shape Size-Dependent Growth and Mortality Rates of Dry Forest Tree Species. J. Plant Ecol. 2017, 10, 895–906. [Google Scholar] [CrossRef]
  24. Prado-Junior, J.A.; Schiavini, I.; Vale, V.S.; Arantes, C.S.; Van Der Sande, M.T.; Lohbeck, M.; Poorter, L. Conservative Species Drive Biomass Productivity in Tropical Dry Forests. J. Ecol. 2016, 104, 817–827. [Google Scholar] [CrossRef]
  25. Ribeiro-Júnior, N.G.; Marimon, B.H.; Marimon, B.S.; Cruz, W.J.A.; Silva, I.V.; Galbraith, D.R.; Gloor, E.; Phillips, O.L. Anatomical Functional Traits and Hydraulic Vulnerability of Trees in Different Water Conditions in Southern Amazonia. Am. J. Bot. 2023, 110, e16146. [Google Scholar] [CrossRef] [PubMed]
  26. Chave, J.; Coomes, D.; Jansen, S.; Lewis, S.L.; Swenson, N.G.; Zanne, A.E. Towards a Worldwide Wood Economics Spectrum. Ecol. Lett. 2009, 12, 351–366. [Google Scholar] [CrossRef] [PubMed]
  27. Poorter, L.; Castilho, C.V.; Schietti, J.; Oliveira, R.S.; Costa, F.R.C. Can Traits Predict Individual Growth Performance? A Test in a Hyperdiverse Tropical Forest. New Phytol. 2018, 219, 109–121. [Google Scholar] [CrossRef]
  28. Boeger, M.R.T.; Alves, L.C.; Negrelle, R.R.B. Leaf Morphology of 89 Tree Species from a Lowland Tropical Rain Forest (Atlantic Forest) in South Brazil. Braz. Arch. Biol. Technol. 2004, 47, 933–943. [Google Scholar] [CrossRef]
  29. Maracahipes, L.; Carlucci, M.B.; Lenza, E.; Marimon, B.S.; Marimon, B.H.; Guimarães, F.A.G.; Cianciaruso, M.V. How to Live in Contrasting Habitats? Acquisitive and Conservative Strategies Emerge at Inter- and Intraspecific Levels in Savanna and Forest Woody Plants. Perspect. Plant Ecol. Evol. Syst. 2018, 34, 17–25. [Google Scholar] [CrossRef]
  30. Ferragutti, A.C.; Lenza, E.; Mews, H.A.; Maracahipes, L.; Pilon, N.; Pereira, J.C.M.; Campos-Filho, E.M.; Silvério, D.V. Spatio-temporal Variability in Seed Production of Tree Species: Implications for Restoration in the Cerrado–Amazonia Transition Zone. Restor. Ecol. 2025, 33, e14299. [Google Scholar] [CrossRef]
  31. Fajardo, A.; Siefert, A.; Laughlin, D.C. Wood Density and Leaf Size Jointly Predict Woody Plant Growth Rates across (but Not within) Species along a Steep Precipitation Gradient. J. Ecol. 2024, 112, 374–388. [Google Scholar] [CrossRef]
  32. Díaz, S.; Kattge, J.; Cornelissen, J.H.C.; Wright, I.J.; Lavorel, S.; Dray, S.; Reu, B.; Kleyer, M.; Wirth, C.; Colin Prentice, I.; et al. The Global Spectrum of Plant Form and Function. Nature 2016, 529, 167–171. [Google Scholar] [CrossRef]
  33. Augustine, S.P.; McCulloh, K.A. Physiological Trait Coordination and Variability across and within Three Pinus Species. New Phytol. 2024, 244, 451–463. [Google Scholar] [CrossRef] [PubMed]
  34. Polley, H.W.; Collins, H.P.; Fay, P.A. Community Leaf Dry Matter Content Predicts Plant Production in Simple and Diverse Grassland. Ecosphere 2022, 13, e4076. [Google Scholar] [CrossRef]
  35. Hu, X.; He, Y.; Gao, L.; Umer, M.; Guo, Y.; Tan, Q.; Kang, L.; Fang, Z.; Shen, K.; Xia, T. Strategy Trade-Off of Predominant Stress Tolerance Relative to Competition and Reproduction Associated with Plant Functional Traits under Karst Forests. Forests 2023, 14, 1258. [Google Scholar] [CrossRef]
  36. Sano, S.M.; de Almeida, S.P.; Ribeiro, J.F.; Embrapa Cerrados (Eds.) Cerrado: Ecologia e Flora; Embrapa Informação Tecnológica: Brasília, Brazil, 2008; ISBN 978-85-7383-397-3.
  37. Marimon, B.S.; Marimon-Junior, B.H.; Feldpausch, T.R.; Oliveira-Santos, C.; Mews, H.A.; Lopez-Gonzalez, G.; Lloyd, J.; Franczak, D.D.; De Oliveira, E.A.; Maracahipes, L.; et al. Disequilibrium and Hyperdynamic Tree Turnover at the Forest–Cerrado Transition Zone in Southern Amazonia. Plant Ecol. Divers. 2014, 7, 281–292. [Google Scholar] [CrossRef]
  38. Miranda, G.H.B.D.; Faria, D.S.D. Ecological Aspects of Black-Pincelled Marmoset (Callithrix Penicillata) in the Cerradão and Dense Cerrado of the Brazilian Central Plateau. Braz. J. Biol. 2001, 61, 397–404. [Google Scholar] [CrossRef]
  39. Instituto Brasileiro de Geografia e Estatístic (Ed.) Manual Técnico Da Vegetação Brasileira; Manuais técnicos em Geociências; 2ª Edição Revista e Ampliada; Instituto Brasileiro de Geografia e Estatística-IBGE: Rio de Janeiro, Brazil, 2012; ISBN 978-85-240-4272-0.
  40. Do Amaral, D.D.; Rocha, A.E.; Pereira, J.L.G.; Costa Neto, S.V. Identificação Dos Subtipos de Savanas Na Amazônia Oriental (Pará e Amapá, Brasil) Com Uma Chave Dicotômica de Individualização. Bol. Mus. Para. Emílio Goeldi-Ciênc. Nat. 2019, 14, 183–195. [Google Scholar] [CrossRef]
  41. Lahoti, S.; Lahoti, A.; Dhyani, S.; Saito, O. Diversity and Distribution of Forageable Tree Species Across Green Space Types in Fast-Growing City in India: Lessons from Nagpur, India. In Urban Foraging in the Changing World; Dhyani, S., Sardeshpande, M., Eds.; Springer Nature: Singapore, 2024; pp. 123–144. ISBN 978-981-97-0345-6. [Google Scholar]
  42. Pérez-Harguindeguy, N.; Díaz, S.; Garnier, E.; Lavorel, S.; Poorter, H.; Jaureguiberry, P.; Bret-Harte, M.S.; Cornwell, W.K.; Craine, J.M.; Gurvich, D.E.; et al. New Handbook for Standardised Measurement of Plant Functional Traits Worldwide. Aust. J. Bot. 2013, 61, 167–234. [Google Scholar] [CrossRef]
  43. Zhao, N.; Yu, G.; He, N.; Wang, Q.; Guo, D.; Zhang, X.; Wang, R.; Xu, Z.; Jiao, C.; Li, N.; et al. Coordinated Pattern of Multi-element Variability in Leaves and Roots across C Hinese Forest Biomes. Glob. Ecol. Biogeogr. 2016, 25, 359–367. [Google Scholar] [CrossRef]
  44. The Angiosperm Phylogeny Group; Chase, M.W.; Christenhusz, M.J.M.; Fay, M.F.; Byng, J.W.; Judd, W.S.; Soltis, D.E.; Mabberley, D.J.; Sennikov, A.N.; Soltis, P.S.; et al. An Update of the Angiosperm Phylogeny Group Classification for the Orders and Families of Flowering Plants: APG IV. Bot. J. Linn. Soc. 2016, 181, 1–20. [Google Scholar] [CrossRef]
  45. BFG (The Brazil Flora Group). Flora Do Brasil 2020; Jardim Botânico do Rio de Janeiro: Rio de Janeiro, Brazil, 2021. Available online: http://floradobrasil.jbrj.gov.br/ (accessed on 21 July 2024).
  46. Abràmoff, M.D.; Magalhães, P.J.; Ram, S.J. Image Processing with ImageJ. Biophotonics Int. 2004, 11, 36–42. [Google Scholar]
  47. Witkowski, E.T.F.; Lamont, B.B. Leaf Specific Mass Confounds Leaf Density and Thickness. Oecologia 1991, 88, 486–493. [Google Scholar] [CrossRef] [PubMed]
  48. Bittencourt, P.R.L.; Pereira, L.; Oliveira, R.S. On Xylem Hydraulic Efficiencies, Wood Space-use and the Safety–Efficiency Tradeoff. New Phytol. 2016, 211, 1152–1155. [Google Scholar] [CrossRef] [PubMed]
  49. Johansen, D.A. Plant Microtechnique; McGraw-Hill Book Company, Inc.: New York, NY, USA, 1941; Volume 147, p. 222. [Google Scholar] [CrossRef]
  50. Gerlach, D. Botanische Mikrotechnik: Eine Einführung: 45 Abbildungen; Flexibles Taschenbuch Bio; 3., unveränd. Aufl.; Thieme: Stuttgart, Germany, 1984; ISBN 978-3-13-444903-7. [Google Scholar]
  51. Franklin, G.L. Preparation of Thin Sections of Synthetic Resins and Wood-Resin Composites, and a New Macerating Method for Wood. Nature 1945, 155, 51. [Google Scholar] [CrossRef]
  52. Castro, E.M.D. Histologia Vegetal: Estrutura E Função De Órgãos Vegetativos; Editora da UFLA: Lavras, Brazil, 2009; ISBN 978-85-87692-79-5. [Google Scholar]
  53. Franks, P.J.; Beerling, D.J. Maximum Leaf Conductance Driven by CO2 Effects on Stomatal Size and Density over Geologic Time. Proc. Natl. Acad. Sci. USA 2009, 106, 10343–10347. [Google Scholar] [CrossRef]
  54. Pompelli, M.F.; Martins, S.C.V.; Celin, E.F.; Ventrella, M.C.; DaMatta, F.M. What Is the Influence of Ordinary Epidermal Cells and Stomata on the Leaf Plasticity of Coffee Plants Grown under Full-Sun and Shady Conditions? Braz. J. Biol. 2010, 70, 1083–1088. [Google Scholar] [CrossRef]
  55. De Boer, H.J.; Price, C.A.; Wagner-Cremer, F.; Dekker, S.C.; Franks, P.J.; Veneklaas, E.J. Optimal Allocation of Leaf Epidermal Area for Gas Exchange. New Phytol. 2016, 210, 1219–1228. [Google Scholar] [CrossRef]
  56. Metcalfe, C.R.; Chalk, L. Anatomy of the Dicotyledons: Volume I: Systematic Anatomy of Leaf and Stem, with a Brief History of the Subject; Clarendon Press: Wotton-under-Edge, UK, 1979; ISBN 978-0-19-854383-1. [Google Scholar]
  57. Tian, M.; Yu, G.; He, N.; Hou, J. Leaf Morphological and Anatomical Traits from Tropical to Temperate Coniferous Forests: Mechanisms and Influencing Factors. Sci. Rep. 2016, 6, 19703. [Google Scholar] [CrossRef]
  58. Oksanen, J.; Simpson, G.L.; Blanchet, F.G.; Kindt, R.; Legendre, P.; Minchin, P.R.; O’Hara, R.B.; Solymos, P.; Stevens, M.H.H.; Szoecs, E.; et al. Vegan: Package Version 2.7-5. Available online: https://mirror.ibcp.fr/pub/CRAN/web/packages/vegan/vegan.pdf (accessed on 11 August 2024).
  59. Pinheiro, J.; Bates, D. R Core Team Nlme: Linear and Nonlinear Mixed Effects Models 1999, Version 3.1-169. Available online: https://cran.r-universe.dev/nlme/nlme.pdf (accessed on 28 March 2024).
  60. Paradis, E.; Claude, J.; Strimmer, K. APE: Analyses of Phylogenetics and Evolution in R Language. Bioinformatics 2004, 20, 289–290. [Google Scholar] [CrossRef]
  61. R Core Team R: A Language and Environment for Statistical Computing 2022. Available online: https://www.R-project.org (accessed on 12 November 2023).
  62. Wickham, H. Ggplot2; Use R! Springer International Publishing: Cham, Switzerland, 2016; ISBN 978-3-319-24275-0. [Google Scholar]
  63. Wickham, H.; François, R.; Henry, L.; Müller, K.; Vaughan, D. Dplyr: A Grammar of Data Manipulation 2023. Available online: https://user2014.r-project.org/abstracts/talks/45_Wickham.pdf (accessed on 12 September 2024).
  64. Molano-Flores, B. Herbivory and Calcium Concentrations Affect Calcium Oxalate Crystal Formation in Leaves ofSida (Malvaceae). Ann. Bot. 2001, 88, 387–391. [Google Scholar] [CrossRef]
  65. Pinheiro, C.; Chaves, M.M. Photosynthesis and Drought: Can We Make Metabolic Connections from Available Data? J. Exp. Bot. 2011, 62, 869–882. [Google Scholar] [CrossRef]
  66. Körner, C. Paradigm Shift in Plant Growth Control. Curr. Opin. Plant Biol. 2015, 25, 107–114. [Google Scholar] [CrossRef]
  67. Westoby, M.; Falster, D.S.; Moles, A.T.; Vesk, P.A.; Wright, I.J. Plant Ecological Strategies: Some Leading Dimensions of Variation Between Species. Annu. Rev. Ecol. Syst. 2002, 33, 125–159. [Google Scholar] [CrossRef]
  68. Lawson, T.; McElwain, J.C. Evolutionary Trade-offs in Stomatal Spacing. New Phytol. 2016, 210, 1149–1151. [Google Scholar] [CrossRef]
  69. Matthews, J.S.A.; Lawson, T. Climate Change and Stomatal Physiology. In Annual Plant Reviews Online; Roberts, J.A., Ed.; Wiley: Hoboken, NJ, USA, 2019; pp. 713–752. ISBN 978-1-119-31299-4. [Google Scholar]
  70. Carvalho, W.V.D.; Teodoro, G.S.; Silva, K.C.D.; Gastauer, M.; Michelan, T.S.; Gurgel, E.S.C. Intraspecific Variation Explaining Species Resource-Use Strategies in Amazonian Open Vegetation. Acta Bot. Bras. 2024, 38, e20230247. [Google Scholar] [CrossRef]
  71. Moore, C.E.; Meacham-Hensold, K.; Lemonnier, P.; Slattery, R.A.; Benjamin, C.; Bernacchi, C.J.; Lawson, T.; Cavanagh, A.P. The Effect of Increasing Temperature on Crop Photosynthesis: From Enzymes to Ecosystems. J. Exp. Bot. 2021, 72, 2822–2844. [Google Scholar] [CrossRef]
  72. Brito, N.D.D.S.; Medeiros, M.J.D.S.; Souza, E.S.D.; Lima, A.L.A.D. Drought Response Strategies for Deciduous Species in the Semiarid Caatinga Derived from the Interdependence of Anatomical, Phenological and Bio-Hydraulic Attributes. Flora 2022, 288, 152009. [Google Scholar] [CrossRef]
  73. Dwyer, J.M.; Laughlin, D.C. Constraints on Trait Combinations Explain Climatic Drivers of Biodiversity: The Importance of Trait Covariance in Community Assembly. Ecol. Lett. 2017, 20, 872–882. [Google Scholar] [CrossRef]
  74. Rosas, T.; Mencuccini, M.; Barba, J.; Cochard, H.; Saura-Mas, S.; Martínez-Vilalta, J. Adjustments and Coordination of Hydraulic, Leaf and Stem Traits along a Water Availability Gradient. New Phytol. 2019, 223, 632–646. [Google Scholar] [CrossRef]
  75. Fortunel, C.; Stahl, C.; Heuret, P.; Nicolini, E.; Baraloto, C. Disentangling the Effects of Environment and Ontogeny on Tree Functional Dimensions for Congeneric Species in Tropical Forests. New Phytol. 2020, 226, 385–395. [Google Scholar] [CrossRef]
  76. Boisseaux, M.; Nemetschek, D.; Baraloto, C.; Burban, B.; Casado-Garcia, A.; Cazal, J.; Clément, J.; Derroire, G.; Fortunel, C.; Goret, J.; et al. Shifting Trait Coordination along a Soil-moisture-nutrient Gradient in Tropical Forests. Funct. Ecol. 2025, 39, 21–37. [Google Scholar] [CrossRef]
  77. Lambers, H.; Raven, J.A.; Shaver, G.R.; Smith, S.E. Plant Nutrient-Acquisition Strategies Change with Soil Age. Trends Ecol. Evol. 2008, 23, 95–103. [Google Scholar] [CrossRef]
  78. Anderegg, W.R.L.; Klein, T.; Bartlett, M.; Sack, L.; Pellegrini, A.F.A.; Choat, B.; Jansen, S. Meta-Analysis Reveals That Hydraulic Traits Explain Cross-Species Patterns of Drought-Induced Tree Mortality across the Globe. Proc. Natl. Acad. Sci. USA 2016, 113, 5024–5029. [Google Scholar] [CrossRef]
  79. O’Brien, M.J.; Engelbrecht, B.M.J.; Joswig, J.; Pereyra, G.; Schuldt, B.; Jansen, S.; Kattge, J.; Landhäusser, S.M.; Levick, S.R.; Preisler, Y.; et al. A Synthesis of Tree Functional Traits Related to Drought-induced Mortality in Forests across Climatic Zones. J. Appl. Ecol. 2017, 54, 1669–1686. [Google Scholar] [CrossRef]
  80. Grassi, G.; Magnani, F. Stomatal, Mesophyll Conductance and Biochemical Limitations to Photosynthesis as Affected by Drought and Leaf Ontogeny in Ash and Oak Trees. Plant Cell Environ. 2005, 28, 834–849. [Google Scholar] [CrossRef]
  81. Kuster, V.C.; de Castro, S.A.B.; Vale, F.H.A. Environmental Conditions Modulate Plasticity in the Physiological Responses of Three Plant Species of the Neotropical Savannah. Acta Physiol. Plant. 2017, 39, 103. [Google Scholar] [CrossRef]
  82. da Cruz, G.T.T.; Costa, G.B.; Melo, N.M.J.; Puntieri, J.G.; Souza, J.P. Bud Structure, Time of Budbreak and Crown Architecture in Woody Species from Cerrado and Seasonal Forests of Brazil. J. Plant Res. 2025, 138, 587–601. [Google Scholar] [CrossRef]
  83. Poorter, H.; Niinemets, Ü.; Poorter, L.; Wright, I.J.; Villar, R. Causes and Consequences of Variation in Leaf Mass per Area (LMA): A Meta-analysis. New Phytol. 2009, 182, 565–588. [Google Scholar] [CrossRef]
  84. Ribeiro, J.W.F.; Pilon, N.A.L.; Rossatto, D.R.; Durigan, G.; Kolb, R.M. The Distinct Roles of Water Table Depth and Soil Properties in Controlling Alternative Woodland-Grassland States in the Cerrado. Oecologia 2021, 195, 641–653. [Google Scholar] [CrossRef]
  85. Fortunel, C.; Fine, P.V.A.; Baraloto, C. Leaf, Stem and Root Tissue Strategies across 758 N Eotropical Tree Species. Funct. Ecol. 2012, 26, 1153–1161. [Google Scholar] [CrossRef]
  86. Poorter, L.; McDonald, I.; Alarcón, A.; Fichtler, E.; Licona, J.; Peña-Claros, M.; Sterck, F.; Villegas, Z.; Sass-Klaassen, U. The Importance of Wood Traits and Hydraulic Conductance for the Performance and Life History Strategies of 42 Rainforest Tree Species. New Phytol. 2010, 185, 481–492. [Google Scholar] [CrossRef]
  87. Markesteijn, L.; Poorter, L.; Bongers, F.; Paz, H.; Sack, L. Hydraulics and Life History of Tropical Dry Forest Tree Species: Coordination of Species’ Drought and Shade Tolerance. New Phytol. 2011, 191, 480–495. [Google Scholar] [CrossRef]
  88. Fajardo, A.; Piper, F.I.; García-Cervigón, A.I. The Intraspecific Relationship between Wood Density, Vessel Diameter and Other Traits across Environmental Gradients. Funct. Ecol. 2022, 36, 1585–1598. [Google Scholar] [CrossRef]
  89. Sanchez-Martinez, P.; Dexter, K.G.; Draper, F.C.; Baraloto, C.; Leão Do Amaral, I.; De Souza Coelho, L.; De Almeida Matos, F.D.; De Andrade Lima Filho, D.; Salomão, R.P.; Wittmann, F.; et al. Phylogenetic Conservatism in the Relationship between Functional and Demographic Characteristics in Amazon Tree Taxa. Funct. Ecol. 2025, 39, 181–198. [Google Scholar] [CrossRef]
  90. Cruz, W.J.A.D.; Marimon, B.S.; Marimon Junior, B.H.; Amorim, I.; Morandi, P.S.; Phillips, O.L. Functional Diversity and Regeneration Traits of Tree Communities in the Amazon-Cerrado Transition. Flora 2021, 285, 151952. [Google Scholar] [CrossRef]
  91. Rosado, B.H.P.; Dias, A.T.C.; Mattos, E.A.D. Going Back to Basics: Importance of Ecophysiology When Choosing Functional Traits for Studying Communities and Ecosystems. Nat. Conserv. 2013, 11, 15–22. [Google Scholar] [CrossRef]
  92. Gorné, L.D.; Díaz, S.; Minden, V.; Onoda, Y.; Kramer, K.; Muir, C.; Michaletz, S.T.; Lavorel, S.; Sharpe, J.; Jansen, S.; et al. The Acquisitive–Conservative Axis of Leaf Trait Variation Emerges Even in Homogeneous Environments. Ann. Bot. 2022, 129, 709–722. [Google Scholar] [CrossRef]
  93. Cornwell, W.K.; Ackerly, D.D. Community Assembly and Shifts in Plant Trait Distributions across an Environmental Gradient in Coastal California. Ecol. Monogr. 2009, 79, 109–126. [Google Scholar] [CrossRef]
  94. Messier, J.; McGill, B.J.; Lechowicz, M.J. How Do Traits Vary across Ecological Scales? A Case for Trait-based Ecology. Ecol. Lett. 2010, 13, 838–848. [Google Scholar] [CrossRef]
  95. Siefert, A.; Ravenscroft, C.; Althoff, D.; Alvarez-Yépiz, J.C.; Carter, B.E.; Glennon, K.L.; Heberling, J.M.; Jo, I.S.; Pontes, A.; Sauer, A.; et al. Scale Dependence of Vegetation–Environment Relationships: A Meta-analysis of Multivariate Data. J. Veg. Sci. 2012, 23, 942–951. [Google Scholar] [CrossRef]
  96. Anderegg, W.R.L.; Konings, A.G.; Trugman, A.T.; Yu, K.; Bowling, D.R.; Gabbitas, R.; Karp, D.S.; Pacala, S.; Sperry, J.S.; Sulman, B.N.; et al. Hydraulic Diversity of Forests Regulates Ecosystem Resilience during Drought. Nature 2018, 561, 538–541. [Google Scholar] [CrossRef]
  97. Kleyer, M.; Trinogga, J.; Cebrián-Piqueras, M.A.; Trenkamp, A.; Fløjgaard, C.; Ejrnæs, R.; Bouma, T.J.; Minden, V.; Maier, M.; Mantilla-Contreras, J.; et al. Trait Correlation Network Analysis Identifies Biomass Allocation Traits and Stem Specific Length as Hub Traits in Herbaceous Perennial Plants. J. Ecol. 2019, 107, 829–842. [Google Scholar] [CrossRef]
Figure 1. Study area showing the location of the three fixed sampling plots (1000 m2 each; 50 m × 20 m) and the spatial distribution of dominant tree species in savanna park vegetation at the Amazonia–Cerrado transition. (a) Map of Brazil, with white lines indicating the boundaries of Brazilian states and the orange line indicating the state of Pará; (b) map of the state of Pará (PA), with yellow lines indicating the municipality of Santana do Araguaia; (c) map of the municipality of Santana do Araguaia, with yellow lines indicating municipal boundaries and red circles indicating the sampling plots (P1, P2, and P3); (d) spatial distribution of dominant tree species within the plots, where colors represent species identity, and circle size corresponds to diameter at breast height (DBH), and the district seat of Barreira do Campo (Porto da Balsa) is indicated in the map. The plots are located in the Barreira do Campo district, municipality of Santana do Araguaia, at the boundary between the states of Pará (PA), Mato Grosso (MT), and Tocantins (TO). Coordinates: P1 (9°13′59.00″ S, 50°01′41.99″ W), P2 (9°11′48.50″ S, 50°02′18.17″ W), and P3 (9°10′22.65″ S, 50°01′00.77″W).
Ecologies 07 00049 g001
Figure 2. Morphoanatomical leaf characteristics of dominant tree species from savanna park communities at the Amazonia–Cerrado transition. The figure displays (from left to right): species identification, field photograph of the tree, leaf morphology (Bars: 2 cm), paradermal sections of the leaf surface (Bars: 50 μm), and cross-sections of the mesophyll stained and observed under light microscopy (Bars: 100 μm). Black markings on the leaf indicate the individual tree (I) and the sampled leaf (F) used for each morphoanatomical analysis (e.g., I4, F8 = individual 4, leaf 8).
Ecologies 07 00049 g002
Figure 3. Correlation matrix of morphological and anatomical leaf traits of dominant tree species from savanna park communities at the Amazonia–Cerrado transition. The matrix illustrates positive correlations (blue) and negative correlations (red) between traits, with color intensity and size of the squares indicating the strength of the correlation. Trait abbreviations are provided in Table S2.
Ecologies 07 00049 g003
Figure 4. Principal Component Analysis (PCA) of morphological and leaf anatomical traits across dominant tree species in Amazonia–Cerrado transition: (a) PCA axes 1 and 2; (b) PCA axes 3 and 4. Trait vectors—leaf anatomy (orange), leaf morphology (blue-light) and wood density (yellow)—are shown along with species groupings: Byrsonima crassifolia (blue), Caryocar brasiliense (red), Curatella americana (green), Qualea parviflora (pink), and Tabebuia aurea (yellow-light). Trait abbreviations are provided in Table S2.
Ecologies 07 00049 g004
Figure 5. Variance partitioning of functional traits across trait-specific hierarchical levels. Leaf anatomical traits were analyzed at the tissue section/sample (green), species (green-light), plot (blue), and residual (purple) levels. For leaf morphological traits and wood density, the levels were individual tree (red), sample (green), species (green-light), plot (blue), and residual (purple): (a) Leaf anatomical traits; (b) leaf morphological traits and wood density. Trait abbreviations are provided in Table S2.
Ecologies 07 00049 g005
Disclaimer/Publisher’s Note: The statements, opinions and data contained in all publications are solely those of the individual author(s) and contributor(s) and not of MDPI and/or the editor(s). MDPI and/or the editor(s) disclaim responsibility for any injury to people or property resulting from any ideas, methods, instructions or products referred to in the content.