
Article

Bioinspired, Transparent Squid-Derived Eumelanin Surface Films on Quartz for Ultraviolet Shielding

by
Shainy Mathew Cheruvathur
and
Krishna Prasad Nooralabettu
*
Department of Biotechnology, P. A. College of Engineering, Visvesvaraya Technological University, Nadupadavu, Mangaluru 5741531, Karnataka, India
*
Author to whom correspondence should be addressed.
Biophysica 2026, 6(4), 58; https://doi.org/10.3390/biophysica6040058
Submission received: 5 April 2026 / Revised: 4 June 2026 / Accepted: 30 June 2026 / Published: 7 July 2026

Abstract

Developing advanced bioinspired photoprotective barrier from marine resources represents a critical frontier of bioprocessing. This study established a rational design and implementation of effective photoprotective surface-coating eumelanin from ink of an Indian squid (Uroteuthis duvaucelii). The Central Composite Design was developed to optimize extraction and functionalization parameters of eumelanin on quartz substrates, strategically developing the matrix for peak optical attenuation within the potential Far-UVC window (220 nm). Translational photoprotective efficacy of the surface, as well as finished eumelanin on quartz surface, was validated by subjecting them to a challenging macro-level biological assay using a hospital-grade 254 nm ultraviolet germicidal source (125 µWcm−2). Quantitative physical dosimetry established that the squid eumelanin coating (A254 = 1.00) reduced internal transmittance to approximately 10%, successfully dampening the incident fluence from 0.225 J cm−2 down to a heavily attenuated 0.0225 J cm−2 at the biological sample plane. While unshielded control indicator microbial strains suffered complete lethal inactivation, the eumelanin barrier maintained exceptional cell viability, yielding biological shielding efficiencies of 98% for Bacillus subtilis, 96% for Staphylococcus aureus, and 92% for Escherichia coli. Characteristic features from FE-SEM, FTIR, and XRD analysis established that this superior photoprotective property is governed by the extensively conjugated, π-π-stacked indolic architecture possessing a characteristic 3.4 Å interlayer d-spacing, which facilitates rapid, non-radiative energy dissipation. This work establishes an effective framework for translating squid biomass into high-value, transparent optical barriers, providing a potential sustainable alternative to synthetic ultraviolet absorbers.

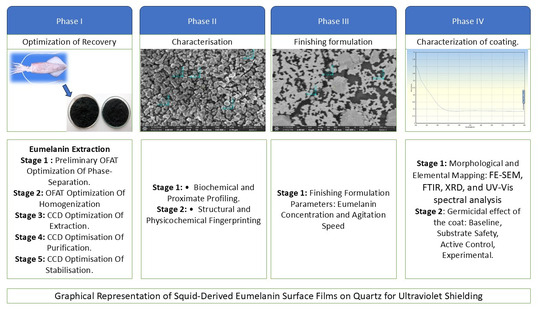
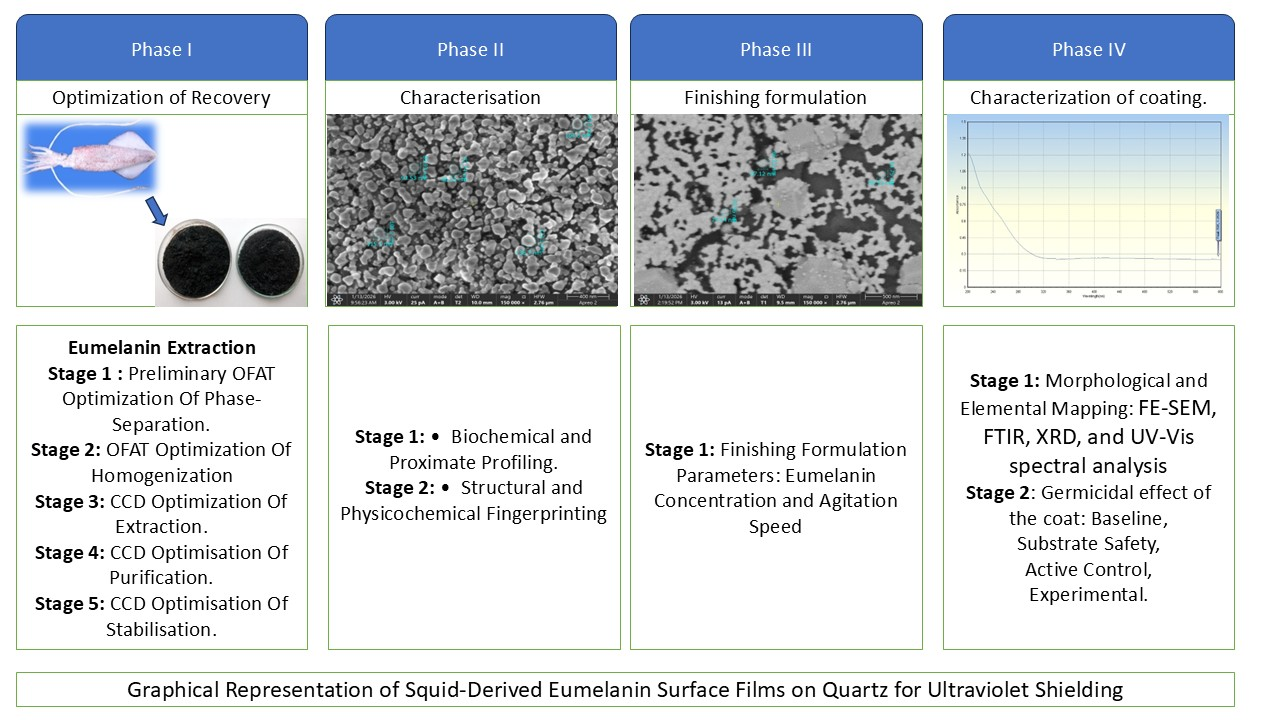
Graphical Abstract

1. Introduction

Continued destruction of the ozone layer assisted with prolonged exposure of people to natural radiations in an open field, or continued exposure of medical professionals and patients to artificial radiations emitted from diagnostic and therapeutic instruments disturbs the normal functioning of the living cells [1,2]. Prolonged exposure to Ultraviolet (UV) radiation leads to severe photochemical damage within living organisms, resulting in deleterious cellular mutations and structural degradation [3]. Cellular damage due to prolonged exposure to UV underscores the critical requirement for developing effective ultraviolet protective barriers capable of shielding sensitive microenvironments and biological substrates from radiation flux [4].
Given the severe degradative effects of unattenuated UV radiation on living organ-isms, developing effective radiation-shielding surface treatments is essential. Integrating bio-inspired optical barriers from marine sources onto quartz interfaces presents a promising strategy to maximize photoprotective safety in light-sensitive environments. Nanostructured spherical eumelanin from Indian squid, Uroteuthis (Photololigo) duvaucelii with UV absorptive, antioxidant, and antimicrobial properties has attracted more interest compared to natural complex melanin, if the appropriate strategy is used to recover it from sources with optimum structural and functional integrity [5]. Eumelanin is a robust π-conjugated biopolymer comprising 5,6-dihydroxyindole (DHI) along with 5,6-dihydroxyindole-2-carboxylic acid (DHICA) building blocks [6,7]. Hierarchical π-π-stacking interactions of eumelanin facilitates a featureless broadband absorption spectrum encompassing the ultraviolet (UV) to near-infrared (NIR), enabling efficient non-radiative energy dissipation [8].
The physico-chemical characteristics of eumelanin, and its biomedical and Biotechnological applications of Sepia officinalis, have been extensively documented [9,10]. U. duvaucelii is harvested most abundantly along the Indian coastal belt in comparison to Sepia officinalis in the Indian Ocean, and also Squid eumelanin differs from Sepia eumelanin in certain physico-chemical characteristics, such as particle-size distribution and ratio of DHICA/DHI, which may offer different polymerization kinetics [5,11,12]. Current extraction and deployment protocols are frequently hindered by poor reproducibility, batch-to-batch variability, and a lack of standardized physicochemical validation [13]. While Central Composite Design (CCD) is used for modeling interrelated multifactorial studies, its application in optimizing eumelanin surface coating for specific spectral targets, particularly the critical Far-UVC (200–230 nm) regime, remains largely unaddressed [14]. The current research addressed herein is the lack of a predictive optical framework that correlates statistically optimized extraction parameters with predictable shielding efficiency. The study addresses this research gap by mapping the optical attenuation characteristics of eumelanin coatings designed for the Far-UVC spectrum (220 nm) directly to their empirical biological shielding properties against standard germicidal radiation (254 nm).
The study hypothesizes that CCD-based optimization can bridge the gap between extraction yield and coating performance, allowing for the fabrication of high-fidelity nano-coatings with predictable attenuation coefficients. This research work reports a strategy for the isolation and functional deployment of eumelanin derived from the ink sac of the Indian Squid, and it assesses the photo-shielding performance of a eumelanin coat on indicator microbial strains. Following CCD-RSM optimization to maximize purity and structural integrity, the biopolymer was characterized via UV-Vis, FTIR, XRD, and FE-SEM to confirm its morphological and chemical functionality.
The scope of this work extends to the fabrication of uniform eumelanin nano-finishes on quartz substrates and the subsequent development of a CCD. In the Far-UVC regime, these coatings exhibited a monotonic increase in absorbance from 0.7110 to 1.2220. Microbial challenge tests conducted in eumelanin surface-finished quartz on Staphylococcus aureus (ATCC 25923), Escherichia coli (ATCC 25922), and Bacillus subtilis (ATCC 6633) against UV radiation (254 nm) demonstrated the shielding efficiency of the functionalized eumelanin against germicidal effect by UV rays [15]. Bioinspired UV-protective eumelanin-finished quartz sheet is developed though statistical process models that pave the way for designing a transparent photoprotective surfaces.

2. Materials and Methodology

2.1. Materials and Reagents

All chemicals, reagents, solvents, and deionized water (18.2 MΩ·cm at 25 °C) utilized in this work were of Analytical Reagent (AR) grade and sourced from Merck Limited (Mumbai, India) and prepared in strict accordance with the American Chemical Society (ACS) specifications to ensure high experimental reproducibility [16]. Superior solar grade high-purity fused silica (quartz) slides were employed for optical and functionalization characterization.

2.2. Biomass Procurement and Biopolymer Isolation

Fresh specimens of the Indian squid, U. duvaucelii, were harvested from the coastal waters of Mangaluru, India at coordinates 13.21505° N; 75.05525° E. Taxonomic authentication was conducted (Dr. Jithendra Sundaray, ICAR-CIBA, Bhubaneshwar, India) using official FAO cephalopod identification manuals to ensure species accuracy [17,18]. To maintain biopolymer integrity, the researchers selected specimens characterized by a mantle length between 14 and 19 cm and a total mass ranging from 86.00 to 98.00 g. These specimens were transported in chilled seawater at 4 °C and were fully processed within a 45 min post-harvest window.
Since squid specimens were purchased dead from fishing vessels, no institutional ethics approval was required. The ink sacs were surgically isolated using a precision longitudinal mantle incision performed under aseptic and chilled conditions at 4 °C. To prevent the endogenous enzymatic disintegration and preserve the structural and functional integrity of the eumelanin, the sacs were stabilized by sequential rinsing with 0.6 M NaCl. After subjecting them to detailed gravimetric analysis, the isolated squid ink sacs were suspended in a 1:1 (w/v) chilled saline buffer at 4 °C to prepare them for immediate processing.

2.3. Hierarchical Experimental Architecture

The experimental work was performed through a structured four-phase logical framework developed to translate from crude marine biomass to high-performance functional nano-coatings of quartz sheet.
Phase I: Optimization of Recovery: Systematic refinement of parameters of extraction using a sequential approach of OFAT screening and CCD-based Response Surface Methodology.
Phase II: Physicochemical and Biochemical Characterisation: Physico-chemical characterization of the isolate to establish its structural and indolic isolate.
Phase III: Formulation of functionalization of quartz plate: Development of finishing protocols for precision functionalization of quartz surface.
Phase IV: Validation of Functionalized quartz surface: Characterisation of UV shielding efficiency, durability, and biological stability.

2.3.1. Phase I: Optimization of Eumelanin Recovery

The recovery of eumelanin from the ink sac of the Indian squid was performed through a calibrated biphasic solvent system. The methodology utilized a slightly modified Bligh and Dyer method at Chloroform:methanol:water ratio 1:2:0.8 v/v/v to favor the differential partitioning of eumelanin from other components of ink [19]. The recovery process was divided into two distinct operational stages: the refinement of phase-separation kinetics, known as Stage 1, and the optimization of homogenization parameters, known as Stage 2.
  • Stage 1: OFAT optimization of Phase-Separation:
The phase-separation of eumelanin and other constituents of squid ink was initiated by preparing an aqueous–methanol solution comprising 5.26 mL of methanol and 2.11 mL of deionized water to attain a total volume of 7.37 mL. The pH of the medium was adjusted to 7.0 using analytical-grade reagents and supplemented with NaCl at 0.98% to stabilize the ionic environment. The resulting mixture was homogenized through pulsed ultrasound using probe-sonicator (Model PRO-650, Labman Scientific Instruments, Chennai, Tamil Nadu, India) at a frequency of 40 kHz with a 1:1 pulse ratio for 15 min at a constant temperature of 4 °C (R-134a-Laboratory cooling bath circulator, Vishwakarma Equipments Vasai, Maharashtra, India). Followed by primary homogenization, 2.63 mL of chloroform were added to the mixture, and the resulting homogenate was subjected to a secondary 15 min ultrasonication cycle at 4 °C to facilitate complete emulsification.
A comprehensive OFAT experimental approach was performed to characterize the critical thresholds required for interfacial equilibrium, as illustrated in Table 1. Independent variables included the Relative Centrifugal Force (RCF), ranging from 89 to 8944× g, and a centrifugation duration spanning 1 to 19 min. Samples were processed in a refrigerated centrifuge equipped with a fixed-angle rotor (C-24 BL 412 LAG, Remi Laboratory Instruments, Mumbai, India) with rotor radius of 84 mm.
During the homogenization phase, several parameters were maintained at fixed levels to ensure consistency across the trials. These carefully designed conditions incorporated a chloroform-to-methanol-to-water ratio of 1:2:0.8 (v/v/v), and a solvent-to-sample ratio of 4:1. The total volume was standardized at 12.5 mL within capped glass centrifuge tubes. All experiments were performed at +4 °C using a cumulative pulsed ultrasonication duration of 30 min at 40 kHz. These fixed conditions were maintained during the phase-separation trials unless specifically designated as independent variables.
  • Stage 2: OFAT optimization of Homogenization:
To refine the solvent extraction efficiency of eumelanin from the ink sac, the homogenization experiments were systematically optimized after the stabilization of phase-separation kinetics. During these experimental sets, critical process constant parameters were strictly maintained, including a solvent-to-sample ratio of 4:1 and a resulting total working volume of 12.5 mL. All experiments were performed within capped glass centrifuge tubes to prevent solvent evaporation and maintain the robustness of the ternary solvent system. Unless designated as an independent variable, centrifugation was performed at a constant temperature of 4 °C to minimize thermal degradation of the biopolymer. The homogenization parameters were evaluated through a sequential OFAT approach, where each subsequent factor was optimized based on the finalized levels of the preceding parameters (Table 2).
  • Statistical Analysis (OFAT):
All OFAT experiments were performed in triplicate (n = 3), and results are expressed as mean ± SD. Statistical analyses were conducted using JMP® Pro (Version 17; SAS Institute Inc., Cary, NC, USA). The effect of each independent factor was evaluated by one-way ANOVA with Tukey’s HSD post-hoc test (α = 0.05). Regression analysis was used descriptively to assess trends and plateaus across tested ranges. Statistically optimized OFAT conditions were then used to define factor ranges and center points for CCD-based multivariate optimization.
  • Stage 3: CCD optimization of extraction:
Critical interactions between ultrasonication time (G) and temperature (H) were further refined via CCD) as detailed in Table 3. The selection of fixed parameters (pH 7.0 and 0.98% NaCl) was based on the transition points identified during the OFAT phase to ensure the system operated at the onset of the eumelanin recovery plateau.
The lowest experimental temperature (−15.18 °C) was maintained within the liquid phase of the ternary solvent system, leveraging the significant freezing-point depression provided by the methanol–water–NaCl matrix to ensure continuous phase-separation kinetics without ice formation.
  • Stage 4: CCD optimization of acid-base cycling purification:
The acid-base precipitation (pH and cycle count) was statistically optimized to ensure the maximum gravimetric yield and biopolymer purity (Table 4).
  • Stage 5: CCD optimization of stabilization:
The thermal stabilization (drying temperature and duration) was optimized statistically to ensure the stability of the purified eumelanin (Table 5).

2.3.2. Phase II: Characterization of Purified Eumelanin

  • Biochemical and Proximate Profiling:
The elemental composition and relative purity of the Squid ink biopolymer were quantified through standardized biochemical assays conducted in triplicate, with results adjusted for the relevant dilution factors (DF) where necessary. Total protein was determined via the Lowry method (660 nm) spectrophotometrically (Remi bench top spectrophotometer, REMI, Mumbai, India, Model: LMSPUV1000B) using a BSA calibration curve (20–200 µg/mL) [20]. Free amino acids were determined via the Ninhydrin assay (570 nm) against L-leucine standards [21]. Total carbohydrates were estimated using the Phenol-Sulfuric acid method (490 nm) [22]. Lipids were extracted by method developed by Folch and others [23] with the chloroform phase evaporated (45–50 °C) and dried to constant weight (60 °C). Trace elements (Fe, Zn, Cu, Mg) were quantified via Atomic Absorption Spectroscopy (AAS) (Thermo Scientific™ iCE™ 3300 AAS, Waltham, MA, USA) following wet digestion (3:1 HNO3:HCl) of the ash residue [24]. Moisture and ash content were determined gravimetrically following AOAC [25] by drying at 105 °C and incineration at 550 °C, respectively. Phase-separation efficiency is measured by spectroscopic measurement [26] of the absorption at 280 nm and 340 nm, as corrected absorbance is calculated by deducting the values of absorbance measured at 280 nm by values absorbance measured at 340 nm to eliminate optical interference from light scattering. The Gravimetric Yield of the intermediate eumelanin phase was determined after evaporation at 100 °C and subsequent thermal stabilization [14], expressed as mg 2.5 g−1 of the original sample considering the DF. Efficiency of the eumelanin recovery is estimated by measuring spectrophotometric (Double Beam spectrophotometer, Model LMSP-UV1000B, Labman Scientific Instruments, Chennai, Tamil Nadu, India) absorbance of the samples at 220 nm. The selection of 220 nm provides a balance between the high molar absorptivity of the eumelanin indole-core and the need to minimize interference from peptide bonds, which typically peak closer to 190–210 nm [5,27].
  • Structural and Physicochemical Fingerprinting:
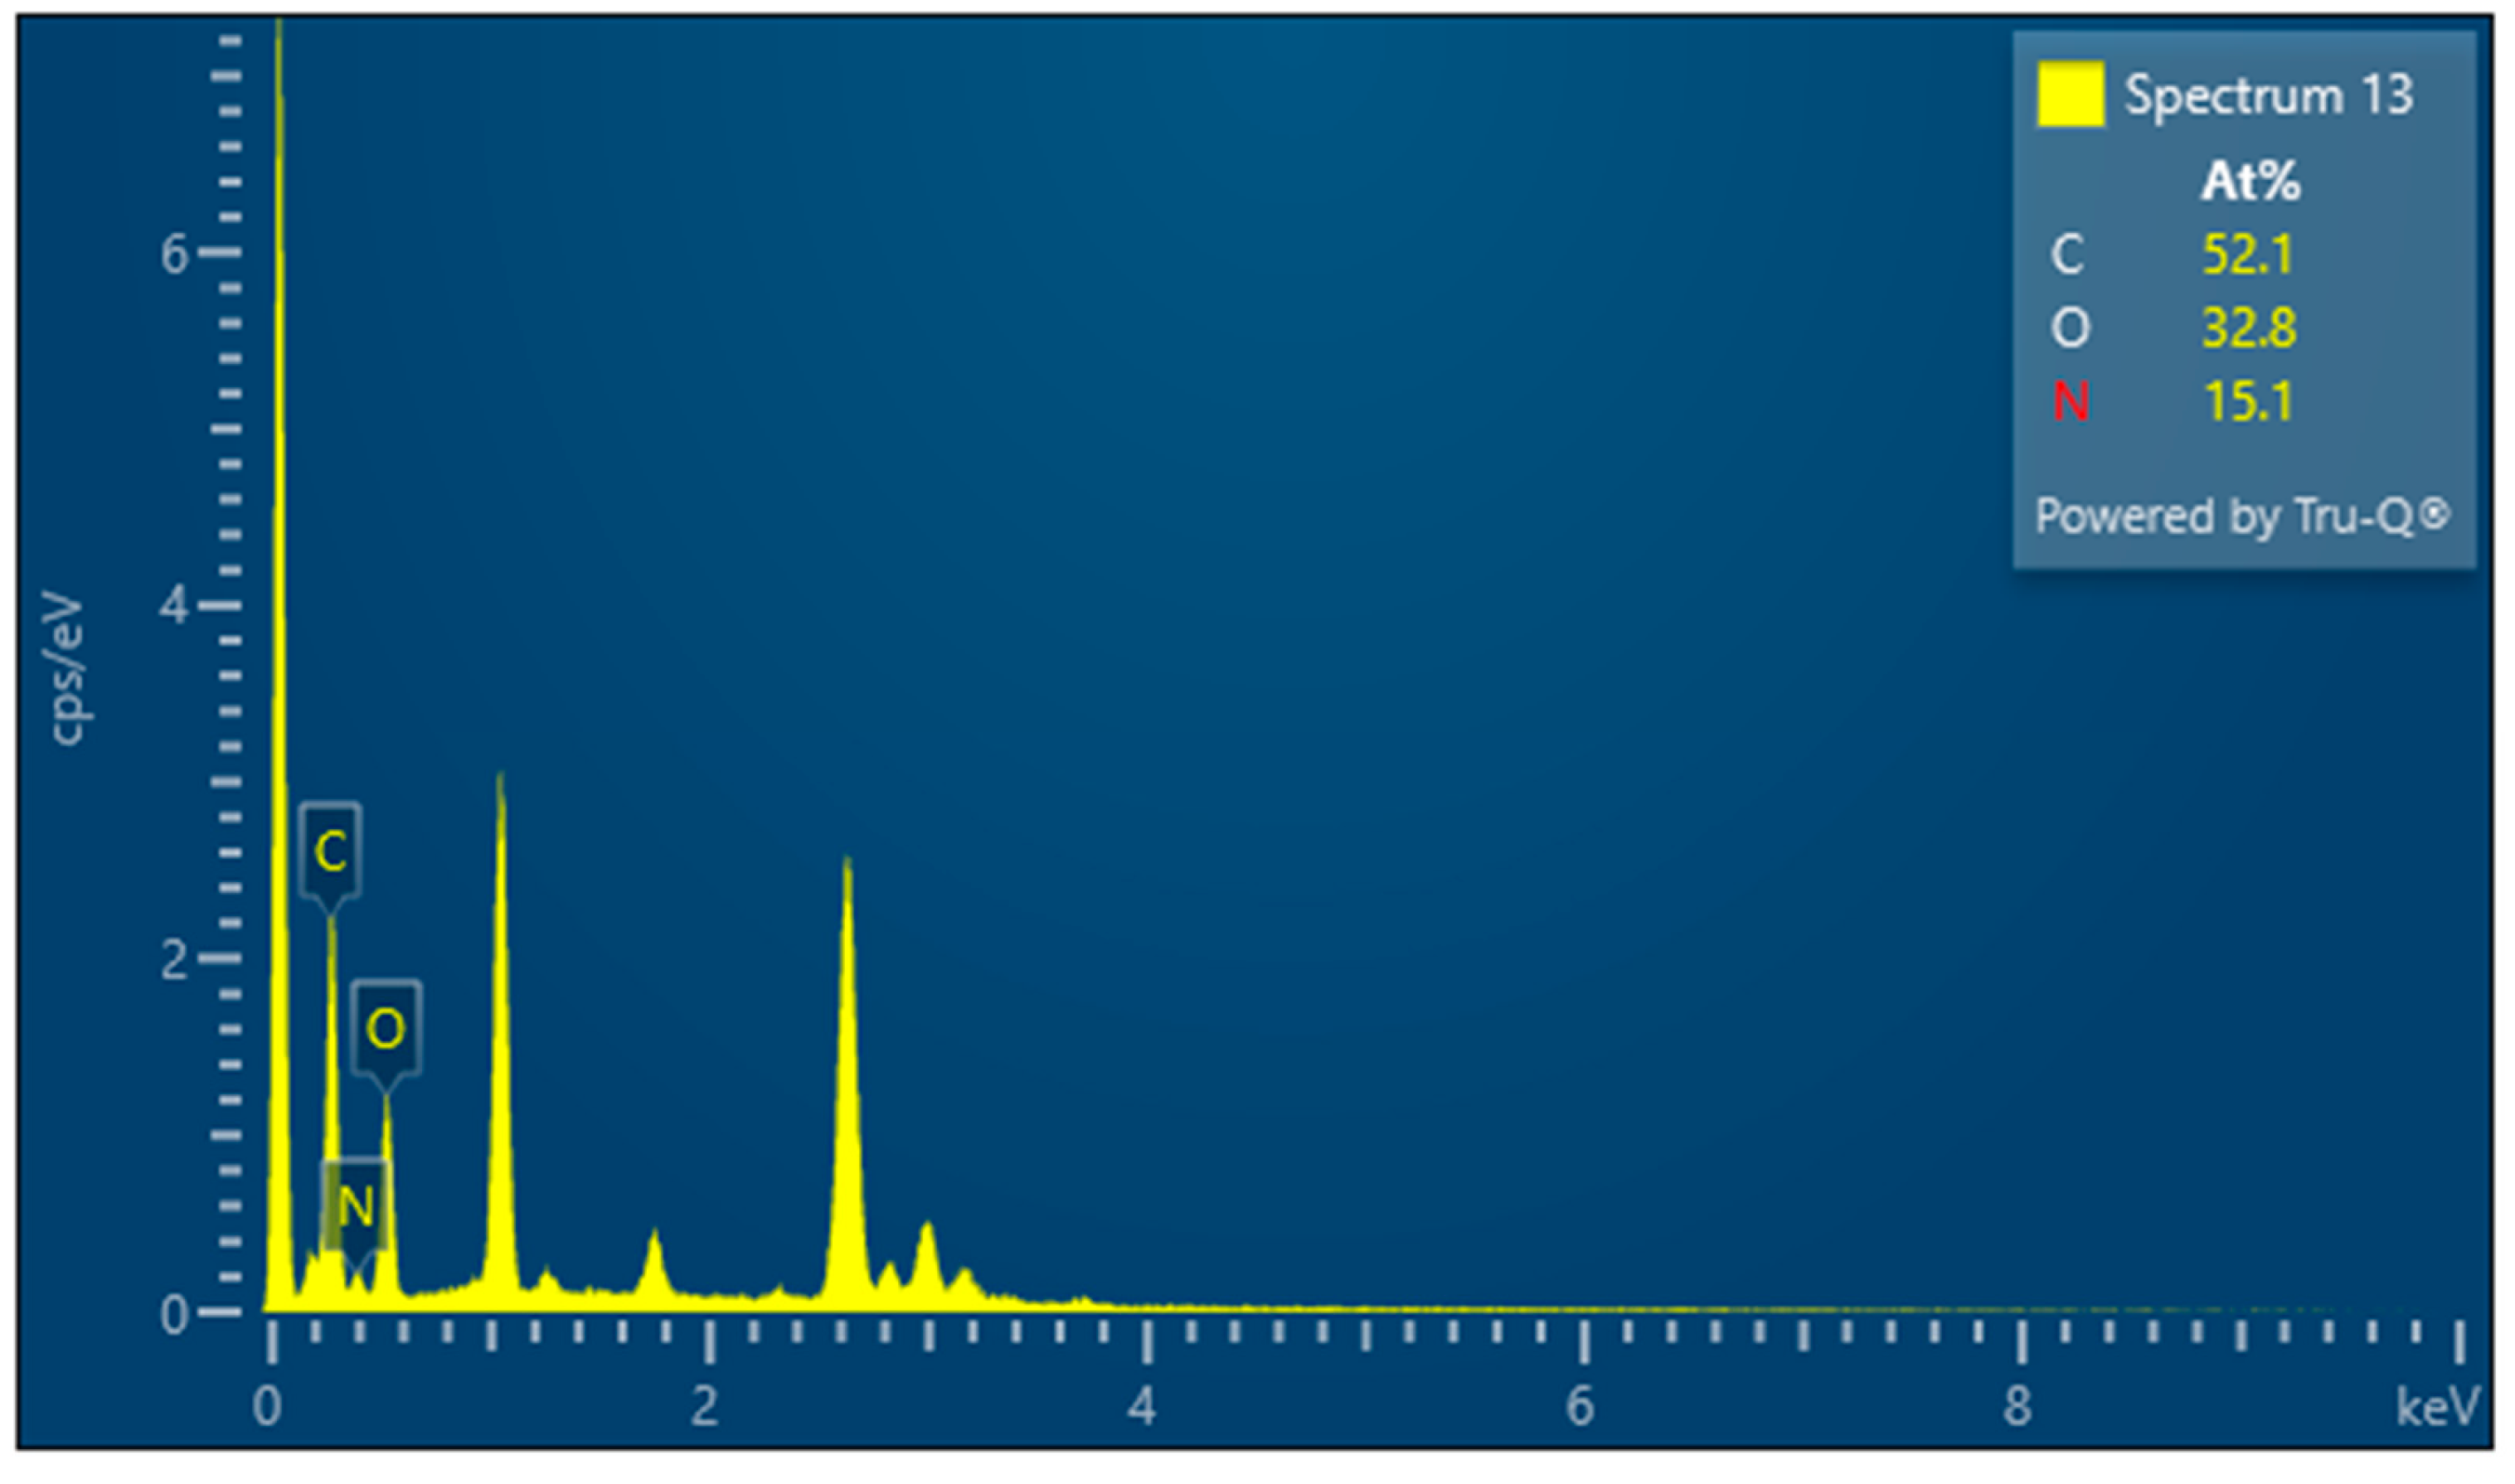
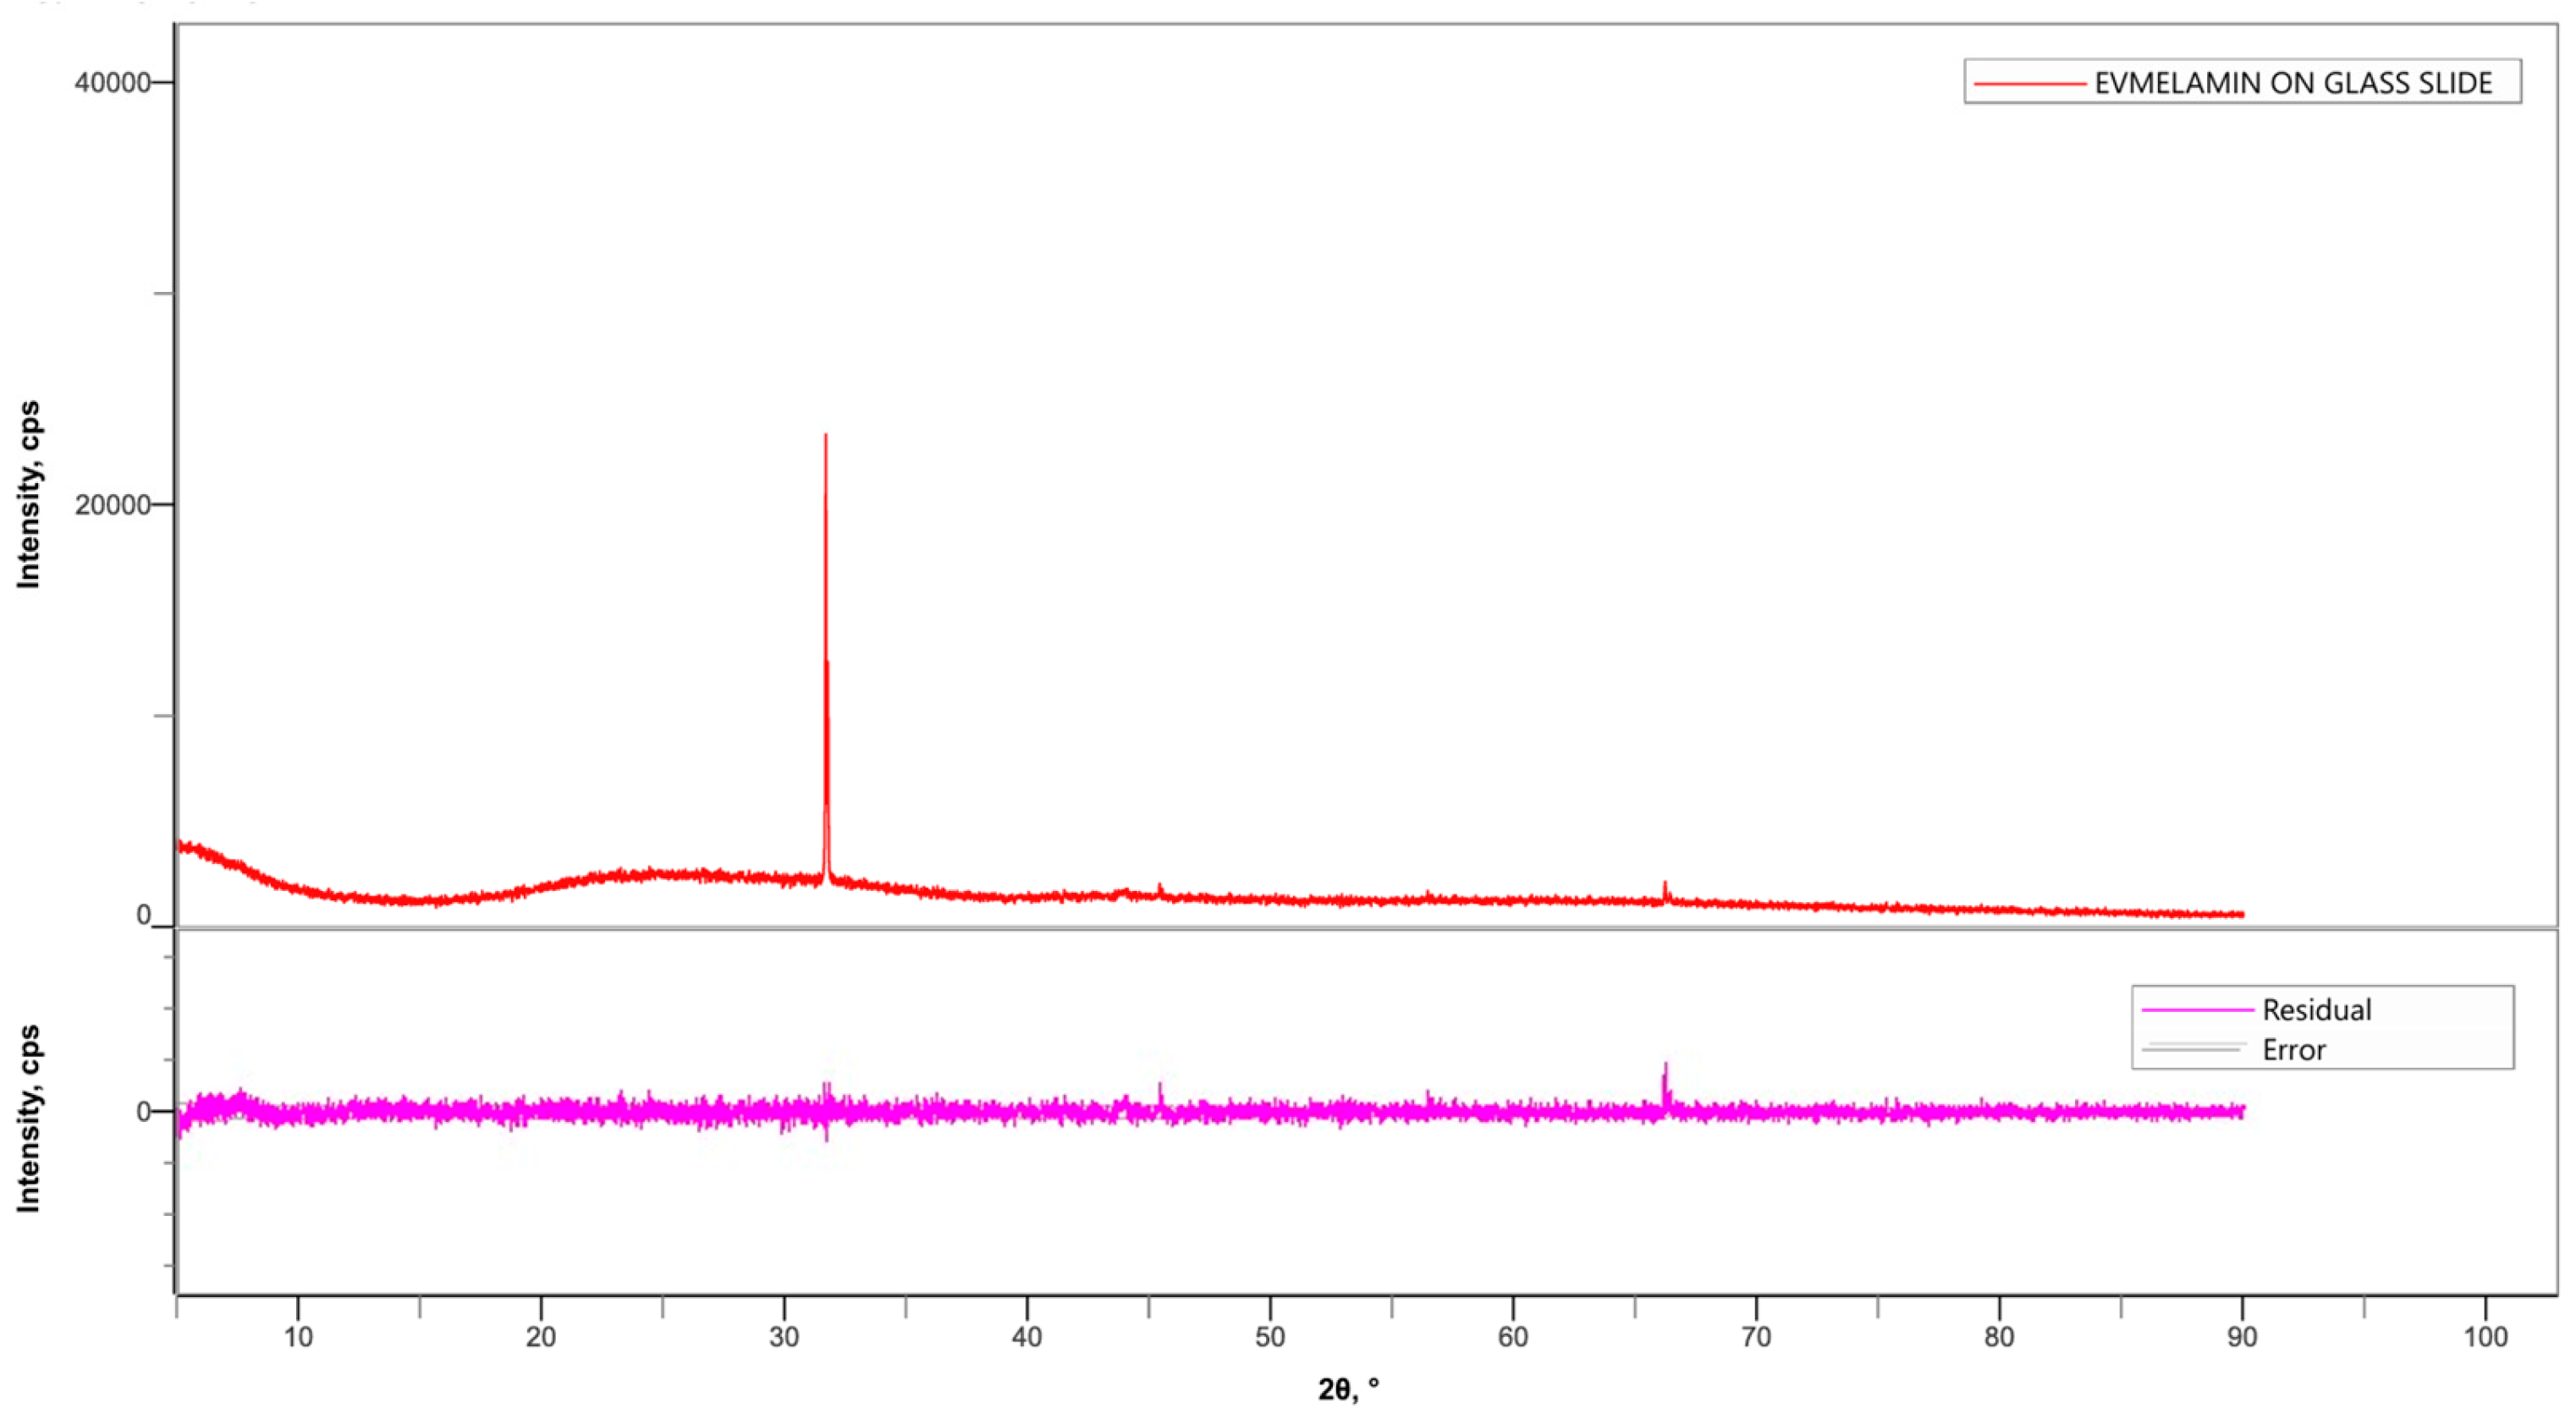
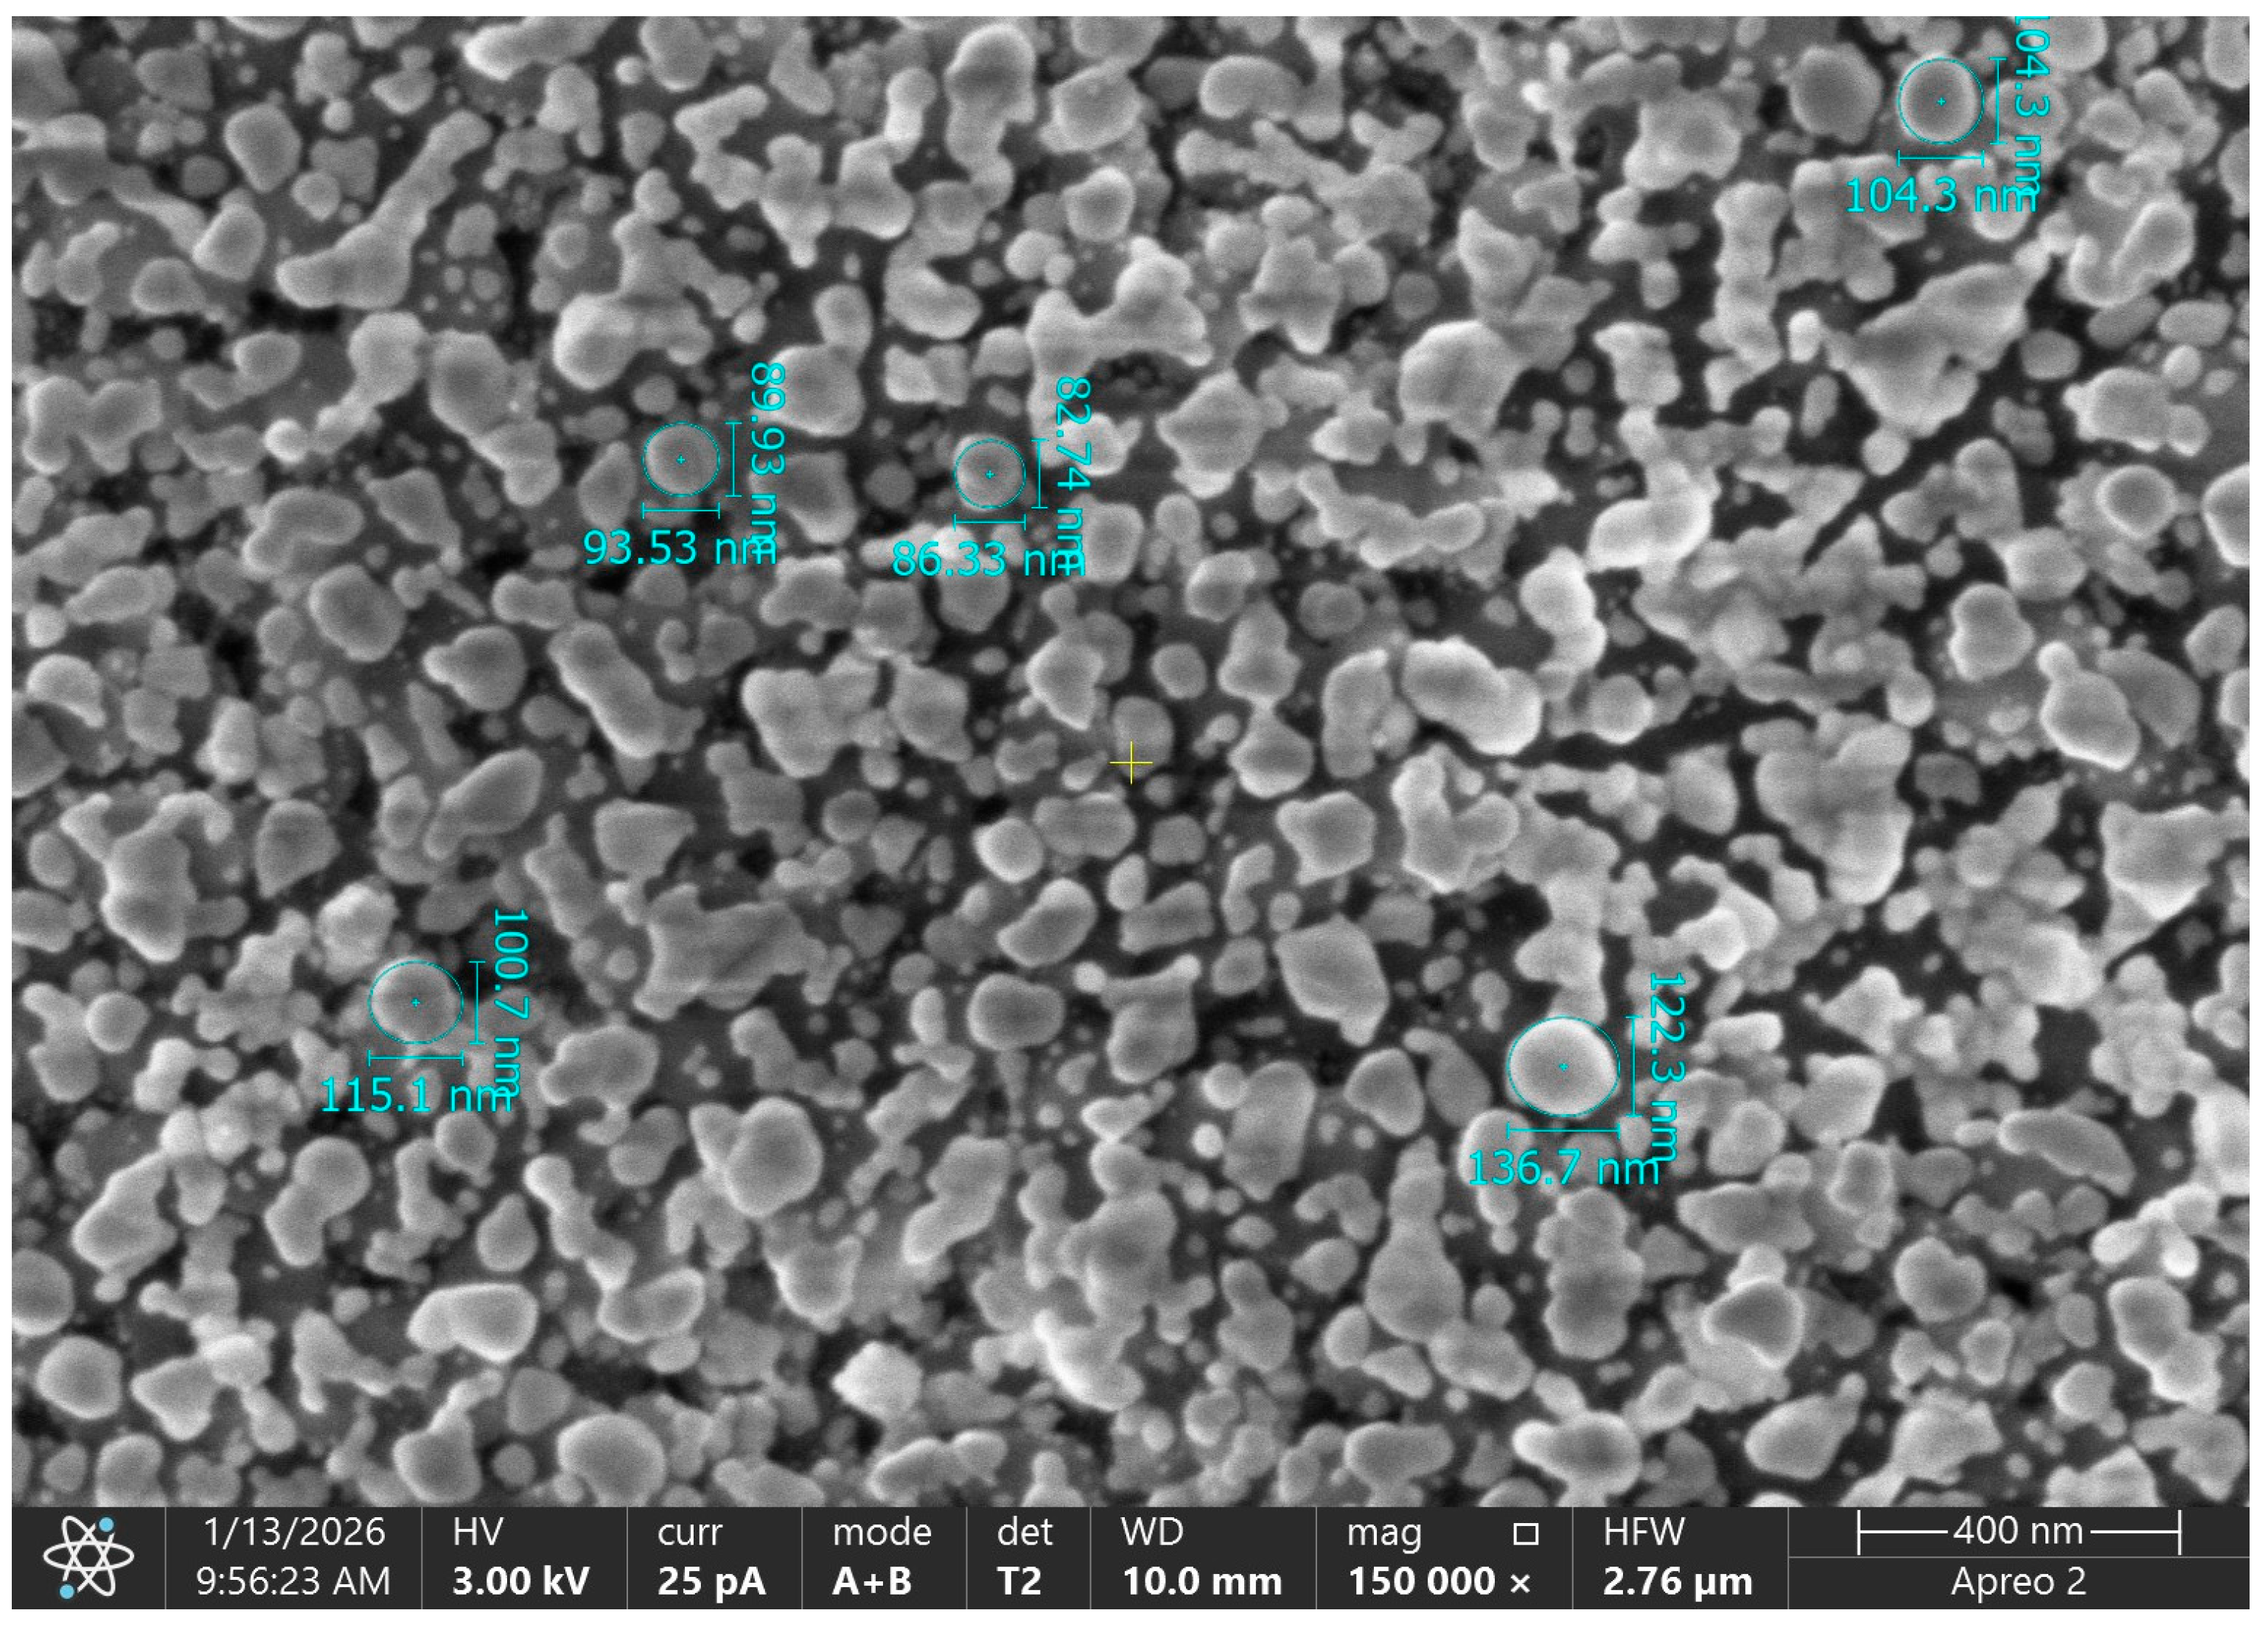
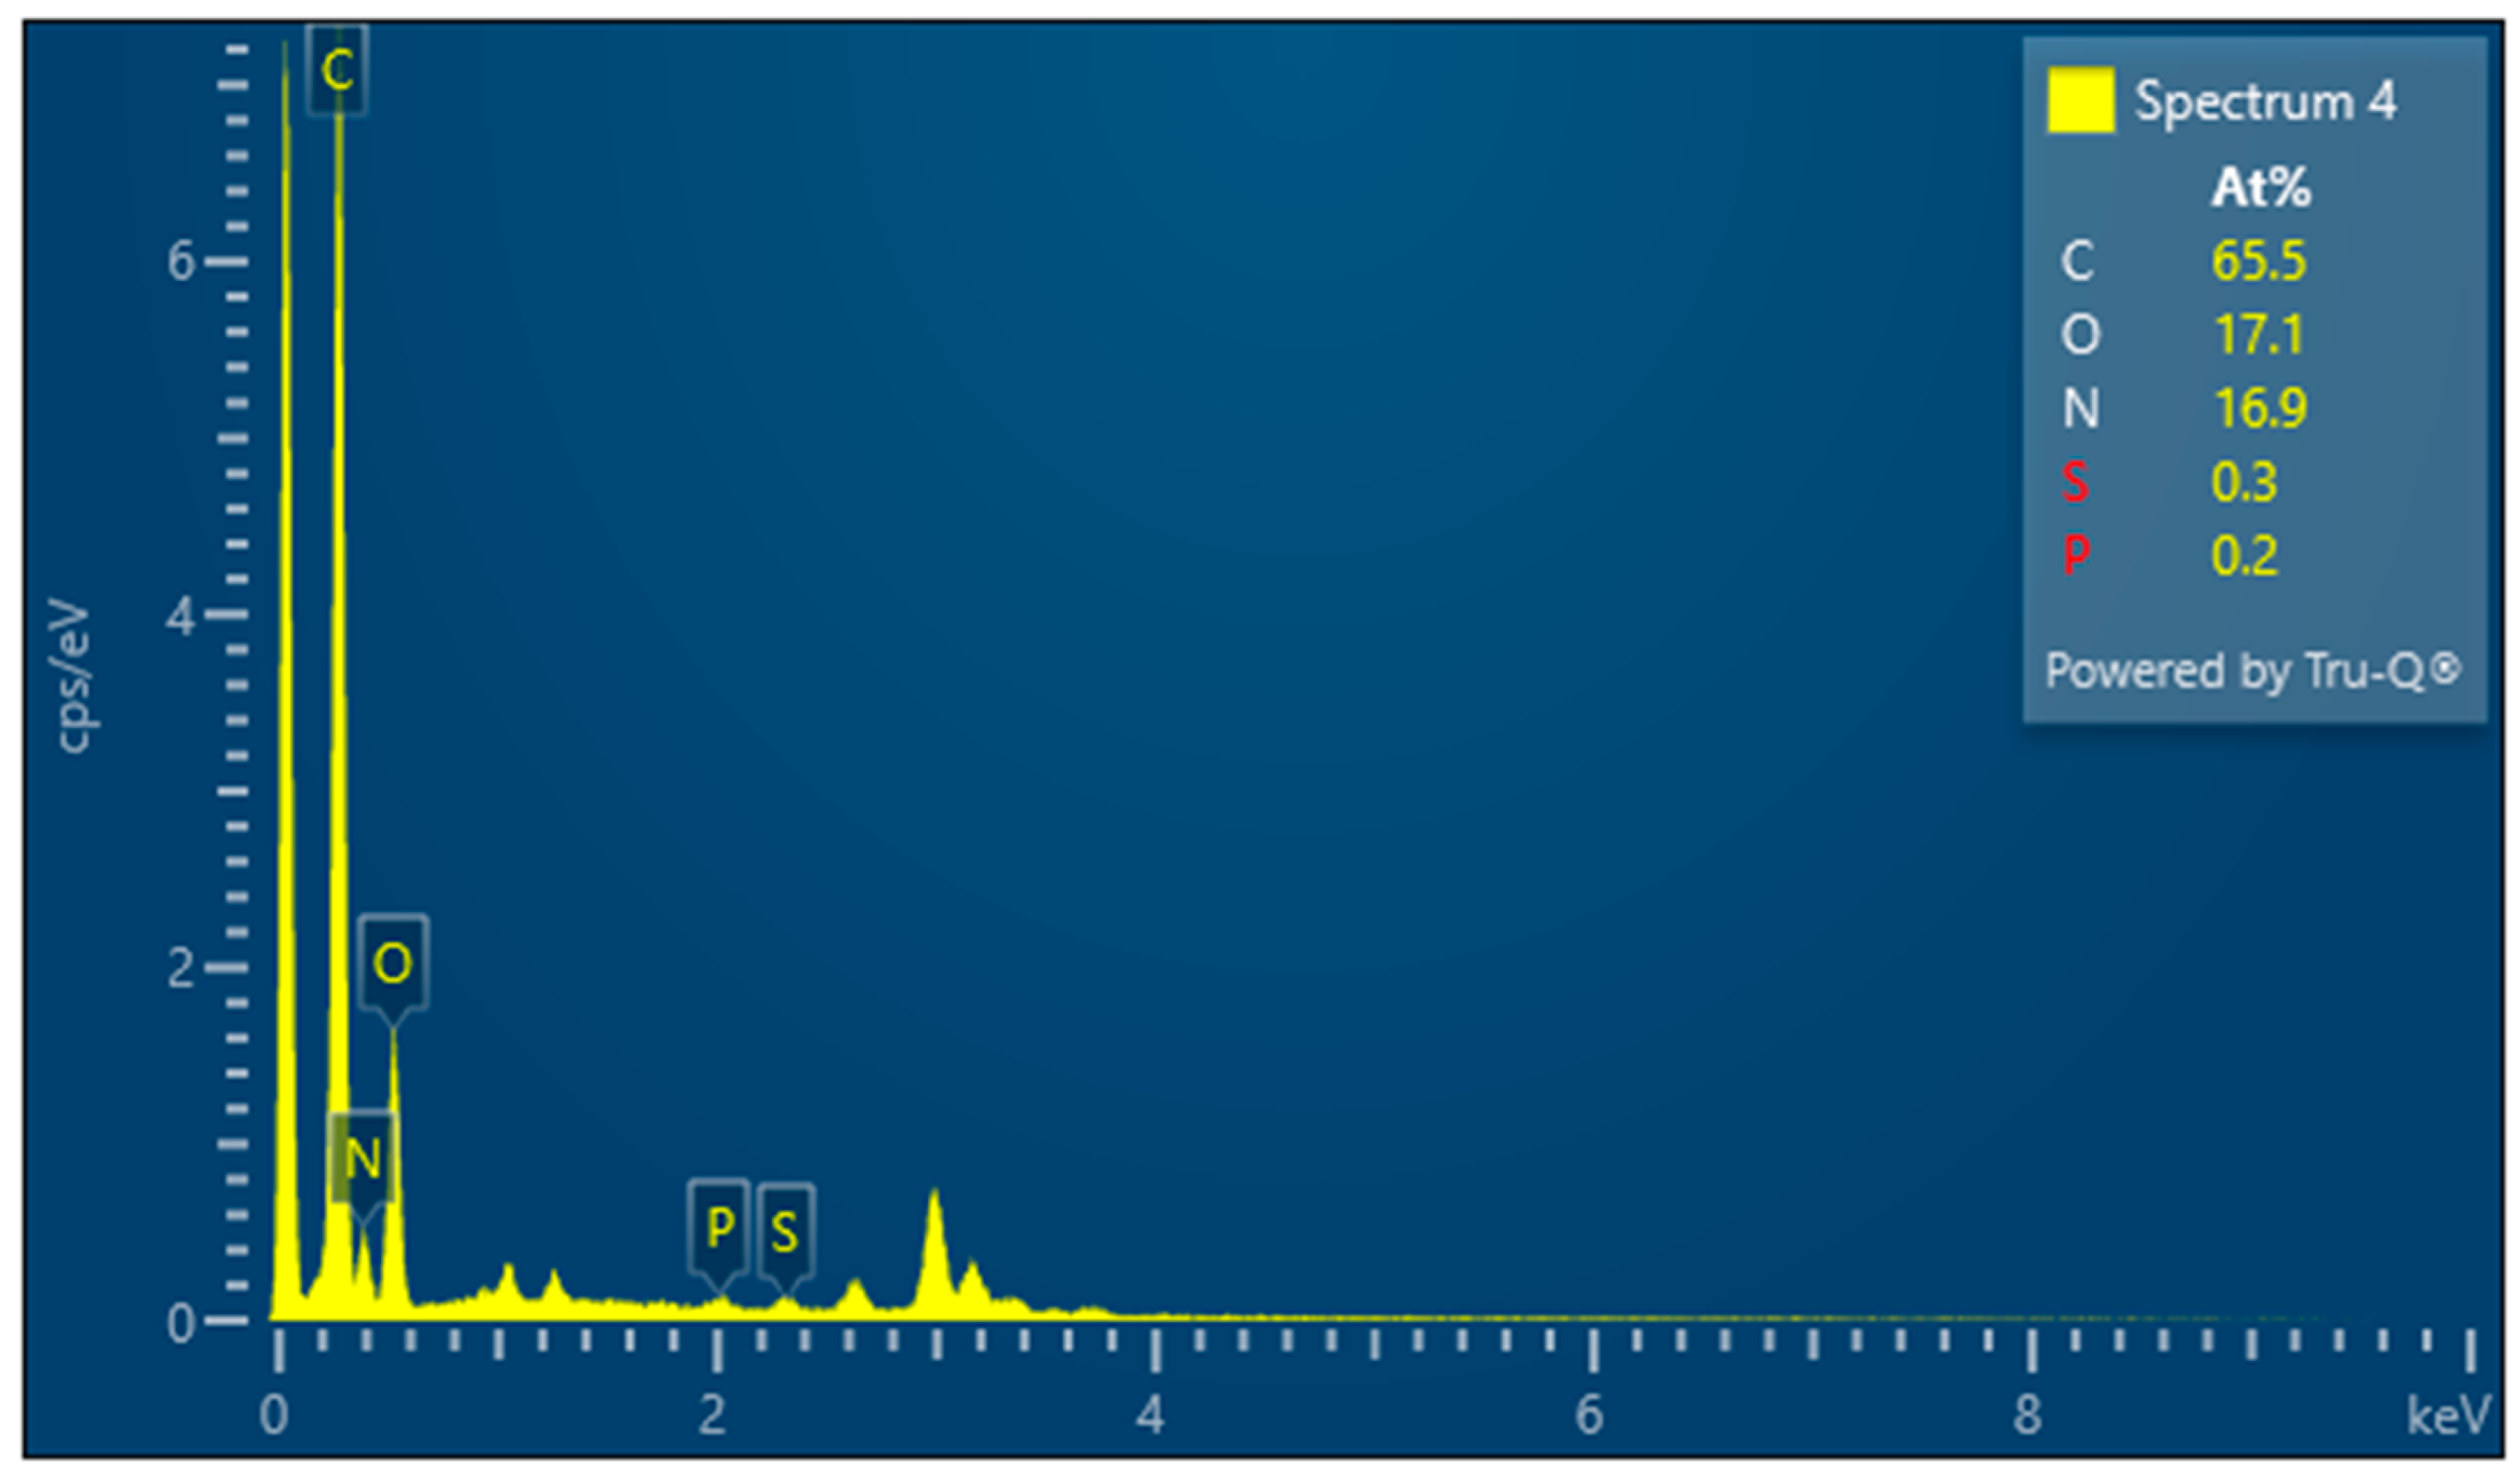
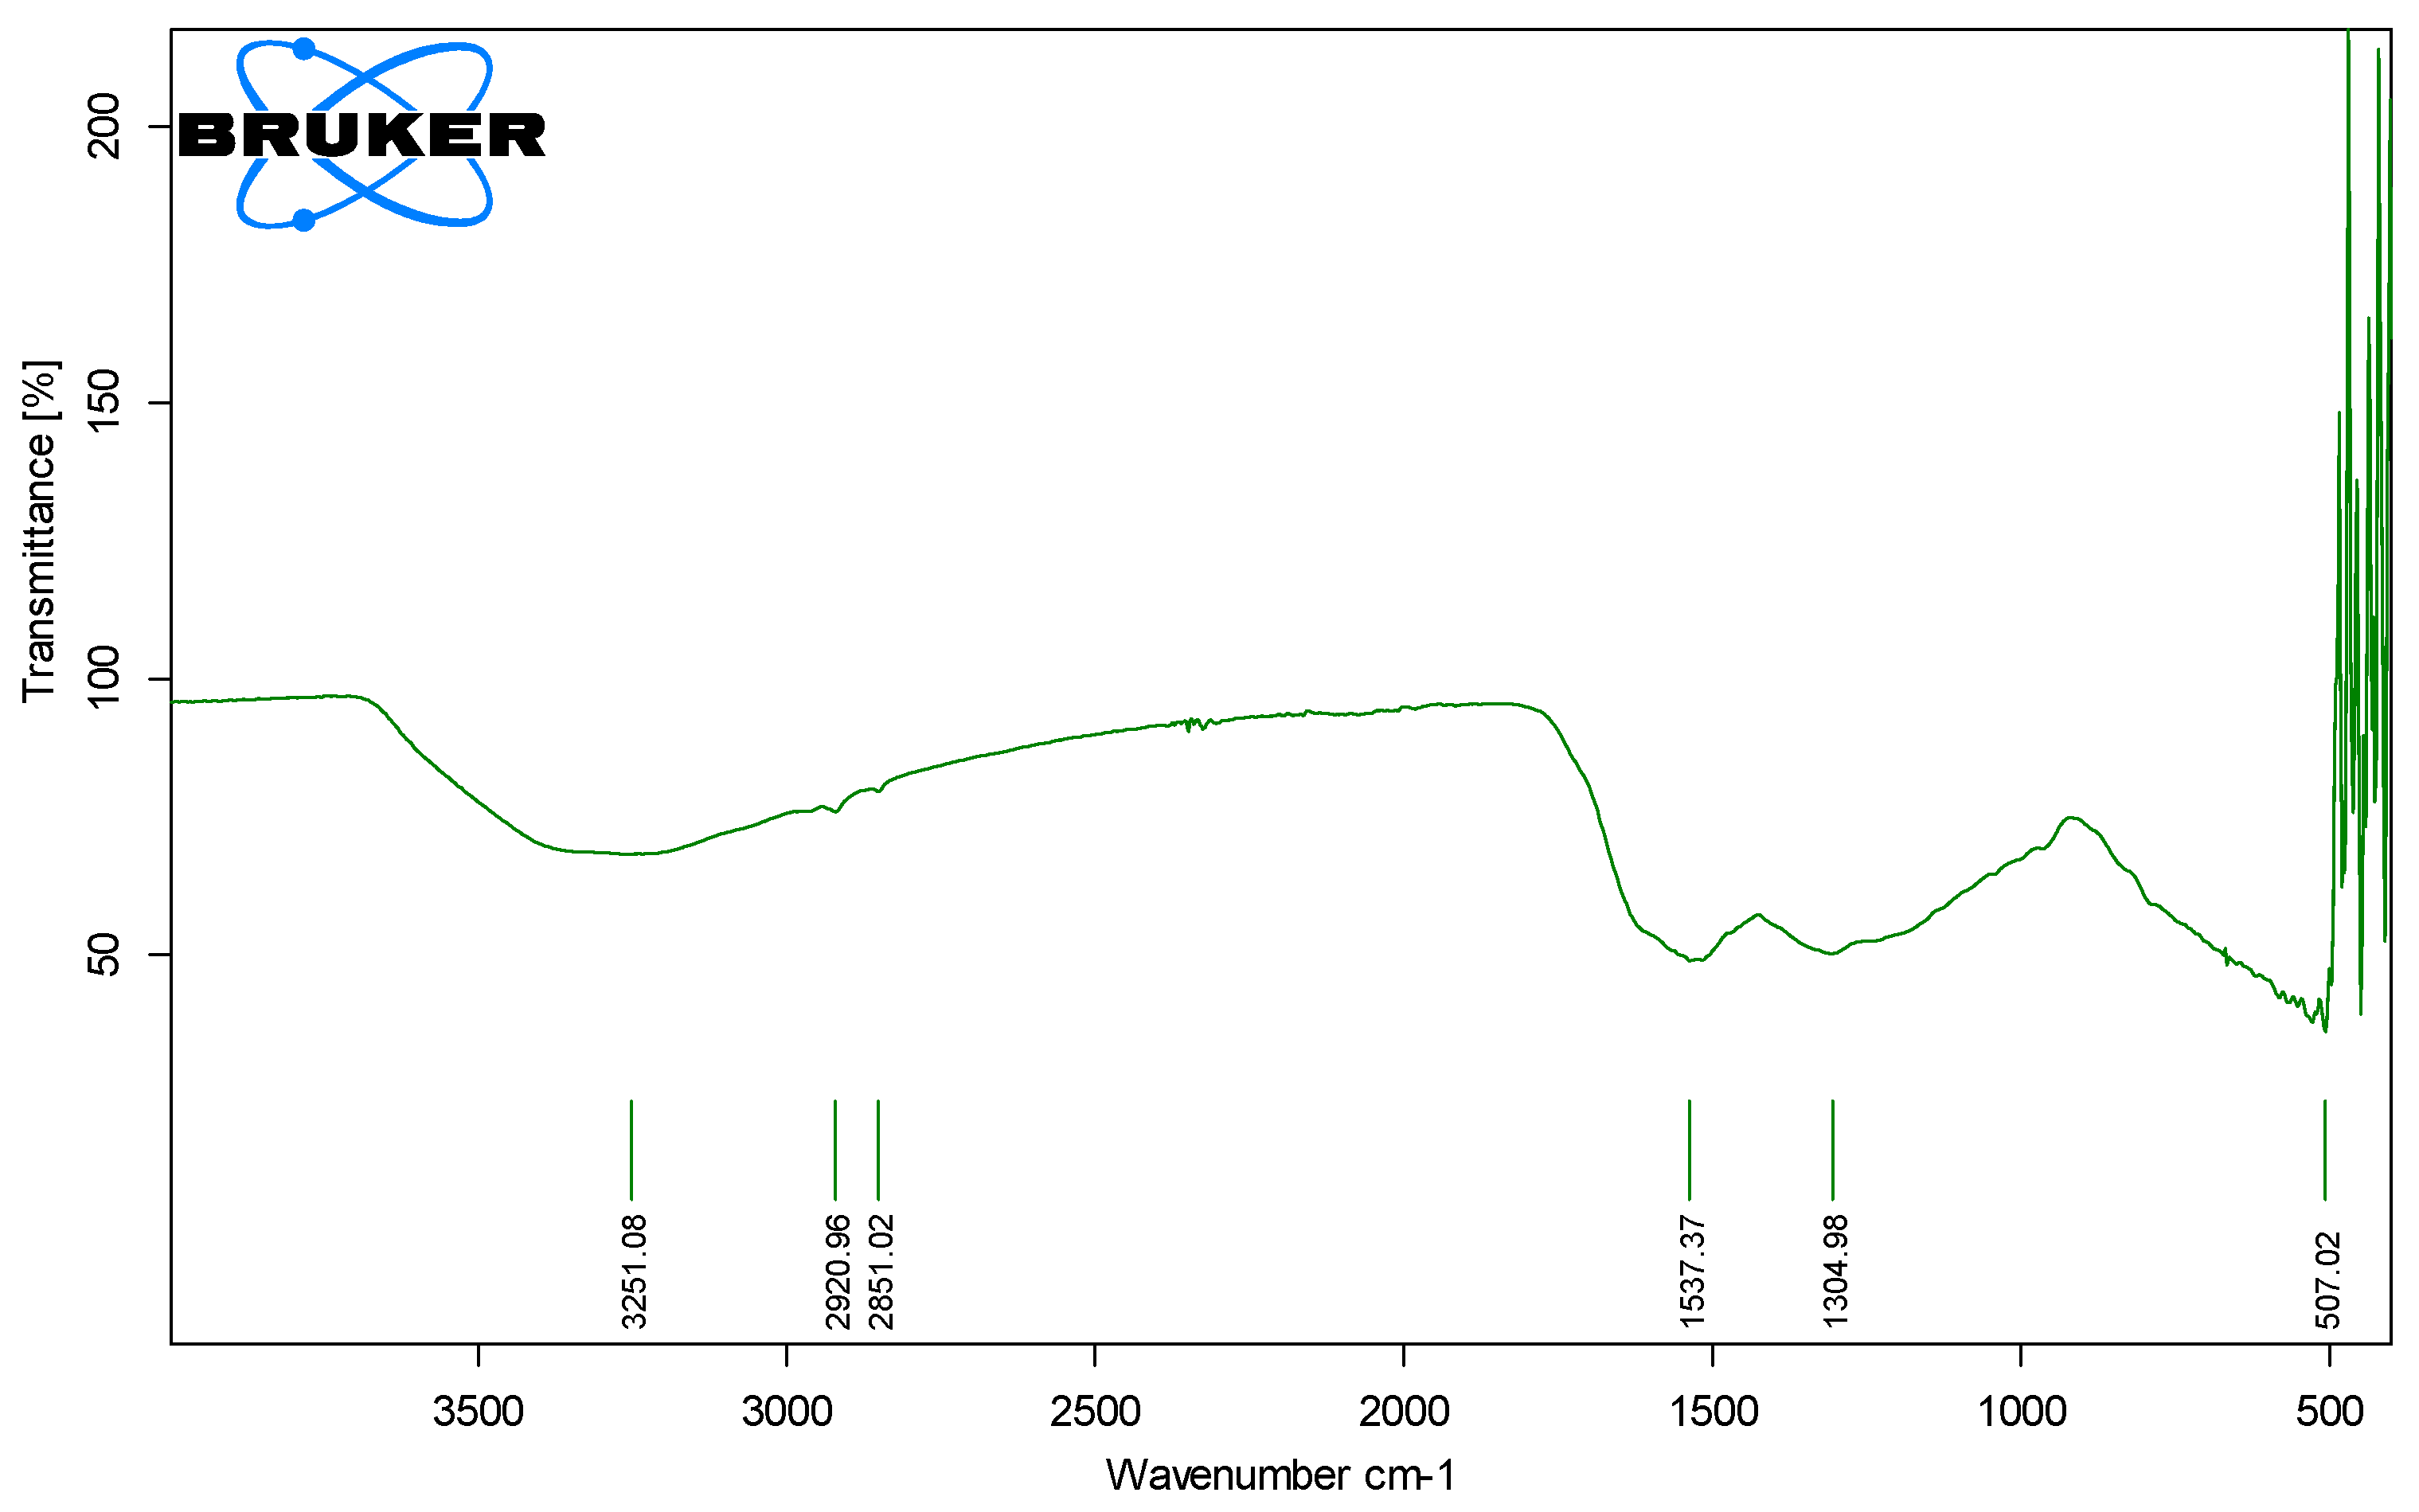
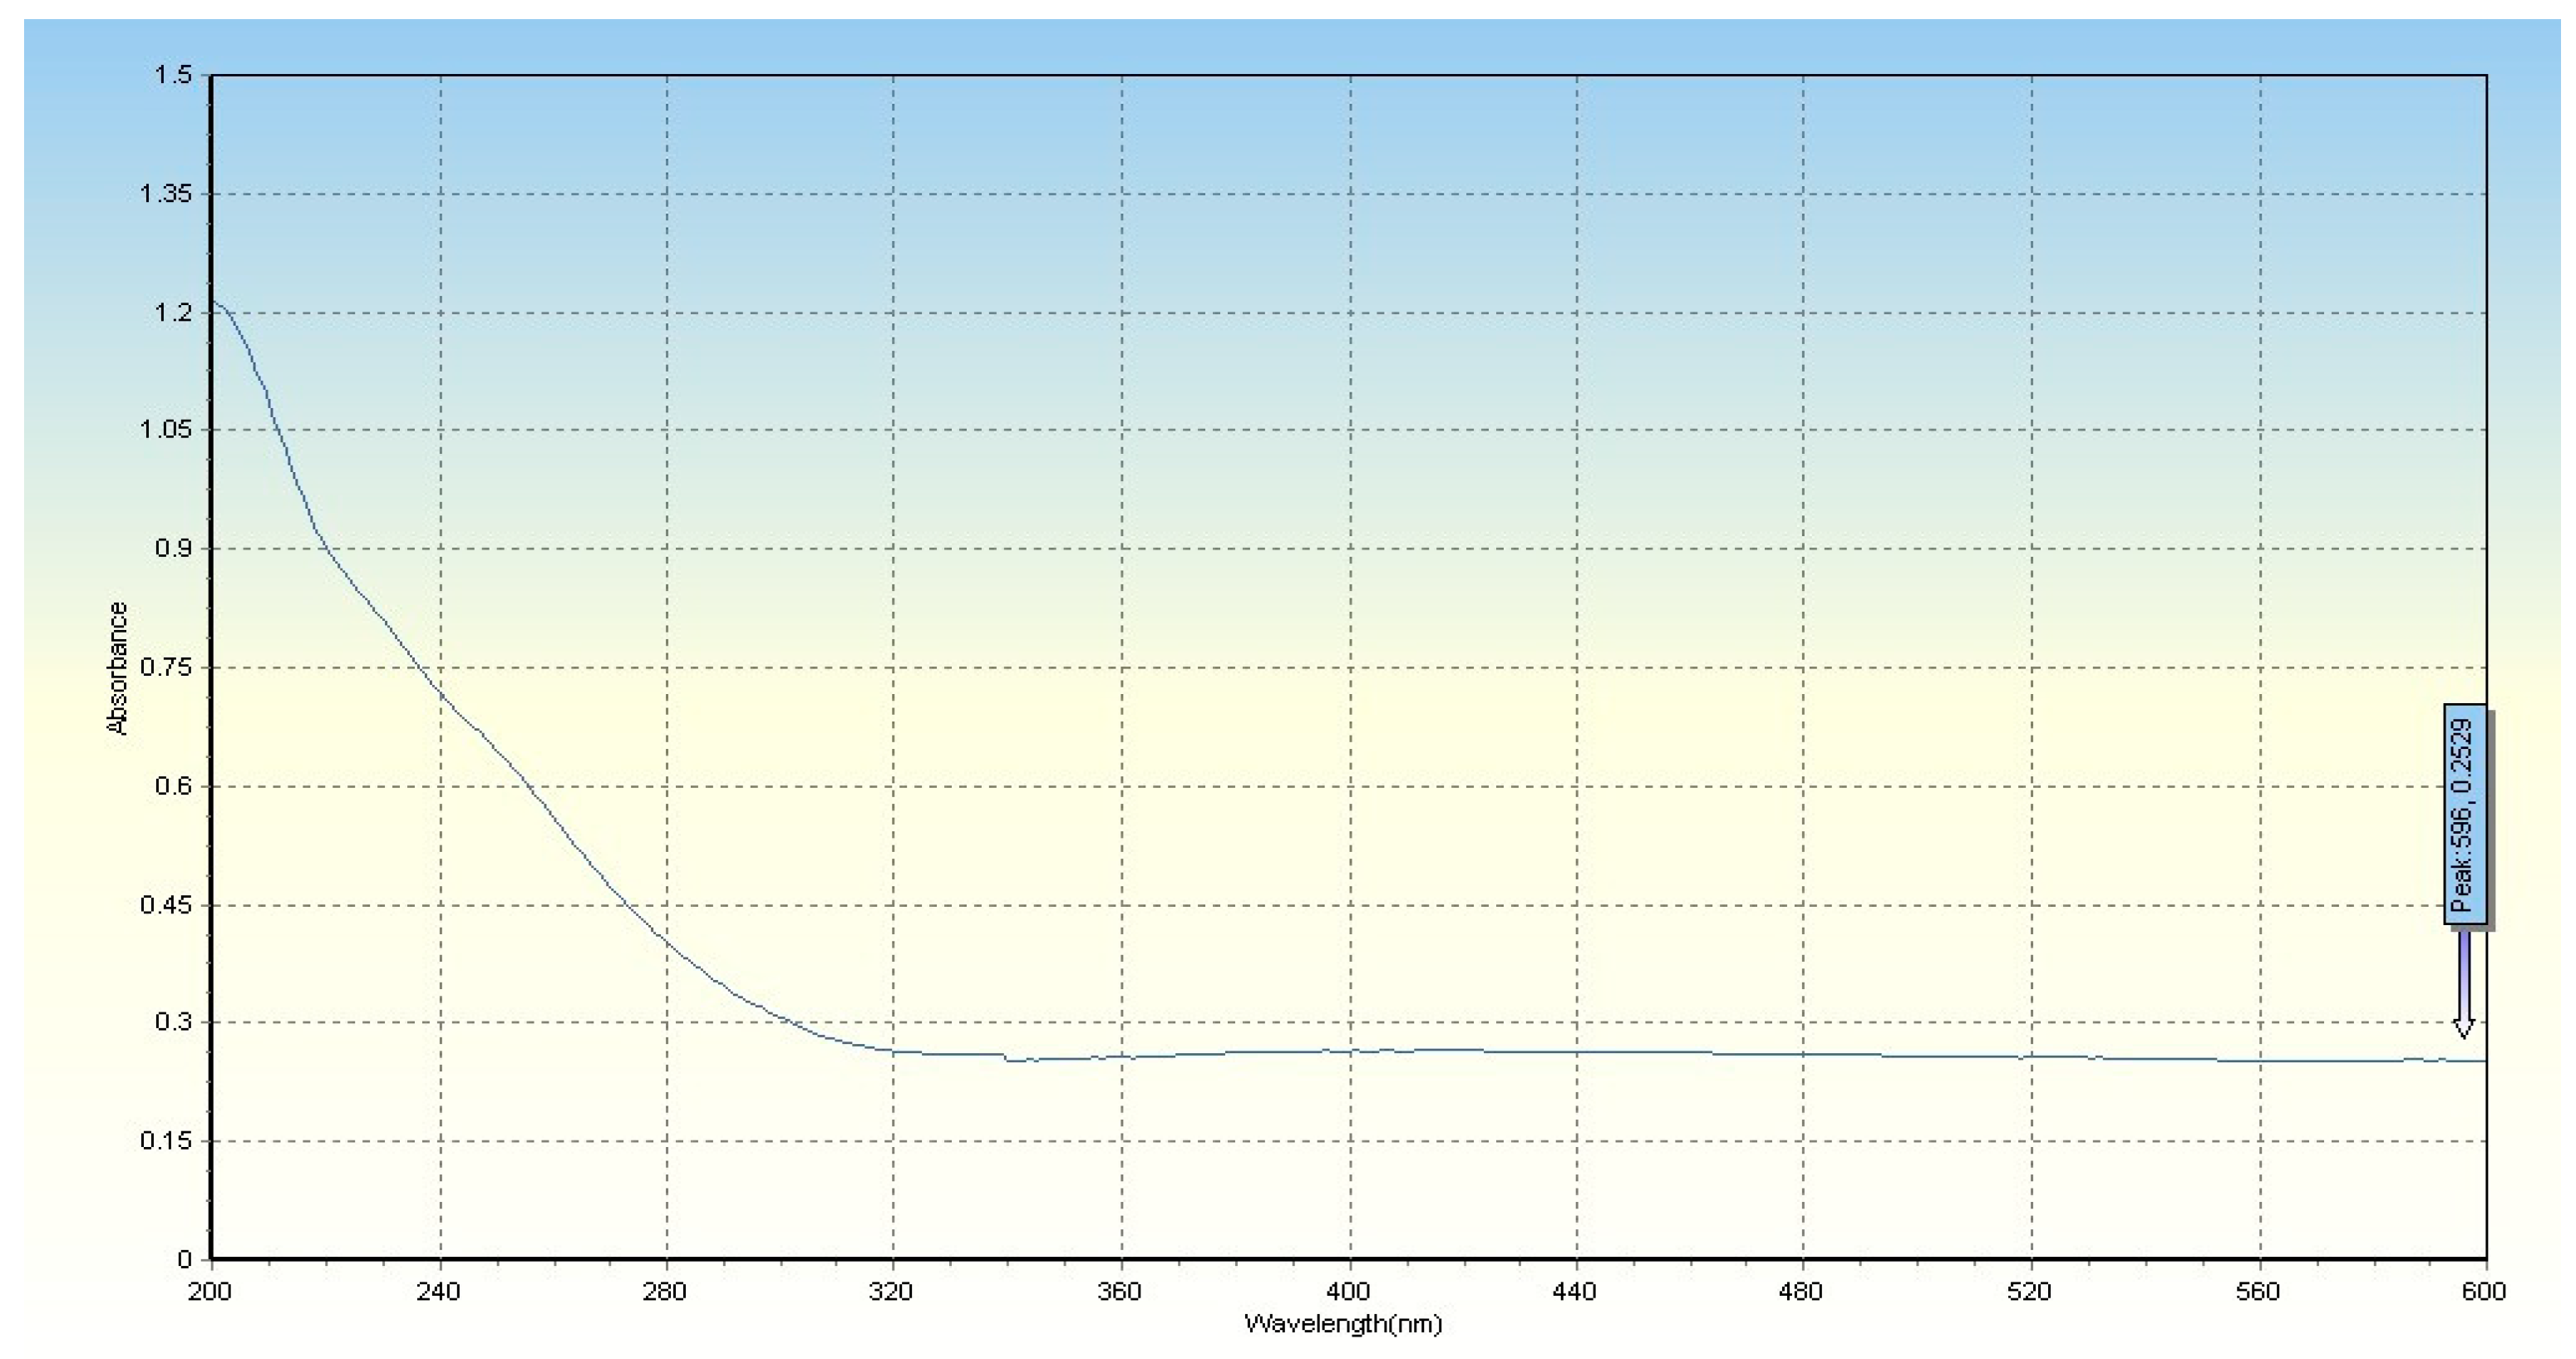
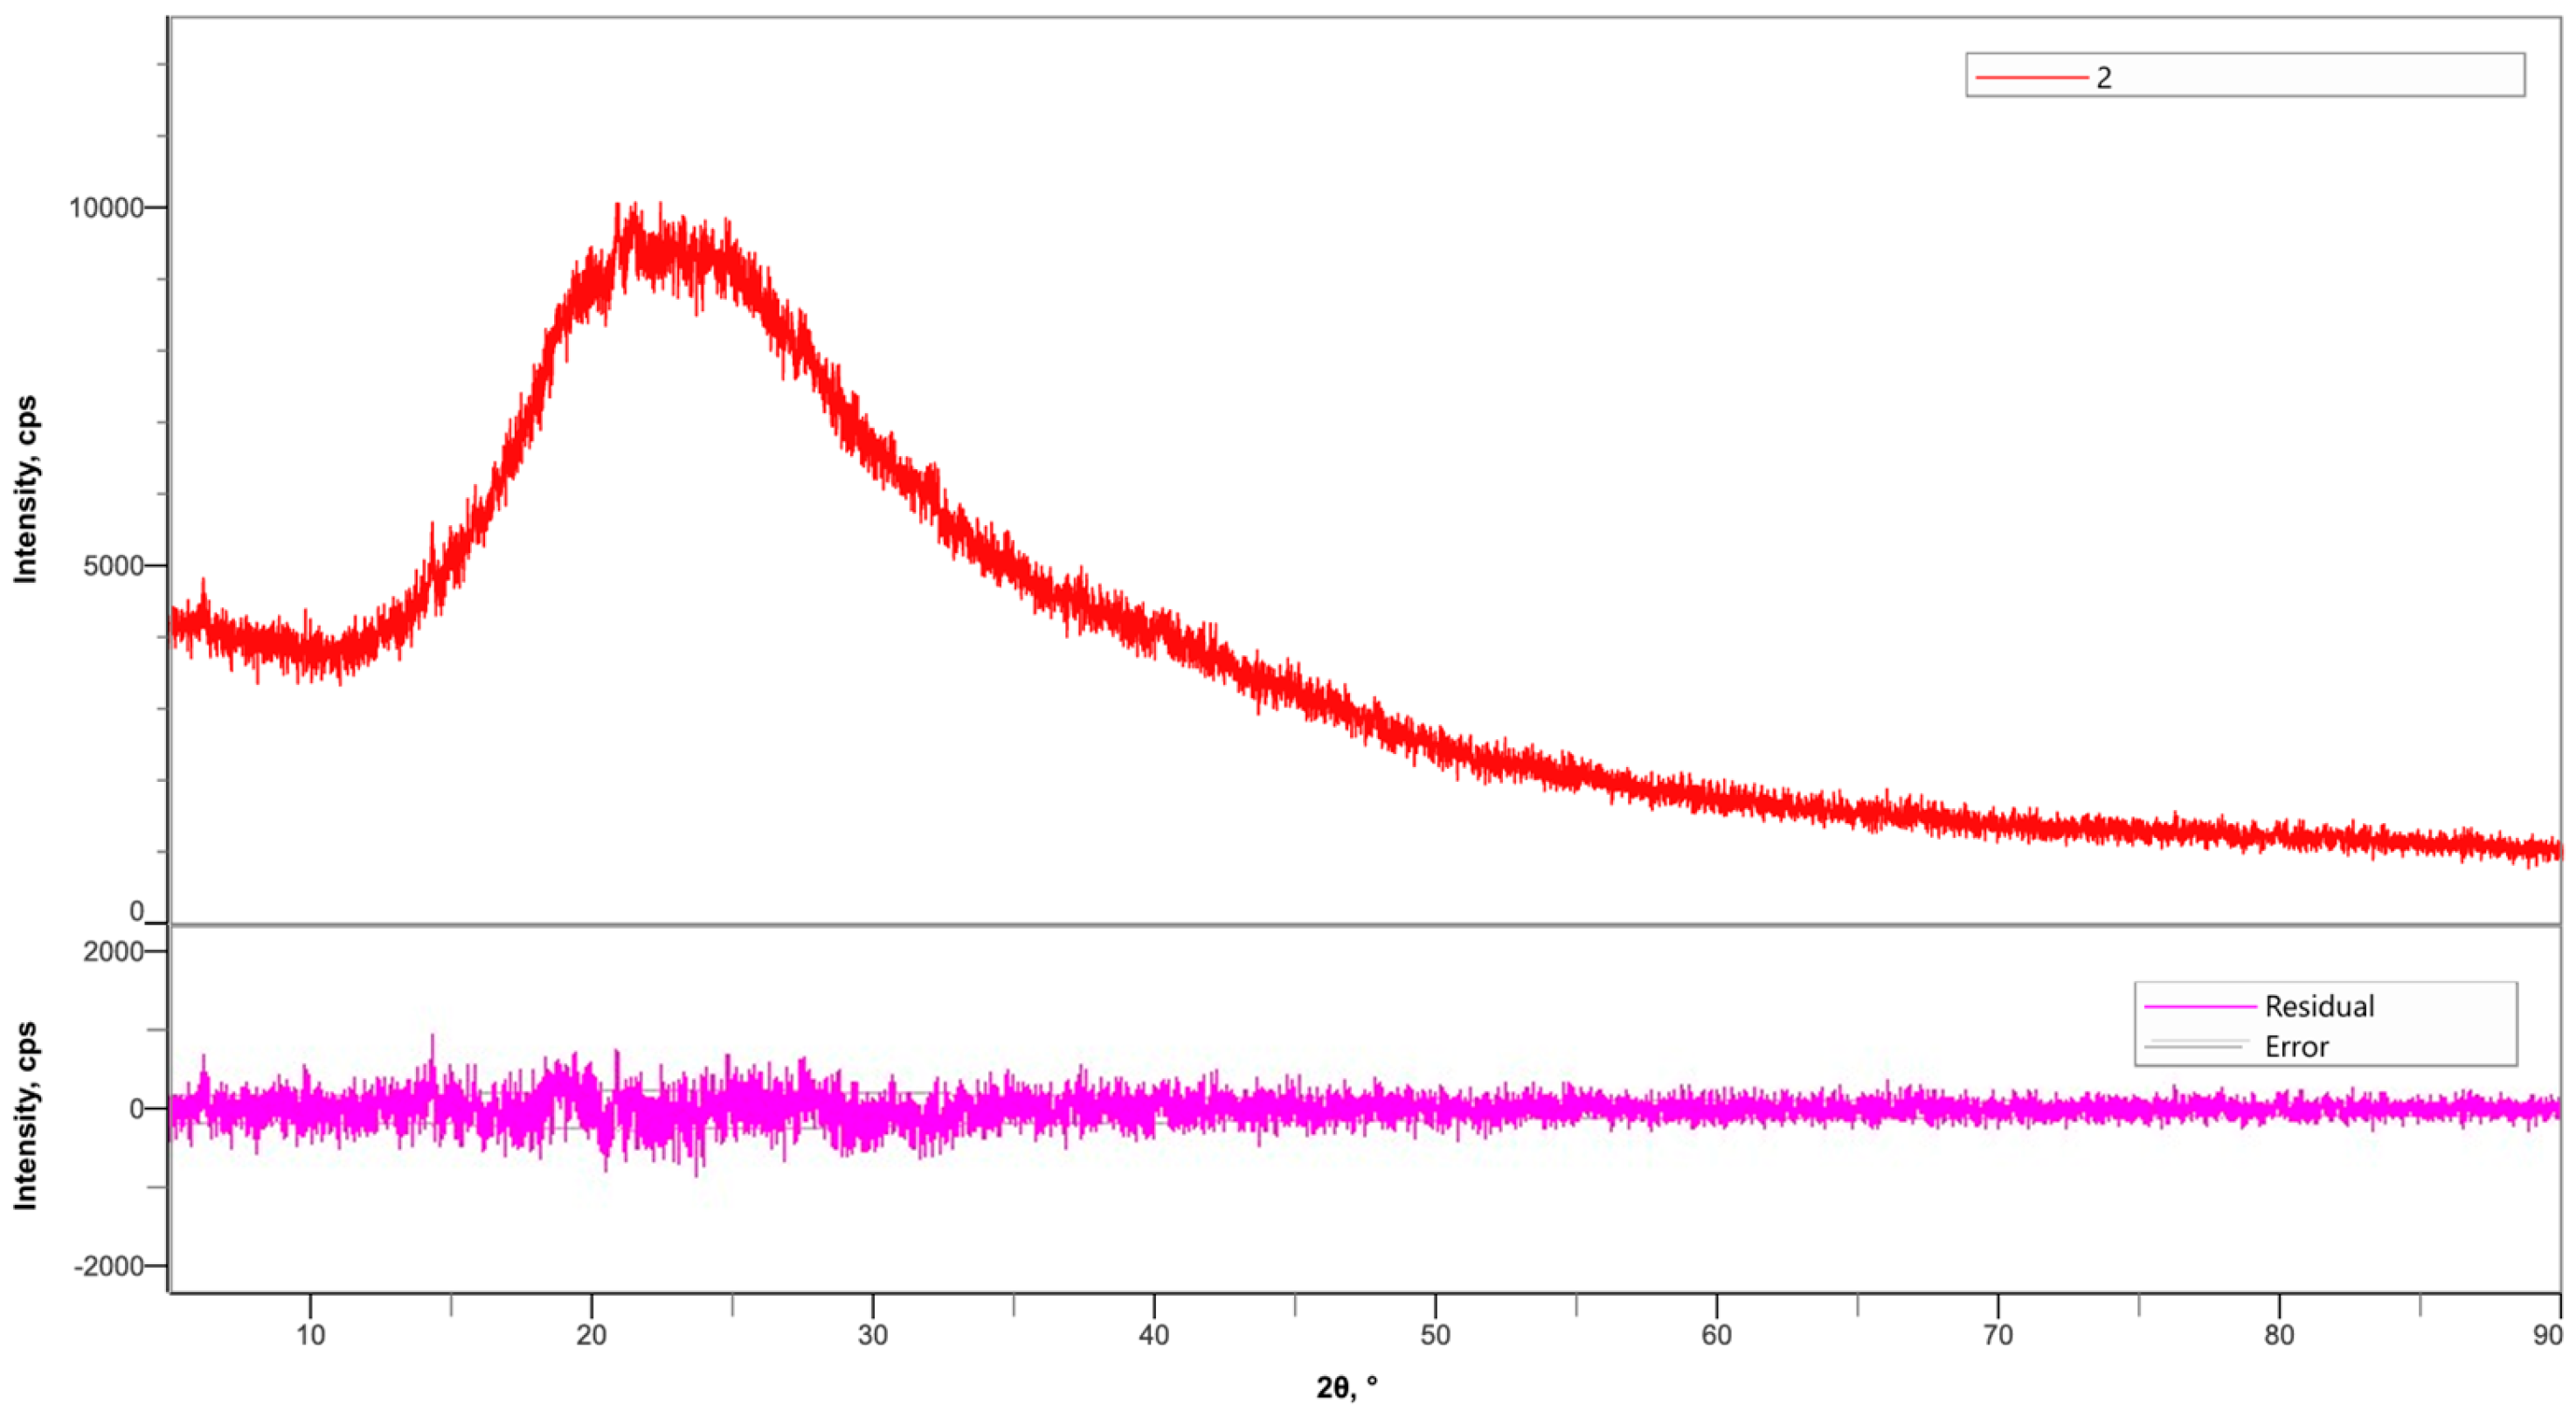
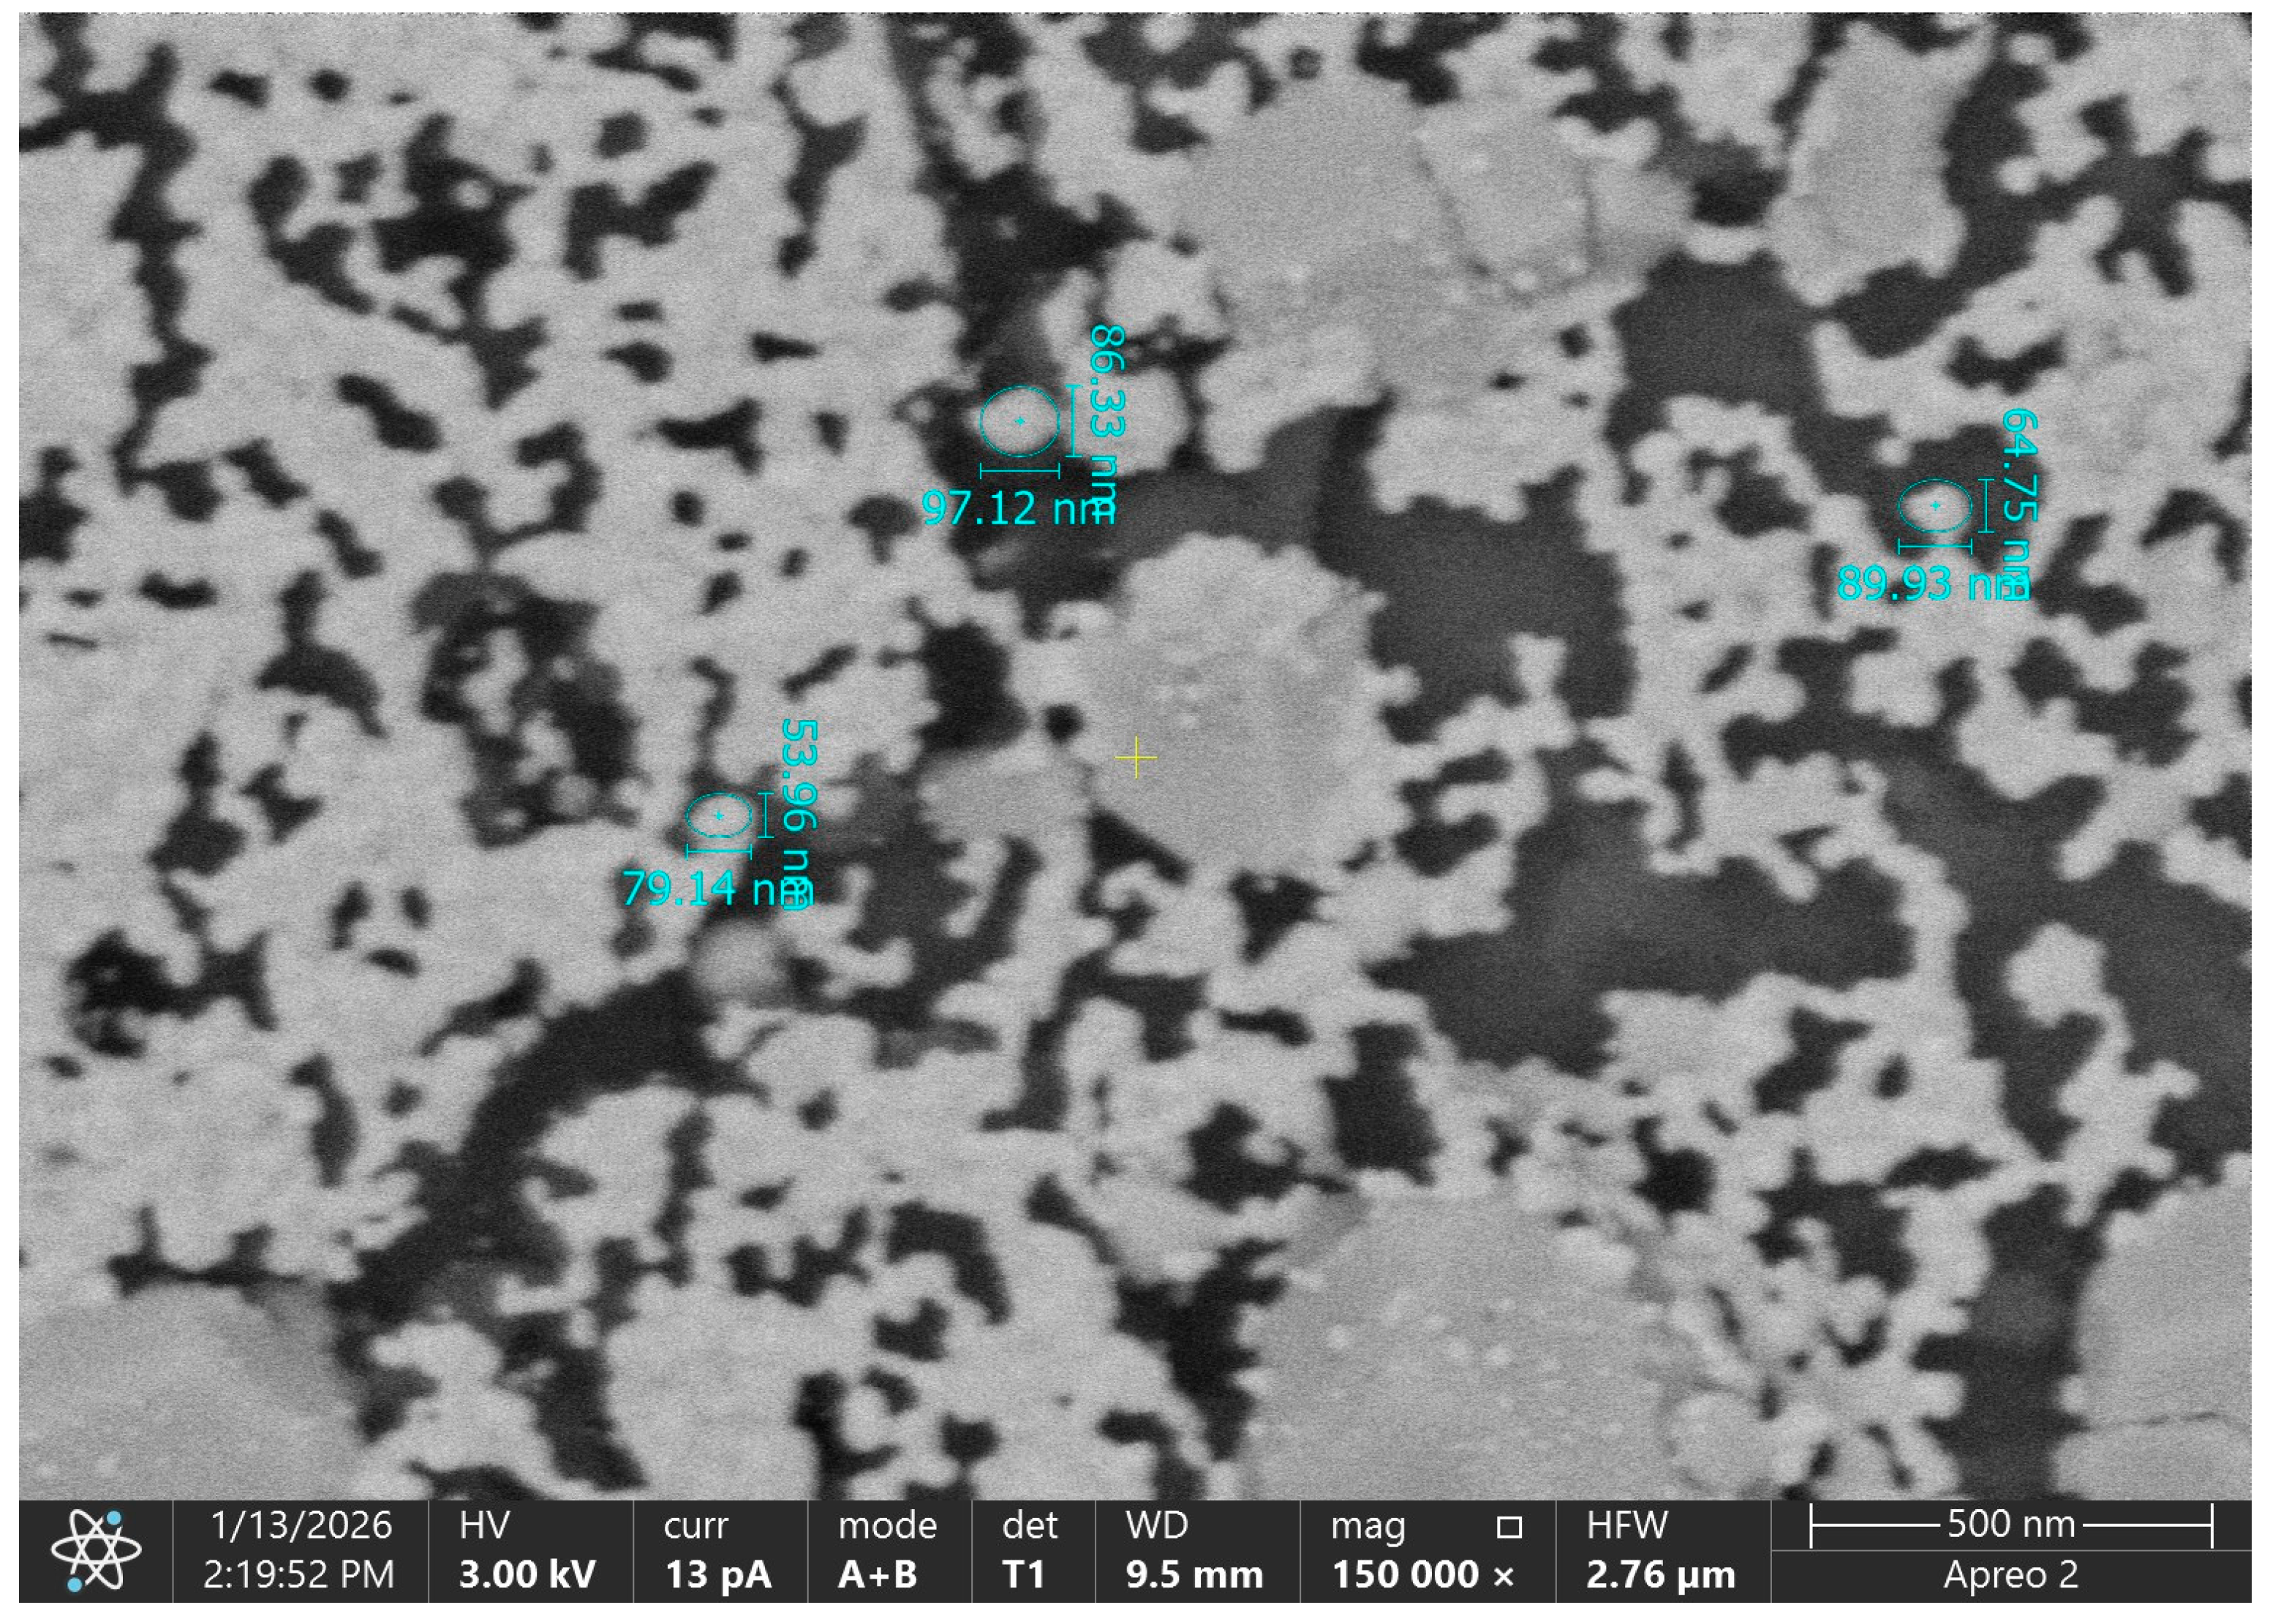
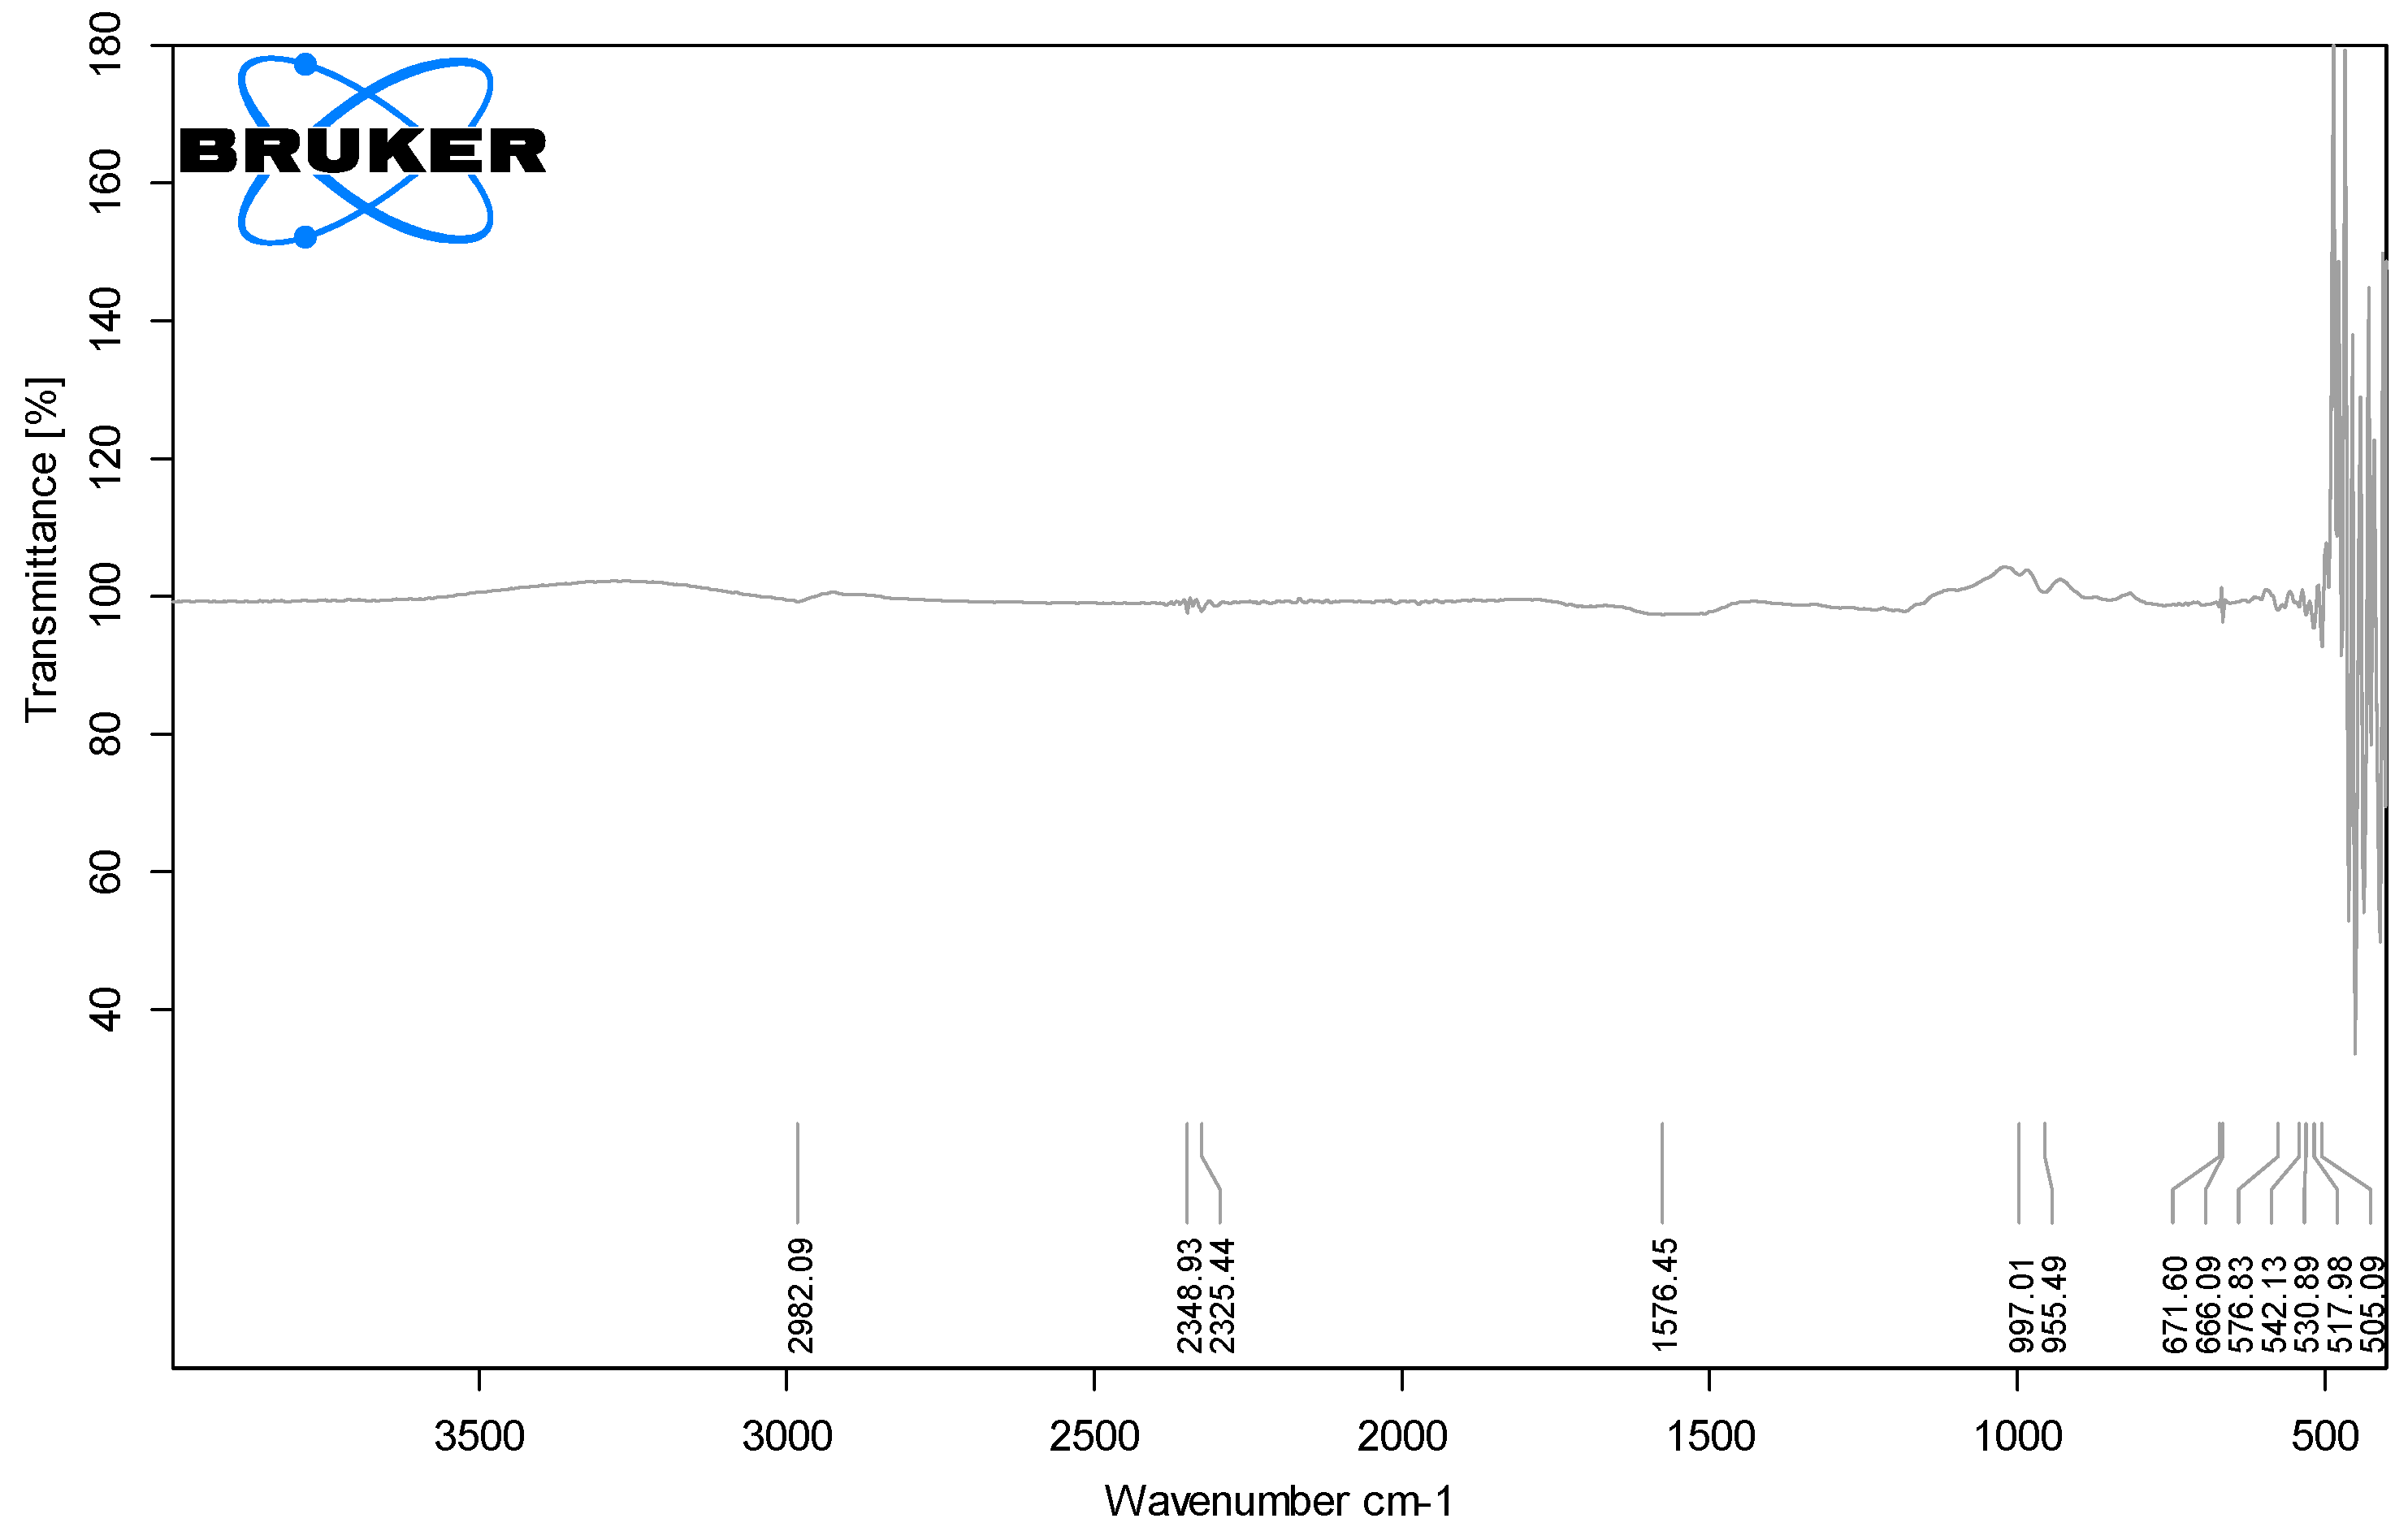
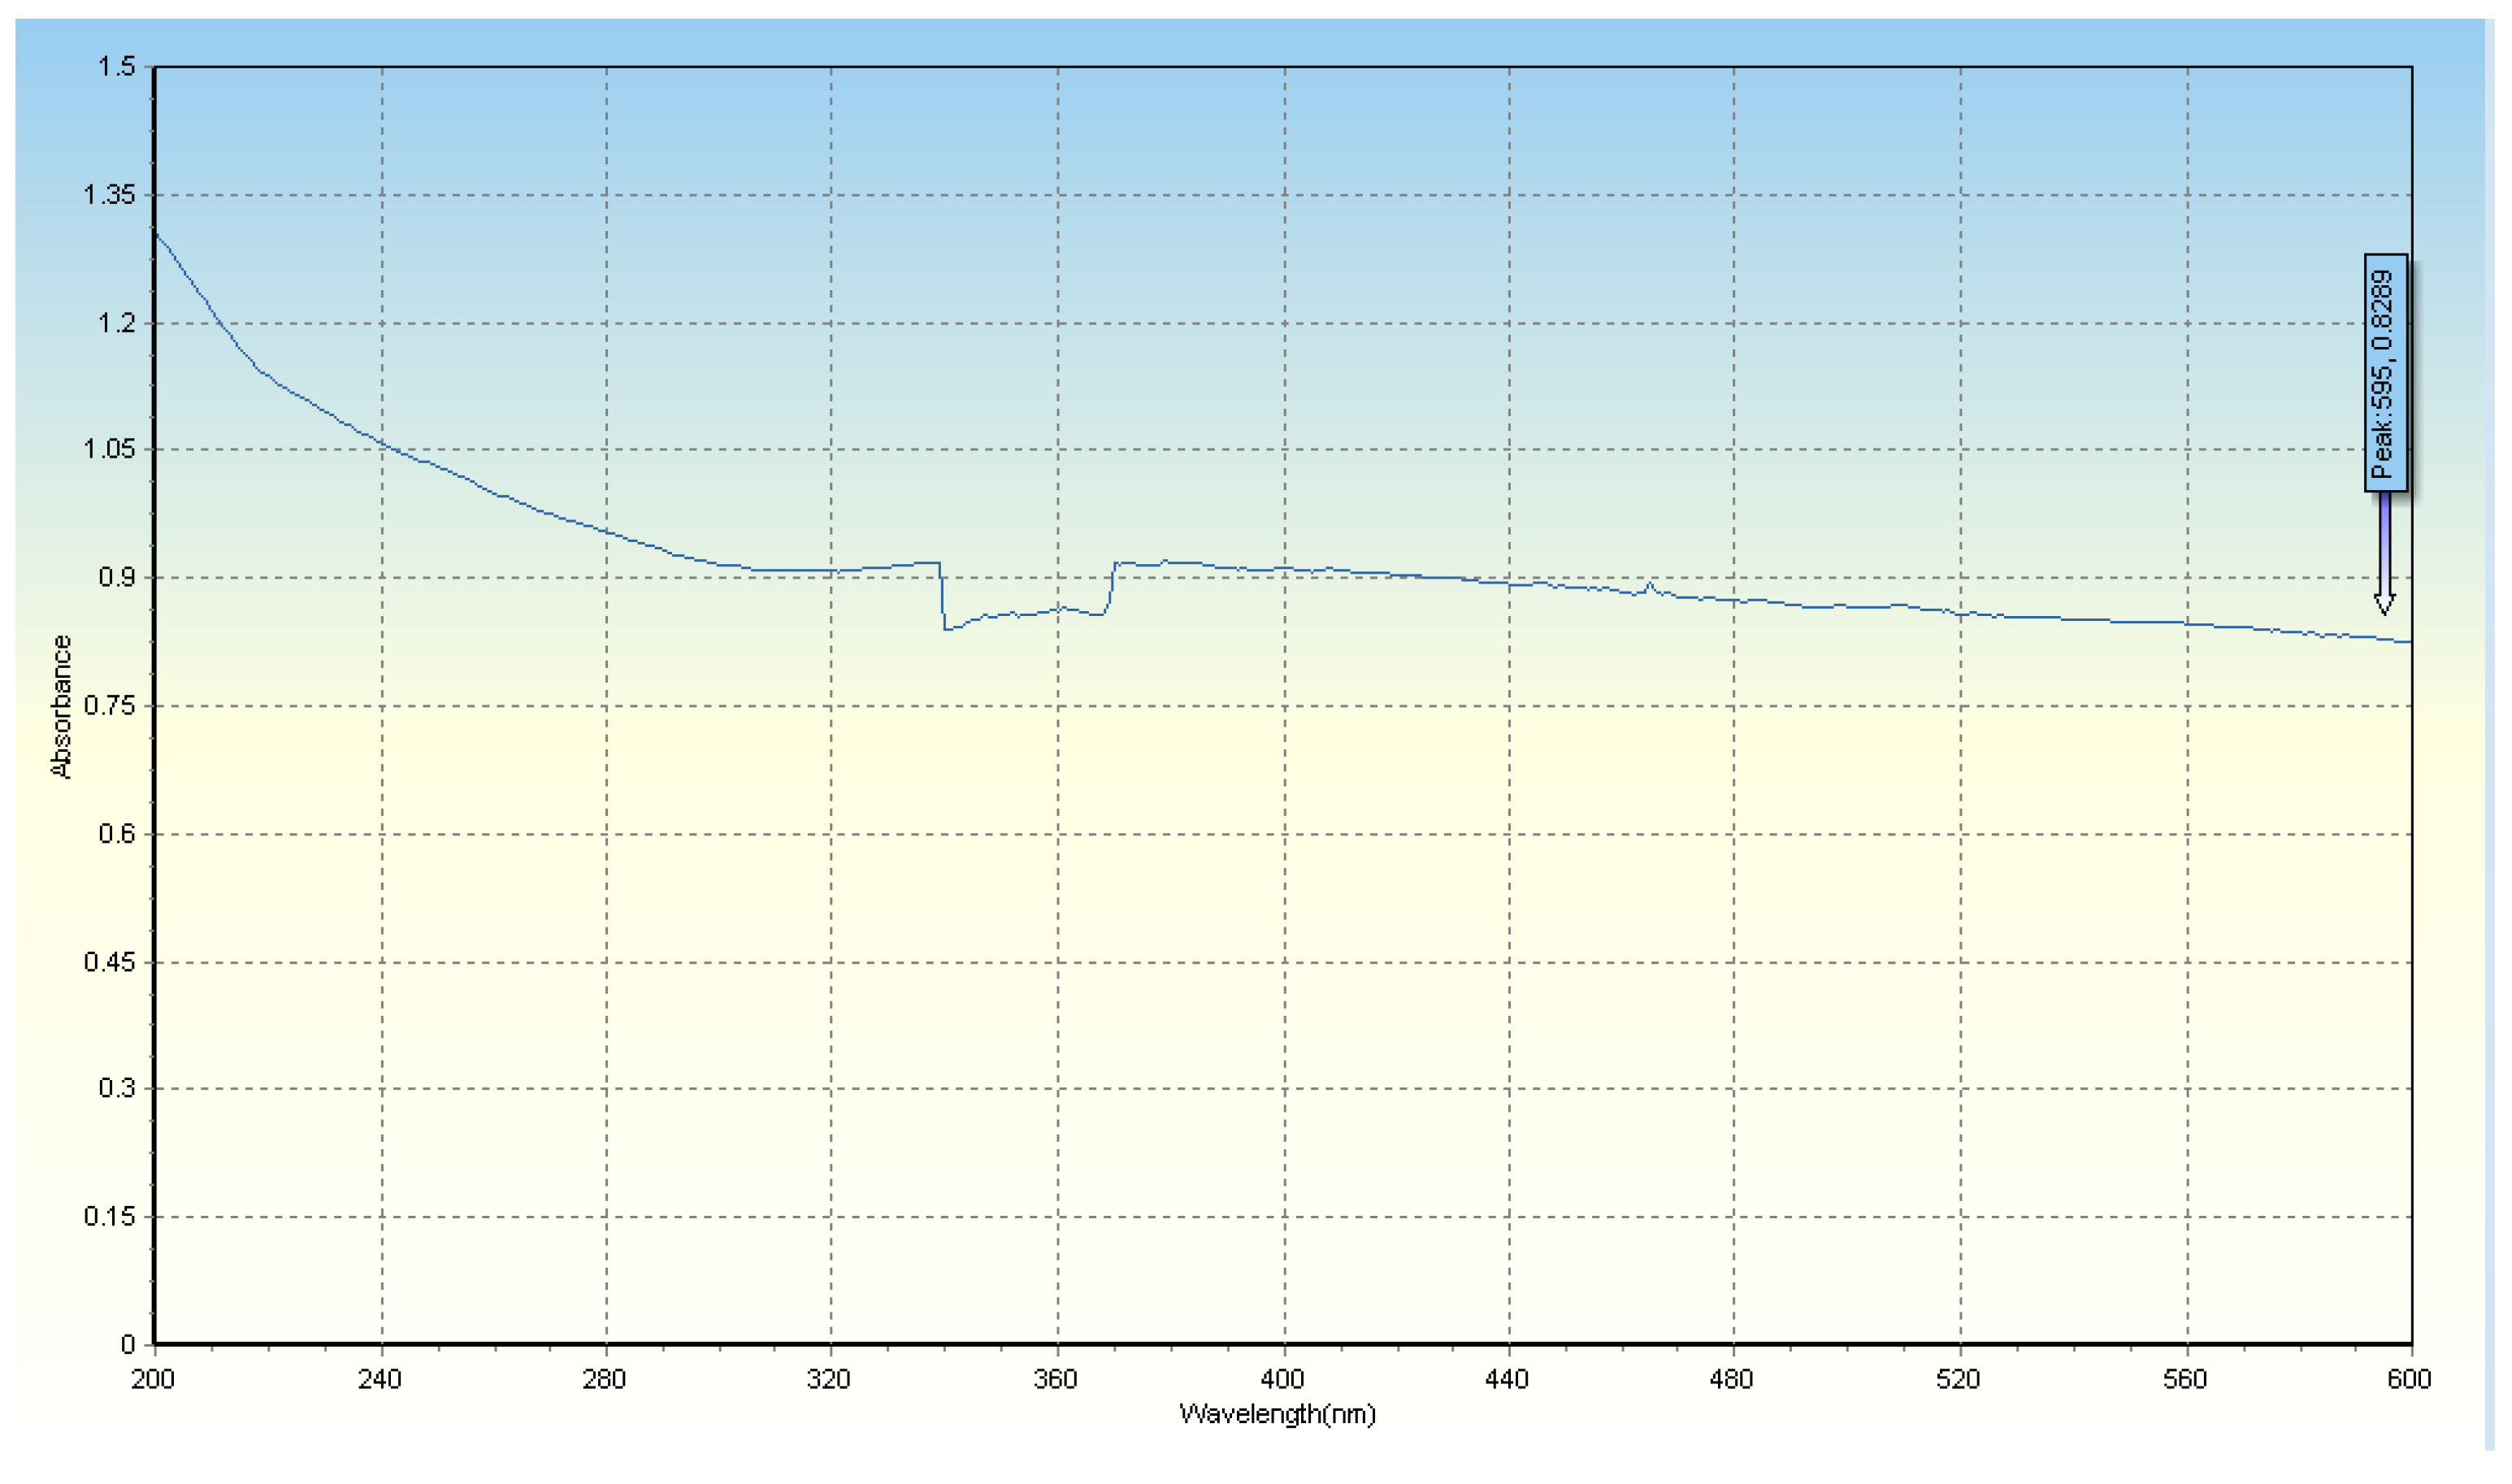
Field Emission Scanning Electron Microscopy (FE-SEM): High-resolution surface morphology of the purified squid eumelanin fine powder and the eumelanin finished on quartz surface were performed using FE-SEM (Zeiss EVO MA18) (Carl Zeiss Microscopy GmbH, Jena, Germany). FE-SEM was performed to visualize fused nanosphere network and internal granular nanostructure. Conductivity was enhanced by placing eumelanin samples on aluminum stubs with the help of carbon tape and sputter-coated with a thin layer of gold. Imaging was done at an accelerating voltage of 3 kV. Size distribution of eumelanin oligomer to nano-finished nanospheres was quantified using digital image analysis of the FE-SEM. Energy-Dispersive X-ray Spectroscopy (EDS): Elemental analysis and purity of the squid eumelanin in its free form and finished form were analysed via EDS using an Oxford EDS detector connected to a JEOL JSM-IT500 SEM. Analysis was aimed at quantifying Carbon (C), Nitrogen (N), and Oxygen (O). The system is also used for confirming C:N ratio of the indole bases scaffold and to confirm that the product is free of Sodium (Na) and Chlorine (Cl) [28,29]. Crystallography (XRD): The amorphous π-stacking nature of the biopolymer was confirmed via XRD (10–80° 2Ɵ) (X-ray diffractometer RINT2500 RIGAKU, Rigaku Corporation, Tokyo, Japan) [30]. Fourier Transform Infrared (FTIR) spectroscopy: Signatures were captured via FTIR (PerkinElmer Spectrum Two, Waltham, MA, USA) using KBr pellets and ATR mode (4000–400 cm−1). The optical properties of the isolates were evaluated at various purification intervals using a Labman LMSP-UV1000B Double Beam Spectrophotometer (Chennai, Tamil Nadu, India). Absorbance profiles were recorded by scanning the 200–600 nm wavelength range, with baseline corrections performed using the corresponding homogenization buffers or extraction solvents as blanks. Stability was evaluated across pH 1–13 by dispersing 150 mg of eumelanin in 10 mL aliquots. Following vortexing (2000 rpm) (Remi Cyclo mixers, Vortex Mixers, Model: CM-101 PLUS, Navi Mumbai, Maharashtra, India) and 30 min equilibration (25 °C), the dissolved fraction was determined gravimetrically by filtering insoluble residues through pre-weighed Whatman No. 1 papers [31].

2.3.3. Phase III: Finishing Formulation on Substrates

Functional nano-coatings were fabricated through the controlled dip-coating of stabilized eumelanin. To refine the coating architecture, a response surface methodology was employed to optimize the formulation based on Eumelanin Concentration (M) and Agitation Speed (N) (Table 6).

2.3.4. Phase IV: Characterization of Finished Eumelanin Coatings

Morphological and Elemental Mapping of finished samples were subjected to FE-SEM, FTIR, XRD, and UV-Vis spectral analysis. Biological shielding efficacy of squid eumelanin finished on quartz film is initially engineered for optical attenuation targeting the Far-UVC window (220 nm) and was evaluated based on microbial challenge assay. Modified microbial challenge assay as described by Lorenzo-Leal et al. (2020) was used to estimate the protective capacity of the films against germicidal ultraviolet exposure [32]. While the biopolymeric matrices were structurally engineered via CCD for peak optical attenuation within the Far-UVC window (220 nm), their practical shielding capacity was validated here against a standard germicidal UV radiation (Ultraviolet Germicidal Irradiation, UVGI) profile (254 nm). Three indicator strains were selected for the challenge: Escherichia coli (ATCC 25922), Staphylococcus aureus (ATCC 25923), and Bacillus subtilis (ATCC 6633).
Bacterial cultures were grown to log phase, harvested via centrifugation, and resus-pended in sterile Phosphate Buffered Saline (PBS, pH 7.4) to achieve a uniform baseline concentration of approximately 2.5 × 10⁶ CFU mL−1. Aliquots (10 mL) of the respective bacterial suspensions were transferred into high-purity quartz Petri dishes (90 mm × 15 mm). The experimental matrix was structured into four distinct evaluation groups:
Group I (Baseline): Uncoated, unexposed quartz dish containing the baseline bacterial suspension.
Group II (Substrate Safety): Eumelanin-coated, unexposed quartz dish to assess any inherent cytotoxicity of the biopolymeric thin-film matrix.
Group III (Active Control): Uncoated, Ultraviolet light exposed quartz dish to verify unattenuated lethal microbial inactivation.
Group IV (Experimental): Eumelanin-coated, Ultraviolet light exposed quartz dish to evaluate physical optical shielding.
Radiation challenge exposure was performed using a 30 W low-pressure mercury germicidal lamp delivering a peak emission wavelength of 254 nm. The quartz dishes were positioned at a fixed perpendicular distance of 1 m directly beneath the radiation source for an exposure duration of 30 min. The incident irradiance flux at the sample plane was verified at 125 µWcm−2 using a calibrated Lutron UV-340A radiometer, culminating in a total cumulative incident UVC fluence of 0.225 J/cm−2. Following exposure, serial dilutions were performed in sterile PBS, and viable cell counts were enumerated via the standard pour-plate method using Nutrient Agar. Plates were incubated for 24 h at 37 °C for E. coli and S. aureus, and at 28 °C for B. subtilis. The lower theoretical limit of detection (LOD) for this plating configuration was strictly defined as 10 CFU mL−1; plates exhibiting zero colony growth were conservatively reported as <10 CFU mL−1. All assays were performed in independent biological triplicates (n = 3). To quantify biological shielding performance, shielding efficiency (SE%) was calculated relative to the coated, unexposed control according to Equation (1).
S E % = C F U   m L 1 ( G r o u p   I V ) C F U   m L 1 ( G r o u p   I I ) × 100
where CFU mL−1 Group IV is eumelanin coated, UV-exposed quartz petri dish (Group IV: Experimental) and CFU mL−1 Group II are Coated, and unexposed quartz petri dish is uncoated (Group II: Substrate safety).

2.3.5. Statistical Design and Optimization

Optimization of recovery and functionalization of the eumelanin were performed sequentially by OFAT and CCD. Operational thresholds and plateau regions of individual processing factors are obtained through preliminary OFAT trials (Stages 1 and 2). Factors displaying significant main effects obtained through OFAT trials are transitioned into separate, robust CCDs for extraction (Stage 3), purification (Stage 4), thermal stabilization (Stage 5), and substrate functionalization (Phase III) to detect interactive phenomena.
All statistical modeling was performed using a second-order polynomial model (Equation (2)) to correlate the independent variables with the experimental responses.
Y = β 0 + i = 1 k β i x i + i = 1 k β i i x i x i + i = 1 k 1 . j = i + 1 k β i j x i x j +
Here, Y represents the process response predicted, β0 is the constant coefficient, βi represents the linear coefficient, βii signifies the quadratic effect, βij denotes the interaction effect, k is the number of studied independent factors, xi, and xj, are coded independent variables, and ε represents the random error.
Experimental design configurations incorporated five level (−α, −1, 0, +α, +1) matrix structures, including factorial points, axial points, and replicated center points to determine the pure experimental errors. JMP® Pro (Version 17; SAS Institute Inc., Cary, NC, USA) was used to obtain Statistical validation and ANOVA. Adequacy of the model was validated through the Fisher’s F-test (p < 0.05), high-determination coefficients (R2), Adjusted R2 (R2 Adj), and a non-significant Lack-of-Fit test (p > 0.05). Reliability of the respective experimental models developed are validated empirically under optimized respective variables.

3. Results

Sequential four-phase experimental models, encompassing extraction optimization, purification optimization, stabilization optimization, and functionalization optimization, were developed to evaluate the efficacy of UV-shielding properties of functionalized Indian squid eumelanin on quartz surface. The developed model correlates empirical data recovered based on molecular principles, ensuring statistical interpretation of the structural integrity and optical precision at four stages of eumelanin extraction, purification, stabilization, and functionalization.

3.1. Physical Yield and Extraction Efficiency

Biochemical characterization of the ink isolated from the ink sac of U. duvaucelii revealed constituents as presented in the Table 7.
Quantitative analysis establishes that the raw ink of U. duvaucelii is predominantly composed of moisture (76.00 ± 3.49%). A significant eumelanin concentration of 12.10 ± 0.57% was identified within the liquid ink, which corresponds to a biomass-scale distribution of 121.00 ± 5.69 g kg−1 of whole squid mass, resulting in a refined final processed calculated yield of 7.03 ± 0.88 g kg−1.
The macromolecular fraction is further composed of proteins (5.80 ± 0.21%, representing 58.00 ± 2.09 g kg−1 of whole squid) and free amino acids (1.00 ± 0.044%, representing 10.00 ± 0.44 g kg−1 of whole squid). Additionally, the ink matrix contains measurable quantities of carbohydrates (3.00 ± 0.11%, representing 30.00 ± 1.14 g kg−1 of whole squid) and lipids (1.10 ± 0.05%, representing 11.00 ± 0.51g kg−1 of whole squid). The inorganic profile is characterized by ash and trace elements, each contributing 0.50% (5.00 ± 0.19 g kg−1 and 5.00 ± 0.20 g kg−1 of total biomass, respectively).
The presence of these co-extracted proteins and lipids necessitates a robust purification strategy, as such biomolecular impurities can significantly impede the interfacial assembly and uniformity of functional nano-coatings. These profiling results align with established benchmarks for other cephalopod species, confirming the Indian squid as one of the sources for high-purity eumelanin. These findings align with the reported values for other cephalopod species [33,34], confirming Indian squid as a reliable source for high-purity eumelanin.

3.2. Process Yields of Indian Squid Eumelanin

The recovery from U. duvaucelii demonstrates significant potential for industrial-scale biopolymer valorization. The anatomically isolated ink sac constitutes 1.91 ± 0.05% of the total body mass, corresponding to a quantity of 19.10 ± 0.57 g kg−1 of the whole squid. The surgical ink sac of the Indian squid yielded 12.20 ± 0.12 g kg−1 of raw ink, representing 1.22 ± 0.01% of the whole-body mass, with step efficiency of 63.87 ± 0.17%. For experimental purposes, 2.5 mL of the ink sac with a density of 1.27 ± 0.01 g cm−1, weighing 3.175 ± 0.12 g kg−1, were used for the chloroform–methanol extraction resulted in 2.88 ± 0.11 g kg−1 dry crude ink powder representing 0.80 ± 0.01% of the total body mass. Purification of crude ink yielded dry ink powder of 1.45 ± 0.06 g kg−1 dry pure ink, with the yield of 0.56 ± 0.01% of the total body mass. Overall a process yield of 0.56 ± 0.01% of functional-grade eumelanin is a highly concentrated purified fraction of total body mass [35].

3.3. Framework for Phase-Separation Recovery

To resolve eumelanin from various other complex biochemical impurities of the raw squid ink, based on the principles of Bligh and Dyer, a differential solvent extraction method was employed [19]. Then, the biphasic eumelanin was selectively sequestered between the biphasic liquid interphase by exploiting degree of solubility of various components of squid ink through initial homogenization method followed by phase separation method.
However, partial co-precipitation of the protein impurities was inevitable. Hence, optimization of ionic environment during homogenization using 0.98% NaCl at pH 7.0 is critical for solubilizing protein impurities to suspend it in the upper aqueous phase and stabilizing z-potential of the melanin particles to prevent premature aggregation during initial homogenization phase [36]. Pulsed ultrasonication at 40 kHz at a maintained temperature of 4 °C assisted efficiently disrupts the melanoprotein complexes with negligible thermal degradation of eumelanin [37].
Subsequent addition of the chloroform secondary emulsification cycle resulted in a high-surface-area environment, facilitating mass transfer based on the multifactor compatibility of constituents of the ink with each phase. Further centrifugal force and time-assisted phase separation facilitate sequestering of lipid fractions into a lower organic-rich phase, as well as soluble saccharides and proteins into an upper aqueous–methanol phase. Eumelanin was chemically robust and insoluble in most of the solvents, except at alkaline pH, and strategically concentrated between interphase of the biphasic system [38]. Optimizing extraction conditions during homogenization and phase separation is crucial in preventing coprecipitation of protein impurities with eumelanin and optimum isolation of other constitutes of ink from eumelanin.

3.4. Phase I: Preliminary Optimization of Eumelanin Recovery

Recovery process optimization involving systematic OFAT, encompassing Stages 1 and 2, is adopted during the initial phase utilizing a modified Bligh and Dyer chloroform:methanol:water solvent-extraction system [19]. Every factor optimized during OFAT screening is adopted to design a robust CCD model encompassing Stages 3, 4, and 5. A carefully designed experimental setup from Stage 1 to 5 was established during Phase 1 by adopting optimized factors sequentially based on multifactor significant effects on purity and yields, which paves the way for an optimized recovery process of the eumelanin.

3.4.1. Stage 1: Optimization of Phase Separation

  • Effect of Relative Centrifugal Force (RCF) on Phase Partitioning
The relationship between RCF thresholds, eumelanin recovery efficiency, and phase purity is quantitatively evaluated in Table 8. The optimization of RCF is critical for resolving the complex micro-emulsions generated during ultrasonication-assisted homogenization. One-way Analysis of Variance (ANOVA) with subsequent Tukey’s HSD post-hoc analysis confirmed that centrifugal intensity significantly governed the redistribution of proteins and eumelanin across the biphasic chloroform:methanol:water system (p < 0.001).
Linear regression analysis of the initial acceleration phase (89 to 3220× g) revealed a strong negative correlation, where coefficient of determination (R2) is 0.931 and a probability value (p) of less than <0.05 is found between RCF and protein content of the aqueous. At the minimum force of 89× g, the upper phase retained 44.47 ± 2.09 mg g−1 (Group, a) of protein (76.67% recovery), indicating insufficient force to overcome the interfacial tension and Stokes’ drag of the suspended particles [39].
Protein content in the upper methanol–aqueous layer dropped significantly as the RCF increased from 89× g to 3220× g, attaining a major clarification critical point between 3220× g (27.84 ± 1.03 mg g−1, Group d) and 4383× g (4.18 ± 0.16 mg g−1, Group e). At RCF of 8944× g, near-total clarification of upper phase was attained reaching a protein level of 0.70 ± 0.03 mg g−1 (Group g). Even though majority of the protein impurities co-precipitated with eumelanin with an increase in RCF, higher content than the RCF was reported earlier in established methodologies for lipid extraction (1000–1200× g), which is essential for disrupting stable micro-emulsion formed during ultrasonication [19,23,40].
Recovery of carbohydrates remained statistically stable (p > 0.05) from 89× g to 8944× g at 20.13–24.00 mg g−1 (R2 = 0.354, Group, a), as saccharides are consistently soluble independent of centrifugal force and time [41]. Lipid recovery in the lower organic phase exhibited a strong positive linear relationship (R2 = 0.908, p < 0.05), peaking at 10.82 ± 0.40 mg g−1 (Group a) and at 3220× g, and remaining statistically stable up to 8944× g (10.87 ± 0.49 mg g−1, Group a) [42].
The gravimetric yield of eumelanin demonstrated a highly significant positive correlation with RCF (R2 = 0.902, p < 0.05), rising from 238.19 ± 11.19 mg 2.5 g−1 (Group f) at 89× g to a statistical plateau starting at 7245× g (371.11 ± 17.44 mg 2.5 g−1, Group a). Although numerical yields increased slightly up to 8944× g (371.50 ± 16.72 mg 2.5 g−1, Group a), the differences remained statistically insignificant (p > 0.05), aligning with recovery trends reported for cephalopod ink processing [43,44].
The interphase OD220 (raising from 0.122 ± 0.006, Group h, to 0.851 ± 0.038, Group a), reflecting the eumelanin backbone, mirrored this trend (R2 = 0.978), while the corrected OD280 (OD280–OD340) (0.375 ± 0.006, Group g, to 1.022 ± 0.038, Group a) validated the simultaneous migration of protein impurities into the interphase layer [45]. Since eumelanin’s density (1.27 g cm−3) is marginally lower than chloroform used in the study (1.50 g cm−3 at 4 °C), it preferentially accumulates at the interphase due to its lower density and unique aggregation properties, rather than simple buoyancy [46]. Consequently, 3220× g was identified as the optimal threshold for the phase-separation equilibrium for subsequent CCD optimization, as it recovered 96.7% of the maximum potential yield while maintaining energy efficiency [47].
  • Effect of Centrifugation Duration on Phase-Separation Kinetics
Experimental data evaluating the impact of centrifugation duration on eumelanin yield and aqueous phase clarity are presented in Table 9. At a fixed RCF of 3220× g, the temporal duration of centrifugation emerged as a critical factor in achieving thermodynamic equilibrium between the immiscible phases. One-way ANOVA confirmed that centrifugation time significantly governed all recovery parameters (F9,20 = 84.12, p < 0.001). A strong negative linear relationship (R2 = 0.938, p < 0.05) was observed between centrifugation time and residual protein levels in the aqueous upper phase, indicating a time-dependent migration of denatured proteins toward the interphase.
During the initial 1–13 min, incomplete separation was observed, likely due to the time required for precipitated particles and aggregated proteolipids to migrate through the solvent medium [40]. This was characterized by a cloudy, emulsified interface and lower eumelanin recovery (99.89 ± 4.70 mg 2.5 g−1 at 1 min, Group i). However, Tukey’s HSD post-hoc analysis revealed that protein levels reached a statistical limit at 15 min (28.42 ± 1.36 mg g−1; Group e). Increasing the duration of exposure to centrifugal force at 3220× g for 15 min or even up to 19 min did not change much (p > 0.05) in the protein content, placing these intervals in the Group e. This plateau reveals that protein impurities co-precipitated with product of interest eumelanin into Inter phase by overcoming the viscous drag of the centrifugal system beyond 15 min of centrifugation at 3220× g [48].
Robust linear correlation existed between the centrifugation time and the gravimetric yield of eumelanin (R2 = 0.963) up to 15 min of centrifugation, beyond which the statistical plateau was registered. Gravimetric yield of eumelanin at 15 min of centrifugation at RCF of 3220× g was 368.81 ± 17.70 mg 2.5 g−1 (Group b). As established by Tukey’s grouping, the yield at 17 and 19 min was Group a, and statistically equivalent (p > 0.05). These findings well align with the principles of differential centrifugation, as once the buoyant density difference is fully obstinate, the separation of each component of the squid ink reached equilibrium [49]. A similar trend is registered in the lower organic-rich phase where lipid contents of the ink stabilized at 10.99 ± 0.53 mg 2.5 g−1 (Group a) by 15 min (R2 = 0.852, p < 0.001) of centrifugation at 3220× g, aligning with rapid isolation kinetics in the Bligh and Dyer method [19,50].
The optical properties of the interphase further validated these findings. The interphase OD220 reached 0.854 ± 0.041 (Group b), serving as a characteristic marker for eumelanin, and the corrected OD280 reached 0.833 ± 0.035 (Group b) (indicative of co-precipitated proteins), while both reached a plateau at 15 min. The corrected OD280 (OD280–OD340) effectively isolated the aromatic signal from the light-scattering background caused by aggregated solids, providing a clear proxy for extraction quality [51]. Conversely, carbohydrate recovery remained unaffected by time (p = 0.46, Group a), confirming the total solubility of aqueous-phase saccharides [41]. Ultimately, 15 min was identified as the optimal temporal center point for subsequent CCD optimization, balancing maximal biopolymer recovery with processing efficiency.

3.4.2. Stage 2: Optimization of Homogenization Through OFAT

  • Effect of Extraction Solvent pH on Biomolecular Partitioning
Table 10 details the relationship between extractant pH, the partitioning of ink-derived biopolymers, and the associated interphase optical density.
The pH of the polar phase acted as the primary driver for selective partitioning, governing the protonation state and solubility of the multifunctional ink matrix [52,53]. Corrected absorbance at 280 nm was utilized to track the aromatic profile of the interphase while eliminating optical interference from light scattering caused by aggregated protein precipitates [51]. This metric reached its maximum at pH 1 (0.783 ± 0.025, Group a), which directly correlates with the isoelectric precipitation of cephalopod ink proteins. At this acidic extreme, proteins reach their isoelectric point (pI), resulting in minimum solubility and subsequent co-precipitation with the eumelanin backbone. This leads to the interfacial entrapment of the biopolymer at the liquid–liquid junction [54].
Conversely, OD220 served as the primary indicator for the eumelanin backbone. Eumelanin recovery remained statistically optimized (Group a) between pH 3 and 7, where the interphase OD220 reached a plateau (0.854–0.863). The regression model reveals a robust inverse relationship between pH of the polar phase and gravimetric yield of eumelanin (R2 = 0.91, p < 0.01), indicating that while the pigment is stable under acidic-to-neutral conditions, it undergoes extensive deprotonation in alkaline media. At pH 13.00, both optical markers and gravimetric yield (15.37 ± 0.61 mg 2.5 g−1) plummeted. This confirms the total solubilization of the eumelanin backbone, leading to its loss from the interphase into the supernatant [55,56].
Analysis of the upper phase confirmed that residual protein levels were lowest at pH 1 (24.36 ± 1.18 mg g−1, Group e) due to maximum precipitation, but they increased significantly in alkaline conditions (53.75 ± 1.83 mg g−1 at pH 13, Group a) as proteins became more soluble due to the ionization of amino acid side chains [54]. Lipid and carbohydrate partitioning remained statistically unaffected (p > 0.05, Group a) by pH shifts, as shown by the shared “a” superscripts in Table 10, underscoring the robustness of the biphasic solvent system [19,57]. Ultimately, pH 7 was identified as the optimal center point; it provided the absolute maximum eumelanin yield (372.61 ± 12.30 mg 2.5 g−1, Group a) while significantly reducing the co-precipitated protein load compared to the acidic range, balancing high recovery with superior interfacial purity.
  • Effect of Extraction Solvent ionic strength on Biomolecular Partitioning
Table 11 evaluates the relationship between ionic strength, phase-partitioning efficiency, and the optical properties of the eumelanin-rich interphase.
The influence of ionic strength, modulated by NaCl concentration in aqueous phase of the extraction system (0.21% to 3.21%), was evaluated to optimize the differential partitioning of ink constituents across the chloroform:methanol:water system. Electrolytes like NaCl alter the dielectric properties of the aqueous phase reduce the mutual solubility of polar and non-polar solvents, thereby driving solute redistribution [58,59]. One-way ANOVA confirmed that ionic strength significantly governed both protein solubility and the gravimetric accumulation of eumelanin at the interphase (p < 0.001).
The increase in the NaCl concentration in the aqueous medium resulted in a robust characteristic negative linear relationship (R2 = 0.982) between NaCl concentration and residual protein concentration in the aqueous medium. Here, as the concentration of NaCl increased from 0.21% to 3.21%, the protein content in the aqueous phase plummeted from 52.65 ± 1.58 mg g−1 (Group a) to 13.23 ± 0.47 mg g−1 (Group h), respectively. The partition coefficient (Kp) was calculated by considering ratio of concentration of solute in the upper polar phase relative to the intermediate insoluble phase, which validated this phase shift [60]. Total coprecipitation of protein along with eumelanin into the interphase is indicated by drop of Kp from 10.37 to 0.32 as the salt concentration exceeded 1.07%. These findings are consistent with the principles of the “salting-out” effect due to competition for water molecules by salt ions, which disrupts the hydration shells of the protein, resulting in aggregation [61,62].
The study identified that a concentration of NaCl at 1.07% in the aqueous phase is the critical optimum, as at this ionic strength gravimetric yield of eumelanin reached a statistical plateau of 379.69 ± 4.10 mg 2.5 g−1 (Group abc) and optical absorbance of 0.897 ± 0.03 (Group a) in the interphase, reaching a near-complete recovery of the eumelanin backbone (98.83 ± 2.99%). These findings are supported by the attainment of negligible absorbance of the supernatant at OD220, confirming nearly all partitioning of eumelanin into the interphase [63].
First, 1.07% NaCl facilitated minimal salt-induced protein aggregation and coprecipitation of the protein (Group c) impurities, ensuring maximum eumelanin recovery, while higher salt levels up to 3.21% continued to accelerate salt-induced protein aggregation and coprecipitation of the protein (Group h), raising the corrected OD280 to 0.62 ± 0.04 (Group a). Regression analysis supported these observations, showing that eumelanin yield followed a strong linear relationship (R2 = 0.95, p = 0.05) up to this distinct recovery plateau. Lipid recovery also exhibited a strong linear correlation with ionic strength (R2 = 0.98), peaking at 10.78 ± 2.00 mg g−1, which underscores the role of salt in enhancing phase clarity and breaking micro-emulsions [19]. Selecting 1.07% NaCl minimizes the excessive co-precipitation of salt-induced protein aggregates (Group c for protein reduction) while ensuring that 98.83 ± 2.99% of the pigment recovery is already achieved. Consequently, 1.07% NaCl was selected as the ideal center point for further optimization.
  • Effect of exposure to ultrasound on Biomolecular Partitioning
The relationship between acoustic cavitation duration, the segregation of ink biopolymers and the optical properties of the interphase region are quantitatively evaluated in Table 12.
The influence of ultrasonication time at 40 kHz on biomolecular partitioning was investigated. Protein concentration in the upper phase peaked at 20 min (42.00 ± 1.68 mg g−1, Group a), representing a 72.41% recovery compared to the untreated control (58.00 ± 2.32 mg/g). This confirms that cavitational microturbulence effectively disrupts the squid ink matrix to release melanin–protein complexes [55].
However, past 20 min, protein recovery declined significantly to 15.00 ± 0.60 mg g−1 (Group d) at 40 min. This loss is explained by the simultaneous rise in the interphase corrected OD280 (0.223 to 0.416), suggesting that over-sonication induces protein denaturation and subsequent migration to the interphase [64].
Interestingly, carbohydrate levels remained relatively stable but showed a statistical peak at 10 min (29.70 ± 0.20 mg g−1, Group a) before stabilizing near 29.00 mg g−1 (Group c) during the optimal 20 min window. This suggests that soluble saccharides are released more rapidly than proteins but are less prone to the dramatic re-aggregation observed with proteins at higher durations. The slight fluctuations in carbohydrate partitioning beyond 25 min imply the formation of minor protein–polysaccharide complexes induced by cumulative shear [65].
The eumelanin yield reached its statistical maximum at 20 min (380.00 ± 12.54 mg 2.5 g−1, Group a) following a quadratic regression model (R2 = 0.998, p < 0.05). The yield plateaued between 20 and 40 min, confirming that maximum cellular disruption is achieved within the first 20 min. This was further validated by the interphase OD220 peaking at 0.949 ± 0.011 (Group a), and the lipid recovery peaking at 10.66 ± 0.23 mg g−1 (Group a). Beyond the 20 min optimum, the non-significant change in yield (p > 0.05) and the decline in upper-phase protein clarity indicate that further energy exposure provides no benefit and merely increases the risk of component re-aggregation [66]. Therefore, 20 min is established as the optimal threshold, maximizing pigment and lipid recovery while maintaining the stability of the biphasic system.
  • Effect of temperature on Biomolecular Partitioning
The relationship between processing temperature, biopolymer-partitioning efficiency, and interphase optical properties is quantitatively presented in Table 13.
Temperature influences solvent penetration, facilitates solute diffusion and favors mass transfer rates, and acts as a pivotal control variable in solvent-extraction processes [67]. Hence, rigorous, strategically designed OFAT experiments across the range of 5 °C to 45 °C were used to optimally recover eumelanin from the melanoprotein complex by studying the impact of temperature in discriminating the recovery of eumelanin from the melanoprotein complex of squid ink [43].
One-way ANOVA confirmed that temperature is the dominant variable controlling phase separation of the protein impurities. However, temperature had insignificant effect on the gravimetric yield of eumelanin (p > 0.05). Here, the entire thermal gradient yield remained stable at approximately 377.50 ± 11.70 to 399.00 ± 15.20 mg 2.5 g−1 (Group a). It is important here to note that protein impurities sequestering in the upper phase were maximized at 5 °C (48.48 ± 1.12 mg g−1, Group a), where protein content of the raw ink was 58.00 ± 2.32 mg g−1. However, as the temperature is elevated to 45 °C, protein content declined to 17.20 ± 0.74 mg g−1 (Group h), while the dip in the protein content is supported by the reciprocal hike in the protein content in the interphase, with the coordinated soaring in absorbance from 0.080 ± 0.003 (Group g) at 5 °C to 0.400 ± 0.014 (Group a) at 45 °C at OD280. These findings establish that higher temperature facilitates thermal energy-induced co-precipitation of protein impurities due to solvent interaction within the chloroform:methanol:water system [68].
The present study registered a characteristic optical property at OD220, which is the critical observation in the interphase. Even though the physical gravimetric mass of the eumelanin remained statistically unchanged (p > 0.05), optical density of the interphase reduced drastically from 1.035 ± 0.027 (Group a) at 5 °C to 0.309 ± 0.011 (Group i) at 45 °C, but not because of loss of eumelanin due to coprecipitated proteins. Here, a raise in temperature facilitated more co-precipitation of the protein impurities into the interphase, resulting in elevation of corrected OD280, which in turn replaces the physical space and interfacial area held by eumelanin, thereby falling in absorption at the OD220 reflection of the eumelanin backbone [69].
However, concentration of carbohydrates in the upper phase registered consistently steady from 26.80 to 27.60 mg g−1 (Group a, p > 0.05), revealing that temperature plays a pivotal role in modulating the fractionation of protein fractionation of the squid ink during the chloroform:methanol:water extraction system. Accordingly, fractionation of lipids into the organic-rich lower phase remained stable between 10.50 and 10.80 mg g−1 (Group a) across the thermal gradient from 5 °C to 45 °C, with lipid fractionation reaching 96.36 ± 1.59%. Here, maintaining temperature of extraction system at 5 °C resulted in a maximum gravimetric yield of eumelanin at 382.50 ± 14.54 mg 2.5 g−1 while maximizing impurity removal and preserving the highest absorbance of 1.035 ± 0.027 at OD220 for the recovered eumelanin [70].
Statistical analysis confirms that temperature plays a major role in partitioning of protein impurities as indicated by an exceptional fit R2 value of 0.978 (p < 0.05). An increase in temperature from 5 °C to 45 °C exceptionally weakened the thermodynamic interactions driving proteins in the aqueous-rich upper phase, demoting the protein retention resulting in the co-precipitation within the eumelanin layer [40]. Hence, the OFAT experimental setup identified an extraction temperature of 5 °C, which is the optimal operating condition by demoting protein impurities and co-precipitation while maintaining the highest absorbance of the intermediate phase at the OD220 indicator of the optimum recovery of eumelanin.
Optimization of Extraction Parameters for Eumelanin Through OFAT Screening
The univariate optimization of the extraction parameters resulted in specific operational optimums, as summarized in Table 14. These optimized parameters have an ability to affect the corresponding clarification efficiencies of product of interest in the interphase and partitioning efficiencies of impurities into the upper or lower phase, ensuring yield, purity, functionality, and structural integrity of eumelanin.
The optimal extraction conditions of pH 7.0, 1.07% NaCl, 20 min ultrasonication, and 5 °C were established as the optimum process parameters under OFAT. These conditions collectively maximize the gravimetric yield (372.61 ± 12.30 to 382.50 ± 14.54 mg 2.5 g−1) and maintain the highest OD220 integrity (0.863 ± 0.019 to 1.035 ± 0.027).
The selection of 5 °C was particularly critical; while ANOVA confirmed that the gravimetric yield of eumelanin remained statistically stable p > 0.05, Group a) across the thermal gradient, the lower temperature effectively suppressed the “replacement effect” and excessive protein co-precipitation. This was evidenced by the significant reduction in corrected OD280 (reaching a minimum of 0.080 ± 0.003) and the simultaneous maximization of protein sequestration into the upper waste phase (48.48 ± 1.12 mg g−1).

3.4.3. Stage 3: Optimization of Parameters of Extraction Through RSM

Resulting optimized parameters through univariate experimental design through OFAT is used as primary data, which is required to further design the multivariate CCD as an experimental design using RSM as a tool to optimize stabilize eumelanin into the interphase while suppressing kinetic energy-induced protein impurity aggregation. CCD was executed to resolve the complex non-linear interdependent relationship between variables such as ultrasonication time (G) and temperature (H).
The experimental matrix employed RSM to evaluate the process across a circumscribed CCD. By designating the UV absorbance at 220 nm as the target response (Y), the optimization focused exclusively on the indole-based chromophore of the pigment [5]. This choice provided the analytical resolution to isolate eumelanin recovery from the overlapping spectral influences of co-extracted proteins [27]. To estimate experimental errors, 13 trials comprising factorial points, axial points, and five central replicates were performed using a CCD. The configurations and observed data are given in Table 15.
The adequacy of the model was evaluated through ANOVA applied to the experimental data (Table 16). The importance of each coefficient was assessed via F-test and the Probability of Error test (p-value) at a confidence level of 95% (p < 0.05 considered significant) [71]. The regression model demonstrated high significance (p < 0.0001) as presented in Table 16, where the partitioning of total variation into model-related components and experimental errors allowed for a precise determination of the overall predictive variation [72].
The robustness of the model is substantiated by an F-value of 38.59 and an extremely low p-value (<0.0001). Because this calculated F-ratio significantly surpasses the tabulated F-critical value, the regression is confirmed to be highly significant, indicating that the observed experimental trends are not the result of stochastic variation [73].
The global fit of the model was further validated by a Root Mean Square Error (RMSE) of 0.0497. This RMSE value, representing the standard deviation of the residuals, indicates a narrowed gap between the observed yields of eumelanin and the predicted values of model [74]. Here, a Mean of Response value of 0.9362 precisely contextualizes that the standard error is critically low in relation to the overall recovery of eumelanin across the experimental design [75].
Furthermore, the model’s reliability and reproducibility were confirmed by a Coefficient of Variation (C.V. %) of 5.31%. In biopolymer extraction studies, a C.V. below 10% is generally accepted as an indicator of high precision, suggesting that the variation in recovery is driven by the controlled independent variables rather than experimental noise [76].
Lack-of-Fit non-significant F-value of 3.91 with p-value of 0.1631 indicates that the model demonstrates high fidelity to the experimental eumelanin extraction data [77]. Furthermore, the determination coefficient (R2) was calculated to be 0.9650, while the Adjusted R2 was 0.9400. When R2 values approach unity, it signifies a high level of explanatory power and accurate predictive capability [78].
Regression coefficients were calculated as detailed in Table 17 to conclude the specific contribution and synergistic interactions of ultrasonication time (G) and temperature (H). The probability that the observed F-statistic occurred by chance (Prob > F, or p-values) was less than 0.05, which is suggestive of significance of term that is used to evaluate the significance of each quadratic model term [79].
Hierarchical importance of ultrasonication time (G) and temperature (H) through parameter estimation as presented in Table 17 indicates that temperature (H) is a primary contributor exerting dominant effect with a t-ratio of 10.01 (p < 0.0001), significantly surpassing the effect of ultrasonication time (G), which yielded a t-ratio of −6.03 (p = 0.0005). The wide gap existed between the influence of ultrasonication time (G) and temperature (H), and temperature (H) of the extraction system emerged as a dominating critical driver in minimizing the coprecipitation of protein impurities alongside eumelanin into the interphase. Both quadratic terms, GG and HH, were statistically established as highly significant with p values of 0.0011 and 0.0010, respectively. These highly significant quadratic terms validate the second-order nature of the extraction process. Quadratic terms for GG and HH were estimated at −0.0994 and −0.1019, respectively, with negative coefficients defining a concave response surface. This confirms that the extraction of eumelanin reaches a definitive maximum level, beyond which, further increases in energy input result in decreased absorbance at OD220, which is an indicator of the unit gravimetric yield of eumelanin. These findings further confirm that temperature (H) is the primary driver of co-precipitation of the protein impurities with eumelanin into the inter phase [80]. Furthermore, GH as an interactive term with p-value of 0.0463 indicates temperature (H) of the aqueous phase modulated the efficacy of the ultrasound assisted phase separation. The relationship is represented by the following second-order polynomial Equation (3):
Y   = 0.8589555 + 0.0279664 G + 0.0077169 H + 0.00048 G H + ( 0.000994 ) G G + ( 0.000652 ) H H
To ensure the integrity of the statistical conclusions, diagnostic checks were performed on the model’s residuals. As detailed in Table 17, regression coefficients and significance of parameter estimates for the quadratic model confirm that p-values below 0.05 suggest the high significance of the terms [81]. The robust t-ratios and narrowed standard errors further validate that the model is a reliable representation of the experimental space.
Numerical optimization was conducted to identify the peak response within the investigated domain. Notably, the model predicts that at the specified optimized conditions of 20 min and 2.5 °C, the absorbance is 1.0599 (Equation (3)), which demonstrates near-identity with the Intercept value of 1.0600 (Table 17). Internal mathematical consistency of the model is confirmed through its convergence, and the reliability of the predictive surface is validated by the precision of the alignment of optimized coordinates with the design center [82]. Multivariate CCD framework the decent critical descent in yield, where simpler univariate (OFAT) methods would fail to capture the critical descent in yield beyond the identified peak [83].
CCD suggests that concerted simultaneous increases in thermal and acoustic energy promotes the efficient phase separation of eumelanin from other impurities of the squid ink during solvent extraction. Thermal and acoustic energy enhances the phase separation by reducing the viscosity of the Chloroform:methanol:water extraction system and enhances the mass transfer kinetics through increasing the surface area per given volume of immiscible phase. Here, exceedingly the ultrasonication time (G) of 20 min and temperature (H) 2.5 °C resulted in drastic reduction in eumelanin yield, as this change potentially results in excessive homogenization and thermal reaggregation of eumelanin, thereby reducing its spectral detectable concentration [84]. The observation that the thermal effect is intensified by the duration of ultrasonication is supported by the findings in Table 17 showing a significant interaction term (p = 0.0463) and its positive coefficient (+0.0600). CCD statistically validates that extending ultrasonication time (G) without adjusting temperature (H) yield diminishes around the peak and returns to the minimum, and these interaction details give solid foundation for subsequent optimization of eumelanin recovery, ensuring structural integrity.
Reliability of the second-order quadratic model is substantiated through empirical validation at optimized coordinates, G = 20 min and H = 2.5 °C. The model forecasts the peak of absorption 1.0598 at G = 20 min and H = 2.5 °C. This aligns precisely with the experimental trials performed in triplicate, showing an average absorbance of 1.0600, which results in a confidence interval of more than 95%. The RSM approach substantiated effectiveness of the extraction process of eumelanin at the maximum level while favorably preventing the risk of structural disintegration caused by excessive energy input.

3.4.4. Stage 4: Statistical Refinement of Purification Parameters via RSM

Following the extraction phase, the acid-base cycling process was optimized to eliminate hydrophilic impurities and residual proteins. This strategy leverages the pH-dependent solubility of proteins to selectively remove them from the stable eumelanin matrix.
Process of purification of extracted eumelanin was optimized by implementing CCD by evaluating the interactive effects of precipitant pH (I) and number of cycles (J) on UV absorbance at 220 nm. UV absorbance at 220 nm as a critical response matrix is necessary to discriminate recovery of eumelanin from the concomitant corrected absorbance at 280 nm of co-extracted protein fractions [5,27]. Thirteen randomized experimental setups as organized in Table 18 involving robust combinations of precipitant pH (I) and number of cycles (J), encompassing four factorial points, four axial points, and five central replicates were performed to ensure high resolution absorbance data. This robust CCD provided statistical power to design a second-order polynomial model that can predict eumelanin purity with high precision.
Contribution of individual and interactive impact of precipitant pH (I) and number of cycles (J) during purification of the eumelanin is verified by performing ANOVA, as summarized in Table 19. Here, second-order interactions are modeled rigorously using F-tests and probability-of-error metrics with 95% probability levels (p < 0.05) [71]. The ANOVA enables systematic partitioning of effects of precipitant pH (I) and number of cycles (J) and residual experimental errors on absorbance of eumelanin by the model developed, resulting in a rigorous assessment of the overall predictive absorbance variance of the framework [72].
High F-value of 198.21 alongside an extremely low p-value of <0.0001 highlights the mathematical robustness of the purification framework. Since experimental F-ratio markedly exceeds the critical threshold value, the regression analysis confirms that the observed change in eumelanin absorbance is a direct result of the acidity of the precipitant (I) and the number of cycles (J) rather than stochastic fluctuations [73].
In the RMSE, a very small value of 0.0431 further supports the view in global suitability that the quadratic model aligns between the experimental absorbance and the theoretical yields derived from the quadratic model [74]. The precision derived from the RMSE is further supported by a Mean-of-response equal of approximately 0.8769, indicating the high-performing absorbance, with the tested limit ranging from pH 5.5 to pH 8.5 for cycles ranging from three-to-seven cycles of 30 min each [75].
In addition to this, a Coefficient of Variation (C.V.) of 4.915% confirms the repeatability of purification-optimization protocols, as the value of less than 10% indicates that the especially precipitant pH (I) and number of cycles (J) effects the eumelanin rather than inherent experimental noise [76].
A non-significant variation with F-value of 6.27 and p value of 0.0542 while evaluating the Lack-of-fit demonstrates that second-order polynomial equation correlates accurately to eumelanin purification experimental data [77]. Fitness of this analysis further supported by the R2 of 0.9930, confirming that the interactive relationship between precipitant pH (I) and the number of cycles (J) explains 99.30% of the fluctuations in purity of eumelanin. Further to this finding, an adjusted R2 of 0.9880 supports that the model encompasses nearly the whole spectrum of absorbance variability [78].
Individual contributions of precipitant pH (I) and number of cycles (J) during purification of eumelanin is illustrated in Table 20. The significance variation in the absorbance was determined using key matrices of ANOVA, where larger a F-value was taken as a higher variation amongst group variations in comparison to variations within the group, and a smaller p-value (p < 0.05) inferred that the response at 220 nm is unlikely to appear by chance, ruling out occurrence of the null hypothesis [79].
The finding of the experimental setup indicates that both precipitant pH (I) and number of cycles (J) during purification contributed significantly to the UV absorbance of the purified eumelanin. However, the precipitant pH (I) predominantly influenced the response as supported by the t-ratio of −22.77 (p < 0.0001); the magnitude was significantly higher than the number of cycles (J)with the t-ratio of −4.53 (p = 0.0027). The findings support the viewpoint that acidity of the washing medium is a primary driver in removing non-melanic impurities and plays a major role as a regulator for molecular portioning between insoluble eumelanin matrix and soluble supernatant [80].
Furthermore, the interactive term IJ with a p value of 0.0102 confirms that the efficacy of number of cycles (J) is modulated by precipitant pH (I), and this synergy implies that suboptimal pH levels and increasing the wash cycles may not result in proportional improvement of absorbance at 220 nm, as represented in the Equation (4).
Y = 1.020805 + 0.4481437 I + 0.4461167 J + ( 0.0125 I J ) + ( 0.035806 ) I I + ( 0.039313 ) J J
The predictive reliability of this quadratic framework is underscored by its performance at the design center point. The model predicted the absorbance value of 1.1719 at 220 nm would align closely with the experimental absorbance average of 1.1720 recorded at pH 7.00 and five cycles. This close fitting of response between the model predicted value and the experimental value confirms the robustness and integrity of optimization of eumelanin purification and establishes the model as a high-fidelity diagnostic tool.
Interdependencies of variable, precipitant pH (I), and number of cycles (J) established during the eumelanin-purification model were substantiated through careful analysis of the residuals as detailed in Table 20. Regression coefficients of individual variables with their quadratic counterparts resulted in a p value of < 0.05, establishing its high-impact contribution on the absorbance at 220 nm, indicator of eumelanin purity [79]. In addition to this, t-ratios of precipitant pH (I) reach −22.77 with standard errors remaining at a minimum of 0.0152, confirming that the second-order polynomial model serves as a robust and reliable indicator of purification process of eumelanin.
Numerical optimization was implemented to determine the peak response within the explored purification domain. Notably, the model predicts that under the specified optimized conditions of pH 7.00 (I) and five cycles (J), the absorbance reaches 1.1719 (Equation (4)). This value demonstrates parity with the Intercept value of 1.1720 (Table 20). Such convergence substantiates the internal mathematical consistency of the quadratic framework, as the optimized coordinates align perfectly with the design center point, thereby validating the structural reliability of the predictive values [82].
Furthermore, per ANOVA in Table 20, the precipitant pH (I) exerted a dominant negative linear influence with the value of −0.3469, which is characteristic of a sharp downward slope. This analysis confirms that precipitant pH (I) emerged as a fundamental driver for partitioning of impurities from eumelanin at the neutral pH, and an increase in deviation from the protein isoelectric point (pI) results in enhancement of electrostatic repulsion and entrapment of protein contaminants within the eumelanin matrix [85]. Establishment of inflection point confirms that these changes are finite where significant negative quadratic terms, II with value of −0.3223 and JJ with value of −0.1573, subsequently override linear characteristics to develop the observed operational peak.
The parameter further validated the hierarchical significance of precipitant pH (I) and number of cycles (J) during eumelanin purification and precipitant pH (I) emerged as the primary modulator of efficacy of eumelanin purification with a t-ratio of −22.77 (p < 0.0001), which overweigh the impact of number of cycles (J) and were recorded at a t-ratio of −4.53 (p = 0.0027). This disparity in impact of variable of absorption response confirms that precipitant pH (I) is the critical driver for effective molecular partitioning. Second-order nature of the purification process is validated by the highly significant quadratic terms (II, p < 0.0001; JJ, p = 0.0001). Here, negative coefficients define the optimum; further change in the variable results in diminishing returns or alkaline-induced oxidative degradation matrix [85,86].
The initial ascent towards the absorption peak at pH 7 (I) is due to the optimized fractionation of impurities, where at this neutral pH solubility, the difference between the protein impurities and the eumelanin matrix were maximized, paving the way for the effective removal of protein contaminants during supernatant exchange. However, beyond this, the optimum change in pH of the solvent compromises the absorbance of the eumelanin at 220 nm. The model identifies JJ as a first critical factor reducing the absorption at higher washing cycles, and II also effects the absorbance as the pH moves towards the alkaline pH, resulting in undesirable solubilization of the eumelanin to the upper solvent layer due to alteration of eumelanin backbone and reduction of spectral density [83,84]. Ultimately, these statistically optimized precipitant pH (I) and number of cycles (J) develop a robust and consistent operational model that ensures maximum eumelanin purification while strictly preserving structural integrity.
To validate the reliability of the purification model developed, validation is performed empirically under optimized coordinates of pH 7.00 (I) and five cycles (J). The model projected the absorption peak of 1.1719 that fits closest with the experimental average, which forecasted a peak absorbance of 1.1720. Confirmatory experimental sets executed in triplicates resulted in the average absorption peak of 1.1720, aligning closely with the forecast and falling exactly within the 95% confidence interval [1.1264, 1.2176], confirming the reliability of the model in purifying the eumelanin with structural and functional integrity.

3.4.5. Stage 5: Multivariate Optimization of Stabilization of Eumelanin Through CCD

A strategic thermal dehydration model is developed to transform the purified eumelanin into a self-stable industrial form that can be further finished on a solid surface while preserving its structural and functional integrity. This final phase of the recovery phase involved improving its shelf life by utilizing a non-linear thermal landscape through a CCD designed to evaluate the interplay between Drying Temperature (K) and Drying Duration (L) on UV absorbance at 220 nm (Y) as the critical response metric. The absorption response at 220 nm was designated as it is a high-sensitive proxy for the retention of structurally and functionally stable indole-based chromophores and the prevention of thermolytic cleavage [5,27]. The designed CCD encompasses 13 randomized runs integrated with four factorial points, four axial points, and five central to define the thermodynamic boundaries where moisture removal is maximized without compromising the structural fidelity of the eumelanin. The empirical data obtained that correlates the thermal inputs to eumelanin stability are cataloged in Table 21.
To verify the integrity of the stabilization phase, the experimental data were subjected to an ANOVA. The evaluation of the model’s predictive capacity was conducted through global fit statistics, which systematically partitioned the total variance in eumelanin absorbance at 220 nm to model-defined effects of Drying Temperature (K) and Drying Duration (L) versus residual experimental error.
As demonstrated in Table 22, the resulting regression demonstrated substantial significance. The mathematical robustness of the stabilization framework is substantiated by a high Overall Model F-ratio of 39.82 and an extremely low p-value (<0.0001) [71]. Since this experimental F-ratio markedly exceeds the critical threshold, it confirms that the observed shifts in absorbance at 220 nm that reflect the chromophore stability are a direct function of the thermal energy flux (K and L) rather than stochastic fluctuations or random noise [73].
The suitability of the quadratic model was further substantiated by a non-significant Lack of Fit test (p > 0.05). The resulting non-significant F-value of 1.31 and a p-value of 0.3880 (p > 0.05) imply that the quadratic model aligns accurately with the experimental absorbance data collected during stabilization [77]. This suggests that the partitioning of the Sum of Squares for the model (0.1847) and the Total Error (0.0065) are statistically sound, ensuring overall capacity of the framework to predict pigment retention based on temperature and time.
The global suitability of the quadratic model was corroborated by a RMSE of 0.0305, as shown in the validation metrics. This value, signifying the standard deviation of the residuals, reflects a high level of congruence between empirical absorbance measurements and the theoretical yields projected based on the K and L variables [74]. This level of precision is further reinforced by the Mean of Response (1.0753); the remarkably low standard error relative to the average absorbance response confirms the model’s reliability within the tested experimental design [75].
A Coefficient of Variation (C.V.) of 2.83% during stabilization of eumelanin indicates that the absorbance responses of 13 sets of trial experiments have a very low variability and high consistency, as, in statistics, a C. V. below 10% is normally considered as a highly stable and reliable dataset. This analysis confirms that the variation in absorbance at 220 nm is governed by the controlled interplay between K and L, rather than inherent experimental noise [76].
An R2 value of 0.9660 indicates that K and L explain approximately 96.60% variance in the dependent variable, and the Adjusted R2 value of 0.9418 is the reflection of the robust regression model, comprising excellent predictive power. Here, a lower R2 value (0.9660) to the Adjusted R2 value (0.9418) is not only typical but also expected in multiple regression model. Being close to unity R2 and Adjusted R2 value indicates that the eumelanin stabilization model fits the training data well [78]. These findings confirm exceptional predictive fidelity of the experiment model, and this alignment establishes model precision in tracking eumelanin during the stabilization process by measuring absorbance at 220 nm along the tested spectrum of 51.72 °C to 108.28 °C (K) and 380.59 min to 1059.41 min (L).
The individual contribution and interactive contribution of Drying Temperature (K) and Drying Duration (L) on UV absorbance at 220 nm (Y) as the critical response metric was elucidated through the deconvolution of the regression coefficients in Table 23. The analysis confirms that Drying Duration (L) is the primary factor of the stabilization phase, resulting in a dominant t-ratio of −8.56 (p < 0.0001), which is almost double the statistical weight of Drying Temperature (K), where the t-ratio is −5.22 (p = 0.0012). This strongly supports the viewpoint that the structural stability of the eumelanin is more sensitive to Drying Duration (L) than Drying Temperature (K). Negative-coded estimates are regression coefficients representing the independent variable Drying Duration (L). At higher doses, they increase UV absorbance at 220 nm while (Y) decreases. And a negative t-ratio of more than two with a small p-value indicates that the inverse relationship is statistically significant.
Here, the significant interaction term for drying Duration and Drying Temperature (KL) with p value of 0.0364, and the negative quadratic terms for both Temperature (KK) with the p value of 0.0022 and Dry Duration (LL) with p value of <0.0001, validate the optimal value. This relationship is mathematically defined through corrected second-order polynomial using on the Uncoded Estimates in the Equation (5).
Y = 0.593176 + 0.0248324 K + 0.0028403 L + ( 0.000008193 ) K L ( 0.000136 ) K K + ( 0.000001784 ) L L  
Along with the global-fit statistics and ANOVA, effect of experimental framework of the eumelanin stabilization process on structural and functional stability of eumelanin is verified using residual-bases diagnostic tools to confirm that the model accurately represents the stabilization eumelanin using the thermal dehydration process. Here, the non-significant Lack of Fit with p value of 0.3880 validates that the second-order polynomial regression model is the mathematically fit shape to map the thermal stabilization of the purified eumelanin [87]. The stationary point with a maximum absorbance at 220 nm, indicative of eumelanin during the stabilization experiment, was conducted through numerical optimization. The model identified absorbance peak of 1.1720 at 80 °C (K) and 720 min (L).
The significant negative quadratic terms for Drying Temperature (K) had p-value of 0.0012 and Drying Duration (L) with p-value of <0.0001. Here, Drying Duration (L) appears as a modulator with its quadratic component of the F-value of 79.17, and linear components of the F-value of 73.26 apply nearly three times the influence of Drying Temperature of the F-value of 27.21 on the absorption response at 220 nm. Hence, Drying Duration (L) with t-ratio of −8.56 dominates as a driving factor in effecting structural and functional integrity of the eumelanin, as confirmed by its absorbance at 220 nm.
Drying Temperature (K) at 80 °C and Drying Duration (L) for 720 min established a definite “sweet spot” with a highly significant negative quadratic parameter (p < 0.01). This established a parabolic relationship, and, beyond this threshold, a significant interaction effect (KL) with p-value of 0.0364 narrowed the ecosystem for safe stabilization as the Drying Temperature (K) increased. Excessive Drying Duration (L) triggers an abrupt decrease in absorbance response at 220 nm, likely due to potential thermal oxidation or the structural degradation of eumelanin.
Empirical validation performed at a Drying Temperature (K) of 80 °C and Drying Duration (L) for 720 min validates the high-fidelity predictive power of the model. The calculated value through the quadratic equation yielded an absorbance peak of 1.1712, which is perfectly consistent with the experimental mean of 1.1720, demonstrating 99.91% parity with the forecast. The experimental trials were performed in triplicate, yielding an average absorbance of 1.712; the results fall precisely within the 95% confidence interval [1.1398, 1.2042]. This substantiates the models’ exceptional accuracy in governing the eumelanin stabilization.

3.5. Phase II: Characterization of Purified Eumelanin

Physico-chemical characterization of eumelanin purified and stabilized from the ink of Indian squid is performed through a multi-instrumental approach to ensure the structural and functional stability required for its reliability for subsequent functionalization on a material surface.

3.5.1. Stage 1: Physicochemical Properties

The fundamental characteristics of the purified and stabilized squid ink were investigated through the following analytical technique.
  • Field Emission Scanning Electron Microscopy (FE-SEM)
FE-SEM of the stabilized eumelanin exhibited a strikingly homogeneous granular ultrastructure, indicative of high compositional purity. Stabilized eumelanin samples were captured as discrete, semi-spherical nanogranules of a narrow size distribution, with the size ranging from 82.74 nm to 136.7 nm at a high magnification of 150,000× (Figure 1). The primary nano units are organized into dense, three-dimensional clusters or fused aggregates, but not in isolation. The aggregates were formed by the random packing of spherical subunits, and the surface topology of these aggregates appears rugose and porous. Despite a rigorous recovery process of three-unit steps, attainment of effective purification is confirmed by intact characteristic granular integrity of eumelanin with no visible crystalline impurities or any proteinaceous filaments [5].
The presence of characteristic granular morphology is a definitive structural hallmark of eumelanin recovered from the Indian squid ink. Earlier published results stated that natural eumelanin is made of assembled building blocks made up of spherical units of ~110 nm. However, synthetic melanin can sometimes exhibit more amorphous or plate-like structures, depending on the oxidation condition [88,89]. Here, oligomeric proto molecules stack viz via π-π interactions to form granules that, in turn, aggregate into clusters, as seen in the micrograph. This is critical to the biological function of the eumelanin [6,7]. The uniform size distribution of nano granules is responsible for broadband UV-visible absorption observed in the spectrophotometric data [8]. The consistency of the granular, porous network is the indicator of the chemically robust recovery process that maintains a native structure of the eumelanin, which is essential for the subsequent functionalization process [90].
  • Energy-dispersive X-ray spectroscopy (EDS)
Energy-dispersive X-ray spectroscopy (EDS) integrated with FE-SEM is used for the elemental analysis and chemical characterisation of purified and stabilized eumelanin (Figure 2). The spectral profile confirms that the sample predominantly contained an organic matrix, such as 65.5 atomic percent% (at%) of Carbon, 17.1 at% of Oxygen, and 16.9 at% of Nitrogen, contributing over 99.5% of the total atomic composition. The high nitrogen content is indicative of the dense π-π-stacking capabilities of the indole units, which facilitate the formation of the 82.74 nm to 136.7 nm nanogranules observed in the FE-SEM micrographs. The profile visualizes sharp, well-defined peaks for the K α lines of C, N, and O.
Inorganic contaminants such as Sodium or Chlorine, which are typically found in squid ink, are absent in the purified and stabilized eumelanin. These findings are indicative of the near-complete removal of non-melanic impurities of squid ink. This chemical homogeneity is directly responsible for the broadband optical absorption profile. The calculated C:N ratio of 3.88 is highly characteristic of the indole-based scaffolding of the eumelanin, revealing a complex copolymerization of DHI and DHICA [91]. The uncharacterized peaks observed correspond to the conductive gold (Au) coating required for high resolution imaging, and these instrumental artifacts do not represent impurities within the squid eumelanin matrix. Detection of Sulfur (S) and Phosphorus (P) does not indicate extraneous contaminations, but components of benzothiazine subunits within the eumelanin copolymer and trace Phosphorus signal represent the presence of tightly bound phospholipids or phosphorous moieties typical of purified eumelanin rather than inorganic impurities.
  • Fourier Transform Infrared Spectroscopy (FTIR)
Molecular analysis and functional group distribution of the purified and stabilized squid eumelanin was investigated through the FTIR spectroscopy, which characterizes the specific molecular vibrations developed from interaction of infrared radiation with characteristic chemical bonds [92]. The resulting spectrum (Figure 3) shows a complex vibrational profile that precisely identifies the aromatic, carbonylic, and hydroxylic moieties describing the eumelanin scaffold.
The spectrum exhibits a prominent broadband registered between 3200–3500 cm−1 that centered at 3251.08 cm−1, which explains the complexity of the hydroxyl (O–H) and amine (N–H) stretching vibrations from phenolic hydroxyl groups, indolic –NH units, and adsorbed water. The spectrum displayed negligible intensity at 2920–2850 cm−1, and the absence of significant C–H stretching, especially noted at 2920.96 cm−1 and 2851.02 cm−1, was indicative of high-purity eumelanin without any lipids and proteinaceous contaminants [93].
Chemical integrity of the indolic backbone is substantiated by fingerprint region, where the weak shoulder near 1710–1730 cm−1 matches to the C=O stretching of carboxylic acid groups resulting from DHICA units, mirroring the heterogeneous oxidation form of natural eumelanin [94]. Presence of an extended π-conjugated indole–quinonoid framework is substantiated by the dominant absorption band at 1620–1650 cm−1, indicative of aromatic C=C and quinone C=O stretching modes.
Characteristic supporting band at 1510–1550 cm−1, especially at 1537.37 cm−1, is due to aromatic ring stretching and N–H bending. The 1250–1350 cm−1 region with a peak at 1304.98 cm−1 is a result of C–N and phenolic C–O stretching vibrations, which are required for electron delocalization and radical stabilization. Sharp peaks below 800 cm−1, especially at 507.02 cm−1, is the characteristic structural feature of the eumelanin. Hence, FTIR analysis confirms the successful recovery of indolic scaffold while retaining key phenolic, quinonoid, and carboxyl functionalities without structural degradation [95].
  • Solubility Profiling
The chemical robustness and processability of the purified U. duvaucelii eumelanin were evaluated through solubility profiling across a wide pH range of 1–14 to establish a protocol for quartz surface coating [55]. Where pH-driven solubility has well-documented characteristics of eumelanin in the standard extraction process [89], this application is served here to validate the stability of eumelanin of size 82.74 to 136.7 nm nanogranules under varied environmental stressors.
Being acidic to neutral media (pH 1–7), the eumelanin remained highly insoluble, existing as a stable particulate suspension. This recalcitrance to dissolution is ascribed to the protonated state of the carboxylic acid and phenolic hydroxyl groups identified in FTIR, which minimizes electrostatic repulsion and favors the dense π-π stacking of the indolic sub-units [96]. This structural property is significant, ensuring that once the squid eumelanin finished on quartz plates, where functionalized surface remains chemically resistant to hydrolytic cleavage in acidic or neutral environments, it preserves its UV protective properties.
A shift to solubility was observed at and above pH 8, and degree of solubility increased with an increase in pH, with complete dissolution beyond pH 12. This transition in solubility is driven by deprotonation of DHICA-derived carboxyl groups, resulting in a high net-negative surface surge on eumelanin. This transition is crucial in processing the side where electrostatic repulsion overcomes the van der Waals forces, resulting polymeric aggregation into hydrated oligomers required for precise surface application.
Importantly, the optimization of this alkaline phase paves the way for functionalization of purified eumelanin on quartz. The FE-SEM analysis of the nano finished eumelanin on quartz, revealing a more densely packed fine-grained morphology of 53.96–97.12 nm compared to the bulk powder of 82.74–136.7 nm. This indicates that the solubility profiling was successfully prevented in preventing large-scale irreversible aggregation, facilitating a high surface-area-to-volume ratio necessary for effective photo-protective properties.
At and beyond pH 8, a gradual transition towards solubility was registered until complete dissolution at and beyond pH 12. This characteristic feature is due to the deprotonation of the DHICA-derived carboxyl groups and the phenolic hydroxyls, yielding polymer chains with a high net-negative surface charge. The electrostatic repulsion that was a result in this process overcomes the van der Waals forces and π-π interactions paving the ways for disintegration of the polymeric aggregates into smaller, hydrated oligomeric species. Solubility of eumelanin towards alkaline pH has biotechnological importance as it enables the liquid-phase processing and thin-film fabrication while retaining structurally and functionally robust the primary indolic backbone [55].

3.5.2. Stage 2: Photo-Absorptive Properties

The photo-absorptive efficiency of the purified and stabilized eumelanin was evaluated using a multi-technology strategy, as follows:
  • UV-Vis Spectrophotometry
Structural integrity and light-harvesting properties of the purified and stabilized eumelanin were carried using UV–Vis spectrophotometry. As detailed in Figure 4, the eumelanin exhibits a characteristic broadband absorption spectrum, an optical hallmark of indole-based organic pigments, reaching a maximum absorbance of ~1.21 at 200 nm. The monotonic, featureless increase toward shorter wavelengths, together with the absence of discrete peaks in the 260–280 nm region, confirms high purity and the effective removal of protein, lipid, and nucleic acid contaminants [97].
Transitioning into the visible region, the spectrum exhibits a featureless exponential decay from 400–600 nm, with a stable landmark absorbance of 0.2529 at 596 nm, consistent with the retention of diverse oligomeric chromophores within a π-π-stacked architecture required for biological photoprotection [88].
Globally, the slope between 200 and 600 nm is −0.0011966 nm−1, revealing a shallow but consistent negative decay that is the characteristic feature of chemically heterogeneous oligomeric ensemble [98,99]. A localized positive slope of +1.0 × 10⁻⁴ nm−1 (y = 1.0 × 10⁻⁴ × − 0.6539) was observed between 575–605 nm, resulting a plateauing behavior as the sample approaches its visible transparency threshold [100].
  • X-ray diffraction (XRD)
XRD was employed to investigate structural configuration and purity of the isolated Indian squid eumelanin. The diffractogram (Figure 5) obtained in this investigation showed a prominent and broad amorphous halo centered between 20° and 30° 2 Ɵ; the characteristic serves as a diagnostic structural “fingerprint” of the disordered π-π stacking within the eumelanin biopolymeric backbone [89]. The diffractogram shows signal of diffuse nature that confirms the predominantly non-crystalline, protomolecular arrangement of the indole-based units, typical of high-purity eumelanin.
Absence of characteristic sharp, high-intensity crystalline reflections at 27.45°, 31.79°, 45.53°, 53.94°, and 56.57° 2 Ɵ confirms that there are no detectable peaks corresponding to sodium chloride (NaCl) or calcium-based carbonates, which are common contaminants in unrefined squid ink [101]. The distinct interposer d-spacing for the amorphous halo, determined using Bragg’s Law (nλ = 2d sinƟ), resulted in a value ranging between 3.4 and 4.0 Å, which correlates to the distance between stacked aromatic indole rings required for biological UV protection [102].
The dependability of this phase recognition is further corroborated by the baseline monitoring and residual error profiles. As revealed in the lower panel of the diffractogram, the Residual and Error intensities persist low and stable across the entire 5°-to-90° 2 Ɵ range. This absence of statistical “noise” or stray Bragg reflections validate that the purified sample is a homogeneous amorphous solid. Structural purity of the sample equates with the stable logarithmic decay observed in the UV-Vis spectral analysis, producing a predictable experimental framework for utilizing this eumelanin in finishing application on solid surface.

3.6. Phase III: Optimization of Functionalization of Eumelanin Through RSM

Structurally and functionally stable functionalized eumelanin on thin quartz surface was developed through CCD. To resolve non-linear interdependencies between Eumelanin Concentration (M) and Agitation Speed (N), a multivariate approach was developed to its effect on absorbance at 220 nm (Y) as a high-resolution proxy for pigment retention and structural stability against energy-induced degradation [5,27].
The developed CCD comprises 13 randomized trials integrated with four factorial points, four axial points, and five central to define the parameter boundaries where photo absorption is maximized without compromising the structural integrity of the eumelanin. The empirical data obtained that correlate the mass density and kinetic energy to eumelanin functionality are cataloged in Table 24.
The reliability of the second-order polynomial model is validated using several statistical data as tabulated in Table 25. Here, the regression model exhibited a high degree of alignment, with a robust F-ratio of 37.34 (p < 0.0001), confirming a highly significant linear relationship between Eumelanin Concentration (M) and Agitation Speed (N) [72,73]. The adequacy of the model was further validated by a non-significant Lack of F, which determined the p-value to be 0.8130, proving that the model effectively captures the underlying process kinetics effectively [77].
The analysis reveals that the difference between R2 (0.9639) and Adjusted R2 (0.9380) is narrow, establishing a robust correlation between empirical stability and theoretical forecasts [75,78]. The model further validates with the RMSE of 0.0392 relative to a Mean Response of 1.0762, indicating that it typically predicts values with the deviations of approximately 3.64%, suggesting a strong predictive performance of the model. Furthermore, exceptional experimental reliability was established by the C.V. of 3.64% [76].
The deconvolution of experimental variables through second-order polynomial modeling offers a Comprehensive basis for interpreting the individual and synergistic contributions of Eumelanin Concentration (M) and Agitation Speed (N). As detailed in the regression coefficients of Table 26, stability of eumelanin is significantly governed by both linear and second-order terms (p < 0.05), allowing the empirical relationship to be formalized in the following coded predictive Equation (6) [79].
Y = 0.6895996 + 0.0489109 M + 0.001711 N + 0.00008 M N + ( 0.00404 ) M M + ( 0.0000034 ) N N
The Intercept of 1.2220 represents the optimized response at the design center of 10 mg mL−1, 300 rpm, with a high t-ratio of 69.72 (p < 0.0001) confirming foundational stability [103,104,105]. Linear analysis reveals a contrast, where Concentration (M) negatively impacts absorbance stability above the center point with the coded estimate of −0.0394 and p value of 0.0248 due to particle over-crowding, while Agitation Speed (N) serves as the primary driver for dispersion with the coded estimate of +0.0942 and p value of 0.0003.
The significant interaction term MN (0.0800, p = 0.0047) demonstrates a synergistic effect where increased agitation is essential at higher concentrations to overcome inter-particle van der Waals forces. Quadratic terms with negative values, MM with value of -0.1010 (p = 0.0003) and NN with value of −0.1360 (p < 0.0001), develop a definitive parabolic peak, suggesting that exceeding Eumelanin Concentration (M) and Agitation Speed (N) induces mechanical shear or over-aggregation, respectively [106]. Substituting an uncoded estimate into the quadratic model predicted absorbance of 1.2220, suggesting a very close alignment with the experimental average and validating the high predictive accuracy of model. The model predicted Eumelanin Concentration (M) of 10 mg mL−1 and Agitation Speed (N) speed of 300 rpm as the optimum. For the Diagnostics Check for Model Adequacy, there was a deviation from the Centre point (M: 10 mg mL−1, N: 300 rpm) with a sharp decrease in UV absorbance (Y), signifying a reduction in the density of functionalized eumelanin.
The model reveals the highly significant negative quadratic terms for both Eumelanin Concentration (MM, p = 0.0003) and Agitation Speed (NN, p < 0.0001). Here, Agitation Speed (N) was identified as the primary driver of the absorbance, with a t-ratio of −9.15 for its quadratic component. The results reveal that that the structural and functional integrity of the eumelanin is exceptionally sensitive to Agitation Speed (N), where excessive kinetic energy disrupts the stabilized functionalized eumelanin.
The prevalence of Agitation Speed (N), exerting a statistical influence nearly three times more significant than Eumelanin Concentration (M), confirms that eumelanin retention is regulated mainly by the kinetic energy environment rather than simple mass density of the eumelanin. The mathematical proof of this parabolic relationship confirms a definitive optimum area at 10 mg mL−1 of Eumelanin Concentration (M) and 300 rpm of Agitation Speed (N). Deviance from this limit, the significant interaction effect (MN, p = 0.0047), suggests a complex rheological dependency as Eumelanin Concentration (M) increases, where eumelanin becomes increasingly sensitive to agitation-induced degradation. This may be due to increased local viscosity that facilitates localized heat generation or induces molecular re-aggregation of the oligomers, thereby reducing spectral absorbance.
The experimental model is validated empirically at 10 mg mL−1 of Eumelanin Concentration (M) and 300 rpm of Agitation Speed (N) in triplicates. To confirm the reliability of the CCD framework, empirical validation was performed at the optimized coordinates identified by the model (10 mg mL−1 and 300 rpm). The polynomial second-order model predicted that absorbance of 1.2220 at 220 nm fits very well with the experimental average performed in replicates, falling precisely within the predicted 95% confidence interval. Hence, this model yielded a robust regression model for the industrial scaling of functionalized eumelanin with structural and functional integrity.

3.7. Phase IV: Functional Validation of Finished Eumelanin

3.7.1. Stage 1: Optical Performance of Finished Eumelanin

  • Field Emission Scanning Electron Microscopy (FE-SEM)
Morphological characteristics of the functionalized eumelanin of quartz surface are analysed using FE-SEM; they exhibit a highly consistent granular morphology of oligomers (Figure 6). FE-SEM analysis revealed that the functionalized eumelanin is composed of highly consistent, densely packed, fused nanospheres. The structural arrangements on quartz surface revealed that optimized Eumelanin Concentration (M) and Agitation Speed (N) in s successfully maintained the native particulate form of the eumelanin while preventing the formation of large, disordered aggregates that could compromise photoprotective properties of the functionalized quartz surface.
FE-SEM analysis of the purified eumelanin sample identified nano granules ranging from 82.74 nm to 136.7 nm, and, interestingly, while nano-finished eumelanin on the quartz surface showed refined granular ultrastructure with fused nanospheres in the 53.96-to-97.12 nm range. This shift indicates that the optimization process facilitated surface coating of eumelanin with a more densely packed, fine-grained morphology, and that it prevented the large-scale irreversible aggregation of the oligomers. This process favored the high surface area per given volume of eumelanin on quartz surface necessary for effective photo-harvesting properties of the functionalized surface.
  • Energy-dispersive X-ray spectroscopy (EDS)
Elemental confirmation through EDS is presented in Figure 7, confirming that functionalized quartz surface is chemically pure. The EDS spectra exhibit the dominant peaks for Carbon, Oxygen, and Nitrogen, respectively, at 51.19%, 32.8%, and 15.1%. These elements are fundamental building blocks of the eumelanin. No extraneous inorganic peaks were registered, ensuring clean eumelanin finished on quartz plates. The EDS profile of both dry powder- and quartz-finished eumelanin confirms highs predominated by Carbon, Oxygen, and Nitrogen, with C:N ratio of 3.38.
The EDS profiles remain consistent, with both stages confirming a high-purity organic matrix dominated by Carbon, Oxygen, and Nitrogen. The initial characterization noted a C:N ratio of 3.88, characteristic of the DHI/DHICA indole-based scaffold [91]. No presence of Sodium (Na) and Chlorine (Cl) is registered, ensuring that the functionalized solid surface has photoelectric properties rather than the ionic impurities. The uncharacterized peaks in Figure 7 represent the conductive gold (Au) coating used for high-resolution imaging, and such instrumental artifacts do not represent impurities of the eumelanin matrix.
  • Fourier Transform Infrared Spectroscopy (FTIR)
The molecular fingerprint of nano-finished eumelanin on quartz surface was performed via FTIR spectroscopy (Figure 8). The spectral analysis revealed a characteristic profile of surface coated eumelanin with relatively low signal intensity, reflecting the modest concentration of eumelanin on the quartz surface.
A well-defined peak at 2982.09 cm−1 is associated with aliphatic C-H stretching vibrations, validating the presence of the hydrocarbon framework. The most prominent peak at 1576.45 cm−1 is attributed to C=C and C=N skeletal vibrations due to indole and pyrrole rings. This characteristic profile validates the structural integrity of the backbone of the eumelanin, indicating preservation of the aromatic framework during functionalization of eumelanin on quartz [95]. In addition to this, the low intensity peak at 997 cm−1 represents the out-of-plane C-H bending environment, validating the aromatic nature of the eumelanin.
  • UV-Vis Spectrophotometry
Optical characterization (Figure 9) exhibits the monotonic exponential decrease in absorbance with increasing wavelength from 200 to 600 nm, typical of natural eumelanin. The high absorbance in the UV-C region and the absence of sharp discrete peaks signify the broad-spectrum photon-harvesting capability provided by the extensive π-π-conjugated system. This characteristic profile validates the successful retention of the pigment’s optical density and electronic resonance.
  • X-ray diffraction (XRD)
The semi-crystalline nature of the finished eumelanin is substantiated by XRD pattern analysis (Figure 10). The characteristic disordered π-π-stacking arrangement of the indolic planar sheets is confirmed by a significant broad diffraction halo centered at 2Ɵ 25°. Interplanar spacing around 3.4 Å is required due to its readiness as an efficient photo absorptive property.

3.7.2. Stage 2: Durability Testing

A durability test was performed to determine the bleaching behavior of the eumelanin finished on the quartz slide. It was systematically performed against bromine water, hydrogen peroxide, and potassium permanganate [107].
Bromine Water: Exposure of eumelanin finished on quartz slide to 1% bromine water yielded a slight lightening of the surface, yet the sample retained a significant degree of its characteristic light-brown pigmentation, suggesting that it retained a photo-shield effect of eumelanin.
Hydrogen Peroxide (10%): The eumelanin finished on a quartz slide demonstrated notable stability on treatment with 10% H2O2, retaining a slight lightening of the quartz surface, yet the sample retained a significant degree of its characteristic light-brown pigmentation, suggesting that it retained a photo-shield effect of eumelanin.
Potassium Permanganate: Eumelanin finished on a quartz slide treatment with 1%KMnO4 showed a slight lightening of the solid surface. However, the sample showed a characteristic of degree of its characteristic light-brown pigmentation, suggesting that it retained the photo-shield effect of eumelanin.
These observations provide preliminary qualitative evidence of resistance to visible bleaching under the tested chemical exposures.

3.7.3. Stage 3: Biological Stability

Efficacy of the functional photoprotective of optimized squid eumelanin coated-quartz films was validated through a microbial challenge assay using indicator strains, such as Escherichia coli (ATCC 25922), Staphylococcus aureus (ATCC 25923), and Bacillus subtilis (ATCC 6633). While squid eumelanin coated-quartz films were optimized to target peak optimal density at the Far-UVC threshold (220 nm), its subsequent application was performed against a standard high-energy germicidal UVC radiation profile (254 nm) with incident fluence of 0.225 J cm−2 [32]. Indicator strains in plain and uncoated quartz dishes that were exposed directly resulted in complete lethal inactivation, reducing cell viability below the lower limit of the detection (CFU mL−1).
Direct exposure of the indicator strains that were uncoated and UV-Exposed (III Group) resulted in microbial inactivation, driving the viability of the cells to below the assays’ lower limit of detection (<10 CFU mL−1). Meanwhile, indicator strains shielded by the optimized eumelanin-coated quartz films (Group IV) demonstrated notably high survival rates, maintaining cell populations in millions on the order of 106 CFU mL−1 (Table 27). The similar microbial counts between Group I and Group II indicate no obvious cytotoxic effect of the coating under the tested conditions.
Biological photoprotection performance was performed through ultraviolet shielding efficiency (SE%) by calculating in relation to the coated unexposed substrate control, as per Equation (7).
S E % = C F U   m L 1 ( G r o u p   I V ) C F U   m L 1 ( G r o u p   I I ) × 100
where CFU mL−1 (Group IV) is eumelanin coated and UV-exposed quartz petri dish (Group IV: Experimental), and CFU mL−1 (Group II) is Coated and unexposed quartz petri dish (Group II: Substrate safety).
The calculated shielding efficiency (SE) of eumelanin-finished quartz plates exhibited a style of 98% for B. subtilis, 96% for S. aureus, and 92% for E. coli. These findings exhibit that thin-layer squid eumelanin coating functions as an effective optical barrier that effectively limits high-energy germicidal photons from penetrating the underlying sample plane [32,108]. The prominent level of the indicator cell photoprotection observed in the B. subtilis cohort points out the potential of these eumelanin-finished films to safeguard complex microenvironments from intense ultraviolet exposure, thereby exhibiting a sustainable path toward advanced radiation-shielding coatings.
The high shielding effect observed across all microbial strains is fundamentally related to the π-π-stacked indolic architecture of the finished eumelanin. As corroborated by the XRD and UV-Vis profile, the interlayer d-spacing of 3.4 Å paves the way for efficient energy dissipation through non-radiative relaxation.
As the UVC photons strikes the eumelanin-coated quartz plate, the extensive conjugation of the DHI and DHICA units that are validated in the EF-SEM and FTIR absorbs the radiation flux and dampens transmission down to an internal transmittance of 10% (A254 ~1.00). Consequently, the physical dose reaching the biological plane is minimized from an incident value of 0.225 J cm−2 down to a heavily attenuated transmitted value of 0.0225 J cm−2, significantly reducing macro-level cellular phototoxicity.
Thus, the empirical response surface optimization of these squid-derived eumelanin coatings provides an effective proof-of-concept platform suitable for future development into transparent ultraviolet protective barriers.

4. Conclusions

This study successfully fills the gap between valorization of seafood industrial processing waste and its application by developing an optimized functionalized eumelanin finished on quartz plates. The novelty of this study lies in its dual-faceted experimental approach, the rigorous statistical optimization of eumelanin extraction from Uroteuthis duvaucelii tailored to target the Far-UVC window (220 nm), and subsequent empirical validation of its photoprotective performance against conventional, hospital-grade germicidal UVC radiation (254 nm).
Unlike conventional photoprotective materials, the optical performance of the purified and functionalized squid eumelanin coated on quartz was predictably modeled using a CCD in the 220 nm range, fulfilling a key requirement for emerging photoprotective applications. The structural, functional robustness, and integrity of the eumelanin backbone, characterized by its uniquely disordered π-π stacking, offers the physical basis for its superior energy dissipation and a biological shielding efficiency of 98% for B. subtilis, 96% for S. aureus, and 92% for E. coli. By shielding cellular models against UV-induced lethality, this work validates the potential of sustainable, squid-derived surface coatings to serve as transparent ultraviolet-attenuating barriers. Ultimately, this study validated a high-value blueprint for the circular economy, offering a competitive, eco-friendly alternative to synthetic UV absorbers.

Author Contributions

Conceptualization, S.M.C. and K.P.N.; methodology, S.M.C. and K.P.N.; validation, S.M.C. and K.P.N.; formal analysis, S.M.C. and K.P.N.; investigation, S.M.C. and K.P.N.; resources, S.M.C. and K.P.N.; data curation, S.M.C. and K.P.N.; writing—original draft preparation, S.M.C. and K.P.N.; writing—review and editing, S.M.C. and K.P.N.; visualization, S.M.C. and K.P.N.; supervision, S.M.C. and K.P.N.; project administration, S.M.C. and K.P.N. All authors have read and agreed to the published version of the manuscript.

Funding

This research received no external funding.

Institutional Review Board Statement

Not applicable.

Informed Consent Statement

Not applicable.

Data Availability Statement

No new data were created or analyzed in this study. Data sharing is not applicable to this article.

Conflicts of Interest

The authors declare no conflict of interest.

References

  1. Anwar, F.; Chaudhry, F.; Nazeer, S.; Zaman, N.; Azam, S. Causes of Ozone Layer Depletion and Its Effects on Human: Review. Atmos. Clim. Sci. 2016, 6, 129–134. [Google Scholar] [CrossRef]
  2. Siddiqui, S.S.; Jha, A.; Konar, N.; Ranganathan, P.; Deshpande, D.D.; Divatia, J.V. Radiation exposure among medical professionals working in the Intensive Care Unit. Indian J. Crit. Care Med. 2014, 18, 591–595. [Google Scholar] [CrossRef] [PubMed]
  3. Cadet, J.; Douki, T. Formation of UV-induced DNA damage contributing to skin cancer development. Photochem. Photobiol. Sci. 2018, 17, 1816–1841. [Google Scholar] [CrossRef] [PubMed]
  4. Yeager, D.G.; Lim, H.W. What’s New in Photoprotection: A Review of New Concepts and Controversies. Dermatol. Clin. 2019, 37, 149–157. [Google Scholar] [CrossRef] [PubMed]
  5. Elangovan, S.; Arumugam, S. Purification, characterization, and biological activities of melanin pigment isolated from Indian squid Uroteuthis duvaucelii. Aquacult. Int. 2023, 31, 3095–3108. [Google Scholar] [CrossRef]
  6. Terranova, M.L.; Tamburri, E. Understanding the way eumelanin works: A unique example of properties and skills driven by molecular heterogeneity. Polymer 2021, 229, 123952. [Google Scholar] [CrossRef]
  7. Choudhury, A.; Ghosh, D. Charge transfer in DHICA eumelanin-like oligomers: Role of hydrogen bonds. Chem. Commun. 2020, 56, 10481–10484. [Google Scholar] [CrossRef] [PubMed]
  8. Micillo, R.; Panzella, L.; Iacomino, M.; Prampolini, G.; Cacelli, I.; Ferretti, A.; Crescenzi, O.; Koike, K.; Napolitano, A.; D’iSchia, M. Eumelanin broadband absorption develops from aggregation-modulated chromophore interactions under structural and redox control. Sci. Rep. 2017, 7, 41532. [Google Scholar] [CrossRef] [PubMed]
  9. El Ghoubary, N.M.; Fadel, M.; Fadeel, D.A.A. Self-assembled surfactant-based nanoparticles as a platform for solubilization and enhancement of the photothermal activity of sepia melanin. Beni-Suef. Univ. J. Basic Appl. Sci. 2023, 12, 13. [Google Scholar] [CrossRef]
  10. Solano, F. Melanin and Melanin-Related Polymers as Materials with Biomedical and Biotechnological Applications—Cuttlefish Ink and Mussel Foot Proteins as Inspired Biomolecules. Int. J. Mol. Sci. 2017, 18, 1561. [Google Scholar] [CrossRef] [PubMed]
  11. Clancy, C.M.; Simon, J.D. Ultrastructural organization of eumelanin from Sepia officinalis measured by atomic force microscopy. Biochemistry 2001, 40, 13353–13360. [Google Scholar] [CrossRef] [PubMed]
  12. Guo, L.; Li, W.; Gu, Z.; Wang, L.; Guo, L.; Ma, S.; Li, C.; Sun, J.; Han, B.; Chang, J. Recent Advances and Progress on Melanin: From Source to Application. Int. J. Mol. Sci. 2023, 24, 4360. [Google Scholar] [CrossRef] [PubMed]
  13. Mavridi-Printezi, A.; Menichetti, A.; Mordini, D.; Montalti, M. Functionalization of and through Melanin: Strategies and Bio-Applications. Int. J. Mol. Sci. 2023, 24, 9689. [Google Scholar] [CrossRef] [PubMed]
  14. Saini, A.S.; Melo, J.S. One-pot green synthesis of eumelanin: Process optimization and its characterization. RSC Adv. 2015, 5, 47671–47680. [Google Scholar] [CrossRef]
  15. Brenner, M.; Hearing, V.J. The protective role of melanin against UV damage in human skin. Photochem. Photobiol. 2008, 84, 539–549. [Google Scholar] [CrossRef] [PubMed]
  16. American Chemical Society. Chemistry in Context: Applying Chemistry to Society, Lab Guide, 11th ed.; McGraw Hill: Washington, DC, USA, 2024. [Google Scholar]
  17. Carpenter, K.E.; Niem, V.H. (Eds.) FAO Species Identification Guide for Fishery Purposes. In The Living Marine Resources of the Western Central Pacific, Vol. 2, Cephalopods, Crustaceans, Holothurians and Sharks; FAO: Rome, Italy, 1998; Available online: https://www.fao.org/4/w7192e/w7192e00.htm (accessed on 29 June 2026).
  18. Jereb, P.; Roper, C.F.E. (Eds.) Cephalopods of the World, an Annotated and Illustrated Catalogue of Cephalopod Species Known to Date, Vol. 2. Myopsid and Oegopsid Squids; FAO Species Catalogue for Fishery Purposes; FAO: Rome, Italy, 2010; Available online: https://www.fao.org/4/i3489e/i3489e.pdf (accessed on 29 June 2026).
  19. Bligh, E.G.; Dyer, W.J. A rapid method of total lipid extraction and purification. Can. J. Biochem. Physiol. 1959, 37, 911–917. [Google Scholar] [CrossRef] [PubMed]
  20. Lowry, O.H.; Rosebrough, N.J.; Farr, A.L.; Randall, R.J. Protein measurement with the Folin phenol reagent. J. Biol. Chem. 1951, 193, 265–275. [Google Scholar] [CrossRef]
  21. Stauß, A.C.; Fuchs, C.; Jansen, P.; Repert, S.; Alcock, K.; Ludewig, S.; Rozhon, W. The Ninhydrin Reaction Revisited: Optimisation and Application for Quantification of Free Amino Acids. Molecules 2024, 29, 3262. [Google Scholar] [CrossRef] [PubMed]
  22. DuBois, M.; Gilles, K.A.; Hamilton, J.K.; Rebers, P.A.; Smith, F. Colorimetric Method for Determination of Sugars and Related Substances. Anal. Chem. 1956, 28, 350–356. [Google Scholar] [CrossRef]
  23. Folch, J.; Lees, M.; Sloane Stanley, G.H. A simple method for the isolation and purification of total lipides from animal tissues. J. Biol. Chem. 1957, 226, 497–509. [Google Scholar] [CrossRef] [PubMed]
  24. Kalra, Y.P. Handbook of Reference Methods for Plant Analysis; CRC Press: Boca Raton, FL, USA, 1998; pp. 1–320. [Google Scholar] [CrossRef]
  25. AOAC International. Official Methods of Analysis of AOAC International, 22nd ed.; AOAC International: Gaithersburg, MD, USA, 2023. [Google Scholar] [CrossRef]
  26. Layne, E. Spectrophotometric and Turbidimetric Methods for Measuring Proteins. In Methods in Enzymology; Colowick, S.P., Kaplan, N.O., Eds.; Academic Press: New York, NY, USA, 1957; Volume 3, pp. 447–454. [Google Scholar] [CrossRef]
  27. Reinmuth-Selzle, K.; Tchipilov, T.; Backes, A.T.; Tscheuschner, G.; Tang, K.; Ziegler, K.; Lucas, K.; Pöschl, U.; Fröhlich-Nowoisky, J.; Weller, M.G. Determination of the protein content of complex samples by aromatic amino acid analysis, liquid chromatography-UV absorbance, and colorimetry. Anal. Bioanal. Chem. 2022, 414, 4457–4470. [Google Scholar] [CrossRef] [PubMed]
  28. Mahajan, S.G.; Nandre, V.S.; Kodam, K.M.; Kulkarni, M.V. One-pot synthesis of black biopolymeric eumelanin pigment by indigenous salt-tolerant Pseudomonas stutzeri SGM-1. Mater. Adv. 2024, 5, 1462–1467. [Google Scholar] [CrossRef]
  29. Correa, N.; Covarrubias, C.; Rodas, P.I. Differential Antifungal Activity of Human and Cryptococcal Melanins with Structural Discrepancies. Front. Microbiol. 2017, 8, 1292. [Google Scholar] [CrossRef] [PubMed]
  30. Thathachari, Y.T.; Blois, M.S. Physical studies on melanins. II. X-ray diffraction. Biophys. J. 1969, 9, 77–89. [Google Scholar] [CrossRef] [PubMed][Green Version]
  31. Jain, A.; Jain, R.; Jain, S. Preparation of Buffer Solution and Measurement of pH. In Basic Techniques in Biochemistry, Microbiology and Molecular Biology; Springer Protocols Handbooks; Humana: New York, NY, USA, 2020; pp. 3–9. [Google Scholar] [CrossRef]
  32. Lorenzo-Leal, A.C.; Tam, W.; Kheyrandish, A.; Mohseni, M.; Bach, H. Antimicrobial Activity of Filtered Far-UVC Light (222 nm) against Different Pathogens. BioMed Res. Int. 2023, 2023, 2085140. [Google Scholar] [CrossRef] [PubMed]
  33. Derby, C.D. Cephalopod Ink: Production, Chemistry, Functions and Applications. Mar. Drugs 2014, 12, 2700–2730. [Google Scholar] [CrossRef] [PubMed]
  34. Nadarajah, S.K.; Vijayaraj, R.; Mani, J. Therapeutic significance of Loligo vulgaris (Lamarck, 1798) ink extract: A biomedical approach. Pharmacogn. Res. 2017, 9, S105–S109. [Google Scholar] [CrossRef] [PubMed]
  35. Prota, G.; Ortonne, J.P.; Voulot, C.; Khatchadourian, C.; Nardi, G.; Palumbo, A. Occurrence and properties of tyrosinase in the ejected ink of cephalopods. Comp. Biochem. Physiol. B 1981, 68, 415–419. [Google Scholar] [CrossRef]
  36. Lemaster, J.E.; Jeevarathinam, A.S.; Kumar, A.; Chandrasekar, B.; Chen, F.; Jokerst, J.V. Synthesis of Ultrasmall Synthetic Melanin Nanoparticles by UV Irradiation in Acidic and Neutral Conditions. ACS Appl. Bio Mater. 2019, 2, 4667–4674. [Google Scholar] [CrossRef] [PubMed]
  37. Lee, C.C.; Le, T.D.; Pham, B.P. Nature’s Solvent Solution: Harnessing Natural Deep Eutectic Solvents (NADES) For Clean, Efficient Protein Isolation. Food Anal. Methods 2026, 19, 2. [Google Scholar] [CrossRef]
  38. Pralea, I.E.; Moldovan, R.C.; Petrache, A.M.; Ilieș, M.; Hegheș, S.-C.; Ielciu, I.; Nicoară, R.; Moldovan, M.; Ene, M.; Radu, M.; et al. From Extraction to Advanced Analytical Methods: The Challenges of Melanin Analysis. Int. J. Mol. Sci. 2019, 20, 3943. [Google Scholar] [CrossRef] [PubMed]
  39. Berth, M.; Delanghe, J. Protein precipitation as a possible important pitfall in the clinical chemistry analysis of blood samples. Acta Clin. Belg. 2004, 59, 263–273. [Google Scholar] [CrossRef] [PubMed]
  40. Puopolo, T.; Seeram, N.P.; Liu, C. Chloroform/Methanol Protein Extraction and In-solution Trypsin Digestion Protocol for Bottom-up Proteomics Analysis. Bio-Protoc 2024, 14, e5055. [Google Scholar] [CrossRef] [PubMed]
  41. Van Wychen, S.; Rowland, S.M.; Lesco, K.C.; Shanta, P.V.; Dong, T.; Laurens, L.M.L. Advanced mass balance characterization and fractionation of algal biomass composition. J. Appl. Phycol. 2021, 33, 2695–2708. [Google Scholar] [CrossRef]
  42. Rose, A.; Showman, C.; Shen, C.; Jaczynski, J.; Matak, K. Effect of organic solvent on the extraction of lipids from krill powders using a one-step extraction process. J. Agric. Food Res. 2024, 16, 101072. [Google Scholar] [CrossRef]
  43. Abidin, F.; Sulmartiwi, L.; Saputra, E. Characteristics physicochemical of melanin from squid ink (Loligo sp.) extracted by ethanol. IOP Conf. Ser. Earth Environ. Sci. 2021, 679, 012038. [Google Scholar] [CrossRef]
  44. Xie, W.; Dhinojwala, A.; Gianneschi, N.C.; Shawkey, M.D. Interactions of Melanin with Electromagnetic Radiation: From Fundamentals to Applications. Chem. Rev. 2024, 124, 7165–7213. [Google Scholar] [CrossRef] [PubMed]
  45. Vera, J.C. Measurement of microgram quantities of protein by a generally applicable turbidimetric procedure. Anal. Biochem. 1988, 174, 187–196. [Google Scholar] [CrossRef] [PubMed]
  46. Soto-Gómez, D.; Pérez-Rodríguez, P.; López-Periago, J.E.; Paradelo, M. Sepia ink as a surrogate for colloid transport tests in porous media. J. Contam. Hydrol. 2016, 191, 88–98. [Google Scholar] [CrossRef] [PubMed]
  47. Bandyopadhyay, M.; Nickerson, M.T.; Ghosh, S. Effect of mild fractionation conditions on the composition, interfacial and emulsifying properties of water-soluble fractions from faba bean flour. J. Agric. Food Res. 2025, 21, 101763. [Google Scholar] [CrossRef]
  48. Singh, T.K.A.; Blacklock, B.J.; Wientzek, M.; Ryan, R.O. A turbidimetric assay of lipid transfer activity. Anal. Biochem. 1992, 206, 137–141. [Google Scholar] [CrossRef] [PubMed]
  49. Plüisch, C.S.; Stuckert, R.; Wittemann, A. Hybrid Nanoparticles Separated by Buoyant Density in a Large-Scale Centrifugal Process. J. Polym. Sci. 2025, 63, 21. [Google Scholar] [CrossRef]
  50. Iverson, S.J.; Lang, S.L.C.; Cooper, M.H. Comparison of the Bligh and Dyer and Folch methods for total lipid determination in a broad range of marine tissue. Lipids 2001, 36, 1283–1287. [Google Scholar] [CrossRef] [PubMed]
  51. Qi, Y.; Xu, X.L.; Yang, Z. Insight into the Effect of Carnosine on the Dispersibility of Myosin Under a Low-salt Condition and its Mechanism. Food Biophys. 2022, 18, 71–81. [Google Scholar] [CrossRef]
  52. Liu, S.; Liu, X.; Zhang, X.; Su, Y.; Chen, X.; Cai, S.; Liao, D.; Pan, N.; Su, J.; Chen, X.; et al. Exploring the Potential of Water-Soluble Squid Ink Melanin: Stability, Free Radical Scavenging, and Cd2+ Adsorption Abilities. Foods 2023, 12, 3963. [Google Scholar] [CrossRef] [PubMed]
  53. Shirai, T.; Kikuchi, N.; Matsuo, S.; Inada, H.; Suzuki, T.; Hirano, T. Extractive Components of the Squid Ink. Fish. Sci. 1997, 63, 939–944. [Google Scholar] [CrossRef]
  54. Grossmann, L.; Hinrichs, J.; Weiss, J. Solubility and aggregation behavior of protein fractions from the heterotrophically cultivated microalga Chlorella protothecoides. Food Res. Int. 2019, 116, 283–290. [Google Scholar] [CrossRef] [PubMed]
  55. Guo, X.; Chen, S.; Hu, Y.; Li, G.; Liao, N.; Ye, X.; Liu, D.; Xue, C. Preparation of water-soluble melanin from squid ink using ultrasound-assisted degradation and its anti-oxidant activity. J. Food Sci. Technol. 2014, 51, 3680–3690. [Google Scholar] [CrossRef] [PubMed]
  56. Jaramillo, D.P.; Roberts, R.F.; Coupland, J.N. Effect of pH on the properties of soy protein–pectin complexes. Food Res. Int. 2011, 44, 911–916. [Google Scholar] [CrossRef]
  57. Christie, W.W.; Han, X. Lipid Analysis: Isolation, Separation, Identification and Lipidomic Analysis, 4th ed.; Woodhead Publishing: Cambridge, UK, 2010. [Google Scholar] [CrossRef]
  58. Gaylord, N.G.; Gibbs, J.H. Physical chemistry of macromolecules. J. Polym. Sci. 1962, 62, S22–S23. [Google Scholar] [CrossRef]
  59. Peters, T.J. Partition of Cell Particles and Macromolecules, 3rd ed.; John Wiley and Sons: Chichester, UK, 1986. [Google Scholar] [CrossRef]
  60. Walter, H.; Johansson, G.; Brooks, D.E. Partitioning in aqueous two-phase systems: Recent results. Anal. Biochem. 1991, 197, 1–18. [Google Scholar] [CrossRef] [PubMed]
  61. Wingfield, P. Protein precipitation using ammonium sulfate. Curr. Protoc. Protein Sci. 2001, 13, 1–10. [Google Scholar] [CrossRef] [PubMed]
  62. Vate, N.K.; Benjakul, S. Effect of the mixtures of squid ink tyrosinase and tannic acid on properties of sardine surimi gel. J. Food Sci. Technol. 2016, 53, 411–420. [Google Scholar] [CrossRef] [PubMed]
  63. Oliveira, L.B.A.; Fonseca, T.L.; Cabral, B.J.C.; Coutinho, K.; Canuto, S. Hydration effects on the electronic properties of eumelanin building blocks. J. Chem. Phys. 2016, 145, 084501. [Google Scholar] [CrossRef] [PubMed]
  64. Su, J.; Cavaco-Paulo, A. Effect of ultrasound on protein functionality. Ultrason. Sonochem. 2021, 76, 105653. [Google Scholar] [CrossRef] [PubMed]
  65. Thirunavookarasu, S.N.; Kumar, S.; Rawson, A. Effect of Ultrasonication on the Protein-Polysaccharide Complexes: A Review. J. Food Meas. Charact. 2022, 16, 4860–4879. [Google Scholar] [CrossRef]
  66. He, X.; Yang, W.; Qin, X. Ultrasound-assisted multilayer Pickering emulsion fabricated by WPI-EGCG covalent conjugates for encapsulating probiotics in colon-targeted release. Ultrason. Sonochem. 2023, 97, 106450. [Google Scholar] [CrossRef] [PubMed]
  67. Wang, L.; Weller, C.L. Recent advances in extraction of nutraceuticals from plants. Trends Food Sci. Technol. 2006, 17, 300–312. [Google Scholar] [CrossRef]
  68. Singh, P.; Sharma, B.; Sidhu, K. Thermodynamics of chloroform and methanol mixtures. Can. J. Chem. 1979, 57, 387–393. [Google Scholar] [CrossRef]
  69. Meredith, P.; Sarna, T. The physical and chemical properties of eumelanin. Pigment Cell Res. 2006, 19, 572–594. [Google Scholar] [CrossRef] [PubMed]
  70. Chemat, F.; Rombaut, N.; Sicaire, A.G.; Meullemiestre, A.; Fabiano-Tixier, A.-S.; Abert-Vian, M. Ultrasound assisted extraction of food and natural products: Mechanisms, techniques, combinations, protocols and applications. A review. Ultrason. Sonochem. 2017, 34, 540–560. [Google Scholar] [CrossRef] [PubMed]
  71. Moradi, M.; Fazlzadehdavil, M.; Pirsaheb, M.; Mansouri, Y.; Khosravi, T.; Sharafi, K. Response surface methodology (RSM) and its application for optimization of ammonium ions removal from aqueous solutions by pumice as a natural and low cost adsorbent. Arch. Environ. Prot. 2016, 42, 33–43. [Google Scholar] [CrossRef]
  72. Yusuff, A.S. Optimization of adsorption of Cr(VI) from aqueous solution by Leucaena leucocephala seed shell activated carbon using design of experiment. Appl. Water Sci. 2018, 8, 232. [Google Scholar] [CrossRef]
  73. Ani, I.J.; Okafor, J.O.; Olutoye, M.A.; Akpan, U.G. Optimization of base oil regeneration from spent engine oil via solvent extraction. Adv. Res. 2015, 4, 403–411. [Google Scholar] [CrossRef]
  74. Wang, W.; Lu, Y. Analysis of the Mean Absolute Error (MAE) and the Root Mean Square Error (RMSE) in Assessing Rounding Model. IOP Conf. Ser. Mater. Sci. Eng. 2018, 324, 012049. [Google Scholar] [CrossRef]
  75. Hu, Z.; Follmann, D.A.; Wang, N. Estimation of mean response via effective balancing score. Biometrika 2014, 101, 613–624. [Google Scholar] [CrossRef] [PubMed]
  76. Aronhime, S.; Calcagno, C.; Jajamovich, G.H.; Dyvorne, H.A.; Robson, P.; Dieterich, D.; Fiel, M.I.; Martel-Laferriere, V.; Chatterji, M.; Rusinek, H.; et al. DCE-MRI of the liver: Effect of linear and nonlinear conversions on hepatic perfusion quantification and reproducibility. J. Magn. Reson. Imaging 2014, 40, 90–98. [Google Scholar] [CrossRef] [PubMed]
  77. Rheem, S.; Rheem, I.; Oh, S. Response Surface Methodology Using a Fullest Balanced Model. Korean J. Food Sci. Anim. Resour. 2017, 37, 139–146. [Google Scholar] [CrossRef] [PubMed]
  78. Chicco, D.; Warrens, M.J.; Jurman, G. The coefficient of determination R-squared is more informative than SMAPE, MAE, MAPE, MSE and RMSE in regression analysis evaluation. PeerJ Comput. Sci. 2021, 7, e623. [Google Scholar] [CrossRef] [PubMed]
  79. Garba, Z.N.; Bello, I.; Galadima, A.; Lawal, A.Y. Optimization of adsorption conditions using central composite design for the removal of copper(II) and lead(II) by defatted papaya seed. Karbala Int. J. Mod. Sci. 2016, 2, 20–28. [Google Scholar] [CrossRef]
  80. Pezeshk, S.; Rezaei, M.; Abdollahi, M. Impact of ultrasound on extractability of native collagen from tuna by-product and its ultrastructure and physicochemical attributes. Ultrason. Sonochem. 2022, 89, e106129. [Google Scholar] [CrossRef] [PubMed]
  81. Saeed, M.O.; Azizli, K.; Isa, M.H.; Bashir, M.J. Application of CCD in RSM to obtain optimize treatment of POME using Fenton oxidation process. J. Water Process Eng. 2015, 8, e7–e16. [Google Scholar] [CrossRef]
  82. Jones, B. The prediction profiler at 30. Qual. Eng. 2021, 33, 417–424. [Google Scholar] [CrossRef]
  83. El-Mekkawi, S.A.; Abdelghaffar, R.A.; Abdelghaffar, F.; El-Enin, S.A.A. Application of response surface methodology for color removing from dyeing effluent using de-oiled activated algal biomass. Bull. Natl. Res. Cent. 2021, 45, 80. [Google Scholar] [CrossRef]
  84. Doulah, M.S. A proposed mechanism for the degradation of addition polymers in cavitating ultrasonic fields. J. Appl. Polym. Sci. 1978, 22, 1735–1743. [Google Scholar] [CrossRef]
  85. Tokmakov, A.A.; Kurotani, A.; Sato, K.I. Protein pI and Intracellular Localization. Front. Mol. Biosci. 2021, 8, 775736. [Google Scholar] [CrossRef] [PubMed]
  86. Migliaccio, L.; Gryszel, M.; Đerek, V.; Pezzella, A.; Głowacki, E.D. Aqueous photo(electro)catalysis with eumelanin thin films. Mater. Horiz. 2018, 5, 984–990. [Google Scholar] [CrossRef]
  87. Bischoff, W.; Miller, F. Efficient lack of fit designs that are optimal to estimate the highest coefficient of a polynomial. J. Stat. Plan. Inference 2006, 136, 4239–4249. [Google Scholar] [CrossRef]
  88. Song, W.; Xing, R.; Yang, H.; Gao, K.; Liu, S.; Li, X.; Yu, H.; Li, P. Eumelanin: A natural antioxidant isolated from squid ink by new enzymatic technique and prediction of its structural tetramer. LWT 2023, 188, 115464. [Google Scholar] [CrossRef]
  89. Mbonyiryivuze, A.; Nuru, Z.Y.; Ngom, B.D.; Mwakikunga, B.; Dhlamini, S.M.; Park, E.; Maaza, M. Morphological and Chemical Composition Characterization of Commercial Sepia Melanin. Am. J. Nanomater. 2015, 3, 22–27. [Google Scholar] [CrossRef]
  90. Yue, Y.; Zhao, X. Melanin-Like Nanomedicine in Photothermal Therapy Applications. Int. J. Mol. Sci. 2021, 22, 399. [Google Scholar] [CrossRef] [PubMed]
  91. Del Bino, S.; Ito, S.; Sok, J.; Wakamatsu, K. 5,6-Dihydroxyindole eumelanin content in human skin with varying degrees of constitutive pigmentation. Pigment Cell Melanoma Res. 2022, 35, 622–626. [Google Scholar] [CrossRef] [PubMed]
  92. Qiu, Z.; Wang, S.; Zhao, J.; Cui, L.; Wang, X.; Cai, N.; Li, H.; Ren, S.; Li, T.; Shu, L. Synthesis and Structural Characteristics Analysis of Melanin Pigments Induced by Blue Light in Morchella sextelata. Front. Microbiol. 2023, 14, 1276457. [Google Scholar] [CrossRef] [PubMed]
  93. Abd-EL-Aziz, A.S.; Abed, N.N.; Mahfouz, A.Y.; Fathy, R.M. Production and Characterization of Melanin Pigment from Black Fungus Curvularia soli AS21 ON076460 Assisted Gamma Rays for Promising Medical Uses. Microb. Cell Fact. 2024, 23, 68. [Google Scholar] [CrossRef] [PubMed]
  94. Smith, B.C. The Big Review VI: The C-O Bond. Spectroscopy 2025, 40, 12–18. [Google Scholar] [CrossRef]
  95. Pasieczna-Patkowska, S.; Cichy, M.; Flieger, J. Application of Fourier Transform Infrared (FTIR) Spectroscopy in Characterization of Green Synthesized Nanoparticles. Molecules 2025, 30, 684. [Google Scholar] [CrossRef] [PubMed]
  96. Lea, A. Solubility of Melanins. Nature 1952, 170, 709. [Google Scholar] [CrossRef] [PubMed]
  97. Liu, Q.; Xiao, J.; Liu, B.; Zhuang, Y.; Sun, L. Study on the Preparation and Chemical Structure Characterization of Melanin from Boletus griseus. Int. J. Mol. Sci. 2018, 19, 3736. [Google Scholar] [CrossRef] [PubMed]
  98. Suryanarayanan, T.S.; Ravishankar, J.P.; Venkatesan, G.; Murali, T.S. Characterization of the melanin pigment of a cosmopolitan fungal endophyte. Mycol. Res. 2004, 108, 974–978. [Google Scholar] [CrossRef] [PubMed]
  99. Hou, R.; Liu, X.; Xiang, K.; Chen, L.; Wu, X.; Lin, W.; Zheng, M.; Fu, J. Characterization of the physicochemical properties and extraction optimization of natural melanin from Inonotus hispidus mushroom. Food Chem. 2019, 277, 533–542. [Google Scholar] [CrossRef] [PubMed]
  100. Ou-Yang, H.; Stamatas, G.; Kollias, N. Spectral Responses of Melanin to Ultraviolet a Irradiation. J. Investig. Dermatol. 2004, 122, 492–496. [Google Scholar] [CrossRef] [PubMed]
  101. Ahmad, K.; Kakakhel, M.B.; Hayat, S.; Wazir-Ud-Din, M.; Mahmood, M.M.; Rehman, S.U.; Siddique, M.T.; Mirza, S.M. Thermoluminescence study of pellets prepared using NaCl from Khewra Salt Mines in Pakistan. Radiat. Environ. Biophys. 2021, 60, 365–375. [Google Scholar] [CrossRef] [PubMed]
  102. Alonzo, S.M.M.; Bastakoti, B.P. Expanding the interlayer spacing of MXene through nanoarchitecture design. Mater. Today Nano 2025, 32, 100704. [Google Scholar] [CrossRef]
  103. Gramatica, P. On the Development and Validation of QSAR Models. In Computational Toxicology: Volume II; Methods in Molecular Biology; Humana Press: Totowa, NJ, USA, 2013; Volume 930, pp. 499–526. [Google Scholar] [CrossRef] [PubMed]
  104. Tofigh, N.; Agahi, S.; Riazi, G.; Moazzam, M.G.; Shahpasand, K. A Novel Phosphorylated Tau Conformer Implicated in the Tauopathy Pathogenesis of Human Neurons. Biomolecules 2025, 15, 585. [Google Scholar] [CrossRef] [PubMed]
  105. Magnus, J.R. On Using the t-Ratio as a Diagnostic. Econometrics 2019, 7, 24. [Google Scholar] [CrossRef]
  106. Chen, H.Y.; Chen, C. A Study of the Response Surface Methodology Model with Regression Analysis in Three Fields of Engineering. Appl. Syst. Innov. 2025, 8, 99. [Google Scholar] [CrossRef]
  107. Liu, C.-H.; Lin, C.-H.; Tsai, M.-J.; Chen, W.-T.; Chai, C.-Y.; Huang, Y.-C.; Tsai, K.-B. Melanin Bleaching with Dilute Hydrogen Peroxide: A Simple and Rapid Method. Appl. Immunohistochem. Mol. Morphol. 2013, 21, 275–279. [Google Scholar] [CrossRef] [PubMed]
  108. Haley, O.C.; Zhao, Y.; Bhullar, M. Protocol for Evaluating the Microbial Inactivation of Commercial UV Devices on Plastic Surfaces. Methods Protoc. 2022, 5, 65. [Google Scholar] [CrossRef] [PubMed]
Figure 1. High-resolution FE-SEM micrograph (150,000×) of purified squid eumelanin.
Biophysica 06 00058 g001
Figure 2. EDS elemental analysis and quantitative atomic profile of purified eumelanin.
Biophysica 06 00058 g002
Figure 3. Characteristic FTIR spectrum of purified Indian squid eumelanin identifying key indolic, hydroxylic, and carbonylic functional vibrations.
Biophysica 06 00058 g003
Figure 4. Characteristic spectral profile of purified Indian squid eumelanin showing monotonic exponential decrease with increase in wavelength from 200 to 600 nm.
Biophysica 06 00058 g004
Figure 5. XRD profile of optimized Indian squid eumelanin, visualizing a high-purity, featureless amorphous phase devoid of crystalline mineral artefacts.
Biophysica 06 00058 g005
Figure 6. FE-SEM characterisation of quartz surface showing the Characteristic Nanogranular Morphology of finished Indian Squid Eumelanin on quartz.
Biophysica 06 00058 g006
Figure 7. EDS Elemental Profile confirming the High Carbon, Nitrogen, and Oxygen Eumelanin Purity.
Biophysica 06 00058 g007
Figure 8. FTIR spectral analysis of the functionalized eumelanin on quartz plate.
Biophysica 06 00058 g008
Figure 9. UV-Vis spectra illustrating the Characteristic Monotonic Exponential Decay and Broad-Spectrum Optical Density of quartz surface finished eumelanin.
Biophysica 06 00058 g009
Figure 10. XRD spectral profile of functionalized quartz sheet by finishing with India squid eumelanin demonstrating the Semi-Crystalline Nature and π-π stacking Arrangement of the Eumelanin Scaffold.
Biophysica 06 00058 g010
Table 1. One-Factor-at-a-Time (OFAT) experimental parameters and tested levels for the optimization of eumelanin phase-separation kinetics.
ParameterNotationsTest Range
Relative Centrifugal Force (×g)A89–8944
Centrifugation period (min)B1–19
Note: Throughout the optimization trials, specific experimental constants were maintained to ensure reproducibility. The solvent system comprised chloroform, methanol, and water ratios of 1:2:0.8 v/v/v, with the solvent-to-sample ratio fixed at 4:1. All extractions were performed in capped glass centrifuge tubes with a standardized total volume of 12.5 mL. Samples were processed at a constant temperature of 4 °C, utilizing a cumulative pulsed ultrasonication duration of 30 min at a frequency of 40 kHz.
Table 2. Sequential OFAT parameters and experimental levels for the optimization of eumelanin homogenization from Indian squid ink.
ParameterNotationsTest Range
pH of the extractantC1–13
Concentration of NaCl (%)D0.21–3.21
Exposure to ultrasound (min)E5–30
Temperature (°C)F5–40
Note: The baseline homogenization was performed using a chloroform, methanol, and water solvent system at a ratio of 1:2:0.8 v/v/v. Initial conditions were set at pH 7.0 and supplemented with 0.98% NaCl to maintain ionic consistency. Mechanical disintegration was achieved via 40 kHz pulsed ultrasonication at a 1:1 pulse ratio for a duration of 30 min at 4 °C. These parameters were held constant during the phase-separation stage in a refrigerated fixed-angle rotor centrifuge, except where a factor was designated as an independent variable.
Table 3. Variables and their coded levels during the extraction of the eumelanin into infranatant.
VariablesExperimental NotationsStatistical NotationsLevels
−α−10+1
Ultrasonication Time (minutes)Gxi5.8610203034.14
Temperature (°C)Hxj−15.18−102.51520.18
Note: For the CCD study, fixed values were strictly maintained: pH 7.0 and NaCl concentration 0.98% during homogenization, alongside a Relative Centrifugal Force of 3220× g and centrifugation time of 15 min. The selection of 0.98% NaCl was specifically refined to target the onset of the eumelanin recovery plateau identified during the OFAT phase.
Table 4. Variables and their Coded Levels during acid–base cycling purification.
VariablesExperimental NotationsStatistical NotationsLevels
−α−10+1
pH of the precipitant Ixi2.764.007.0010.0011.24
Number of cycles Jxj2.173.005.007.007.83
Note: Constants are Time per cycle: 30 min, Speed of the agitator: 200 rpm, Dissolution temperature: +2.5 °C.
Table 5. Variables and their Coded Levels during product stabilization of purified melanin.
VariablesExperimental NotationsStatistical NotationsLevels
−α−10+1
Drying Temperature (°C)Kxi51.726080100108.28
Drying Duration (minutes)Lxj380.584807209601059.41
Note: Constants included Initial moisture content: 95%, Sample loading thickness: 2 mm, Relative humidity: 30%, and Air circulation 2 m s−1.
Table 6. Variables and their coded levels during functionalization of eumelanin.
VariablesExperimental NotationsStatistical NotationsLevels
−α−10+1
Eumelanin Concentration (mg/mL)Mxi2.935101517.07
Agitation speed (rpm)Nxj17100300500583
Note: Constants, Dispersion pH: 13, Solvent for Dispersion: Aqueous, Cleaning Solvents (Sonication): Acetone, Ethanol, Deionized Water, Surface Activation Method: Ultraviolet–Ozone, Film Formation Method: Dip-Coating, Drying Curing Temperature: initial curing 25 °C for 30 min and final curing at 90 °C for 30 min, and Substrate Material: Commercially Procured Glass Slides, fixed at constant.
Table 7. Biochemical constituents of raw ink surgically isolated from ink sac of freshly caught Indian squid (U. duvaucelii).
ComponentConstituents
per Squid Ink
(g kg−1 w/w)
Estimated Constituents
per Ink
(g −1 w/w)
Constituents
in Ink
(%) (w/w)
Water (Moisture)760.00 ± 34.960.760 ± 0.03576.00 ± 3.49
Eumelanin121.00 ± 5.690.121 ± 0.00612.10 ± 0.57
Protein58.00 ± 2.090.058 ± 0.0025.80 ± 0.21
Carbohydrates30.00 ± 1.140.030 ± 0.0013.00 ± 0.11
Lipids (Fats)11.00 ± 0.510.011 ± 0.0011.10 ± 0.05
Free Amino Acids10.00 ± 0.440.010 ± 0.0011.00 ± 0.04
Ash (Minerals)5.00 ± 0.190.005 ± 0.0010.50 ± 0.02
Trace Elements5.00 ± 0.200.005 ± 0.0010.50 ± 0.02
Note: Values are mean ± SD (n = 3); major constituents determined by standard gravimetric and spectrophotometric methods.
Table 8. Impact of RCF on phase partitioning, eumelanin recovery, and impurity distribution during the Stage 1 (Phase-separation) OFAT optimization.
RCF
g)
Protein
(Upper Phase,
mg g−1)
Carbohydrates
(Upper Phase, mg g−1)
Lipid
(Lower Phase,
mg g−1)
Corrected OD280
(Inter Phase)
Eumelanin Yield
(Inter Phase, mg 2.5 g−1)
OD220
(Inter Phase)
8944.47 ± 2.09 a24.00 ± 1.13 a8.68 ± 0.41 c0.375 ± 0.006 g238.19 ± 11.19 f0.122 ± 0.006 h
35842.92 ± 1.55 a23.70 ± 0.85 a8.76 ± 0.32 c0.455 ± 0.008 f257.40 ± 9.27 e0.211 ± 0.008 g
80535.31 ± 1.34 b21.00 ± 0.80 a8.98 ± 0.34 c0.535 ± 0.013 e268.92 ± 10.22 e0.340 ± 0.013 f
143133.76 ± 1.55 b20.97 ± 0.96 a9.27 ± 0.43 bc0.642 ± 0.023 d287.75 ± 13.24 d0.507 ± 0.023 e
223631.32 ± 1.38 c20.49 ± 0.90 a9.85 ± 0.43 b0.776 ± 0.027 c318.87 ± 14.03 c0.614 ± 0.027 d
3220 *27.84 ± 1.03 d20.61 ± 0.76 a10.82 ± 0.40 a0.977 ± 0.026 b364.97 ± 13.50 b0.711 ± 0.026 c
43834.18 ± 0.16 e20.13 ± 0.79 a10.84 ± 0.42 a0.987 ± 0.030 ab365.07 ± 14.23 b0.765 ± 0.030 bd
57241.39 ± 0.07 f20.61 ± 0.99 a10.86 ± 0.52 a0.995 ± 0.039 ab367.66 ± 17.65 ab0.816 ± 0.039 ab
72451.10 ± 0.05 fg20.40 ± 0.96 a10.86 ± 0.51 a1.014 ± 0.039 a371.11 ± 17.44 a0.839 ± 0.039 a
89440.70 ± 0.03 g20.60 ± 0.93 a10.87 ± 0.49 a1.022 ± 0.038 a371.50 ± 16.72 a0.851 ± 0.038 a
Note: Values are mean ± SD (n = 3); OD220 and corrected OD280 indicate eumelanin and protein interphase accumulation, respectively. Asterisk (*) denotes the parameter value selected as the optimal center point for subsequent optimization stages. Different superscript letters (a–h) within the same column indicate statistically significant differences (p < 0.05) according to Tukey’s HSD test.
Table 9. Evaluation of centrifugation duration on eumelanin recovery and aqueous phase clarification efficiency at a fixed RCF of 3220× g.
Time, (min)Protein
(Upper Phase,
mg g−1)
Carbohydrates (Upper Phase, mg g−1)Lipid
(Lower Phase,
mg g−1)
Corrected OD280
(Inter Phase)
Eumelanin Yield (Inter Phase,
mg 2.5 g−1)
OD220
(Inter Phase)
150.46 ± 2.37 a24.69 ± 1.16 a10.56 ± 0.50 d0.260 ± 0.011 i99.89 ± 4.70 i0.187 ± 0.009 i
349.30 ± 1.78 a24.99 ± 1.15 a10.67 ± 0.38 cd0.399 ± 0.018 h142.15 ± 5.12 h0.258 ± 0.009 h
548.14 ± 1.83 ab25.13 ± 1.21 a10.73 ± 0.41 bcd0.503 ± 0.026 g184.40 ± 7.01 g0.320 ± 0.012 g
746.98 ± 2.16 b24.99 ± 1.15 a10.77 ± 0.50 bc0.598 ± 0.028 f226.66 ± 10.43 f0.409 ± 0.019 f
946.40 ± 2.04 b25.29 ± 1.11 a10.78 ± 0.47 bc0.668 ± 0.022 e257.40 ± 11.33 e0.472 ± 0.021 e
1140.60 ± 1.50 c25.32 ± 1.19 a10.88 ± 0.40 b0.772 ± 0.037 d288.13 ± 10.66 d0.570 ± 0.021 d
1333.06 ± 1.29 d25.29 ± 1.24 a10.89 ± 0.43 b0.815 ± 0.032 c330.39 ± 12.89 c0.703 ± 0.027 c
15 *28.42 ± 1.36 e25.20 ± 1.22 a10.99 ± 0.53 a0.833 ± 0.035 b368.81 ± 17.70 b0.854 ± 0.041 b
1727.84 ± 1.31 e25.50 ± 1.20 a11.00 ± 0.52 a0.837 ± 0.039 ab374.57 ± 17.62 a0.868 ± 0.041 ab
1926.68 ± 1.20 e24.90 ± 1.12 a10.99 ± 0.50 a0.840 ± 0.032 a379.14 ± 17.09 a0.880 ± 0.040 a
Note: Values are mean ± SD (n = 3); OD220 and corrected OD280 indicate eumelanin and protein interphase accumulation, respectively. Asterisk (*) denotes the parameter value selected as the optimal center point for subsequent optimization stages. Different superscript letters (a–i) within the same column indicate statistically significant differences (p < 0.05) according to Tukey’s HSD test.
Table 10. Effect of pH on partitioning of ink constituents and interphase optical characteristics.
pHProtein
(Upper Phase,
mg g−1)
Carbohydrates (Upper Phase, mg g−1)Lipid
(Lower Phase,
mg g−1)
Corrected OD280
(Inter Phase)
Eumelanin Yield
(Inter Phase,
mg 2.5 g−1)
OD220
(Inter Phase)
124.36 ± 1.18 e26.13 ± 1.23 a10.56 ± 0.38 a0.783 ± 0.025 a365.35 ± 15.71 ab0.694 ± 0.029 c
327.09 ± 1.03 d26.97 ± 1.02 a10.67 ± 0.41 a0.770 ± 0.017 a368.42 ± 12.16 a0.854 ± 0.028 a
528.54 ± 1.20 d25.89 ± 1.24 a10.62 ± 0.49 a0.746 ± 0.024 a369.58 ± 15.89 a0.856 ± 0.033 a
7 *30.16 ± 1.03 c26.79 ± 0.91 a10.89 ± 0.48 a0.723 ± 0.015 a372.61 ± 12.30 a0.863 ± 0.019 a
952.78 ± 1.79 b26.37 ± 0.90 a10.78 ± 0.40 a0.663 ± 0.014 b284.29 ± 9.38 c0.820 ± 0.026 b
1153.35 ± 2.35 ab26.55 ± 1.24 a10.45 ± 0.41 a0.434 ± 0.004 c192.09 ± 7.55 d0.590 ± 0.014 d
1353.75 ± 1.83 a26.67 ± 1.01 a10.78 ± 0.52 a0.183 ± 0.002 d15.37 ± 0.61 e0.170 ± 0.005 e
Note: Data represent Mean ± SD (n = 3). Asterisk (*) denotes the parameter value selected as the optimal center point for subsequent optimization stages. OD280 values are corrected for light scattering (OD280–OD340). Different superscript letters (a–e) within the same column indicate statistically significant differences (p < 0.05) according to Tukey’s HSD test.
Table 11. Effect of ionic strength on partitioning of ink constituents and interphase optical characteristics.
NaCl%Protein
(Upper Phase, mg g−1)
Carbohydrates (Upper Phase, mg g−1)Lipid
(Lower Phase,
mg g−1)
Corrected OD280 (Inter Phase)Eumelanin Yield
(Inter Phase,
mg 2.5 g−1)
OD220
(Inter Phase)
0.2152.65 ± 1.58 a29.80 ± 0.89 a10.26 ± 1.60 a0.080 ± 0.033 e360.50 ± 16.22 c0.746 ± 0.034 c
0.6443.19 ± 0.86 b29.70 ± 0.59 a10.64 ± 1.70 a0.210 ± 0.033 d365.80 ± 15.00 bc0.761 ± 0.031 c
1.07 *35.44 ± 1.17 c29.60 ± 0.98 a10.66 ± 1.80 a0.320 ± 0.013 c379.69 ± 4.10 abc0.897 ± 0.010 a
1.5029.07 ± 1.25 d29.50 ± 1.27 a10.68 ± 2.00 a0.410 ± 0.022 bc375.00 ± 8.25 ab0.882 ± 0.019 a
1.9223.96 ± 0.82 e29.58 ± 1.01 a10.67 ± 2.00 a0.470 ± 0.031 b377.50 ± 12.08 a0.897 ± 0.029 a
2.3519.65 ± 0.70 f29.40 ± 1.05 a10.67 ± 2.00 a0.520 ± 0.022 b379.00 ± 7.96 a0.875 ± 0.018 a
2.7816.12 ± 0.56 g29.49 ± 1.01 a10.79 ± 2.00 a0.600 ± 0.021 a380.50 ± 8.37 a0.863 ± 0.019 b
3.2113.23 ± 0.47 h29.30 ± 1.04 a10.78 ± 2.00 a0.620 ± 0.041 a381.00 ± 12.57 a0.896 ± 0.040 a
Note: Values are tabulated as Mean ± SD (n = 3). Asterisk (*) denotes the parameter value selected as the optimal center point for subsequent optimization stages. OD280 values are corrected for light scattering (OD280–OD340). Different superscript letters (a–h) within the same column indicate statistically significant differences (p < 0.05) according to Tukey’s HSD test.
Table 12. Effect of exposure to ultrasound on partitioning of ink constituents and interphase optical characteristics.
Exposure to Ultra Sound (min)Protein (Upper Phase,
mg g−1)
Carbohydrates
(Upper Phase,
mg g−1)
Lipid (Lower Phase,
mg g−1)
Corrected OD280 (Inter Phase)Eumelanin Yield
(Inter Phase, mg 2.5 g−1)
OD220 (Inter Phase)
58.00 ± 0.32 e29.00 ± 0.13 c4.34 ± 0.15 d0.465 ± 0.015 a150.00 ± 6.45 e0.337 ± 0.011 f
1018.00 ± 0.72 d29.70 ± 0.20 a7.89 ± 0.34 c0.385 ± 0.017 b225.00 ± 9.23 d0.506 ± 0.022 e
1530.00 ± 1.20 b29.40 ± 0.32 ab9.67 ± 0.13 b0.254 ± 0.011 de300.00 ± 14.70 c0.698 ± 0.022 d
20 *42.00 ± 1.68 a29.00 ± 0.18 c10.66 ± 0.23 a0.223 ± 0.010 e380.00 ± 12.54 a0.949 ± 0.011 a
2540.00 ± 1.60 a29.39 ± 0.30 ab10.68 ± 0.36 a0.248 ± 0.005 e377.80 ± 12.85 a0.948 ± 0.037 a
3032.00 ± 1.28 b29.50 ± 0.37 a10.67 ± 0.46 a0.310 ± 0.013 c376.63 ± 13.94 a0.930 ± 0.036 b
3522.00 ± 0.88 c29.04 ± 0.30 c10.67 ± 0.34 a0.372 ± 0.012 b374.98 ± 16.12 a0.947 ± 0.031 a
4015.00 ± 0.60 d28.99 ± 0.24 c10.56 ± 0.37 a0.416 ± 0.009 b374.98 ± 12.00 a0.935 ± 0.033 b
Note: Values tabulated as Mean ± SD (n = 3). Ultrasonication was maintained at a constant frequency of 40 kHz. The 20 min interval (*) represents the statistical maximum for pigment yield before the onset of protein denaturation. Different superscript letters (a–f) within the same column indicate statistically significant differences (p < 0.05) according to Tukey’s HSD test.
Table 13. Impact of temperature on partitioning of ink constituents and interphase optical characteristics.
Temperature (°C)Protein
(Upper Phase,
mg g−1)
Carbohydrates
(Upper Phase,
mg g−1)
Lipid (Lower Phase,
mg g−1)
Corrected OD280 (Inter Phase)Eumelanin Yield (Inter Phase,
mg 2.5 g−1)
OD220 (Inter Phase)
5 *48.48 ± 1.12 a27.20 ± 1.22 a10.50 ± 0.45 a0.080 ± 0.003 g382.50 ± 14.54 a1.035 ± 0.027 a
1045.28 ± 1.49 b27.35 ± 0.98 a10.50 ± 0.24 a0.100 ± 0.004 f380.00 ± 16.72 a0.947 ± 0.037 b
1543.63 ± 1.88 b27.50 ± 0.68 a10.60 ± 0.36 a0.120 ± 0.003 f377.50 ± 8.68 a0.798 ± 0.018 c
2042.06 ± 0.97 c27.55 ± 0.35 a10.70 ± 0.25 a0.150 ± 0.006 e380.00 ± 16.42 a0.749 ± 0.032 d
2539.68 ± 0.48 d27.60 ± 0.62 a10.70 ± 0.48 a0.180 ± 0.008 d377.50 ± 11.70 a0.717 ± 0.032 e
3031.25 ± 1.28 e27.58 ± 1.00 a10.80 ± 0.14 a0.250 ± 0.008 c389.00 ± 4.18 a0.635 ± 0.020 f
3527.52 ± 0.63 f27.45 ± 1.10 a10.80 ± 0.35 a0.300 ± 0.013 b392.00 ± 15.58 a0.546 ± 0.023 g
4022.54 ± 0.52 g27.10 ± 1.16 a10.70 ± 0.35 a0.350 ± 0.008 a381.00 ± 10.64 a0.391 ± 0.009 h
4517.20 ± 0.74 h26.80 ± 1.22 a10.60 ± 0.48 a0.400 ± 0.014 a399.00 ± 15.20 a0.309 ± 0.011 i
Note: Values are mean ± SD (n = 3). OD220 and corrected OD280 track eumelanin and protein impurities, respectively; 5 °C (*) was identified as optimal for maximal pigment recovery and minimal protein co-precipitation. Different superscript letters (a–i) within the same column indicate statistically significant differences (p < 0.05) according to Tukey’s HSD test.
Table 14. Consolidated Optimized parameters of Partitioning Efficiency of eumelanin from other impurities of squid ink through OFAT Screening.
Optimization FactorIdentified OptimumGravimetric Eumelanin Yield,
mg 2.5 g−1
Protein Partitioning (Upper Phase,
mg g−1)
Protein Impurity Marker (Interphase Corrected OD280)Eumelanin Recovery Marker (Interphase OD220)
pH7372.61 ± 12.30 a30.16 ± 1.03 c0.723 ± 0.015 a0.863 ± 0.019 a
Ionic Strength1.07% NaCl379.69 ± 4.10 abc35.44 ± 1.17 c0.320 ± 0.013 c0.897 ± 0.010 a
Ultrasound20 min380.00 ± 12.54 a42.00 ± 1.68 a0.223 ± 0.010 c0.949 ± 0.011 a
Temperature5 °C382.50 ± 14.54 a48.48 ± 1.12 a0.080 ± 0.003 e1.035 ± 0.027 a
Note: Summary of optimal OFAT conditions for eumelanin recovery. Values represent mean ± SD (n = 3). Different superscript letters (a–c,e) within the same column indicate statistically significant differences (p < 0.05) according to Tukey’s HSD test.
Table 15. CCD matrix and resulting eumelanin yield during chloroform–methanol extraction.
RunUltrasonication Time
(min) (G)
Temperature (°C)
(H)
Absorbance at 220 nm (Experimental)
120.0020.181.07
220.002.501.06
35.862.501.04
420.002.501.02
534.142.500.71
620.00−15.180.67
710.00−10.000.79
810.0015.001.09
920.002.501.11
1020.002.501.08
1120.002.501.03
1230.0015.001.02
1330.00−10.000.48
Note: G: Ultrasonication time (min); H: Temperature (°C). The design space was defined by a circumscribed CCD with an axial distance of α = 1.414. Experiments were carried out in a randomized sequence to minimize the influence of systematic errors. The absorbance at 220 nm serves as the response (Y) for eumelanin concentration. Replicates at the center point (Runs 2, 4, 9, 10, 11) were utilized to determine the experimental error, providing a robust estimate of pure error.
Table 16. ANOVA and Global Fit Statistics for the Quadratic Model of Eumelanin Recovery.
Statistic TermDFSum of SquaresMean SquareF-RatioProb > F
Overall Model50.47560.095138.59<0.0001 *
Total Error70.01720.0025--
Lack of Fit30.01300.00433.910.1631 (ns)
Pure Error40.00430.0011--
Total120.4929---
Model Validation Metrics
R20.9650 RMSE0.0497
R2 Adj0.9400 Mean of Response0.9362
Max R20.9890 C. V. %5.31%
Note: *: Significant (p < 0.05), ns: non-significant (p > 0.05), DF: Degrees of Freedom, RMSE: Root Mean Square Error, C.V. %: Coefficient of Variation.
Table 17. Regression Coefficients and Parameter Estimates for the Optimized Extraction of Eumelanin.
Statistic TermCoded
Estimate
Std.
Error
95% Lower95%
Upper
t-RatioProb > F
(p-Value)
Uncoded Estimate
Intercept1.06000.02221.00751.112547.74<0.0001 *0.8589555
Time (G) −0.10580.0176−0.1473−0.0643−6.030.0005 *0.0279664
Temp (H)0.17570.01760.13420.217210.01<0.0001 *0.0077169
GH0.06000.02480.00190.11872.420.0463 *0.00048
GG−0.09940.0188−0.1439−0.0549−5.280.0011 *−0.000994
HH−0.10190.0188−0.1464−0.0574−5.410.0010 *−0.000652
Note: * = Significant (p < 0.05); Coded Estimate: Factor coefficients based on a dimensionless scale (−1 to +1); Uncoded Estimate: Coefficients based on physical units (min, °C). The second-order polynomial model was derived using these estimates to predict the response.
Table 18. Experimental design setup (CCD) and observed absorbance indicative of eumelanin purification yields.
RunpH of the Precipitant (I)Number of Cycles (J)Absorbance at 220 nm (Experimental)
110.007.000.14
24.003.001.04
37.005.001.14
44.007.001.02
511.245.000.09
67.005.001.16
77.005.001.19
87.007.830.81
97.005.001.17
1010.003.000.46
112.765.001.02
127.002.170.96
137.005.001.20
Note: I is pH of the precipitant; J is Number of cycles (n/30 min). Agitation speed maintained at 200 rpm. The experimental design space is defined by a circumscribed CCD with an axial distance (α) of 1.414. Randomized experimental order is employed to nullify time-dependent bias and reduce the influence of extraneous variables. The OD220 serves as the response (Y) for eumelanin concentration. Replicates at the center point at 3, 6, 7, 9, and 13 runs were used to estimate the pure experimental error and affirm the reproducibility of the process of extraction.
Table 19. ANOVA and Global Fit Statistics for the Optimization of Eumelanin purification.
Statistic TermDFSum of SquaresMean SquareF-RatioProb > F
Overall Model51.83970.3679198.21<0.0001 *
Total Error70.01300.0019--
Lack of Fit30.01070.00366.270.0542 (ns)
Pure Error40.00230.0006--
Total121.8527---
Model Validation Metrics:
R20.9930 RMSE0.0431
R2 Adj0.9880 Mean of Response0.8769
Max R20.9988 C. V. %4.9150
Note: *: Significant (p < 0.05); ns: non-significant (p > 0.05); DF: Degrees of Freedom; RMSE: Root Mean Square Error and C.V. %: Coefficient of Variation.
Table 20. Analysis of Regression Coefficients and Significance of Parameter Estimates for the Quadratic Model of purification of Eumelanin.
Statistic TermCoded
Estimate
Std.
Error
95% Lower95%
Upper
t-RatioProb > F
(p-Value)
Uncoded Estimate
Intercept1.17200.01931.12641.217660.83<0.0001 *−1.020805
pH (I) −0.34690.0152−0.3829−0.3109−22.77<0.0001 *0.4481437
Cycles (J)−0.06900.0152−0.1050−0.033−4.530.0027 *0.4461167
IJ−0.07500.0215−0.1259−0.0241−3.480.0102 *−0.0125
II−0.32230.0163−0.3609−0.2836−19.73<0.0001 *−0.035806
JJ−0.15730.0163−0.1959−0.1186−9.630.0001 *−0.039313
Note: *: Significant (p < 0.05); Coded Estimate: Factor coefficients based on a dimensionless scale, −1 to +1; Uncoded Estimate: Coefficients based on physical units, n/30 min. The second-order polynomial model derived using these estimates to predict the absorbance response.
Table 21. Experimental design matrix (CCD) and observed responses for eumelanin stabilization yield monitored at 220 nm.
RunDrying Temperature (°C) (K)Drying Duration (minutes) (L)Absorbance at 220 nm (Experimental)
180.001059.410.810
280.00720.001.210
351.72720.001.113
480.00380.581.101
5100.00480.001.077
680.00720.001.150
780.00720.001.170
880.00720.001.140
960.00480.001.137
10108.28720.000.992
1180.00720.001.190
1260.00960.001.053
13100.00960.000.835
Note: K: Drying Temperature (°C); L: Drying Duration (minutes). The experimental framework focuses on the confined CCD to alleviate systematic bias. Replicates at the design center (Runs 2, 6, 7, 8, and 11) provide the basis for calculating pure experimental errors, ensuring that the final stabilization model is statistically robust for large-scale application.
Table 22. Global Fit Statistics and ANOVA for the Optimization of Stabilization of Eumelanin.
Statistic TermDFSum of SquaresMean SquareF-RatioProb > F
Overall Model50.18470.036939.82<0.0001 *
Total Error70.00650.00093--
Lack of Fit30.00320.00111.310.3880 (ns)
Pure Error40.00330.0008--
Total120.1912---
Model Validation Metrics:
R20.9660 RMSE0.0305
R2 Adj0.9418 Mean of Response1.0753
Max R20.9828 C. V. %2.83%
Note: *: Significant (p < 0.05), ns: non-significant (p > 0.05), DF: Degrees of Freedom, RMSE: Root Mean Square Error, C.V. %: Coefficient of Variation.
Table 23. Parameter Estimates for the Quadratic Model of stabilization of Eumelanin.
Statistic TermCoded
Estimate
Std.
Error
95% Lower95%
Upper
t-RatioProb > F
(p-Value)
Uncoded Estimate
Intercept1.17200.01361.13981.204286.04<0.0001 *−0.593176
Temp (K) −0.05620.01077−0.0816−0.0307−5.220.0012 *0.0248324
Time (L)−0.09220.01077−0.1176−0.0667−8.56<0.0001 *0.0028403
KL−0.03930.0152−0.0753−0.0033−2.580.0364 *−8.193 × 10⁻⁶
KK−0.05440.0115−0.0816−0.0270−4.710.0022 *−0.000136
LL−0.10280.0115−0.1300−0.0754−8.90<0.0001 *−1.784 × 10⁻⁶
Note: *: Significant, p < 0.05, Coded Estimate: Factor coefficients derived from dimensionless scale, −1 to +1, Uncoded Estimate: Factor coefficients derived from original physical units, min, °C, Std. Error: Standard error of the coefficient, 95% Lower or Upper: Confidence intervals for the parameter estimates.
Table 24. CCD experimental trials and absorbance responses for the optimization of eumelanin functionalization.
RunEumelanin Concentration (mg mL−1) (M)Agitation Speed (rpm) (N)Absorbance at 220 nm (Experimental)
110.003001.260
210.005831.014
317.073000.980
410.00170.843
55.001000.990
65.005001.088
710.003001.280
815.001000.750
910.003001.210
1010.003001.190
1110.003001.170
122.933001.020
1315.005001.112
Note: M: Eumelanin Concentration (mg mL−1); N: Agitation speed (rpm). The experimental trials were defined by a circumscribed CCD with an axial distance of α = 1.414. The trials were conducted in a randomized order to minimize systematic bias. Absorbance at 220 nm was performed as the response (Y) for eumelanin functionality. Center points are 1, 7, 9, 10, and 11 runs.
Table 25. Global Fit and ANOVA for the Optimization of Eumelanin functionalization.
Statistic TermDFSum of SquaresMean SquareF-RatioProb > F
Overall Model50.28680.0573537.34<0.0001 *
Total Error70.01080.001536--
Lack of Fit30.00207-0.320.8130 (ns)
Pure Error40.0087---
Total120.2975---
Model Validation Metrics:
R20.9639 RMSE0.0392
R2 Adj0.9380 Mean of Response1.0762
Max R20.9708 C. V. %3.64
Note: *: Significant, p < 0.05, ns: non-significant, p > 0.05, RMSE: Root Mean Square Error, DF: Degrees of Freedom, C.V. %: Coefficient of Variation.
Table 26. Regression Coefficients and Significance of Parameter Estimates for the Quadratic Model Eumelanin purification.
Statistic TermCoded
Estimate
Std.
Error
95%
Lower
95%
Upper
t-RatioProb > F
(p-Value)
Uncoded Estimate
Intercept1.22200.01751.18061.263469.72<0.0001 *0.6895996
Concentration (M) −0.03940.0139−0.0722−0.0067−2.850.0248 *0.0489109
Agitation speed (N)0.09420.01390.06140.12706.800.0003 *0.001711
MN0.08000.01960.03370.12634.080.0047 *0.000080
MM−0.10100.0149−0.1361−0.0659−6.800.0003 *−0.00404
NN−0.13600.0149−0.1711−0.1009−9.15<0.0001 *−0.0000034
Note: *: Significant (p < 0.05), Coded Estimate: Factor coefficients based on dimensionless scale (−1 to +1), Uncoded Estimate: Factor coefficients based on original physical units (mg mL, rpm), Std. Error: Standard error of the coefficient, 95% Lower/Upper: Confidence intervals for the parameter estimates.
Table 27. Shielding efficiency of eumelanin of Staphylococcus aureus, Escherichia coli, and Bacillus subtilis against UV exposure.
Microbial StrainCFU mL−1 in
Uncoated and Unexposed Quartz
Petri Dish
(Group I: Baseline)
CFU mL−1 in
Coated and Unexposed Quartz
Petri Dish
(Group II: Substrate Safety)
CFU mL−1 in
Uncoated and
UV Exposed
Quartz Petri
Dish
(Group III:
Active Control)
CFU mL−1 in Coated
and UV Exposed
Quartz
Petri Dish
(Group IV: Experimental)
UV Shielding Efficiency (SE)
Escherichia coli
(ATCC 25922)
(2.480 ± 0.142) × 106 CFU mL−1(2.490 ± 0.115) × 106 CFU mL−1<101(2.281 ± 0.111) × 106 CFU mL−192%
Staphylococcus aureus (ATCC 25923)(2.550 ± 0.072) × 106 CFU mL−1(2.590 ± 0.095) × 106 CFU mL−1<101(2.480 ± 0.119) × 106 CFU mL−196%
Bacillus subtilis
(ATCC 6633)
(2.620 ± 0.036) × 106 CFU mL−1(2.660 ± 0.058) × 106 CFU mL−1<101(2.568 ± 0.122) × 106 CFU mL−198%
Note: Data in the table represent the mean ± standard deviation of three independent biological replicates (n = 3). Eumelanin coats were initially optimized targeting peak optical density within the Far-UVC window (220 nm); subsequent biological shielding validated against standard germicidal UVC radiation (254 nm). Indicator strains were suspended in Phosphate-Buffered Saline (PBS, pH 7.4) within high-purity quartz Petri dishes (90 mm × 15 mm) under optimized factors, evaluated in parallel against UV-exposed uncoated blanks (Group III) and non-exposed controls (Groups I and II). Challenge exposure was conducted utilizing a 30 W low-pressure mercury germicidal lamp (incident irradiance of 125 µW cm−2 verified through a calibrated Lutron UV-340A radiometer) at a fixed perpendicular distance of 1 m for 30 min, providing a cumulative incident fluence of 0.225 J cm−2. The values reported as “<101” denote populations falling below the theoretical lower limit of detection (LOD = 10 CFU mL−1) for the pour-plate configuration. Colony-Forming Units (CFU mL−1) were counted following incubation at 37 °C (S. aureus and E. coli) or 28 °C (B. subtilis). Shielding Efficiency (SE %) was calculated using the equation: SE% = ((CFU mL−1 (Group IV)/CFU mL−1 (Group II)) × 100.
Disclaimer/Publisher’s Note: The statements, opinions and data contained in all publications are solely those of the individual author(s) and contributor(s) and not of MDPI and/or the editor(s). MDPI and/or the editor(s) disclaim responsibility for any injury to people or property resulting from any ideas, methods, instructions or products referred to in the content.