
1. Introduction
Fibroblasts play an important role in tissue homeostasis, regulating extracellular matrix remodeling and wound repair [
1,
2]. Rather than acting solely as passive structural elements, fibroblasts are able to sense and respond to biochemical and physical signals in their local environment, thereby influencing proliferation, migration, and cytoskeletal organization [
3,
4,
5]. Although these processes often occur during tissue repair, they are not necessarily modulated by the same molecular pathways or timescales. Thus, approaches that influence fibroblast activity through physical stimuli are of growing interest in regenerative medicine, wound healing, and tissue engineering.
Static magnetic fields (SMFs) have gained attention as potential non-invasive regulators of cellular physiology [
6,
7]. Several studies suggest that SMF exposure may affect membrane potential and ion fluxes, with downstream consequences for redox balance, gene expression, and wound-repair processes [
8,
9,
10]. In fibroblasts, SMFs have been linked to alterations in proliferation and cell migration [
6,
11,
12,
13,
14,
15,
16,
17,
18]. Multiple reports describe changes in fibroblast proliferation [
6,
7,
14,
15,
16,
19,
20], wound closure [
6,
11,
12,
18], and enhanced tissue repair outcomes through reduced oxidative stress [
7,
11,
21,
22], although other studies report minimal or even inhibitory effects [
13,
17,
23], highlighting the lack of a clear consensus regarding SMF-induced consequences on fibroblasts.
A closer examination of the literature suggests that these conflicting responses may be associated with differences in experimental configuration, including SMF intensity and uniformity, presence or absence of field gradients, exposure duration, and cellular context [
6,
7,
10,
24]. Indeed, studies reporting increased proliferation or migration often employ moderate-intensity SMFs and prolonged exposures [
6,
7,
11,
12,
14,
15,
16,
19,
20]. In contrast, inhibitory or null effects are more frequently observed under higher field strengths, short exposure times, or non-uniform field distributions [
13,
17], although exceptions have also been reported [
23].
Importantly, many of these works assume that changes in wound closure or cell number reflect coupled alterations in proliferation and migration, without precisely resolving their individual contributions. This assumption is further complicated by the use of endpoint-based assays, which do not fully capture the temporal dynamics of cell division and motility and may therefore be insufficient to distinguish between proliferative and migratory responses [
12,
15,
18]. Moreover, the divergences reflect substantial differences in experimental design, including field intensity, ranging from millitesla (mT) to tesla (T), field polarity and orientation, and exposure duration [
11,
14]. As a result, it remains unclear whether reported SMF-induced changes arise from modulation of proliferation, altered migratory behavior, or distinct, uncoupled effects on these processes, highlighting the importance of experimental configurations in which all relevant magnetic and biological parameters are well defined and in which proliferative and migratory responses can be quantitatively dissociated.
To address these limitations, in the present study we investigated the effects of SMF exposure on NIH3T3 fibroblasts using an experimental framework that combines live-cell imaging, direct quantification of mitotic events, mathematical modeling of proliferation kinetics, and quantitative analysis of both single-cell and collective migration. We examined whether SMF effects on fibroblasts may be configuration-dependent, with distinct effects on proliferation and migration.
2. Materials and Methods
2.1. Cell Culture
NIH3T3 fibroblast cells were cultured in DMEM-F12 supplemented with 10% bovine serum, 2 mM L-glutamine, and 1% penicillin and streptomycin. The cells were maintained in a cell culture incubator and monitored to grow under optimal culture conditions (37 °C and 5% CO2). All cell culture reagents were purchased from Invitrogen (Carlsbad, CA, USA).
2.2. Magnetic Field Exposure
SMFs were generated using neodymium magnets and characterized using a TMAG-V2 gaussmeter (GLOBALMAG, São Paulo, Brazil). Distinct configurations were employed:
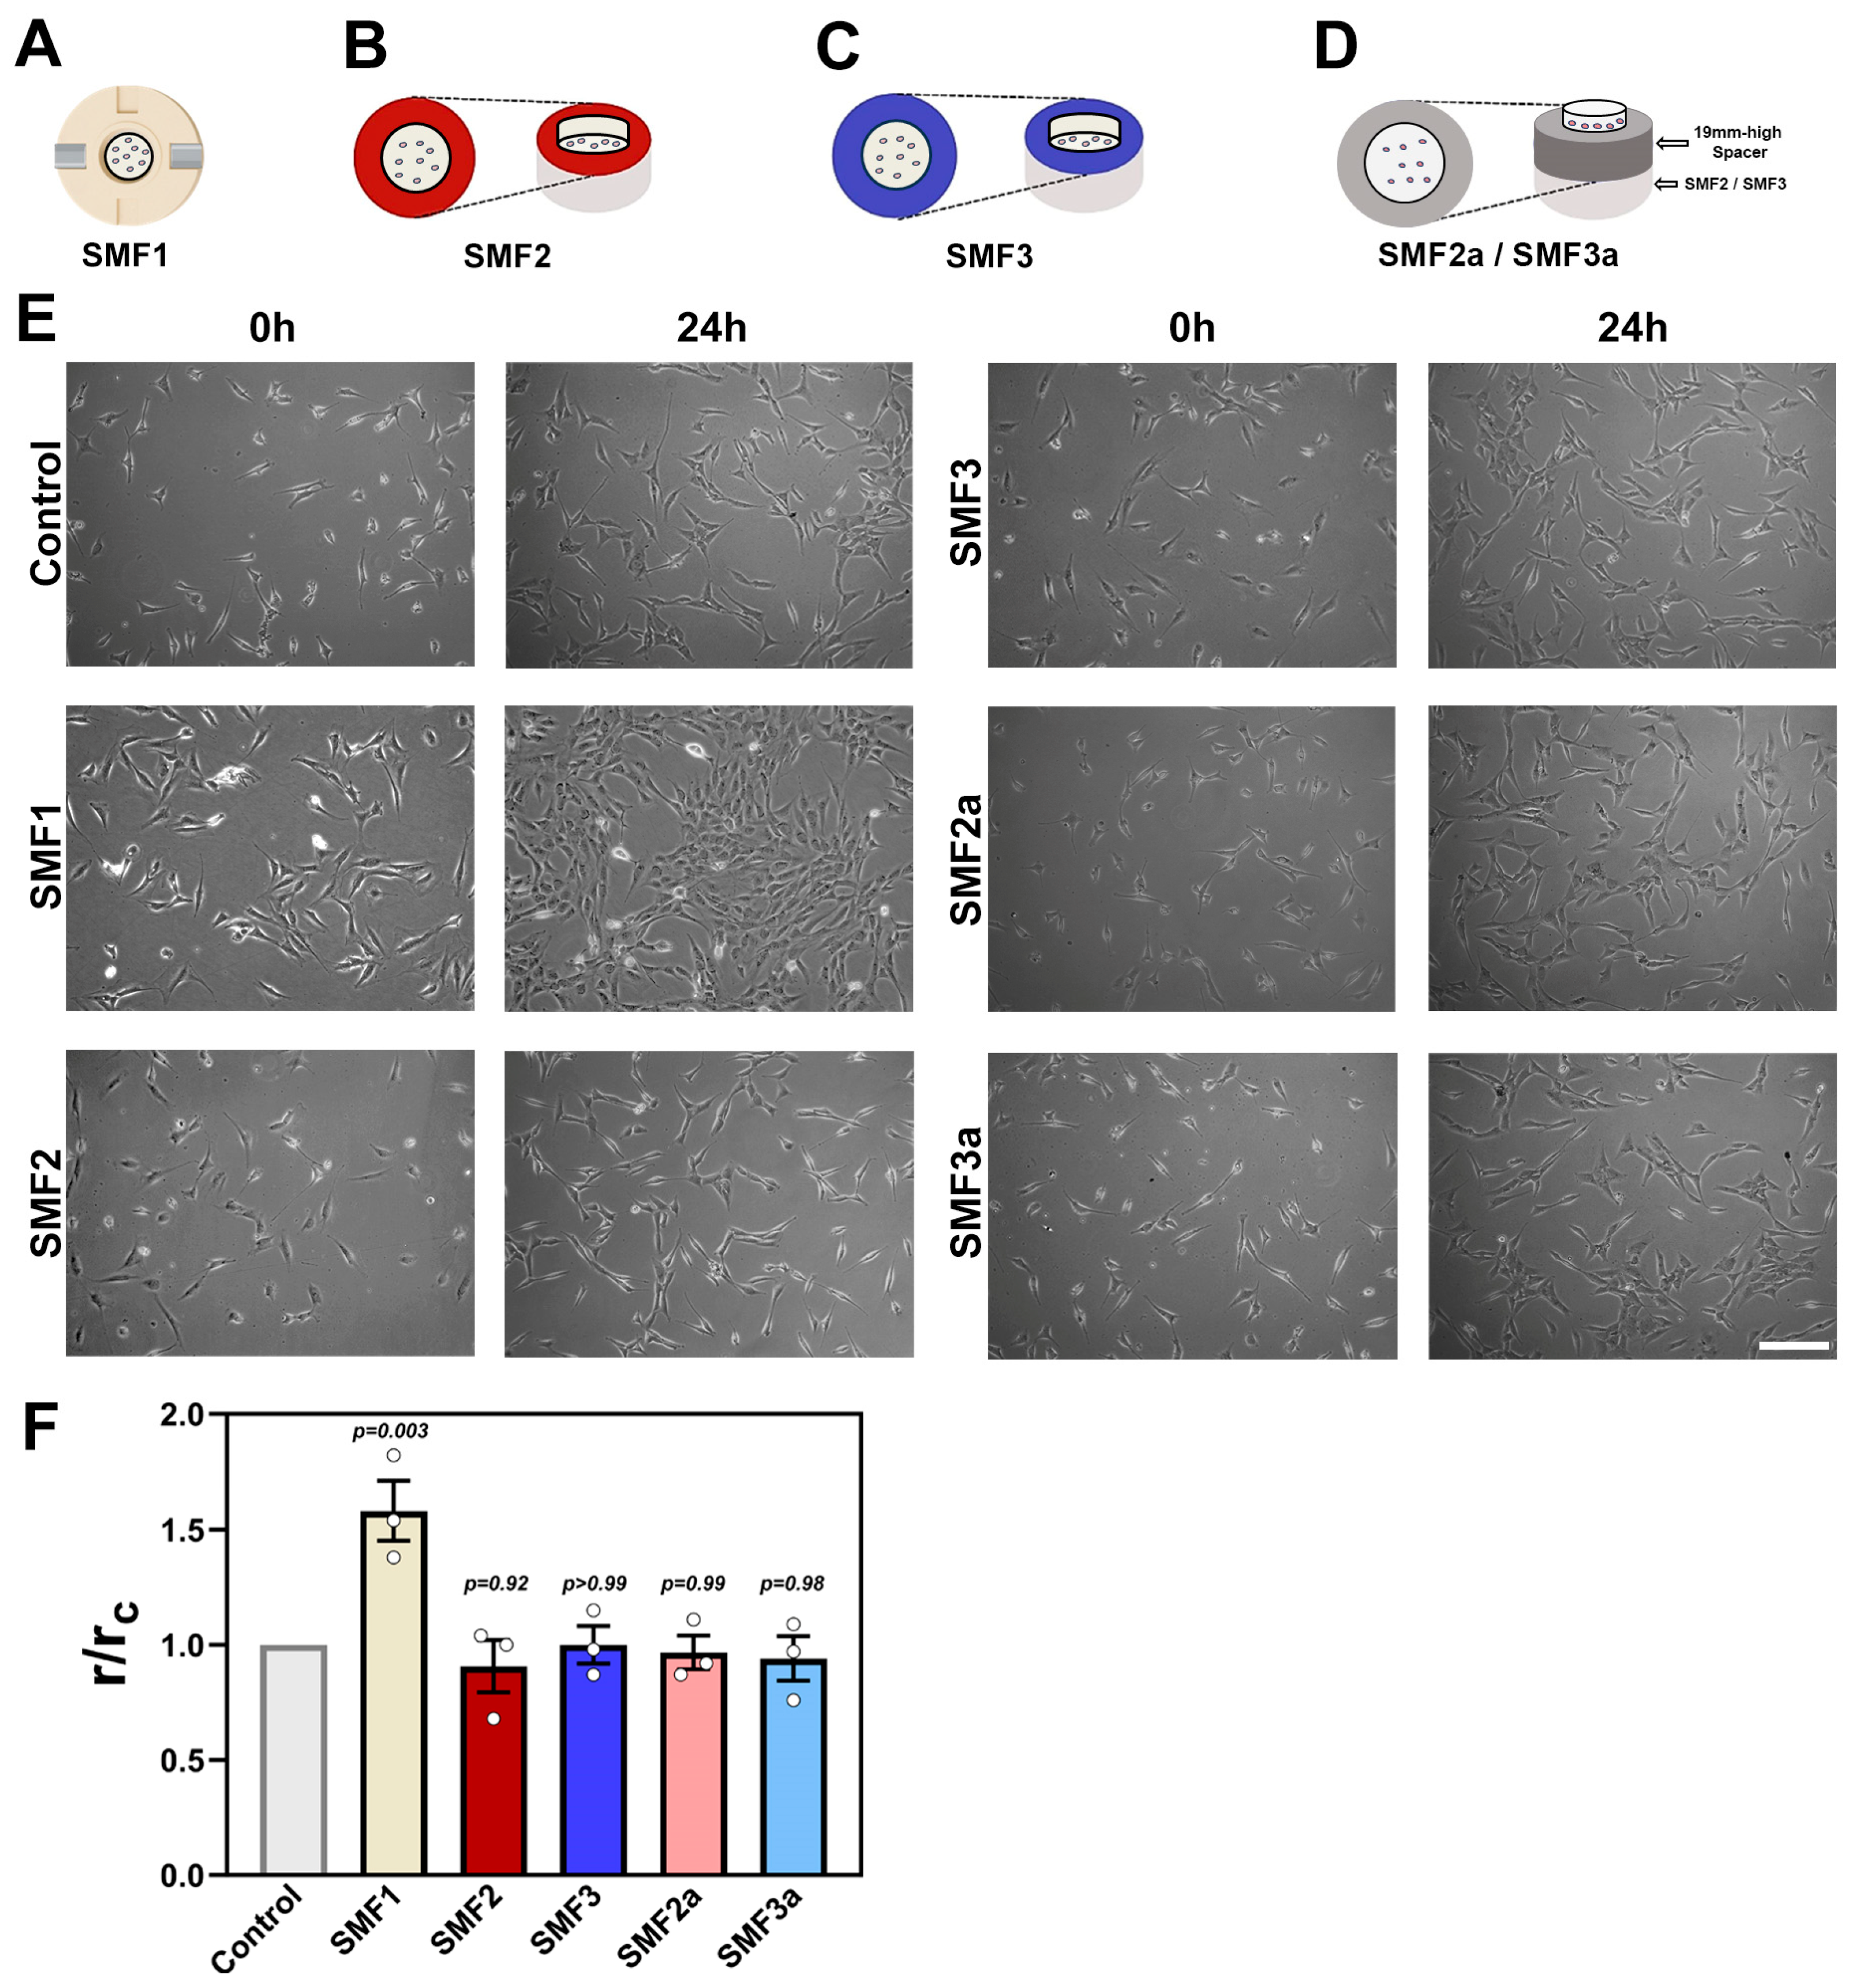
SMF1: Two neodymium magnets were positioned on opposite sides of a 35 mm cell culture dish using a custom-designed three-dimensional-(3D) printed polylactic acid (PLA) sample holder to ensure mechanical stability and reproducibility. This configuration generated a relatively uniform field of 36.6 ± 0.2 mT at the center of the culture dish (
Figure 1A). Details of the PLA sample holder design, including its precise dimensions, as well as magnet specifications and field distribution, are provided in the
Supplementary Material, Figure S1.
SMF2: A single neodymium magnet was placed beneath the cell culture dish, with the North Pole facing the cells, generating a field of 325 ± 3 mT at the center of the culture dish (
Figure 1B).
SMF3: A single neodymium magnet was placed beneath the cell culture dish, with the South Pole facing the cells, generating a field of 396 ± 4 mT at the center of the culture dish (
Figure 1C).
SMF2a and SMF3a: These configurations used the same neodymium magnets as SMF2 and SMF3, respectively, but with a 19 mm high PLA-made cylindrical spacer inserted between the magnet and the cell culture dish (
Figure 1D). This modification reduced the field at the center of the culture dish to 28.6 ± 0.2 mT for SMF2a and 32.2 ± 0.3 mT for SMF3a, while preserving the same field orientations as in SMF2 and SMF3.
A control situation, with cells maintained in identical conditions, but without SMF exposure, was used as baseline.
Importantly, the SMF configurations also differ in the orientation of the magnetic field relative to the culture dish: in SMF1 the field is approximately parallel to the plane of the dish, whereas in the single-magnet configurations (SMF2, SMF3, SMF2a, and SMF3a) it is predominantly perpendicular, with the magnetic field vector points either toward the cells (SMF2 and SMF2a) or toward the magnet (SMF3 and SMF3a), depending on the pole orientation used. A schematic comparison of the field orientations is provided in
Supplementary Material, Figure S2.
The magnetic field measurements were performed under conditions designed to reproduce the experimental setup used for cell exposure. Culture dishes (without cells) were placed in each SMF configuration, and the magnetic field was measured at the level of the inner bottom surface of the dish, corresponding to the location of the cell monolayer. Field magnitudes and orientations were verified prior to each experiment.
The magnetic field magnitude,
, was mapped over a two-dimensional grid in the plane of the culture dish to quantitatively characterize its spatial distribution. Measurements were acquired using the same calibrated gaussmeter at discrete positions with a step size of 5 mm along both
and
directions, covering the region of interest centered on the culture dish. The measurement uncertainty was estimated to be ±(1–5 mT), based on instrument specifications and repeatability (
Tables S1–S5). Magnetic field components were measured according to the predominant field orientation in each SMF configuration. For SMF1, both in-plane components (
) were acquired, allowing full reconstruction of the vector field in the measurement plane (
Table S1). For the other configurations (SMF2, SMF3, SMF2a, and SMF3a), the field was predominantly oriented perpendicular to the culture dish, and only the out-of-plane component (
) was measured; thus, field magnitude was approximated as
(
Tables S2–S5). Two-dimensional (2D) maps of
were reconstructed directly from the measured data (
Figure S2) using a custom Mathematica (Wolfram Research, Champaign, IL, USA) script. The script employs interpolation between measured points to generate continuous representations, ensuring that the maps reflect quantitative measurements. 2D maps were chosen because measurements were performed in the plane of cell adhesion, as cells are fully attached to the substrate and have minimal height, when compared to the entire dish. The magnitude of the spatial gradient of the magnetic field,
, was also computed using interpolated data. The gradient magnitude was calculated as:
Vector fields representing the gradient direction were obtained from the components of
, indicating the direction of maximal spatial increase in field intensity (
Figure S2).
The magnets used in each SMF configuration were always positioned externally relative to the culture dishes. All experiments were conducted either inside a standard cell culture incubator or in a temperature-controlled microscope chamber maintained at 37 °C and 5% CO2, ensuring stable environmental conditions during magnetic exposure and minimizing potential temperature variations associated with magnet placement.
2.3. Cell Proliferation Analysis
Cell proliferation experiments were assessed using two independent approaches: endpoint cell counting and time-resolved live-cell imaging.
2.3.1. Endpoint Cell Counting
First, 35 mm cell culture dishes containing 1.5 × 10⁵ NIH3T3 fibroblast cells were prepared and, after 24 h, the plates were exposed to each of the SMF conditions (SMF1, SMF2, SMF3 and their low intensity variants SMF2a and SMF3a) for 24 h. Phase-contrast images were acquired at 0 h and 24 h using a Leica DMi1 microscope equipped with a Flexacam C1 camera (Leica Microsystems, Wetzlar, Germany). Cell numbers were quantified across multiple fields of view. For each field, cell density (; cells per field of view) was obtained, and a proliferation ratio was calculated as . Mean values were then normalized to the corresponding control ratio , yielding the normalized proliferation index .
2.3.2. Time-Resolved Live-Cell Imaging with Proliferation Kinetics
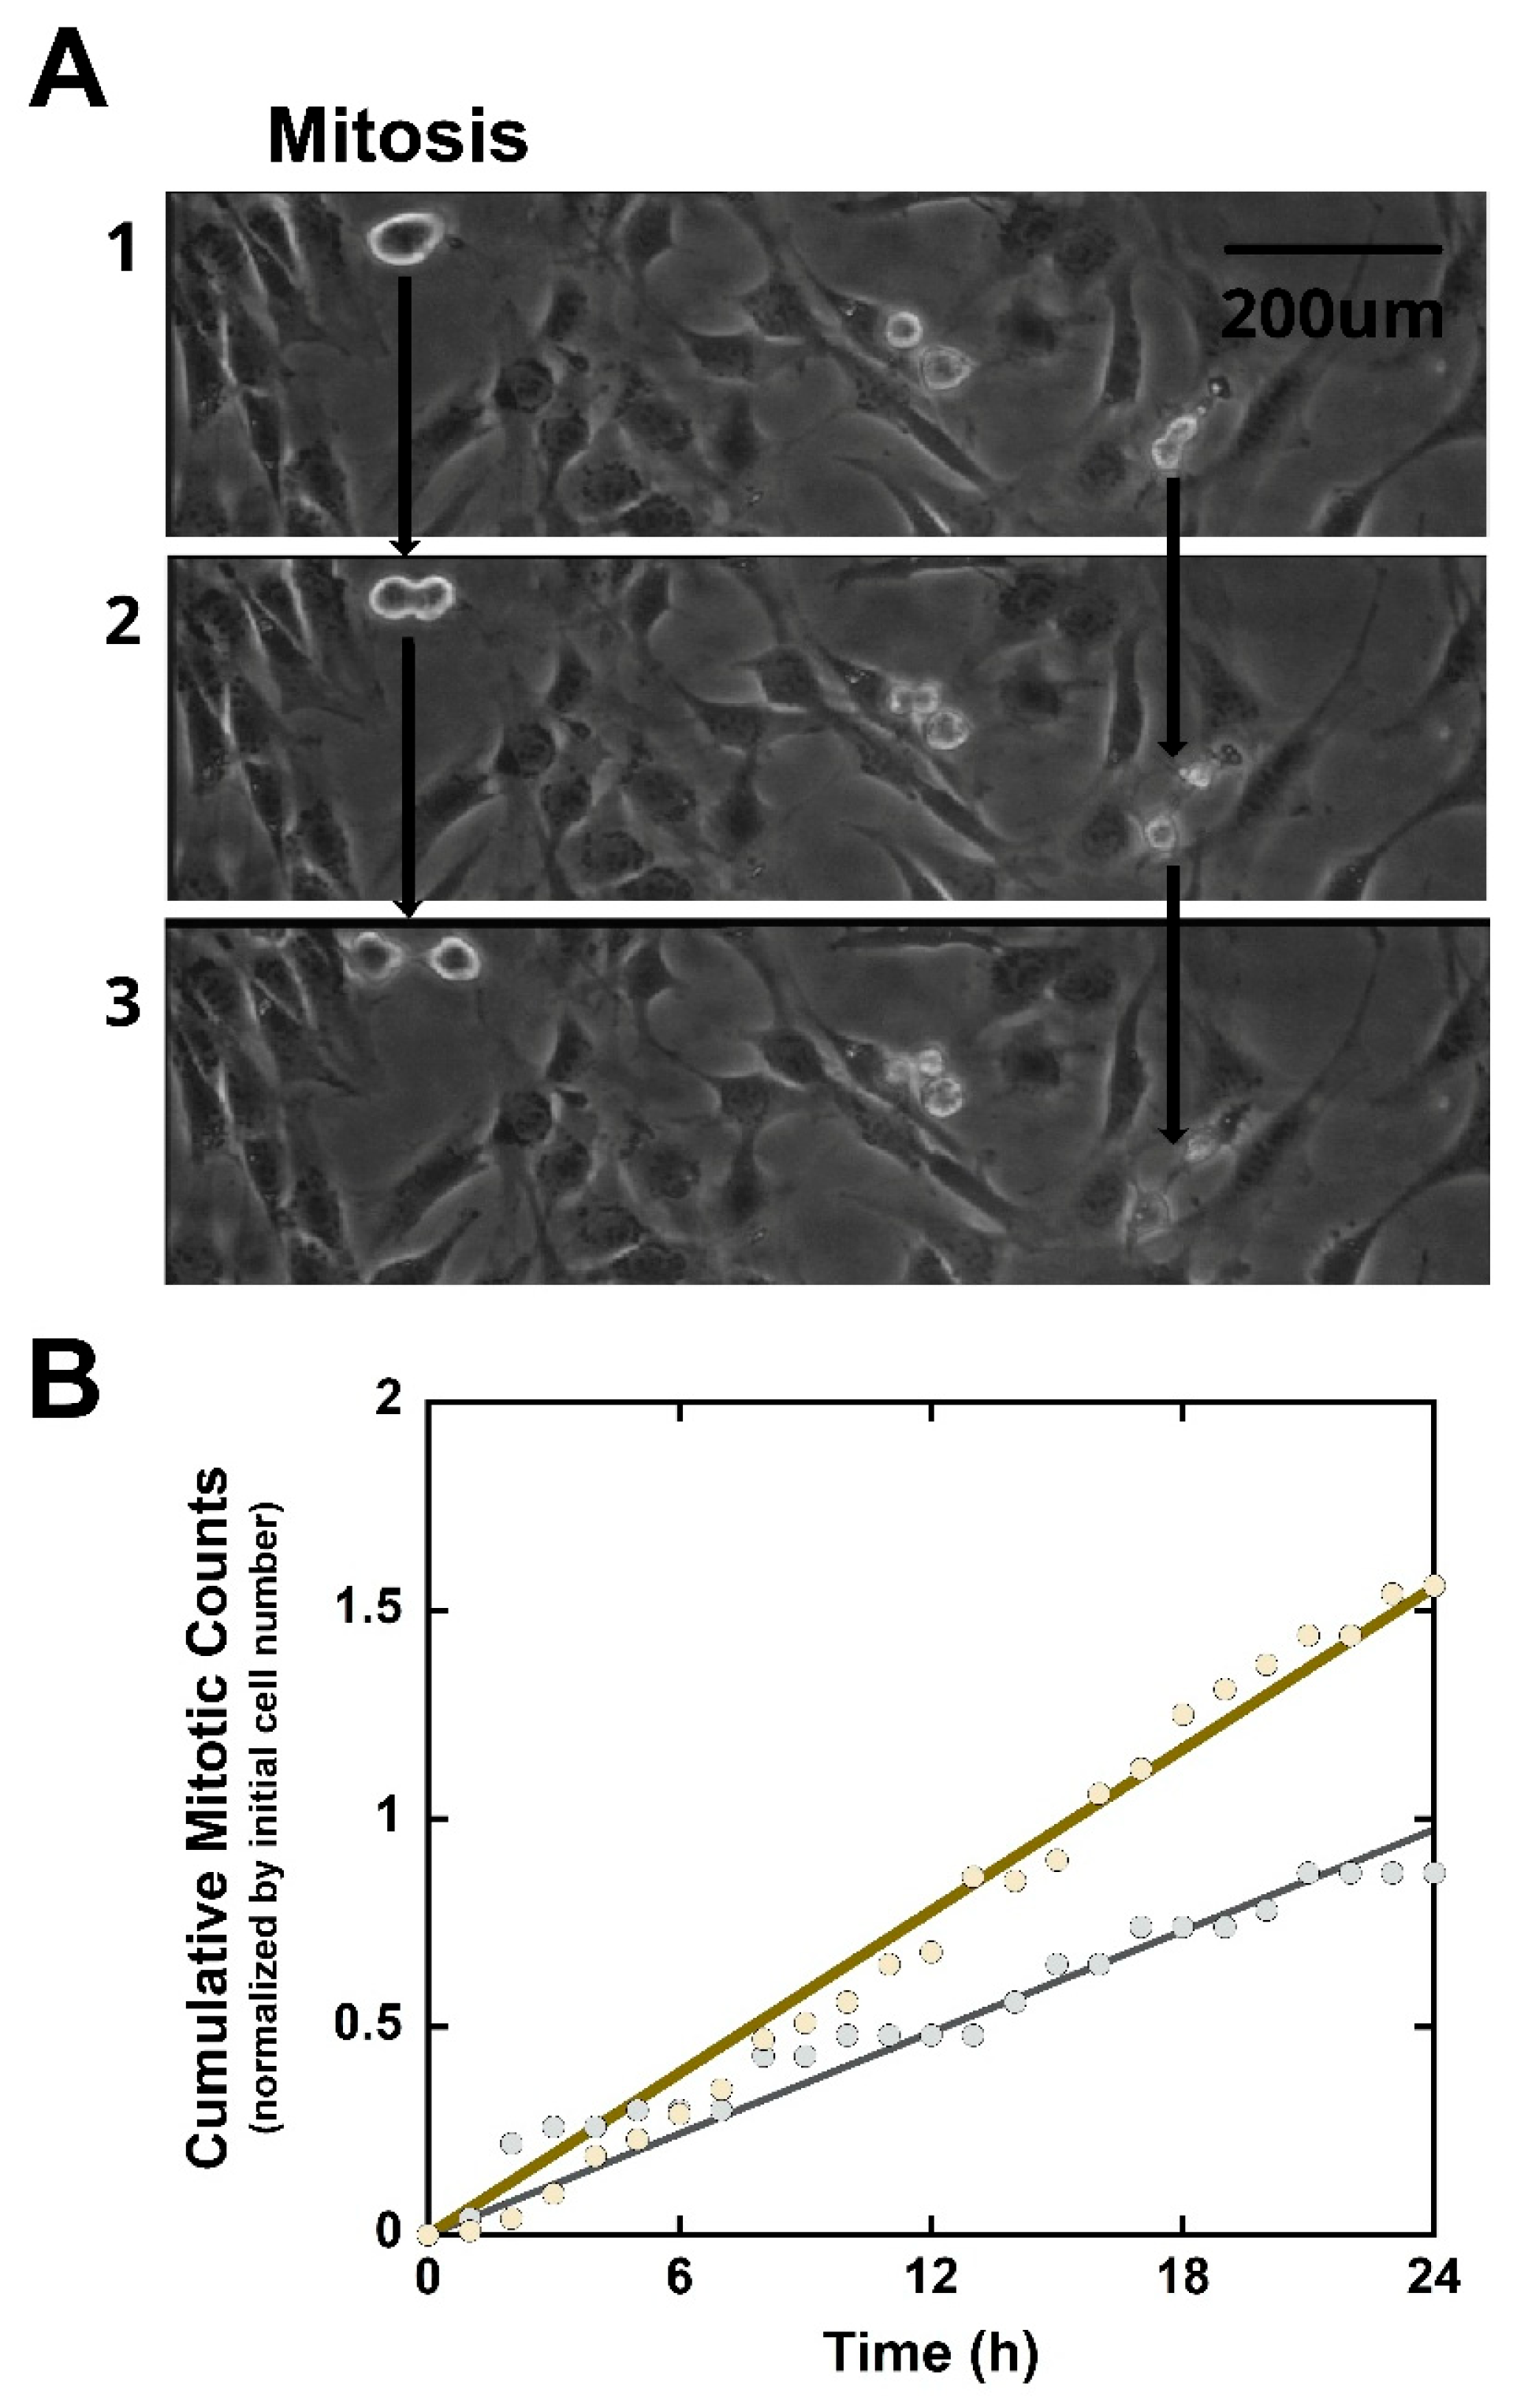
Cultures of NIH3T3 fibroblast cells were prepared and, after 24 h, the plates were transferred to a Nikon TE300 microscope (Nikon, Tokyo, Japan) equipped with a special chamber capable of controlling the temperature at 37 °C and the CO2 concentration at 5% to keep the cells alive under the microscope for the next 24 h. The magnetic configuration was maintained in place throughout the entire imaging period, ensuring continuous magnetic exposure during live-cell imaging. Phase contrast images were taken at one-minute intervals using a Hamamatsu C2400 CCD camera (Hamamatsu, Hamamatsu City, Japan). Following the compilation of images into movies, the initial and final cell counts, as well as the number of mitotic events occurring throughout each video, were counted. The number of mitoses was normalized by the initial number of cells of each experimental condition, control, and SMF1.
The number of mitoses
increases with time
. To characterize this behavior, we modeled the increase in the number of cells in the sample as an exponential growth. In this model, we assume that spatial or nutrient limitations are negligible during the period under analysis. The differential equation describing the number of cells
as a function of time is given by:
where
is the number of mitoses per cell per unit of time. The solution to the differential equation leads to the following result:
where
is the initial number of cells in the observation field at time
.
The number of mitoses as a function of time is given by:
The number of mitoses normalized by the initial number of cells,
, is then given by:
Equation (5) represents the general expression describing the cumulative number of mitoses. This assumption is appropriate when the observation time is sufficiently long compared to the characteristic cell-cycle duration, leading to exponential growth of the cell population. However, in experimental situations, where the observation window is comparable to the duration of a single cell cycle, the contribution of newly generated daughter cells to additional mitotic events is minimal. In our experiments, we observe that
, indicating a linear increase in the number of mitoses. This behavior suggests that, within the experimental time window, essentially only the initial population of cells contributes to the observed mitotic events. Under these conditions, the growth equation can therefore be written as:
which leads to:
and consequently:
This expression corresponds to the early-time behavior of cell population growth, before newly generated daughter cells have time to re-enter the cell cycle. Using this model, we obtained the values of for both experimental conditions, control and SMF1.
2.4. Cell Velocity and Directionality Analysis
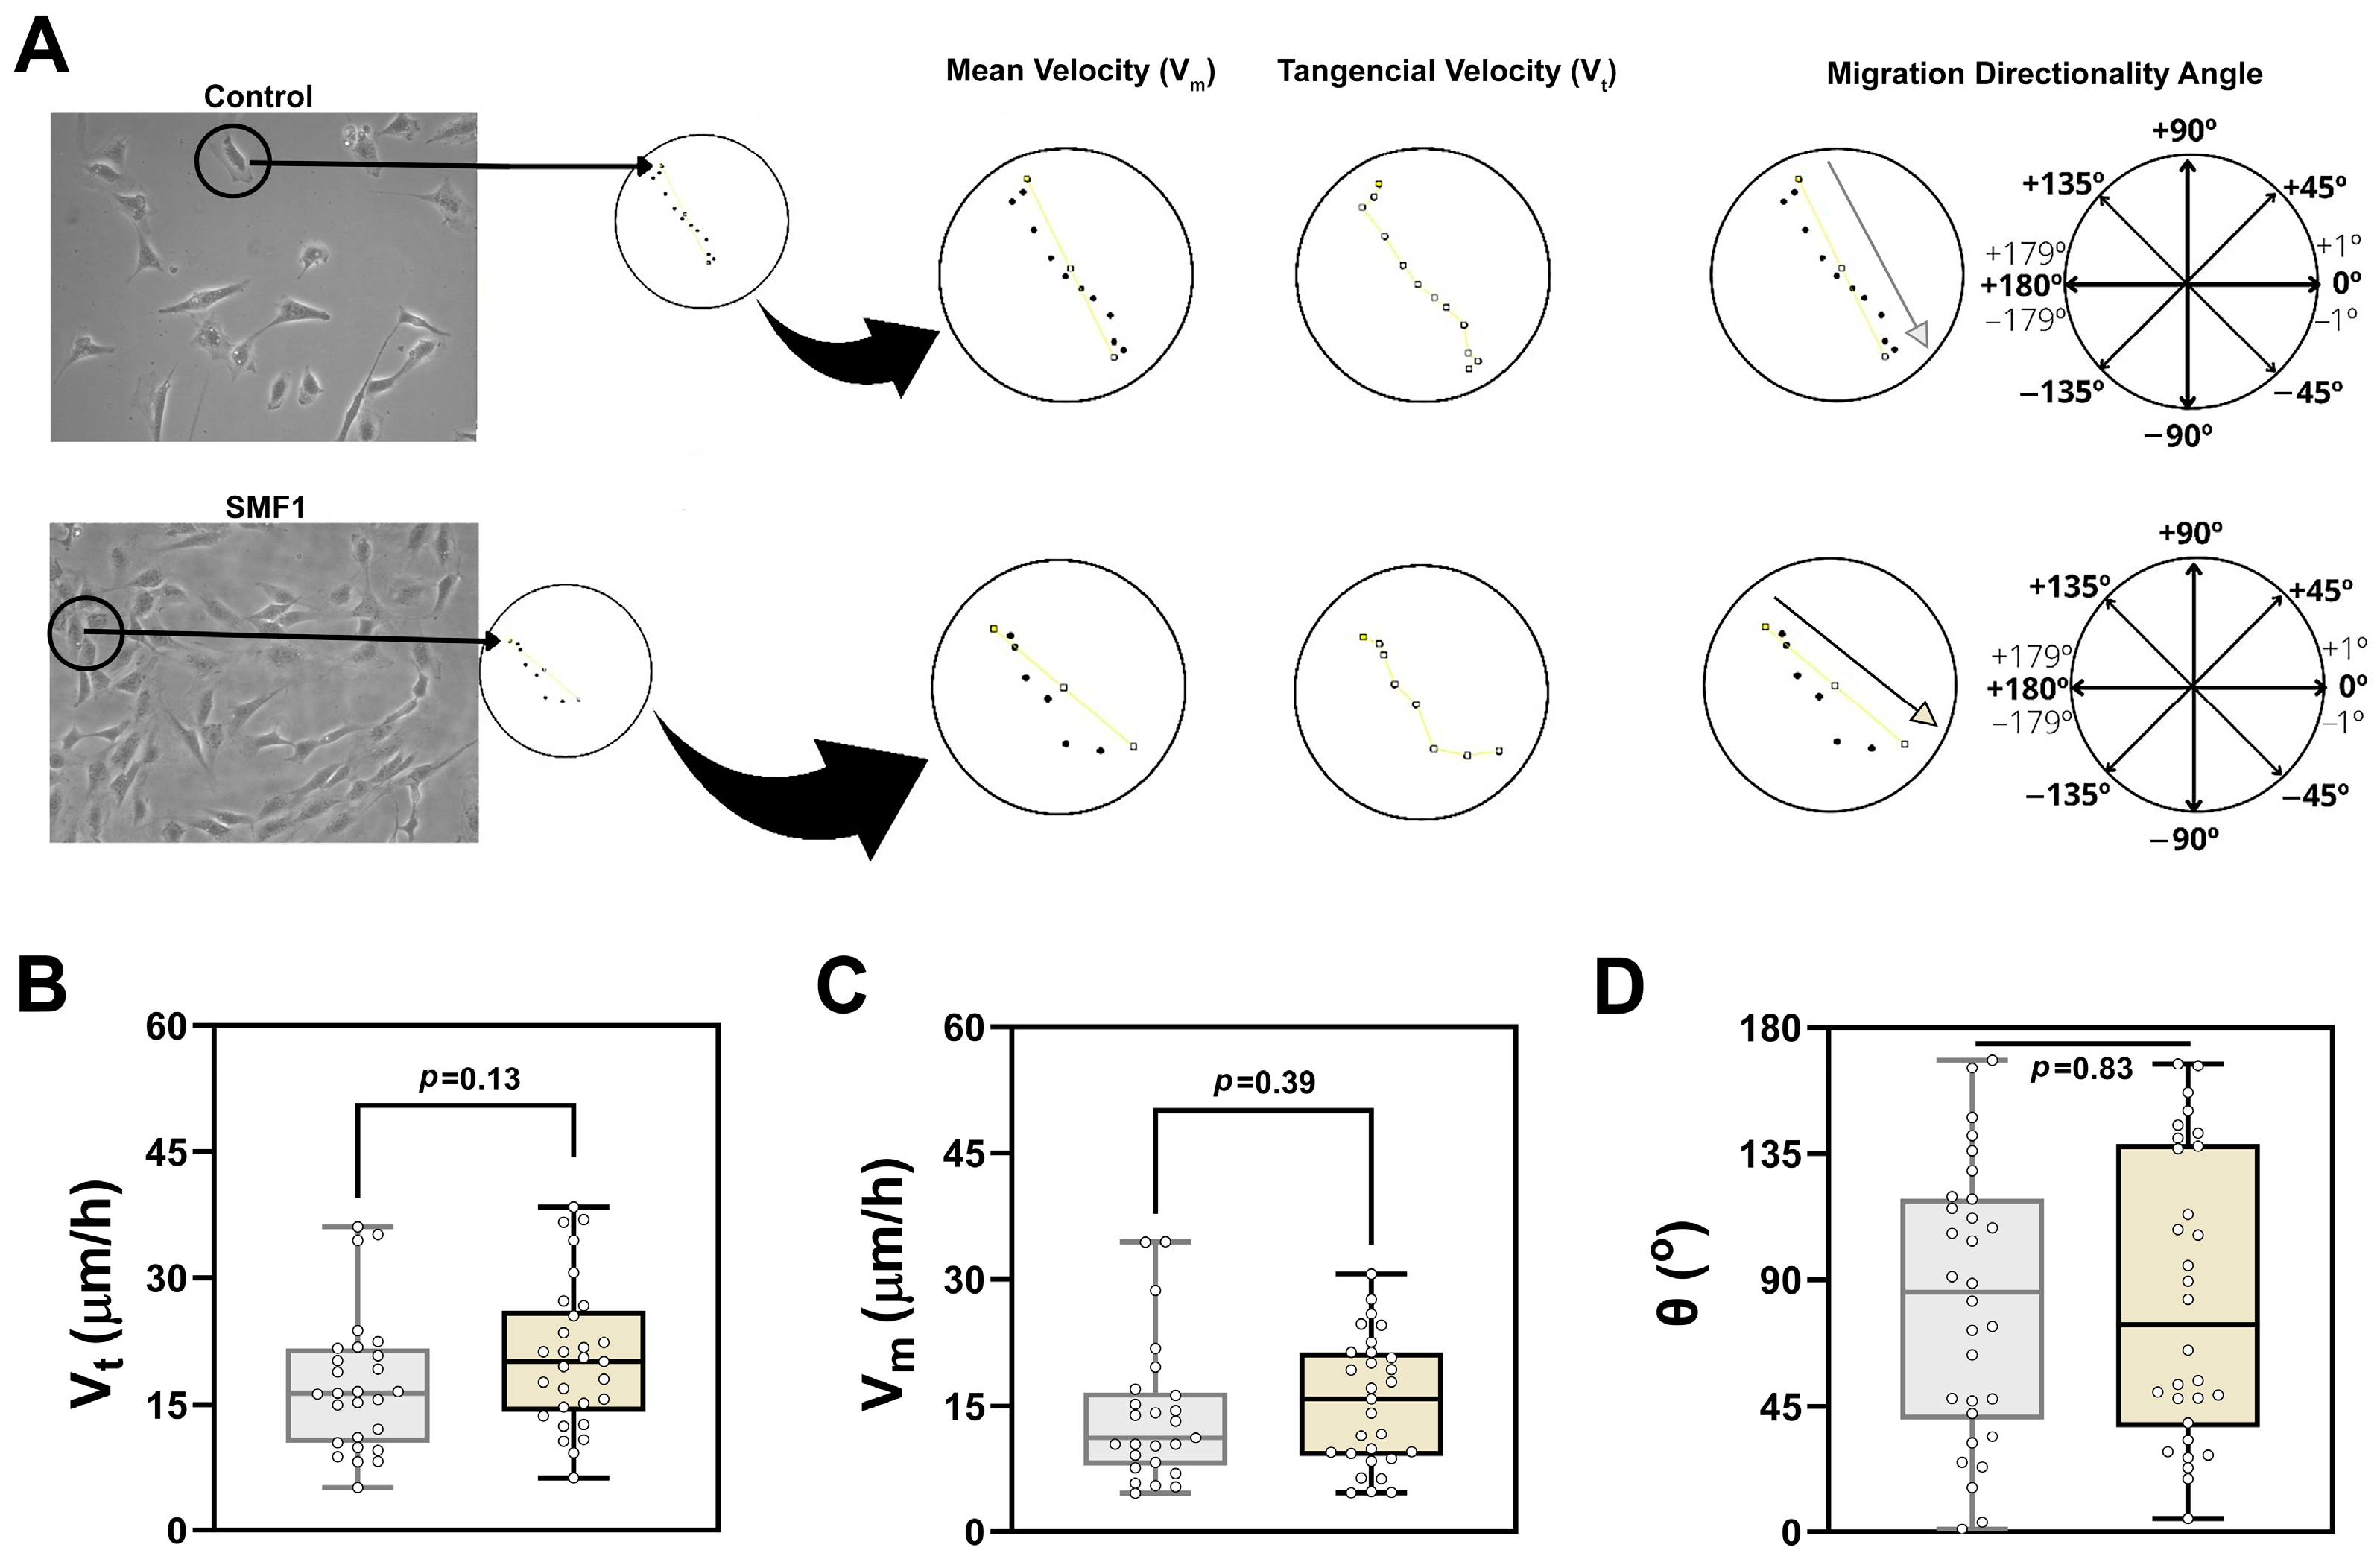
Following the compilation of images into movies, at least 25 distinct cells of each experimental condition, control and SMF1, were identified and marked with small black dots at 60 min intervals. The process was performed using the paintbrush tool in ImageJ version 1.54g (National Institutes of Health, Bethesda, MD, USA). Next, using the segmented line tool, the cell trajectories were reconstructed. Finally, two parameters were defined: the tangential velocity (
) and the mean velocity (
).
is indicative of the total cell displacement over a 24 h period, while
indicates the maximum cell displacement in relation to its initial position during the same timeframe [
25]. We also analyzed the angles (
) of cell migration in the videomicroscopy experiments. To this end, we marked the initial and final positions of each cell in its trajectory and recorded the angle corresponding to the direction of cell migration using the Image J angle tool, normalizing negative quadrants by subtracting 180°.
2.5. Wound Closure Assays
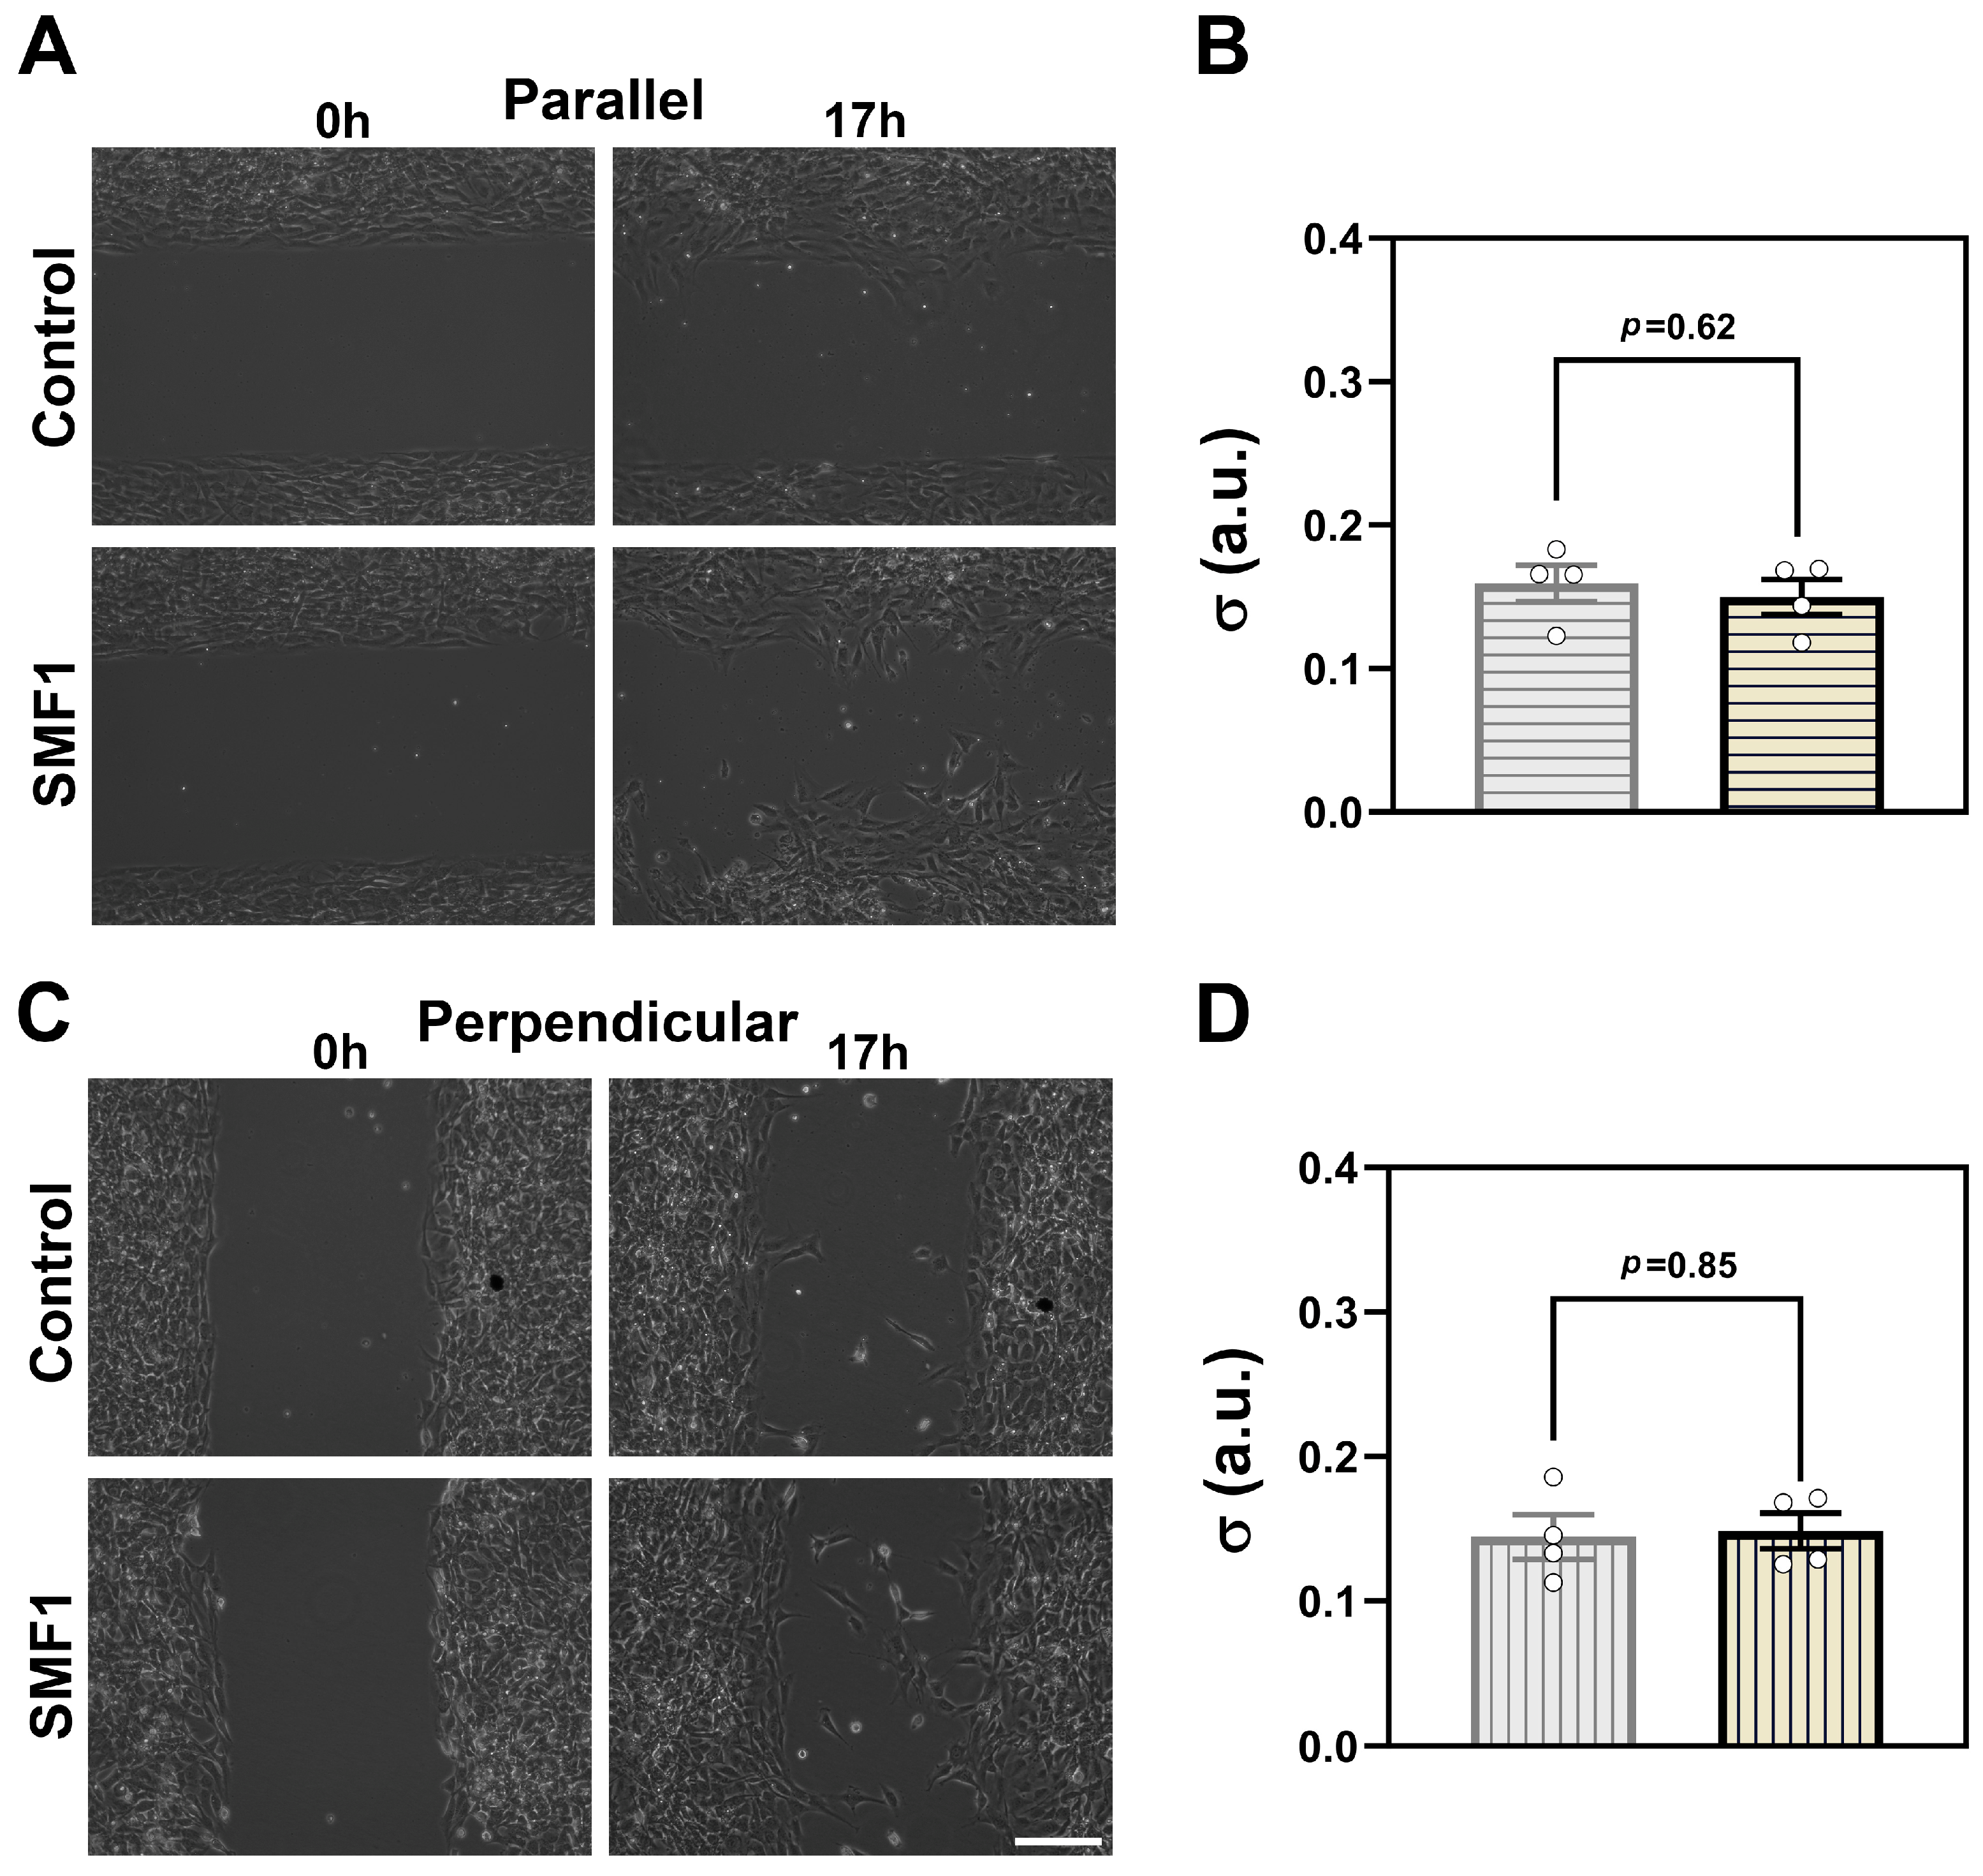
NIH3T3 cells were cultured using a special culture-insert 2 well in µ-Dish 35 mm plates (Ibidi, Gräfelfing, Germany). A total of 5 × 10⁴ cells were seeded in each side of the 2 well insert and allowed to adhere and reach confluence in DMEM-F12 supplemented with 10% bovine serum. After 24 h, to inhibit proliferation, cells were pre-treated for 2 h with 10 µg/mL mitomycin C (Sigma-Aldrich, St. Louis, MO, USA). Following mitomycin C treatment, cells were extensively washed and incubated in DMEM-F12 culture medium supplemented with 0.1% bovine serum. The insert was then removed, generating two opposing cell monolayers separated by a well-defined, cell-free central gap. Immediately after insert removal, the entire 35 mm dish was replenished with the same DMEM-F12 medium containing 0.1% bovine serum, and cultures were exposed for 17 h to either control or SMF1 conditions, with the magnetic field applied parallel or perpendicular to the gap orientation. Phase-contrast images from different fields were obtained throughout the entire length of the gap. Gap areas were quantified at 0 h (when the silicone inserts were removed from the cell layer) and after 17 h. The differences in areas without cells were evaluated and compared with the initial 0 h using the adjusted σ ratio for 17 h: , where represents the area without cells at 0 h and represents the area without cells after 17 h.
2.6. Statistical Analysis
Most data are presented as bar plots, with means ± standard errors (SEM). These values were calculated from biological replicates, defined as independent experiments performed on different days using independent culture cell populations. Within each experiment, different fields of view were imaged per culture dish and were considered technical replicates; these were averaged to generate a single value per biological replicate for statistical analysis. For single-cell migration velocity and directionality measurements, individual cell values are displayed using Box-and-Whiskers plots. In these plots, the rectangular boxes extend from the 25th to the 75th percentiles, with horizontal lines at the medians; whiskers extend from the minimum to the maximum values for all experimental conditions. All statistical analyses were performed using GraphPad Prism version 10.1.2 (GraphPad Software, Inc., Boston, CA, USA). Data distribution was assessed for normality using the Shapiro–Wilk test prior to statistical analysis. For datasets that met normality assumptions, statistical comparisons were performed using Student’s t-test or one-way ANOVA followed by Dunnett’s post hoc test. For datasets that did not meet normality assumptions, Mann–Whitney U tests were performed. Exact p-values are reported in the figures, and additional details are provided in the corresponding figure captions.
4. Discussion
The biological effects of SMFs on mammalian cells remain a subject of debate and intense research, particularly regarding their influence on fibroblasts [
1,
8,
9,
11,
12,
13,
14,
18,
19,
20,
21,
22,
23]. In the present study, we investigated how SMFs of distinct magnitudes and configurations affect NIH3T3 fibroblast proliferation and migration. Our results show that, among the tested setups, only one configuration (SMF1) was associated with higher fibroblast proliferation compared to control and to the other configurations. Despite the observed proliferative response by SMF1, no significant changes were observed in single-cell migration velocities, directional persistence, or collective wound closure dynamics. Importantly, wound closure assays were conducted under proliferation-inhibited conditions, allowing gap closure to reflect collective migratory behavior. Together, our findings suggest a dissociation between proliferation and migration under a specific SMF setup. Such dissociation is interesting, as several studies have demonstrated that SMFs enhance wound closure primarily by accelerating cell migration [
6,
11,
12,
15,
18]. Our results indicate that, at least for NIH3T3 fibroblasts under the tested conditions, increased proliferation can be observed without detectable changes in migration parameters. The magnitude of the proliferative response observed under SMF1 (approximately 1.4-fold) falls within the range typically reported for moderate proliferative stimuli in fibroblast cultures [
1,
2]. In biological contexts such as tissue repair or tissue engineering, even modest changes in cell division rates may accumulate over time and contribute to measurable differences in cell population expansion [
1].
Our results align with those of previous reports suggesting that SMF effects are highly dependent on field configuration, with field intensity alone insufficient to predict biological outcomes [
6,
10,
24]. Indeed, increased fibroblast proliferation has been reported under weak or moderate SMFs in the mT range [
6,
7,
11,
12,
14,
15,
16,
19,
20], whereas inhibitory or null effects have also been described [
13,
17]. Our results suggest that SMFs do not appear to act as generic stimulators or inhibitors; instead, their effects vary depending on field configuration. Notably, the spatial characterization of the magnetic field in our setups reveal quantitative insights experienced at the cellular plane. SMF1 combines a relatively uniform magnitude in the plane of cell adhesion, with gradients diverging from the center toward the lateral edges. In contrast, the other configurations, whether higher field magnitudes (SMF2 and SMF3) or magnitudes similar to SMF1 (SMF2a and SMF3a), exhibit greater spatial heterogeneity, with gradients pointing toward the center of the dish. This suggests that the proliferative response under SMF1 may not solely depend on field strength, but could also be influenced by the overall spatial configuration of the field.
From a mechanistic perspective, several physical mechanisms have been proposed to explain interactions between SMFs and cellular systems. These include magnetic effects on paramagnetic or iron-containing structures such as ferritin, as well as diamagnetic anisotropy in ordered macromolecular assemblies including lipid bilayers and cytoskeletal filaments [
24,
26,
27,
28]. In principle, such mechanisms could lead to alignment or mechanical perturbations of cellular components. However, theoretical estimates suggest that the magnitude of these effects may become very small at magnetic field strengths in the mT range, potentially several orders of magnitude below the energies associated with intrinsic membrane tension or thermal fluctuations [
29,
30]. Within this theoretical framework, direct magnetic alignment or mechanical deformation of cellular structures may therefore be expected to be limited under the experimental conditions used in the present study. Nevertheless, because the present work does not directly probe molecular pathways, the possible contribution of these or other mechanisms cannot be completely excluded. Instead, recent studies suggest that moderate SMFs may influence cellular physiology indirectly through modulation of ion channel activity and calcium-dependent signaling pathways, which are known regulators of fibroblast proliferation and cell-cycle progression.
On the other hand, our observations may be compatible with indirect mechanisms, although the present experiments do not allow definitive discrimination between alternative possibilities. In this context, the SMF1 configuration used could in principle modulate redox-sensitive processes, membrane-associated signaling pathways, or ion fluxes such as Ca
2+ signaling, thereby influencing intracellular Ca
2+ levels and downstream proliferation pathways, ultimately affecting cell-cycle progression without directly perturbing the plasma membrane or cytoskeletal organization. Such mechanisms may represent one of several possible pathways compatible with the selective and configuration-dependent nature of the observed effect and with previous reports of SMF-induced changes in intracellular signaling at low field strengths, as comprehensively discussed in literature reviews [
6,
7,
10,
24].
In line with this view, Wu and colleagues [
31], using human mesenchymal stem cells derived from umbilical cord tissue, showed that SMFs in the mT range alter calcium homeostasis and redox balance, leading to changes in proliferation and gene expression through MAPK- and ROS-dependent pathways. In their study, SMF exposure was associated with membrane depolarization mediated by voltage-gated calcium channels, which triggered downstream signaling cascades involving ERK and JNK and ultimately regulating cell-cycle genes. Importantly, these effects were attributed to indirect biochemical mechanisms. Although both the cell type and the field configuration used in their study differ from those employed here, these findings illustrate that weak static magnetic fields can be associated with changes in intracellular signaling. Such mechanisms may therefore represent one of several possible pathways compatible with the pattern observed in the present study. Still, our results should be interpreted as phenomenological, describing an association between a specific SMF configuration and increased proliferation rather than establishing a causal mechanism. In this context, subtle modulation of calcium- or redox-sensitive signaling could potentially contribute to changes in cell-cycle progression, and consequently proliferation rate, without necessarily affecting migratory behavior.
Because such responses are likely mediated by time-dependent signaling processes, quantifying their impact on cell proliferation requires approaches that go beyond conventional endpoint measurements. A key contribution of our study is, thus, the methodological approach. By combining live-cell imaging with direct quantification of mitotic events and biophysical modeling, we were able to extract quantitative parameters, such as a proliferation rate constant. This time-resolved and rate-based analysis indicates that the increased cell number observed under SMF1 arises from an increase in cell division rate, rather than cell death, altered adhesion, or cell detachment. Such distinctions are difficult to make using conventional assays like MTT, manual cell counts, or single-timepoint measurements, which are commonly used in the existing literature [
8,
17,
19,
23]. We therefore suggest that some of the inconsistencies reported in previous studies may reflect methodological limitations rather than true biological variability. While conventional assays remain valuable, we suggest that integrating them with time-resolved analyses can yield deeper insights and help resolve apparent discrepancies.
Collectively, our results help clarify previously conflicting observations regarding SMF effects on fibroblasts. By varying field configurations and employing time-resolved quantitative analyses, we show that cellular responses to SMFs can be selective. The presence of a proliferative effect under one specific configuration highlights the importance of precise field characterization. Although we discussed some of our findings in light of mechanistic insights obtained in other cellular models reported in the literature [
31], the molecular pathways underlying the observed proliferative response were not directly investigated in our fibroblast model and therefore warrant further characterization. Moreover, extending the analysis to three-dimensional culture systems may further clarify the physiological relevance of these findings. Finally, in our experiments, the SMF1 configuration, which generates fields almost predominantly parallel to the cell plane, produced the most evident increase in proliferation. Future studies exploring variations in this parallel field configuration, combined with more robust spatial characterizations, could provide additional insights into the mechanistic basis of the selective biological responses observed in this study.