Article

An IoT-Based Real-Time Energy-Management System for Smart Load Control in a Residential Microgrid

by
Mohammed Sabah
1,*,
Akram Elmitwally
1,2 and
Abdelfattah A. Eladl
1
1
Electrical Engineering Department, Faculty of Engineering, Mansoura University, Mansoura 35516, Egypt
2
Department of Communication Techniques Engineering, Al-Frahidi University, Baghdad 10021, Iraq
*
Author to whom correspondence should be addressed.
Eng 2026, 7(8), 418; https://doi.org/10.3390/eng7080418
Submission received: 9 June 2026 / Revised: 19 July 2026 / Accepted: 27 July 2026 / Published: 17 August 2026
(This article belongs to the Section Electrical and Electronic Engineering)

Abstract

The increasing complexity of residential energy systems and the growing penetration of distributed resources require practical energy-management solutions that extend beyond conventional metering. This paper presents the design and implementation of a real-time Internet of Things (IoT)-based energy-management system for monitoring and controlling household energy consumption under different operating conditions. The proposed system adopts a dual-processor architecture, in which a primary microcontroller performs time-critical electrical measurements and low-level load switching, while a secondary processor operates as a local IoT gateway for data handling, rule-based control decisions, local visualization, and message queuing telemetry transport (MQTT)-based cloud communication through a 4G link. The contribution of this work is not associated with the individual use of dual processing, cellular communication, cloud monitoring, load shedding, or backup power, as these technologies have been previously reported in smart-metering and home energy-management systems. Instead, the study focuses on their coordinated integration within a residential-scale prototype that combines calibrated per-load monitoring, priority-based load control, outage-resilient reporting, and credit-aware load restriction. The system measures voltage, current, active and apparent power, power factor, and energy consumption for individual loads and supports centralized visualization through a cloud-based dashboard. The prototype was experimentally evaluated under three representative scenarios: overload, main power outage, and low-credit operation. In the overload scenario, automatic priority-based load shedding reduced the total load by up to 75%. During power outages, a battery-supported subsystem maintained monitoring and communication for real-time outage reporting. In the low-credit scenario, non-essential loads were disconnected when the user balance fell below a predefined threshold, while essential loads remained energized. The results demonstrate that the implemented prototype can provide integrated monitoring, local rule-based control, cloud reporting, and backup-supported operation within a unified residential energy-management platform.

1. Introduction

Traditional power grids, built on a centralized model of one-way power flow from large-scale generators to consumers, are fundamentally lacking in handling the decentralized generation and dynamic, two-way power exchange characteristic of modern microgrids [1]. This framework shift necessitates a new approach to power management that enables real-time monitoring, rule-based control, and improved operational continuity. This research directly addresses this critical need by developing an IoT-based system for energy management and smart load control. Smart meters represent a cornerstone technology in the digital transformation of energy systems. Unlike conventional meters, which provide static, post-consumption readings, smart meters enable continuous, two-way communication between end users and the energy provider. They play a vital role in delivering fine-grained, real-time consumption data, empowering both consumers and grid operators to make informed decisions [2]. In the context of home energy management, smart meters allow households to track and optimize their consumption behavior, participate in demand–response programs, shift usage to off-peak hours, and receive alerts and notifications regarding unusual consumption or outages. From the utility side, IoT-enabled smart meters act as distributed sensors feeding a centralized monitoring platform. The IoT infrastructure aggregates these data across thousands of households, enabling centralized energy monitoring with real-time visualization of demand patterns, fault and anomaly detection for rapid response to failures, predictive analytics to optimize load balancing and renewable integration, and automated notifications sent simultaneously to users via mobile apps, dashboards, or short message service (SMS) and to administrators for system-level interventions [3].
The increasing demand for electricity and the integration of renewable energy sources have led to a critical need for advanced energy-management systems. The IoT has emerged as a key technology to address this challenge, as demonstrated across a range of recent studies. Many papers focus on the fundamental application of IoT for energy monitoring and consumption analysis, with the primary goal of improving efficiency and reducing costs for consumers.
For instance, the authors of [4,5] both propose IoT systems that collect consumption data, providing real-time insights to help users manage their electricity usage. This foundational approach [6,7] is also extended to the problem of electricity theft detection, as proposed by the authors in [8,9]. These works detail the design of smart meters that use differential power methods or custom algorithms to identify and alert utility companies to suspicious activity, thereby minimizing non-technical losses. Significant research [10,11] also explores the use of IoT in circuit breakers [12] and load control [13]. Research papers [14,15] described the development of IoT-enabled circuit breakers that can be controlled remotely and provide enhanced safety features, such as overload protection and real-time warnings. These systems are shown to be effective in providing remote management and improving electrical safety. On the other hand, the authors of [16,17] took a more specialized approach by focusing on solid-state circuit breakers (SSCBs) for DC systems and microgrids. They proposed novel topologies to handle rapid fault isolation and provide self-healing capabilities. These papers highlight a more advanced application of smart control beyond simple on/off functionality. While most of the reviewed papers focus on the hardware and networking aspects, some delve into more advanced concepts. Also, the authors introduced an AI-based approach [4], leveraging machine learning and predictive analytics [4,18,19] to make intelligent decisions about power usage and load control. This elevates the system from a passive monitoring tool to an active management agent. Furthermore, the importance of system reliability and resilience is addressed by the authors of [15,20,21], who discuss the use of stress tests to validate the performance of prototypes under various scenarios like power overloads and voltage drops.
To provide a more informative literature comparison, the reviewed studies were evaluated using implementation-level criteria rather than simple checkmark indicators. The comparison considers the main application, communication method, controlled object, number of controlled loads, response/control method, validation condition, and the main limitations relative to residential smart load management. In this context, the communication method refers to the telemetry or control link used by the system, such as wireless fidelity (Wi-Fi) communication, Global System for Mobile Communications (GSM), transmission control protocol/internet protocol (TCP/IP), MQTT, or cellular communication, while the controlled object identifies whether the system acts on a whole meter, feeder, circuit breaker, lighting network, smart socket, or individual household loads. The response/control method indicates whether the system provides passive monitoring, alarm generation, remote switching, protection, theft detection, priority-based load shedding, or credit-aware load restriction. The validation condition further distinguishes between studies evaluated through simulation, laboratory prototypes, field data, or realistic operating scenarios.
The reviewed literature described in Table 1 shows clear progress from basic IoT-based energy monitoring toward remote control, theft detection, safety enhancement, and load management. However, when these studies are examined from a system-integration and application-scenario perspective, several limitations remain. Although Wi-Fi, cellular communication, cloud monitoring, load control, and backup supply have been reported in previous smart-metering and home energy-management systems, they are often addressed as separate functions or validated under limited operating conditions. In many existing studies, the monitoring layer, communication layer, local control logic, and outage-reporting capability are not evaluated together within a single residential-scale prototype. Furthermore, per-load calibrated measurement, priority-based load shedding, backup-supported communication, and credit-aware load restriction are rarely examined as a coordinated control workflow under practical scenarios such as overload, power outage, and low-credit operation. Therefore, this study addressed this integration gap by developing and experimentally evaluating a residential IoT energy-management prototype that combines calibrated main-source and per-load monitoring, local rule-based control, 4G/MQTT cloud reporting, battery-supported outage notification, and low-credit-based load restriction within one unified platform.
This paper presents a prototype-level IoT-based energy-management platform for real-time energy monitoring and smart load management in residential microgrid environments. The study does not claim novelty from the standalone use of dual processors, 4G communication, cloud monitoring, load shedding, or backup power. Rather, its contribution lies in the coordinated integration of these functions within a single experimentally implemented residential prototype. The proposed system includes a smart-meter unit capable of measuring voltage, current, active power, apparent power, power factor, and energy consumption at both the main-source and per-load levels. It adopts a dual-processor architecture, where the primary microcontroller performs real-time sensing and low-level load control, while the secondary processor manages data handling, rule-based local control decisions, data publishing, and cloud communication. The system also integrates 4G-based IoT connectivity to support data transmission independently of household Wi-Fi infrastructure, together with a backup power system that maintains the monitoring and communication subsystems during main power outages. In addition, a centralized cloud platform is implemented to support data aggregation, real-time dashboard visualization, historical storage, remote monitoring, and automatic alert generation. Beyond monitoring, the system supports smart load control through priority-based load shedding, outage reporting, and low-credit-based load restriction. Accordingly, the specific value of the proposed platform is demonstrated at the application-scenario level, where calibrated per-load monitoring, local rule-based control, outage-resilient reporting, and credit-aware load restriction are evaluated under practical operating conditions.

2. Materials and Methods

The research methodology followed a multi-phase workflow, as illustrated in Figure 1, starting from hardware development and firmware design to cloud integration and experimental evaluation. The first phase focused on designing the smart energy-management unit, including voltage- and current-sensing circuits, a power-monitoring circuit, load-control circuits, a local display, and a backup power system. The unit is built around a custom IoT hub that integrates a primary microcontroller and a secondary processor to support two-level data acquisition, processing, and control. A dedicated 4G communication module is also incorporated to ensure independent and reliable connectivity during network or power interruptions.
The firmware design is divided into three main layers. The primary processor firmware is responsible for real-time voltage and current acquisition, preliminary power analysis, local load switching, backup-source monitoring, and serial data exchange with the secondary processor. The secondary processor firmware handles data reception, local visualization, higher-level energy-management decisions, and MQTT-based communication with the cloud platform. The central hub firmware, hosted on a cloud server, acts as the IoT broker and data-management layer, receiving telemetry from distributed units, storing and processing data, supporting remote monitoring and control, and generating real-time dashboards. The final phase evaluates the implemented prototype under practical operating scenarios. These tests include normal monitoring, overload and peak-demand conditions, voltage-drop or outage events, backup power operation, demand–response control, and user notification.
This evaluation examines the ability of the prototype to perform calibrated measurement, rule-based load control, backup-supported communication, and cloud-based reporting under representative residential operating conditions.

2.1. Hardware Design of the Smart Energy-Management Unit

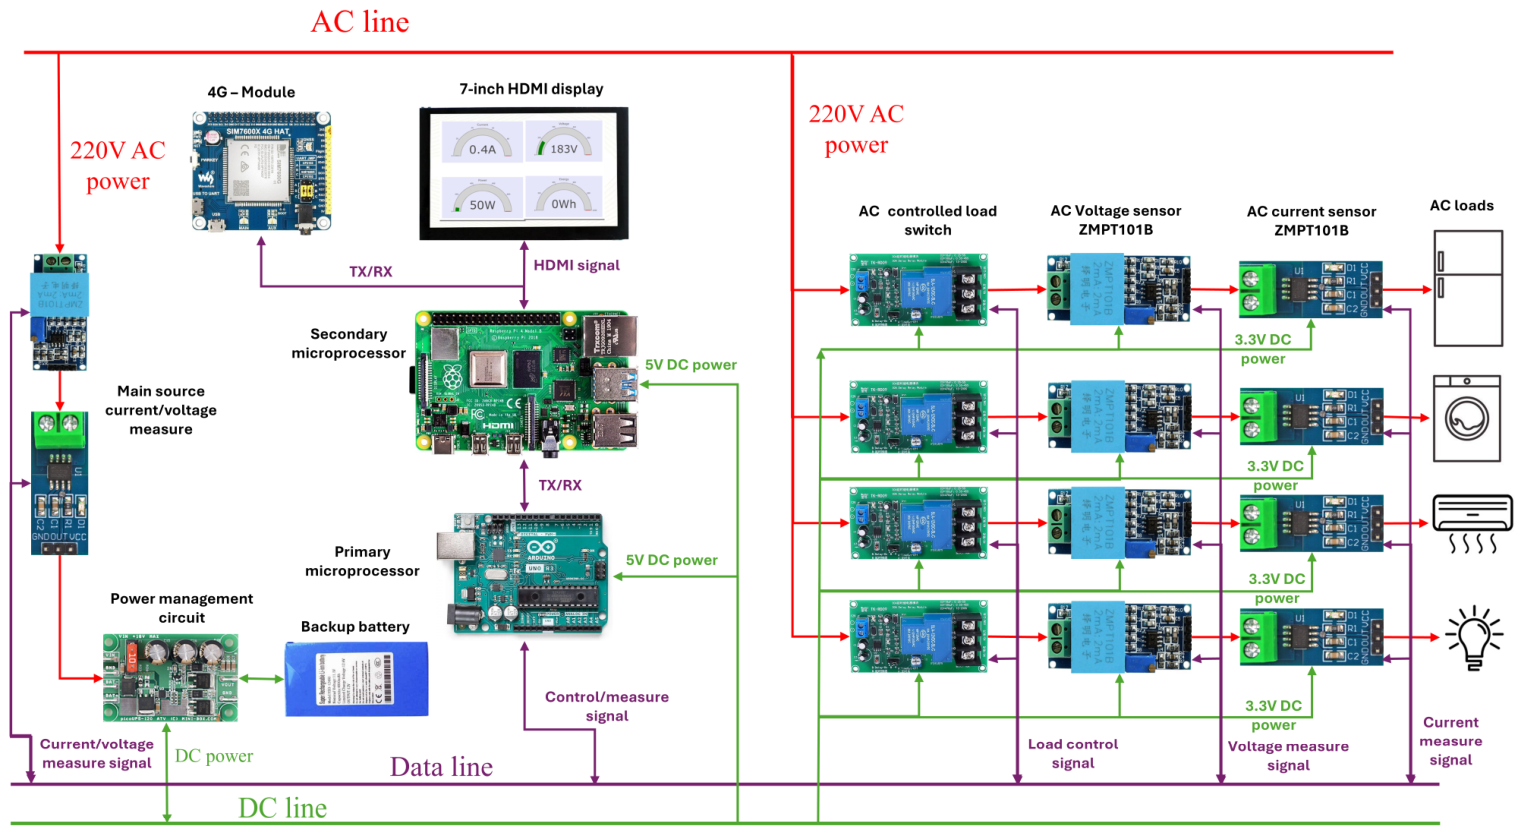
The proposed smart energy-management unit is organized into three main domains—the AC line, DC line, and data line—as shown in Figure 2. The AC line receives the 220 V, 50 Hz mains supply and feeds the controlled household loads, while the DC line provides regulated 5 V and 3.3 V supplies for the embedded electronics, sensors, communication module, and local display. The data line carries the measurement and control signals between the sensing circuits, the primary microcontroller, the secondary microprocessor, and the communication interface. At the input stage, the main supply is monitored using a ZMPT101B voltage sensor (Qingxian Zeming Langxi Electronic Devices Co., Ltd., Cangzhou, Hebei, China) and ACS712 current sensors (Allegro MicroSystems, Inc., Manchester, NH, USA). The acquired analog signals are conditioned and scaled to match the analog-to-digital converter (ADC) input range of the primary microcontroller. A power-management circuit converts the AC input into stable DC rails and interfaces with a backup lithium battery.
During normal operation, the mains supply powers the system and charges the battery. During outages, the automatic switchover circuit keeps the measurement and communication subsystems active, enabling continuous outage reporting. The system has a dual-processor architecture. The primary microcontroller performs real-time sensing, basic electrical calculations, and low-level load control. It computes root mean square (RMS) voltage, RMS current, active power, apparent power, power factor, and energy consumption for the main source and individual load channels. It also controls the load-switching circuits and exchanges data with the secondary processor through a serial TX–RX link. The secondary microprocessor, implemented using a single-board computer such as a Raspberry Pi 4 Model B, handles high-level processing, local visualization, and cloud communication. It receives measurement frames from the primary controller, displays real-time electrical parameters on a 7-inch high-definition multimedia interface (HDMI) screen, model NX8048P070-011C-Y (ITEAD Intelligent Systems Co., Ltd., Shenzhen, Guangdong, China), and hosts the energy-management agent for load prioritization, scheduling, anomaly detection, and demand–response decisions. It also manages MQTT communication through a dedicated 4G long-term evolution (LTE) module, allowing the system to remain connected independently of the household Wi-Fi network.
On the load side, each controlled appliance is connected through a repeated sensing and switching channel consisting of an isolated relay, a voltage sensor, and a current sensor. This enables independent monitoring and control of each load according to protection limits, demand–response commands, or energy-management policies. Overall, this section describes how the hardware elements are arranged to support coordinated per-load monitoring, local switching, backup-supported supervision, and cloud communication within the implemented prototype.

2.2. Measurement Model and Sensor Calibration

To convert the raw outputs of the voltage and current sensors into physical electrical quantities, a standardized measurement model was adopted. The model includes analog-to-digital conversion, offset removal, RMS estimation, sensor-path calibration, and power and energy calculations. The primary microcontroller samples the voltage- and current-sensing channels using a B - b i t ADC with reference voltage V r e f . For each sample i n d e x   n , the raw ADC counts of the voltage and current channels are denoted D v [ n ] and D i [ n ] , respectively. The corresponding ADC input voltages are calculated as follows:
u v n = D v [ n ] 2 B 1 V r e f ,   u i n = D i [ n ] 2 B 1 V r e f
where u v n and u i n are the ADC-domain voltage signals in volts, D v [ n ] and D i [ n ] are the raw ADC counts, B is the ADC resolution in bits, and V r e f is the ADC reference voltage.
Because the AC sensing circuits are biased around a DC offset to match the ADC input range, the offset component must be removed before RMS and power calculations. The zero-mean voltage and current channel signals are obtained as:
x v n = u v n U o f f , v ,   x i n = u i n U o f f , i
where U o f f , v and U o f f , i are the DC offset voltages of the voltage and current measurement channels, respectively.
The RMS values in the ADC domain are then calculated over an N - s a m p l e window as:
U v ,   r m s = 1 N n = 1 N x v [ n ] 2 ,   U i ,   r m s = 1 N n = 1 N x i [ n ] 2
The voltage measurement channel is based on a voltage-sensing path that uses a small isolation transformer followed by an analog conditioning circuit. If N P and N s denote the primary and secondary turns, respectively, the ideal secondary voltage is related to the line voltage by:
v s e c n =   N s N p v l i n e [ n ]
After amplification, attenuation, and biasing, the ADC input voltage of the voltage channel can be expressed as:
u v n = α v v l i n e n + U o f f , v
where α v is the overall voltage-channel scaling coefficient in V A D C / V l i n e . This coefficient includes the transformer ratio and the gain of the analog conditioning stage. After offset removal, the instantaneous line voltage and its RMS value are recovered as:
v l i n e n =   U v , r m s α v ,   V l i n e , r m s =   U i , r m s α i
For the current measurement channel, if a current transformer is used, the secondary current is related to the primary line current by:
i s n = N p N s i l i n e [ n ]
where i l i n e [ n ] is the primary line current and i s n is the CT secondary current. When the secondary current flows through the burden resistor R b , the resulting burden voltage is:
v b n = R b i s [ n ]
After the burden resistor and conditioning stage, the ADC input voltage of the current channel is given by:
u i n = α i i l i n e n + U o f f , i
where α i is the overall current-channel scaling coefficient in V A D C / A l i n e . For a CT-based channel, this coefficient includes the CT ratio, burden resistor, and conditioning-stage gain. After offset removal, the instantaneous line current and its RMS value are obtained as:
i l i n e n = x i [ n ] α i ,   I l i n e , r m s n = U i , r m s α i
The calibration coefficients α v and α i are determined experimentally by applying known reference voltage and current values and comparing them with the ADC-domain RMS values measured by the prototype. Accordingly, the calibration coefficients are calculated as:
α v = U v , r m s V r e f , r m s ,   α i = U i , r m s I r e f , r m s
where V r e f , r m s and I r e f , r m s are the reference RMS voltage and current measured using calibrated laboratory instruments.
After reconstructing the instantaneous voltage and current samples in physical units, the instantaneous active power is computed as:
p n =   v l i n e n i l i n e [ n ]
The average active power over the N - s a m p l e measurement window is:
P = 1 N n = 1 N p [ n ]
The apparent power is calculated from the RMS values of voltage and current as:
S = V l i n e , r m s I l i n e , r m s
The power factor is then obtained as the ratio between active power and apparent power:
P F = P S
Finally, the consumed energy over the measurement window is obtained by numerical integration of the instantaneous active power. For a sampling interval Δ t , the energy in joules is:
E J = n = 1 N p [ n ] t
The corresponding energy in kilowatt-hours is:
E k W h = E J 3.6 × 10 6
Alternatively, if the average active power P a v e is expressed in watts and the measurement interval T h is expressed in hours, the energy can be calculated as:
E k W h = P a v e T h 1000

2.3. Operating Firmware Design

2.3.1. Power Measurement and Management Subroutine

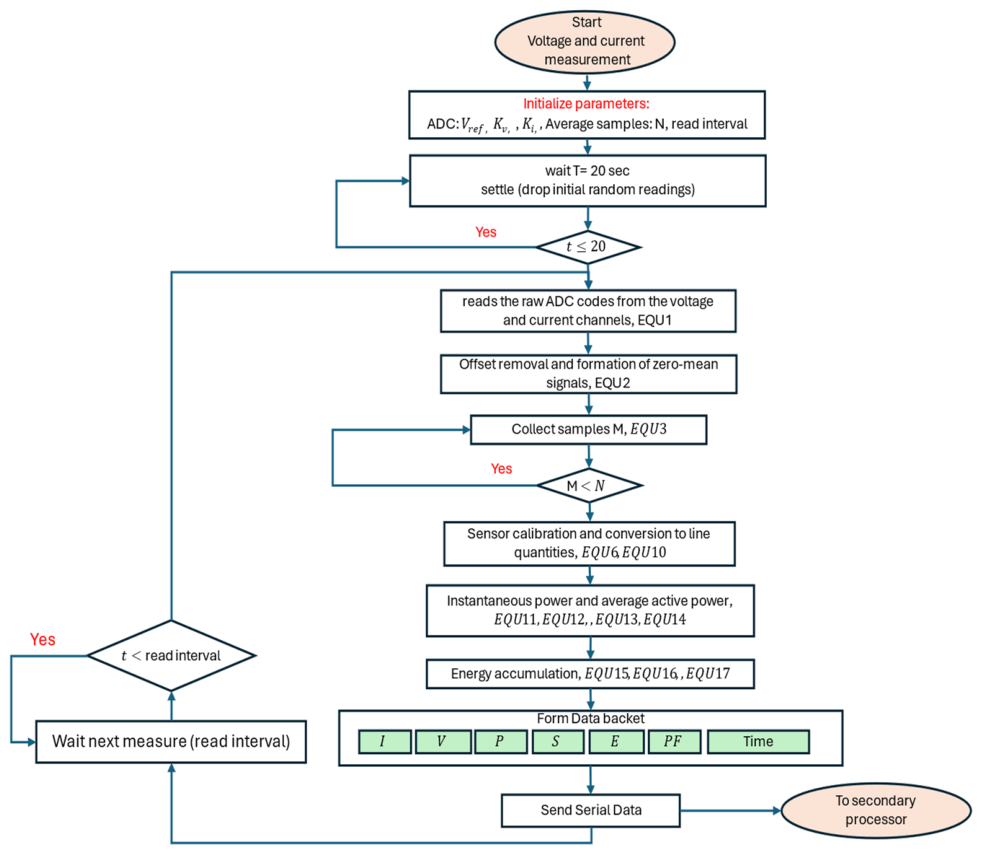
The primary processor executes the power measurement and management subroutine for each sensing channel, including the main source and the individual load channels, as shown in Figure 3. The procedure is summarized as follows.
  • Step 1: Parameter initialization
The routine starts by initializing the ADC parameters and calibration constants, including the reference voltage (Vref), voltage scaling factor (Kv), current scaling factor (Ki), number of averaging samples (N), and the measurement read interval.
  • Step 2: Sensor settling period
A short settling time of approximately 20 s is applied to eliminate unstable initial readings and allow the voltage and current sensors and the analog conditioning circuits to reach a stable operating state.
  • Step 3: ADC data acquisition
The primary processor reads the raw ADC codes from the voltage- and current-sensing channels. These digital values are converted into equivalent ADC input voltages using the ADC conversion equation.
  • Step 4: Offset removal
Since the AC signals are biased around a DC offset by the analog conditioning stage, the firmware removes this offset to obtain zero-mean voltage and current waveforms suitable for RMS and power calculations.
  • Step 5: Sample collection
The processor collects N samples within the measurement window for each sensing channel. The sampling loop continues until the required number of samples is completed.
  • Step 6: RMS calculation and sensor calibration
The RMS values of voltage and current are calculated from the sampled zero-mean signals. Then, the calibration coefficients are applied to convert the ADC-level RMS values into actual line quantities, namely V(line,rms) and I(line,rms).
  • Step 7: Power computation
Using the calibrated voltage and current samples, the instantaneous active power is calculated. The routine then computes the average active power (P), apparent power (S), and power factor (PF) for each channel.
  • Step 8: Energy accumulation
The consumed energy is updated by integrating the active power over the measurement interval. The accumulated energy is then converted into kilowatt hours (kWh) for energy monitoring and billing-related analysis.
  • Step 9: Data bucket formation
After processing all channels, the primary processor forms a compact data bucket containing the main electrical parameters: current (I), voltage (V), active power (P), apparent power (S), energy (E), power factor (PF), and timestamp.
  • Step 10: Serial data transmission
The prepared data bucket is transmitted to the secondary processor through the serial TX–RX interface. The secondary processor then uses these data for local visualization, energy-management decisions, MQTT publishing, and cloud-based monitoring.

2.3.2. Demand–Response and Load-Shedding Control Subroutine

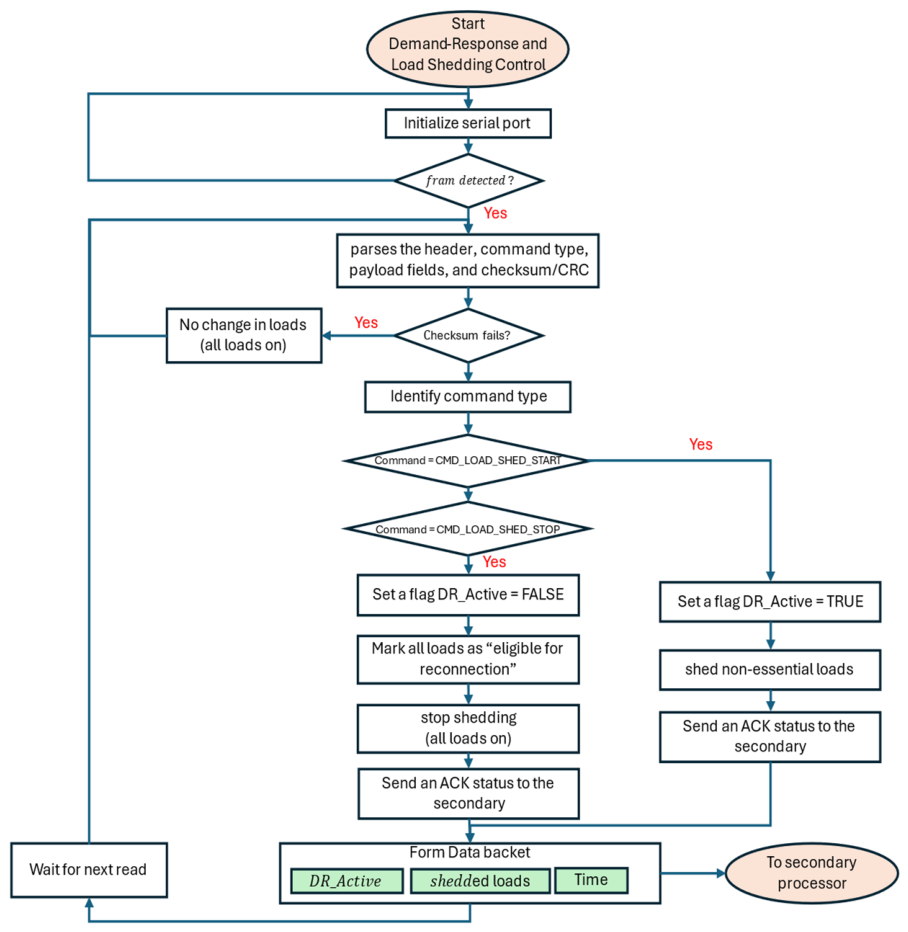
The demand–response and load-shedding control subroutine is executed on the primary processor to apply load- control commands received from the secondary processor, as illustrated in Figure 4. The procedure is summarized as follows:
  • Step 1: Serial port initialization
The primary processor starts by initializing the serial communication interface used to receive control commands from the secondary processor.
  • Step 2: Command-frame detection
The processor continuously monitors the UART line until a complete command frame is detected. If no frame is available, the routine remains in the waiting state.
  • Step 3: Frame parsing
Once a frame is received, the processor parses its main fields, including the header, command type, payload data, and checksum cyclic redundancy check (CRC).
  • Step 4: Frame validation
The checksum is verified to ensure that the received command is valid. If the checksum fails, no switching action is performed and the current load states remain unchanged. This prevents corrupted commands from causing unsafe or unintended load disconnection.
  • Step 5: Command identification
For a valid frame, the command type is identified. The routine distinguishes mainly between two commands: (CMD_LOAD_SHED_START) for activating load shedding and (CMD_LOAD_SHED_STOP) for stopping load shedding.
  • Step 6: Start load-shedding action
If the received command is (CMD_LOAD_SHED_START), the primary processor sets the demand–response flag as DR_Active=TRUEDR Then, the predefined non-essential loads are disconnected to reduce the total demand.
  • Step 7: Stop load-shedding action
If the received command is (CMD_LOAD_SHED_STOP), the processor clears the demand–response flag as DR_Active=FALSE All loads are then marked as eligible for reconnection, and the shedding process is stopped so that the loads can return to normal operation.
  • Step 8: Acknowledgement transmission
After executing the command, the primary processor sends an acknowledgement message to the secondary processor. This message confirms the updated demand–response status and the current state of the controlled loads.
  • Step 9: Data bucket formation
The processor forms a compact data bucket containing the demand–response status, the identifiers of the shed loads, and the timestamp.
  • Step 10: Data forwarding
The data bucket is transmitted to the secondary processor, which forwards the information to the monitoring interface and the central platform for visualization, logging, and higher-level decision-making.

2.3.3. Action Control Subroutine

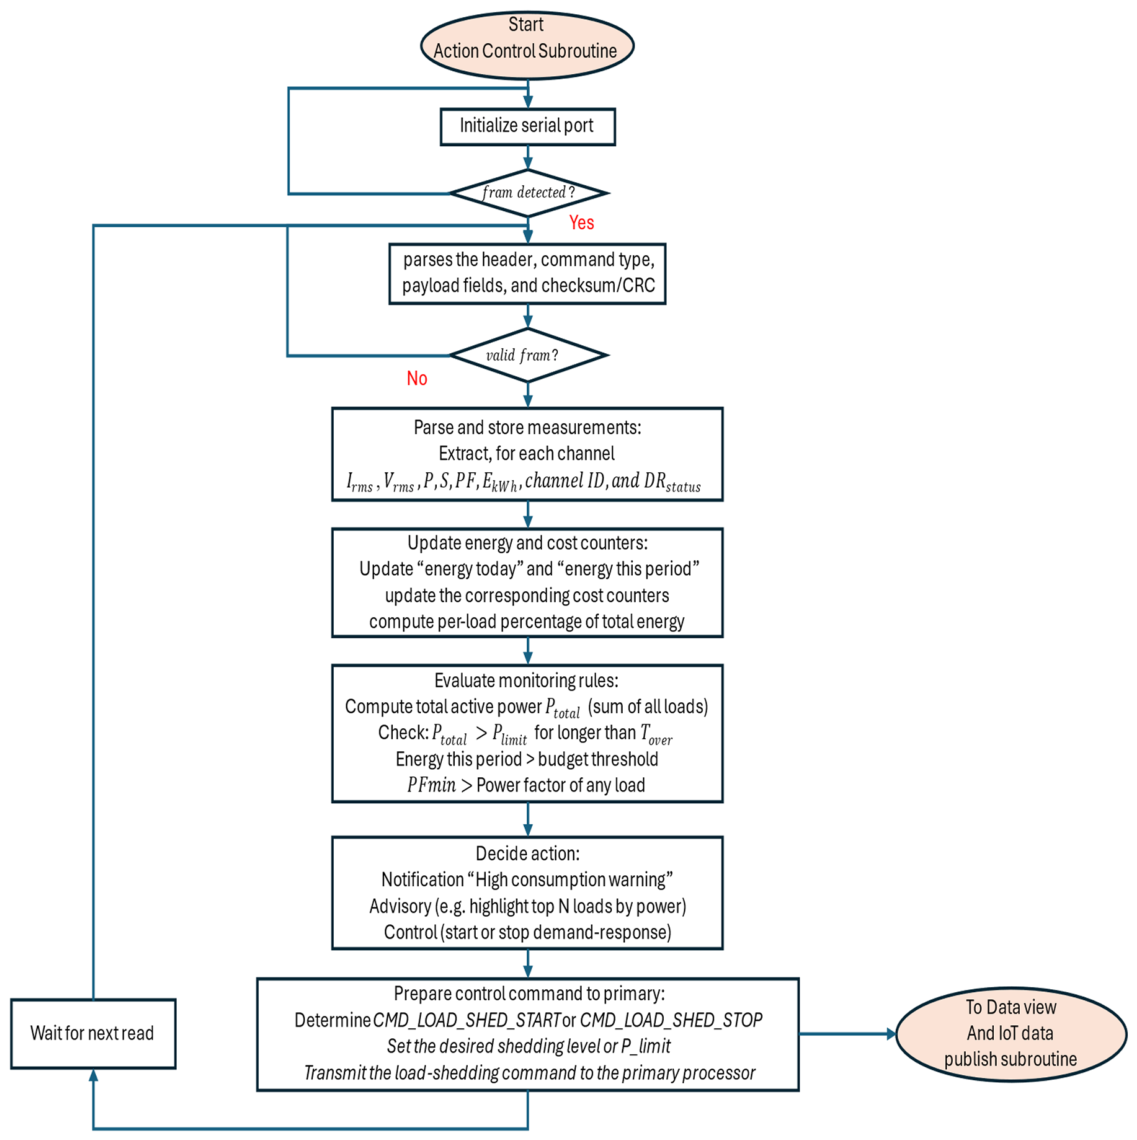
The action control subroutine is executed on the secondary processor and represents the local energy-management engine of the proposed smart meter, as illustrated in Figure 5. The subroutine receives measurement frames from the primary processor, analyzes the electrical status of the loads, evaluates the control rules, and determines the required action.
  • Step 1: Serial communication initialization
The secondary processor initializes the serial communication interface used to receive data frames from the primary processor.
  • Step 2: Frame detection and validation
The routine continuously monitors the UART interface until a new frame is detected. Once received, the frame is parsed to extract the header, command type, payload fields, and checksum/CRC. Invalid frames are discarded to prevent corrupted data from affecting the control decisions.
  • Step 3: Measurement extraction
For each monitored channel, including the main source and individual loads, the processor extracts the measured electrical parameters: RMS voltage (Vrms), RMS current (Irms), active power (P), apparent power (S), power factor (PF), accumulated energy (EkWh), channel identifier, and demand–response status.
  • Step 4: Energy and cost updating
The extracted measurements are used to update the daily and billing-period energy counters. The corresponding cost values are then calculated based on the configured tariff. In addition, the contribution of each load to the total energy consumption is computed to identify the dominant energy-consuming appliances.
  • Step 5: Monitoring rule evaluation
The subroutine evaluates the operating condition of the system by calculating the total active power P l o a d = P l o a d s . Then, it checks whether the total power exceeds the predefined limit (Plimit) for a specified duration (Tover), whether the consumed energy exceeds the budget threshold, or whether the power factor of any load falls below the acceptable limit.
  • Step 6: Action decision
Based on the detected condition, the subroutine selects the appropriate response. If the violation is minor, the system generates a notification such as a high-consumption warning. If further intervention is needed, it provides an advisory action such as identifying the top energy-consuming loads. In critical cases, it initiates a direct control action by activating or stopping demand–response.
  • Step 7: Control command preparation
When load control is required, the secondary processor prepares a command frame for the primary processor. The command may be either (CMD_LOAD_SHED_START) to disconnect non-essential loads or (CMD_LOAD_SHED_STOP) to restore normal operation. The command frame may also include the required shedding level or target power limit.
  • Step 8: Data forwarding
Finally, the updated measurements and control status are forwarded to the data-view and IoT data-publishing subroutines. These data are used for local visualization, cloud monitoring, and remote decision support.

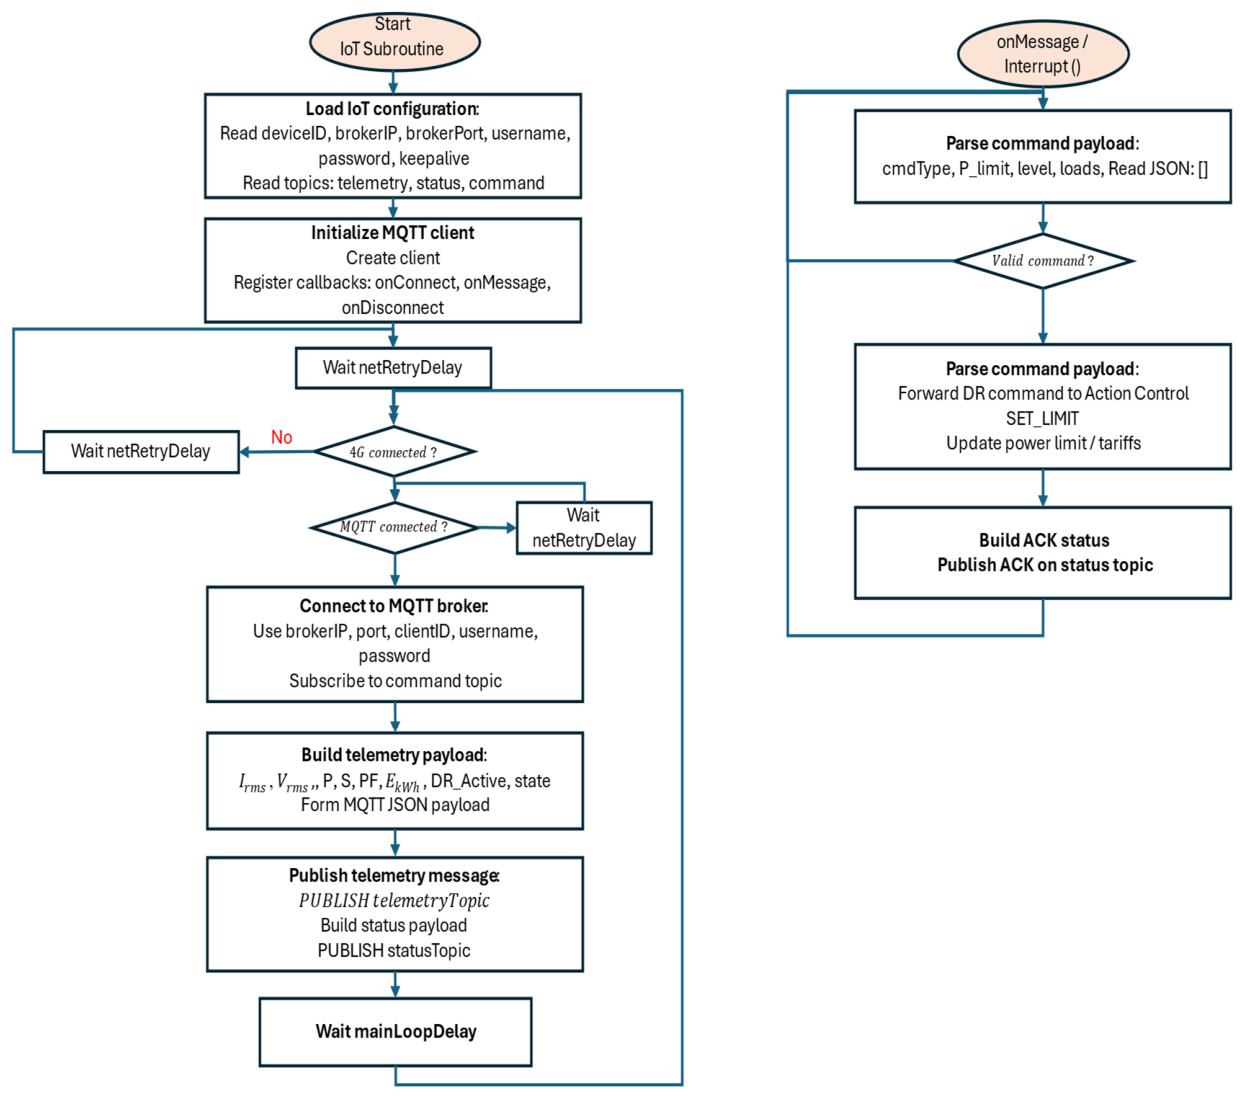
2.3.4. IoT–MQTT Communication Subroutine

The IoT subroutine runs on the secondary processor and is responsible for connecting the smart meter to the cloud platform through the MQTT protocol, as shown in Figure 6. The procedure can be summarized as follows.
  • Step 1: Load IoT configuration
The routine starts by loading the required IoT parameters, including the device ID, broker IP address, port, username, password, keep-alive interval, and the names of the telemetry, status, and command topics.
  • Step 2: Initialize MQTT client
An MQTT client is then created and the main callback functions are registered, including connection, message reception, and disconnection callbacks.
  • Step 3: Check 4G connectivity
Before any communication starts, the routine checks the 4G-modem status. If the network is unavailable, the system waits for a retry delay and keeps checking until connectivity is restored.
  • Step 4: Connect to the MQTT broker
Once the 4G connection is available, the client attempts to connect to the MQTT broker using the stored credentials. If the connection fails, the system waits and retries. After a successful connection, the device subscribes to the command topic.
  • Step 5: Build telemetry payload
When new measurements become available, the subroutine collects the main parameters for each channel, such as Irms, Vrms, active power (P), apparent power (S), power factor (PF), accumulated energy (EkWh), demand–response status, and load state. These data are formatted into an MQTT JSON payload.
  • Step 6: Publish telemetry and status data
The telemetry payload is published to the telemetry topic. In addition, a condensed status payload is generated and published to the status topic to report device status, alarms, and communication state.
  • Step 7: Wait for the next communication cycle
After publishing, the routine waits for a predefined main-loop delay before starting the next communication cycle.
  • Step 8: Receive cloud commands
Incoming commands from the cloud are handled through the onMessage callback. When a command arrives, the routine reads and parses the JSON payload to extract the command type and its parameters, such as power limit, shedding level, or target loads.
  • Step 9: Validate and process the command
The received command is validated first. If it is valid, demand–response commands are forwarded to the action control subroutine, while configuration commands such as updating the power limit or tariff are applied locally.
  • Step 10: Build and publish ACK status
Finally, the routine builds an acknowledgement message (ACK or NACK) indicating the result of the command processing and publishes it on the status topic.

3. Results

3.1. Prototype Implementation and Sensor Calibration

3.1.1. Prototype Implementation

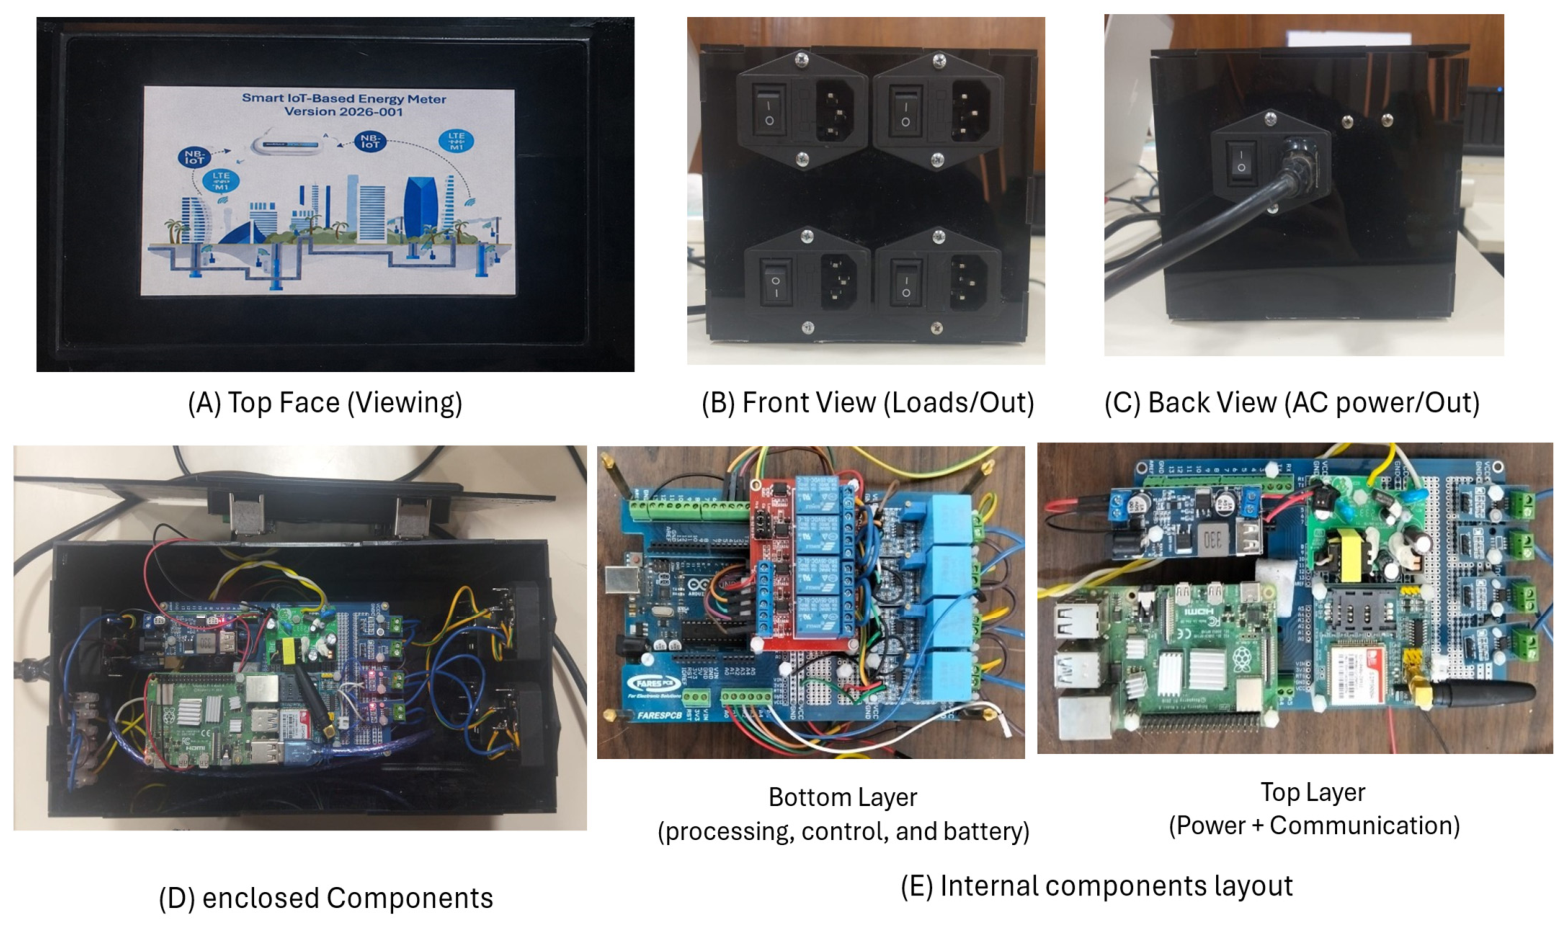
To validate the proposed IoT-based smart energy-monitoring and load-management system, a fully functional hardware prototype was designed and experimentally evaluated. The prototype was implemented as a real-time platform for electrical measurement and rule-based load switching under controlled laboratory conditions. The prototype integrates sensing units, embedded processors, communication modules, and load-switching circuits within a custom enclosure, as shown in Figure 7. The architecture follows a dual-layer design, separating time-critical measurement and control tasks from high-level processing and communication functions. The lower layer comprises the primary microcontroller, sensing circuits, relay-based load control, and backup power subsystem, while the upper layer includes a single-board computer acting as an IoT gateway with cellular communication and power-management modules. This architecture ensures deterministic real-time operation, continuous monitoring, and reliable cloud connectivity, enabling scalable and resilient energy management.
The 4G communication technology was selected because it provides wide geographic coverage, mature infrastructure, relatively low deployment cost, and sufficient bandwidth and latency for the MQTT-based monitoring and control messages used in the proposed system. It also allows the system to operate independently of the household Wi-Fi network, which may become unavailable during faults or power interruptions. Since the transmitted data mainly consist of low-rate electrical measurements, load states, alarms, and control acknowledgements, the available 4G performance is adequate for the current application.
Replacing 4G with 5G could reduce communication latency, improve connection reliability, and support a larger number of simultaneously connected monitoring nodes. However, the expected improvement in the present application would be moderate because the MQTT-message data are relatively small and the control decisions are primarily executed locally. The proposed architecture is communication technology-independent; therefore, migration to 5G would mainly require replacing the cellular communication module and updating its network configuration without changing the measurement or control logic. Nevertheless, 5G deployment may increase hardware cost, energy consumption, and dependence on local network coverage.

3.1.2. Calibration of Current and Voltage Sensors

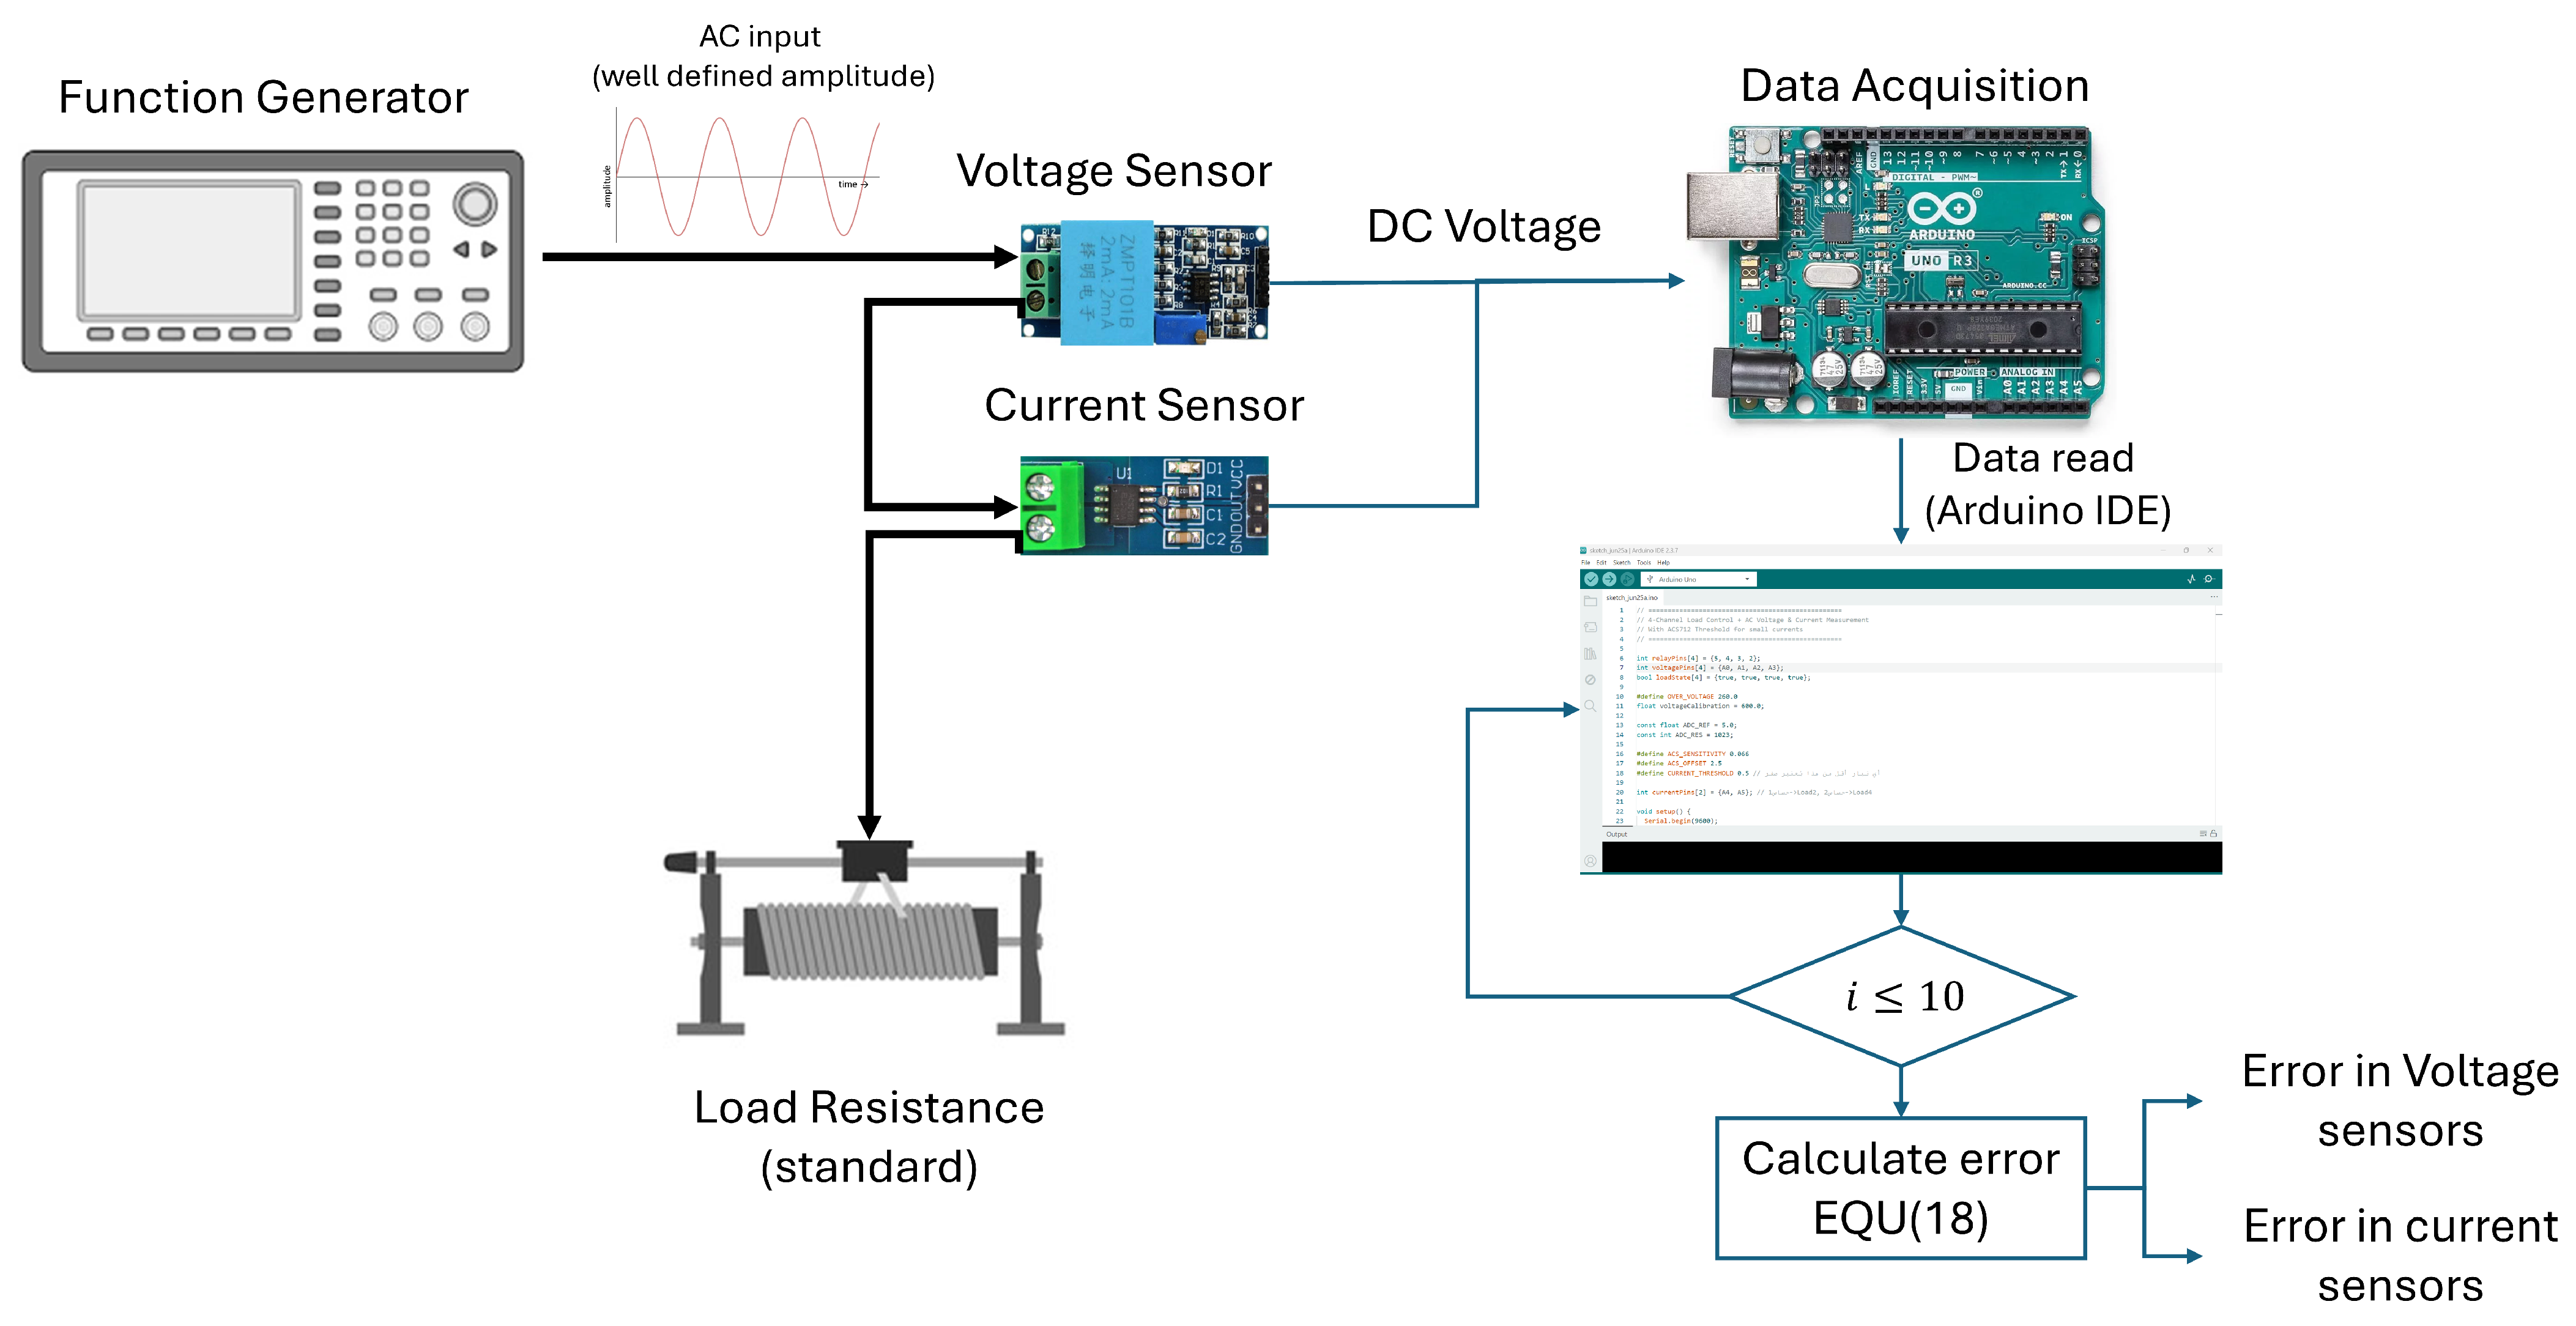
Accurate voltage and current measurements are essential for reliable energy monitoring and load control. Therefore, the sensing modules were calibrated experimentally using the setup shown in Figure 8. A laboratory function generator was used to generate a controlled sinusoidal AC signal of approximately 50 V RMS, which was applied to the voltage sensor and to a known resistive load for current measurement. A calibrated digital multimeter was used as the reference instrument, and its readings were compared with the values measured by the proposed system. The sensor outputs were acquired by the primary microcontroller through the ADC channels and processed using the embedded measurement algorithms described in Section 2. For each of the four sensing channels, multiple readings were recorded from an Arduino IDE serial monitor and averaged to reduce noise and measurement fluctuations. The averaged measured values were then compared with the reference values to evaluate the sensor accuracy and determine the required calibration coefficients. The measurement error was calculated as:
E r r o r % = X m e a s u r e d X r e f e r e n c e X r e f e r e n c e × 100
where X m e a s u r e d represents the value measured by the proposed system and X r e f e r e n c e represents the value measured by the calibrated laboratory instrument. This calibration procedure compensates for sensor gain variations and ensures that the monitoring platform provides reliable measurements for real-time energy-management applications.

3.1.3. Calibration Results

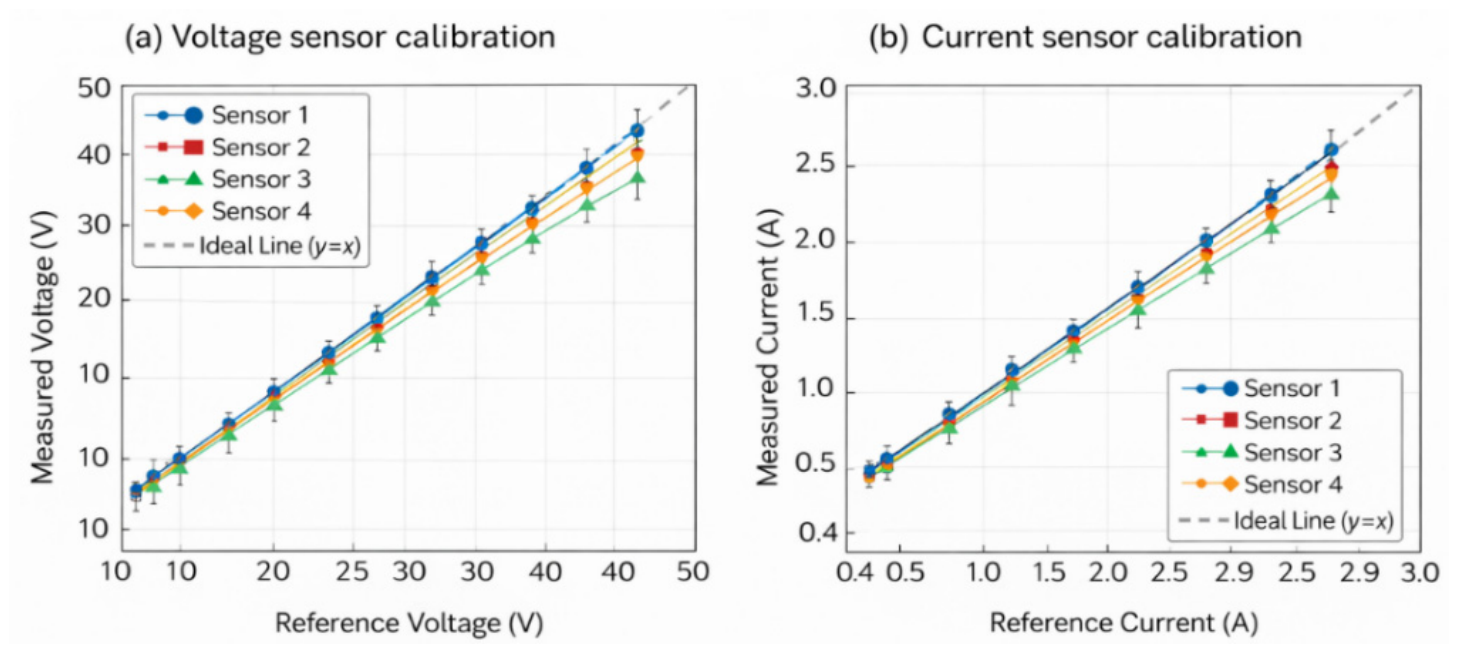
The calibration procedure was applied to the four voltage- and current-sensing channels of the prototype. For each calibration point, ten consecutive readings were recorded through the Arduino serial interface and averaged to reduce noise and random fluctuations. The voltage calibration results are summarized in Table 2. The measured voltage values closely matched the reference values, with errors generally within approximately 1–2% across the tested voltage range. Similarly, the current calibration results in Table 3 show that the current measurement error remained below approximately 3% for all tested channels. The calibration curves in Figure 9 confirm an approximately linear relationship between the reference values and the measured sensor outputs for both voltage and current measurements. This linear behavior indicates stable sensor response and validates the effectiveness of the calibration process. Overall, the results confirm that the proposed monitoring system provides sufficiently accurate measurements for real-time residential energy-monitoring and smart load-control applications.

3.2. IoT-Based Central Monitoring and Data Publishing

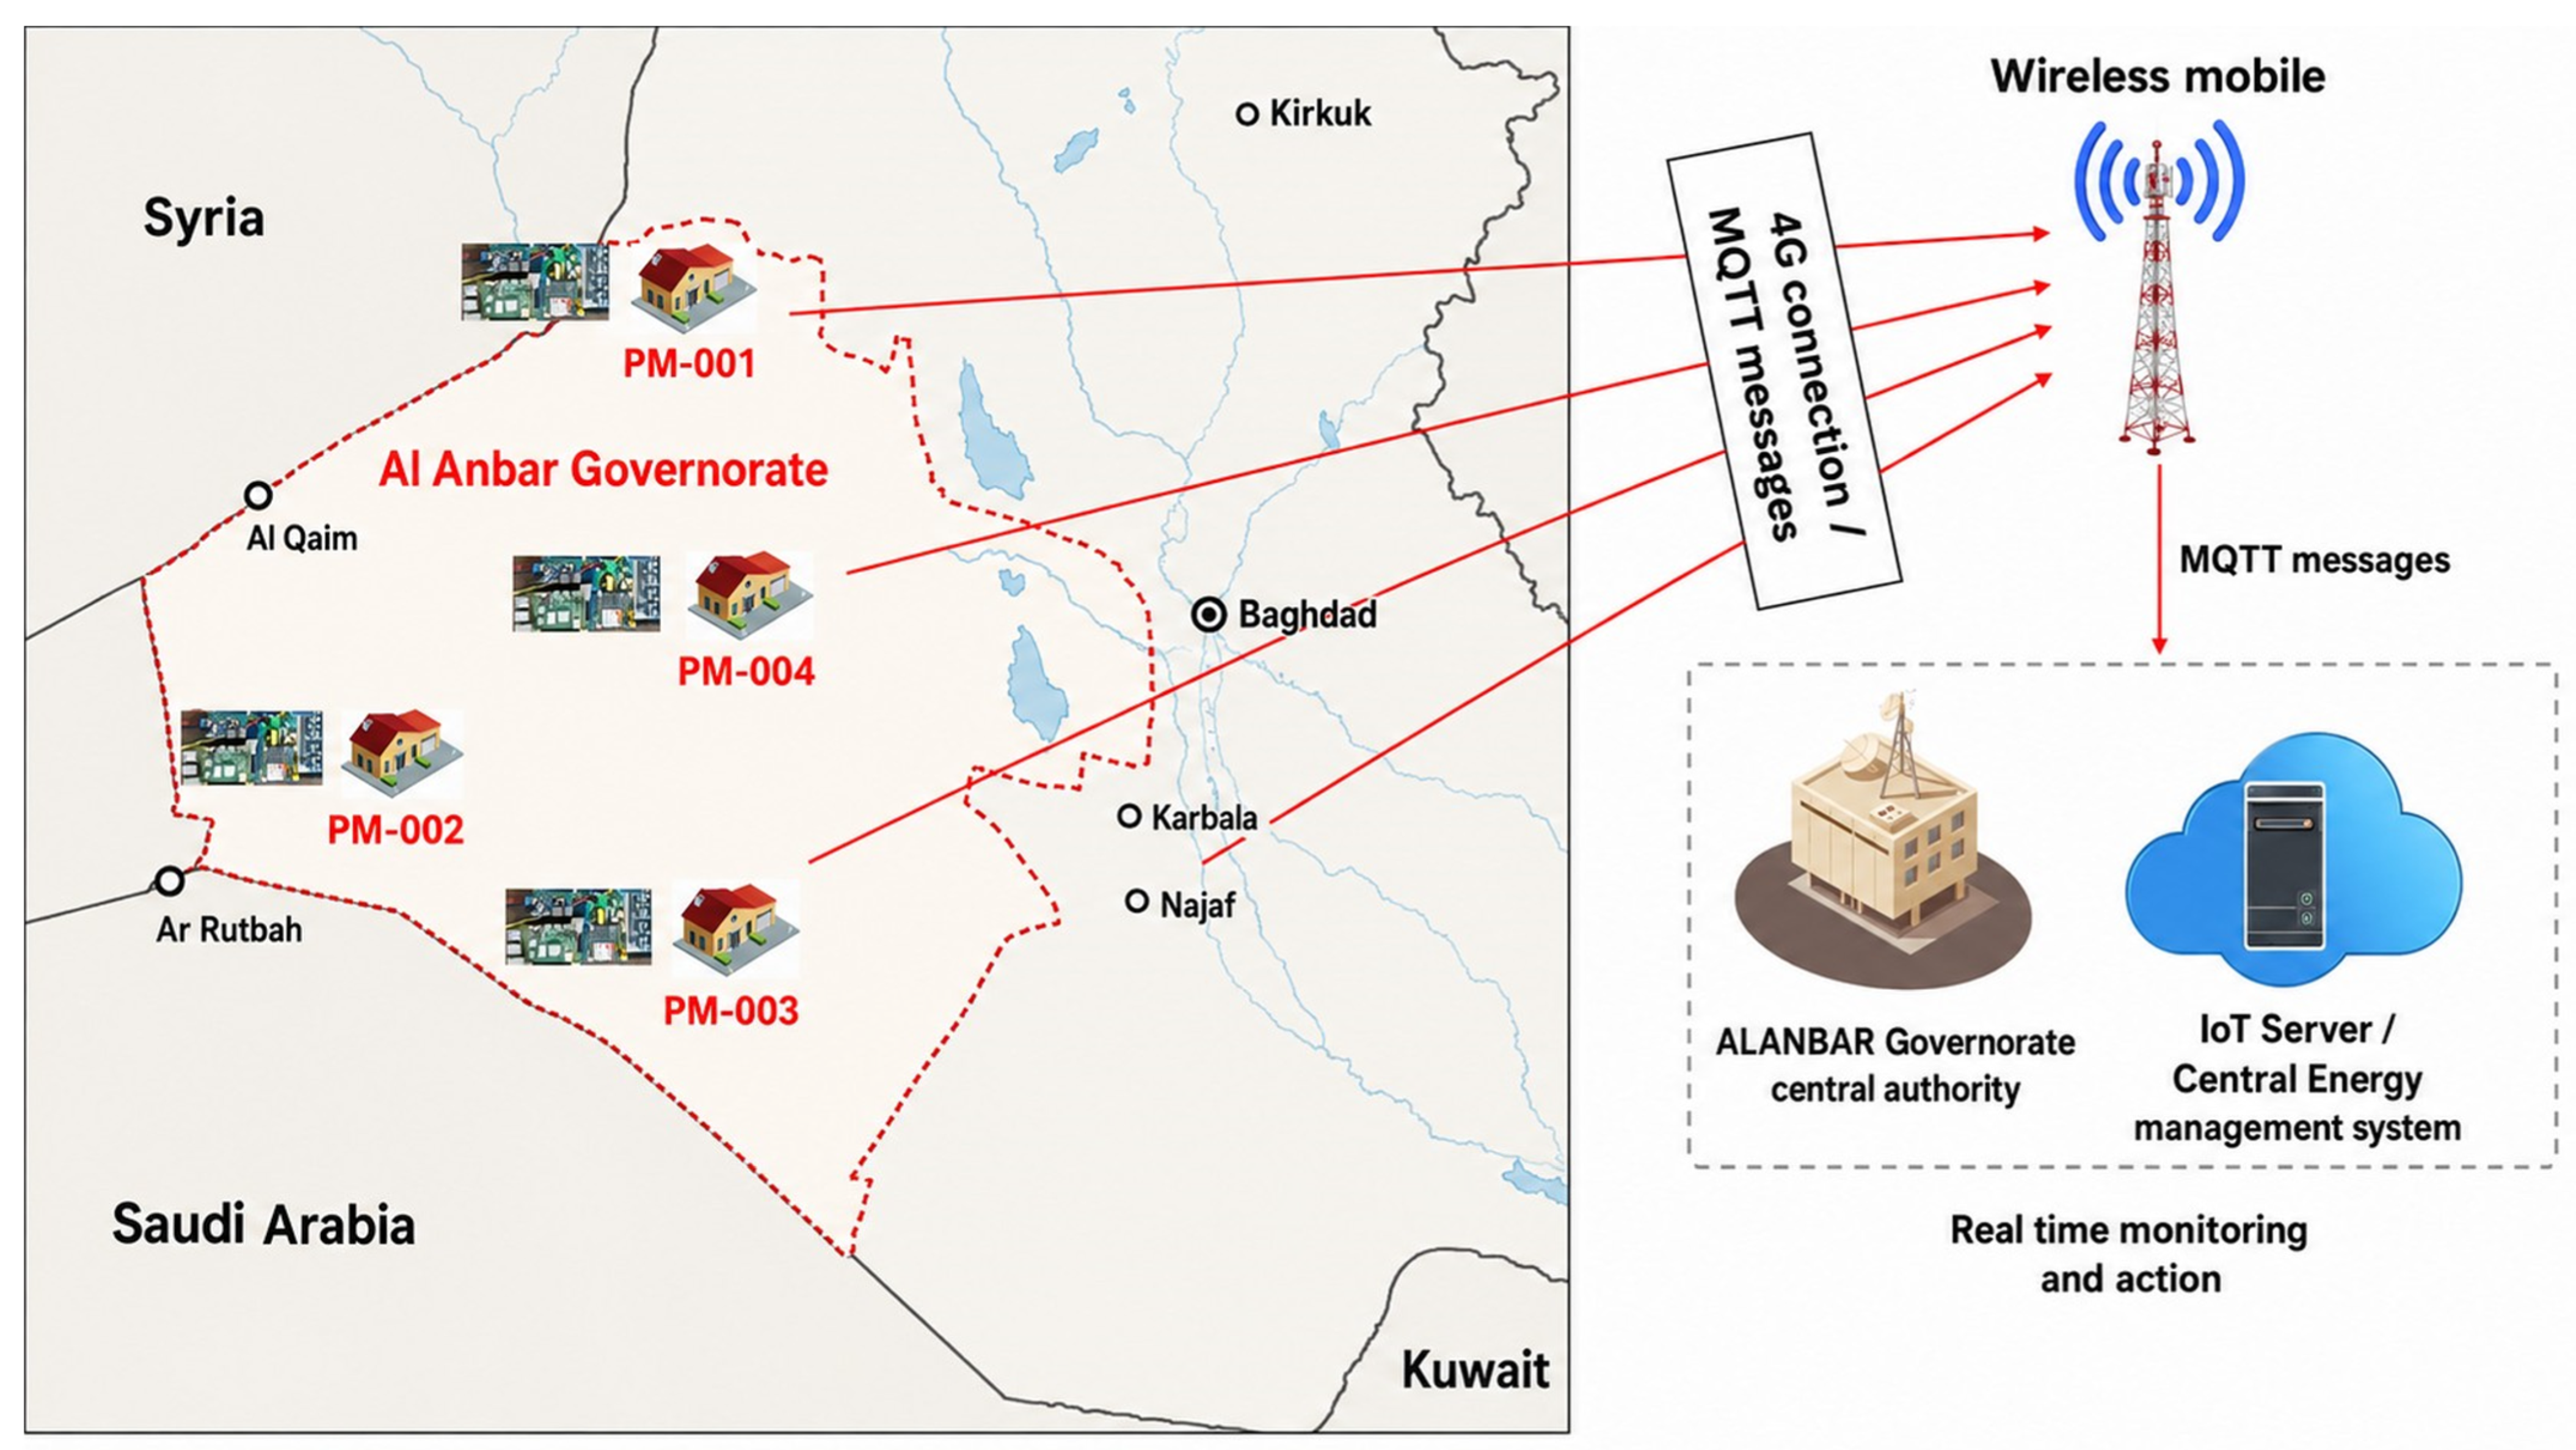
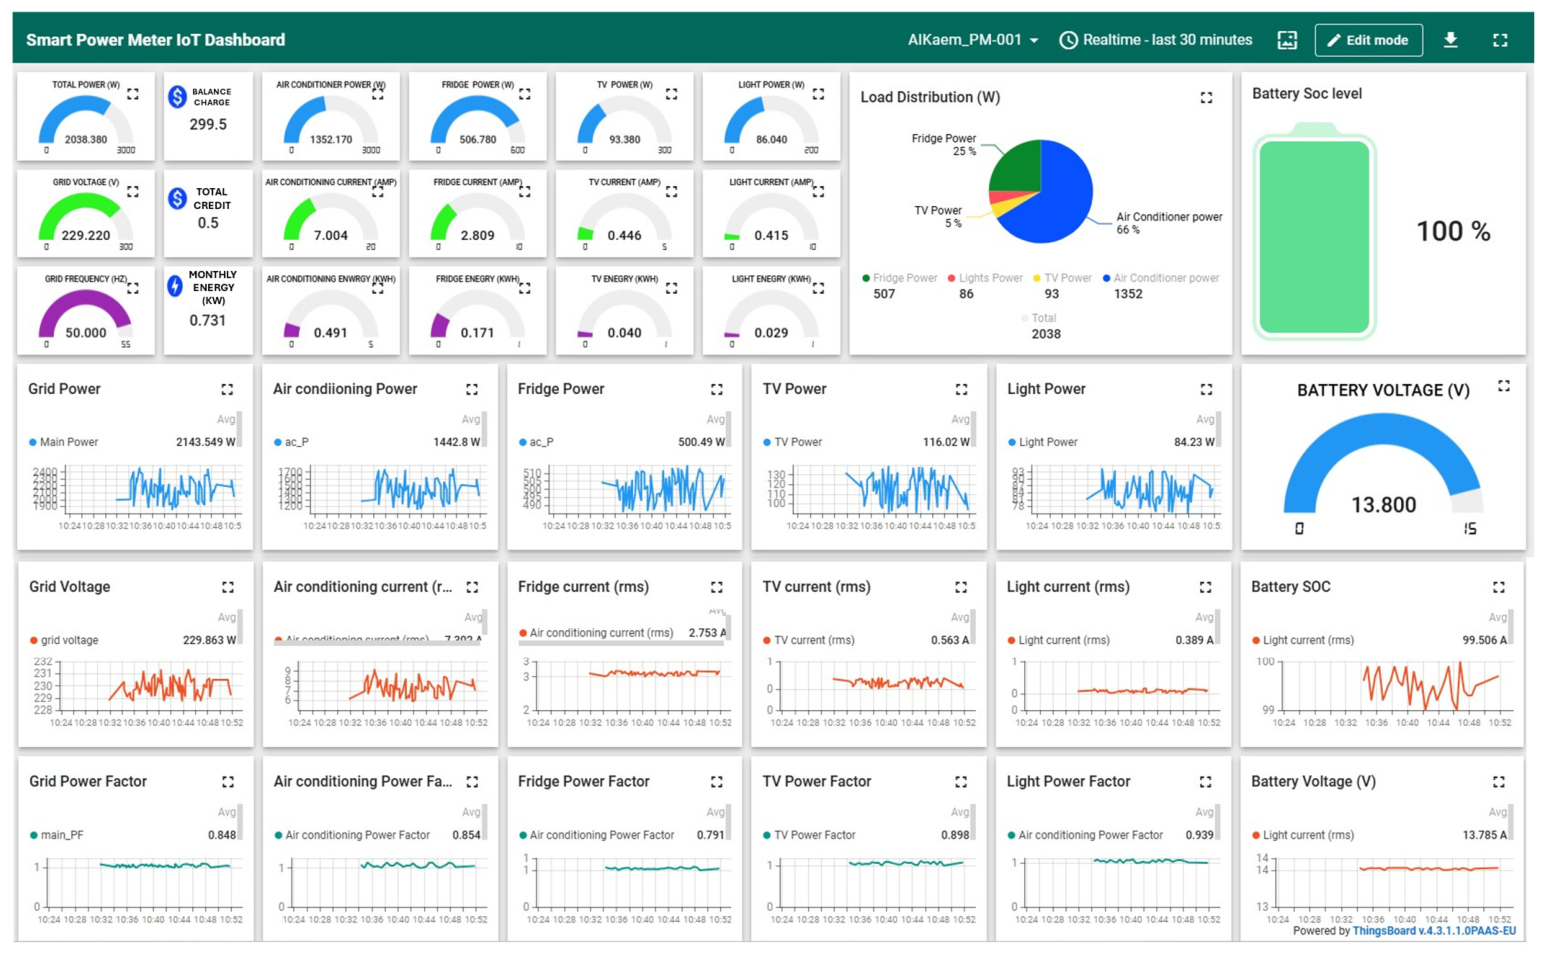
To support real-time monitoring and scalable deployment, the proposed system adopts an IoT communication framework based on 4G cellular connectivity and the MQTT publish/subscribe protocol. As illustrated in Figure 10, multiple smart energy-monitoring units are deployed at different locations, where each unit operates as an independent IoT node. Each node continuously measures electrical parameters, including voltage, current, power, energy consumption, and battery status, and publishes these data to a centralized cloud platform using authenticated MQTT messages. The transmitted data are received by a centralized IoT server that functions as the MQTT broker and data aggregation layer. This server collects telemetry streams from all deployed units and forwards them to the central energy-management system. The use of centralized data publishing allows all monitoring nodes to be visualized and managed through a unified platform, enabling real-time aggregation, remote supervision, and centralized decision-making. The architecture is also scalable, as additional monitoring devices can be integrated without changing the core system structure. A cloud-based dashboard was developed to visualize the received data in real time, as shown in Figure 11 for representative monitoring stations such as PM-001, PM-002, PM-003, and PM-004. The dashboard displays key electrical parameters, including total power consumption, grid voltage, frequency, RMS current, cumulative energy, power factor, and load-specific power for appliances such as air conditioners, refrigerators, televisions, and lighting systems. It also provides load-distribution charts, battery status indicators, and time-series plots for continuous tracking of system behavior. Overall, the IoT monitoring framework enables distributed sensing, reliable 4G-based data transmission, centralized visualization, and real-time supervision of multiple residential energy nodes, making the proposed system suitable for large-scale smart energy-monitoring and -management applications.

3.3. Functional System Evaluation Under Practical Operating Scenarios

This section evaluates the proposed system under practical operating conditions that require autonomous control actions. After verifying normal real-time monitoring and data publishing, the system was tested under predefined scenarios representing abnormal or constrained operation. Each scenario includes an initial condition, a triggering event, a control decision, and the corresponding system response in terms of load status, battery operation, and reported telemetry. Each monitored node includes four load slots: two essential loads and two non-essential loads. Under normal operation, all loads can remain active. However, when abnormal conditions are detected, the control logic applies a priority-based policy that preserves critical loads and disconnects secondary loads when needed. The evaluated scenarios, summarized in Table 4, include overload operation, main power outage, low-credit operation, and automatic fault notification. These tests demonstrate that the proposed platform operates not only as a monitoring system but also as an active energy-management unit capable of load prioritization, automatic shedding, outage reporting, and real-time alerting.

3.3.1. Scenario 1: Overload Condition and Automatic Load Shedding

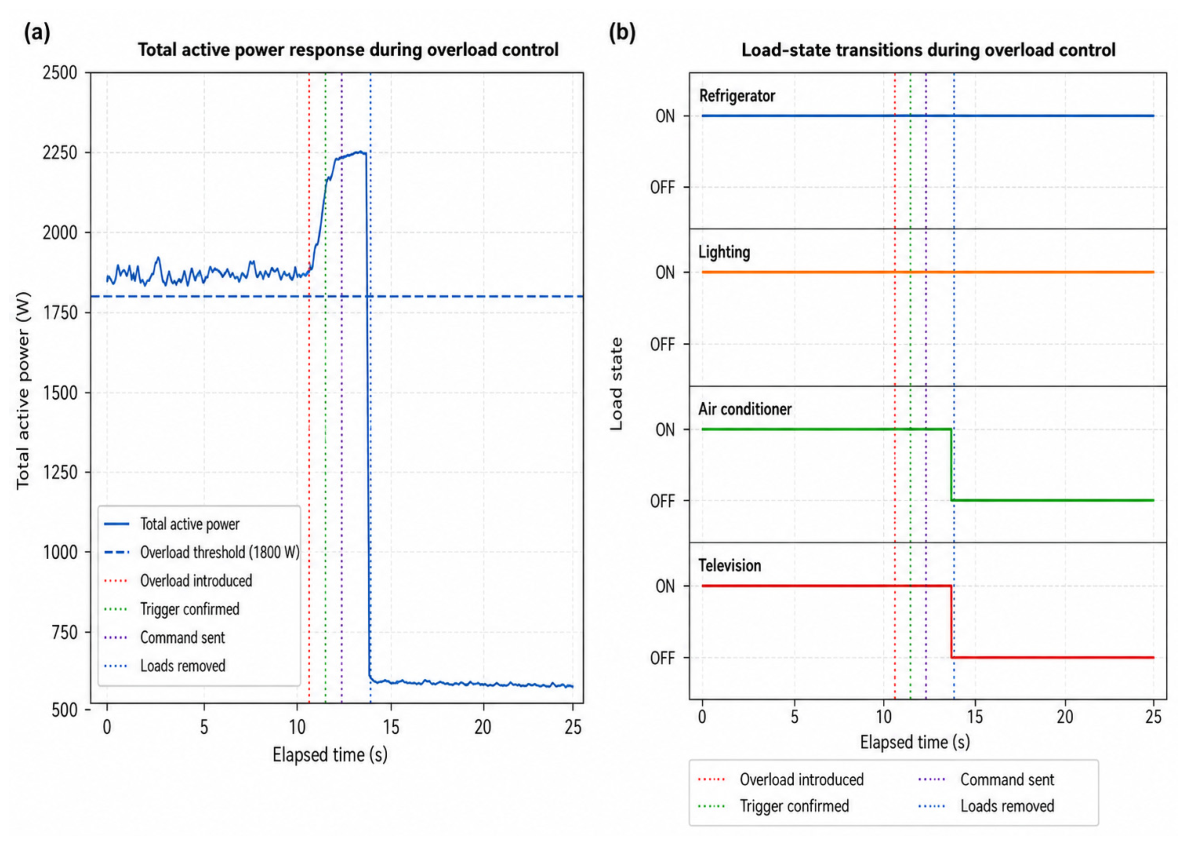
The overload scenario was implemented by increasing the total active power above the predefined threshold of 1800 W. All four loads were initially energized to represent a residential peak-demand condition. An overload was confirmed when the total active power remained above the threshold for 0.50 s. Once the trigger was confirmed, the secondary processor issued the CMD_LOAD_SHED_START command to the primary controller. The control policy retained the refrigerator and lighting as essential loads, while the air conditioner and television were disconnected as non-essential loads. To prevent rapid switching and repeated reconnection, a hysteresis-based recovery rule was applied. The disconnected loads remained unavailable until the total demand decreased below 70% of the maximum allowable power and the system reached a stable operating condition.
The quantitative results are summarized in Table 5. Across the repeated runs, the mean total active power before load shedding was 2242.63 W, whereas the mean post-action power was 586.50 W. This corresponds to a power-demand reduction of 73.84%. The acknowledged end-to-end response time, measured from trigger confirmation to acknowledgement reception, was 240.5 ± 23.4 ms. The MQTT publishing success rate was 99.42 ± 0.47%, with a mean publishing latency of 115.19 ms. In the representative event sequence, the overload trigger was confirmed at 10.500 s, the control command was issued at 10.550 s, received at 10.593 s, and the load-state transition occurred at 10.658 s. The acknowledgement was received at 10.740 s, and the system reached a stable post-action condition at 10.962 s.
Figure 12a shows the total active-power response and the 1800 W overload threshold, while Figure 12b illustrates the corresponding load-state transition. Following the control action, the refrigerator and lighting remained energized, whereas the air conditioner and television were disconnected.

3.3.2. Scenario 2: Main Power Outage and Battery-Backed Reporting

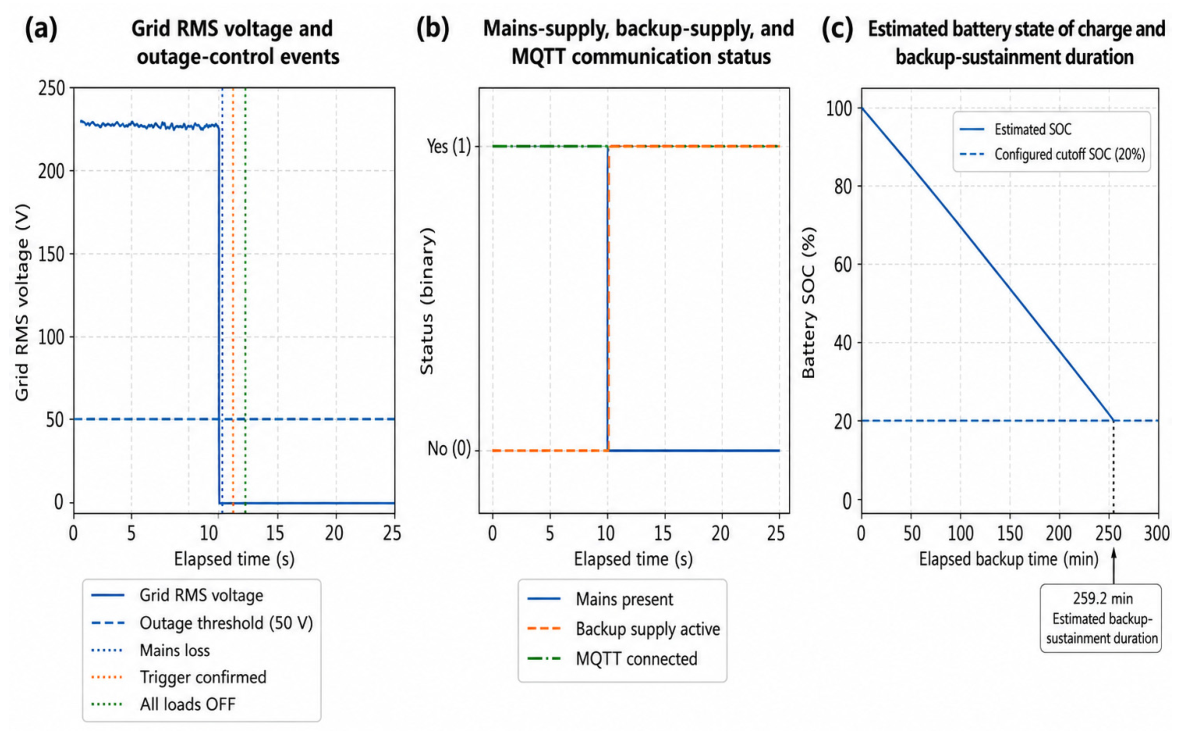
The main-power-outage scenario was evaluated by interrupting the grid supply while maintaining the monitoring, processing, and communication subsystems through the backup battery. The objective of the backup subsystem was not to supply the household loads, but to preserve the sensing, local processing, and outage-reporting functions. An outage condition was confirmed when the grid RMS voltage remained below the predefined threshold of 50 V for 0.20 s. Following trigger confirmation, the secondary processor issued the CMD_OUTAGE_ALL_LOADS_OFF command, and the primary controller disconnected all essential and non-essential household loads.
As described in Table 6, across the repeated scenario runs, the mean total active power decreased from 2030.93 W before the control action to 0 W after load disconnection, corresponding to complete household-load isolation. The acknowledged end-to-end response time, measured from outage-trigger confirmation to acknowledgement reception, was 239.5 ± 28.8 ms. The MQTT publishing success rate was 99.50 ± 0.43%, with a mean publishing latency of 114.42 ms. These results indicate that the monitoring and communication functions remained available with high communication availability during the evaluated outage.
In the representative event sequence, the grid loss was introduced at 10.000 s and the backup supply became active at 10.067 s. The outage trigger was confirmed at 10.200 s, followed by the control decision and command transmission at 10.237 s. The command was received at 10.267 s, all load states changed to OFF at 10.328 s, and the acknowledgement was received at 10.416 s. The system reached a stable post-action condition at 10.520 s, with all household loads disconnected and the monitoring and communication subsystems remaining active.
Based on the configured battery capacity, backup-system demand, conversion efficiency, and cutoff state of charge, the estimated battery-supported monitoring duration was 259.2 min. This value represents an analytical estimate of backup endurance and should not be interpreted as a measured battery-discharge duration unless confirmed through a physical endurance test. Figure 13 presents the grid-voltage transition, control-event sequence, communication status, and estimated battery state-of-charge profile.
The acknowledged response time represents the interval between outage-trigger confirmation and acknowledgement reception. The battery sustainment time is estimated rather than physically measured.
During normal grid-connected operation, the battery is maintained as a standby backup source rather than being scheduled for routine household-load supply, peak shaving, or energy-cost arbitrage [26]. The mains supply powers the monitoring, processing, and communication subsystems and simultaneously restores the battery charge when required. Battery discharge is inhibited while the grid supply remains available, thereby preserving the stored energy for emergency operation and reducing unnecessary charge–discharge cycling.
When a confirmed mains outage occurs, the automatic transfer circuit disconnects the household loads and transfers only the monitoring, processing, and communication subsystems to the backup battery [27]. Battery-supported operation continues until the mains supply is restored or the battery reaches its configured minimum state-of-charge limit. This rule-based operating policy prioritizes outage-reporting continuity and battery-life preservation rather than economic battery dispatch. Therefore, the term “optimization” in the present system refers to reserving the available battery capacity for essential telemetry and communication functions during outages [28].

3.3.3. Scenario 3: Low Credit

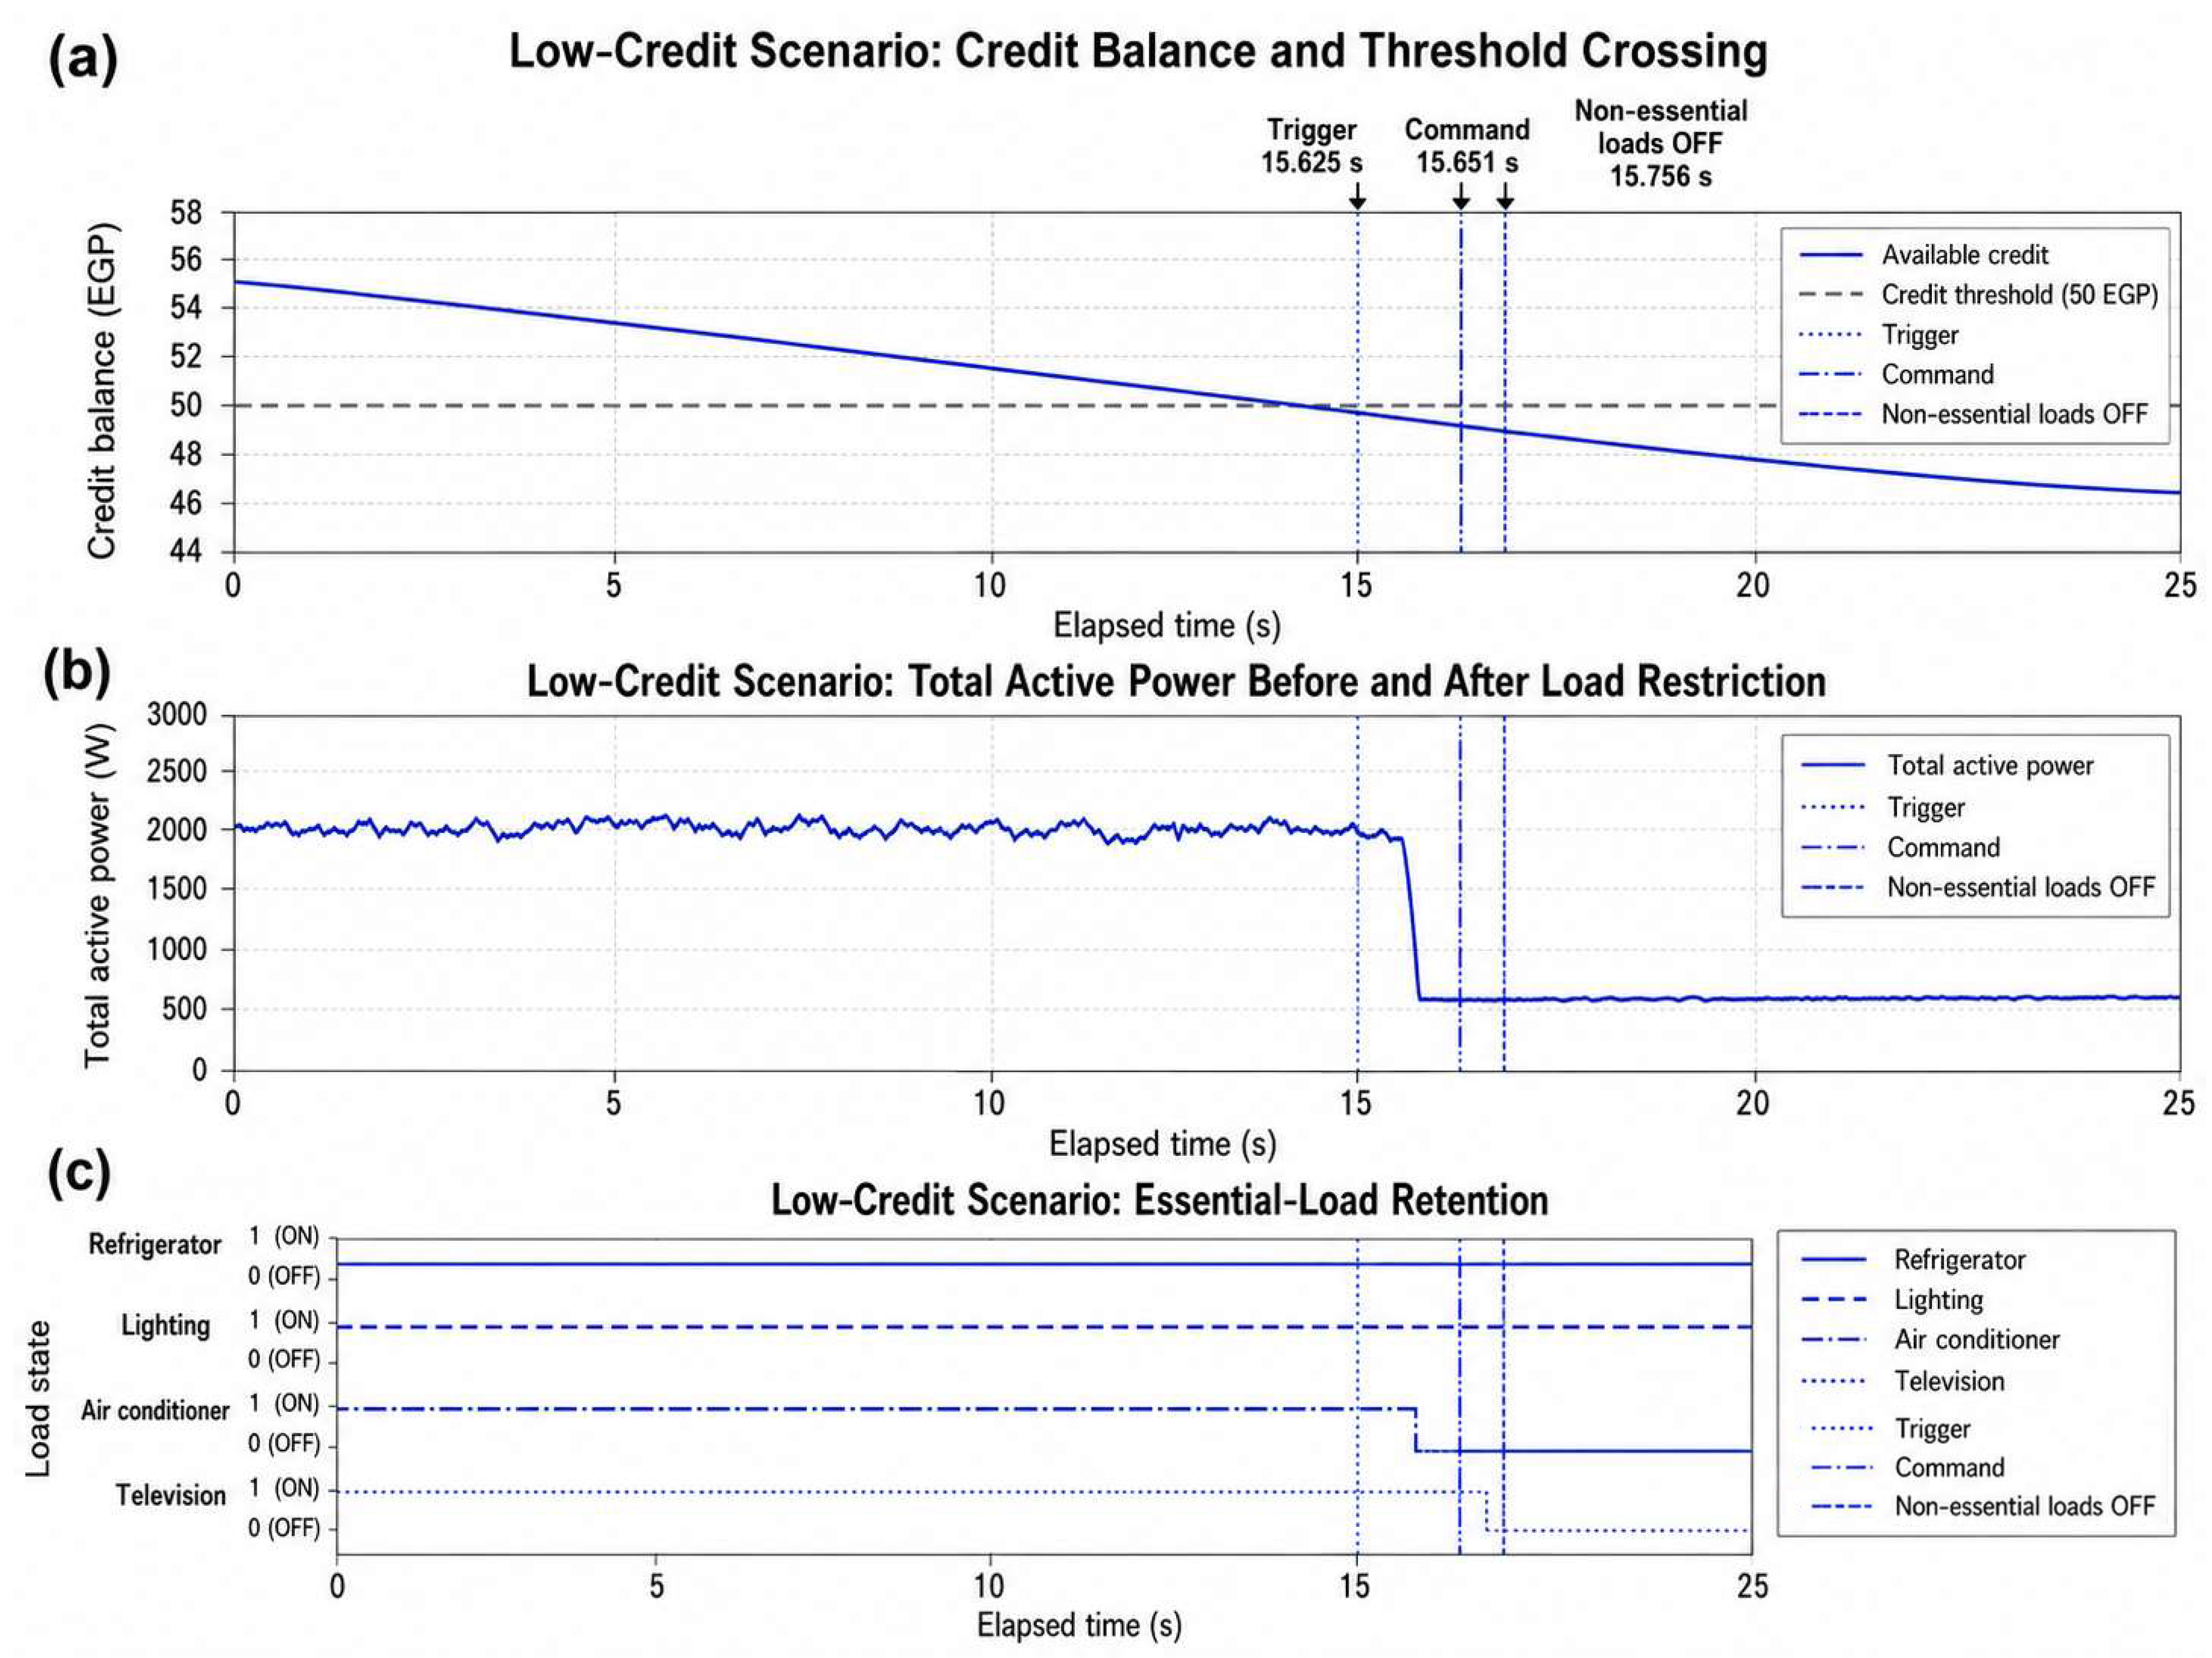
The low-credit scenario was evaluated under a billing-related operating condition in which the available user balance gradually decreased from USD 1.1 to the predefined restriction threshold of USD 1. Unlike the overload and main-outage scenarios, this condition was not initiated by an electrical disturbance. Throughout the test, the grid supply remained available, while the voltage and frequency stayed within their normal operating ranges. Therefore, the resulting control action was attributed exclusively to the available-credit condition. The low-credit restriction was executed locally by the secondary processor only after the balance reached or fell below USD 1. Remote access was limited to authorized monitoring, configuration, and supervisory functions and was not permitted to bypass the predefined essential-load protection policy. According to this policy, the refrigerator and lighting were permanently classified as protected essential loads, whereas the air conditioner and television were classified as interruptible non-essential loads. Consequently, the low-credit mode could disconnect only the non-essential loads and could not automatically interrupt the protected services.
Once the user balance reached USD 1, the local control logic activated the low-credit restriction mode. According to the predefined load-priority policy, the air conditioner and television were classified as non-essential loads and disconnected, whereas the refrigerator and lighting remained energized. As summarized in Table 7, the mean total active power decreased from 2040.33 W before the control action to 581.43 W after load restriction, corresponding to a mean demand reduction of 71.49%. The final operating state therefore retained the essential residential services while substantially reducing the overall power demand.
Each load-restriction command was transmitted using a validated control message and required an acknowledgement from the primary controller confirming the updated load states. If an acknowledgement was not received within the predefined timeout period, the command was retransmitted for a limited number of attempts. In the event of persistent command failure or abnormal MQTT/4G communication, the controller retained the last confirmed safe load state and suspended additional switching actions. This fail-safe policy prevents uncontrolled disconnection, repeated ON/OFF operation, or unintended changes caused by delayed or corrupted remote commands. A local manual override was also retained for maintenance and user-protection purposes.
The complete temporal response of the scenario is illustrated in Figure 14. Figure 14a shows the decrease in the available credit and its crossing of the USD 1 threshold. Figure 14b presents the corresponding reduction in total active power before and after the disconnection of the non-essential loads. Figure 14c confirms the load-state transition, showing that the refrigerator and lighting remained ON throughout the test while the air conditioner and television changed from ON to OFF after the restriction command was executed.
The acknowledged end-to-end response time was 236.8 ± 21.3 ms. The MQTT publishing success rate was 99.64 ± 0.36%, with a mean publishing latency of 115.38 ms. In the representative event sequence, the credit threshold was crossed at 15.625 s, followed by the control decision and command transmission at 15.651 s. The command was received at 15.686 s, and the load-state transition occurred at 15.756 s. The acknowledgement was received at 15.863 s, while the system reached a stable post-action condition at 16.028 s.
Restoration of the non-essential loads was permitted only after the available balance exceeded the configured recovery level and the controller confirmed normal electrical and communication conditions. The use of a recovery margin above the USD 1 restriction threshold prevents repeated switching when the balance fluctuates close to the trigger value. All restriction commands, acknowledgements, communication failures, retries, manual overrides, and restoration events were recorded in the local or cloud event log to support traceability and post-event verification.

4. Discussion

This paper presents the design, implementation, and experimental evaluation of a prototype-level IoT-based energy-management platform for residential smart load monitoring and control. The contribution of the work is not attributed to the standalone use of dual processors, 4G communication, cloud dashboards, load shedding, or backup power, since these elements have been previously reported in smart-metering and home energy-management systems. Instead, the value of the proposed work lies in the coordinated integration of these functions within one experimentally implemented residential prototype. The system combines main-source and per-load electrical measurements, local load switching, MQTT-based 4G communication, cloud visualization, and battery-supported outage reporting.
The dual-processor structure was useful from an implementation perspective because it separated time-critical sensing and relay switching from data handling, visualization, and communication tasks. This separation supported stable measurement acquisition at the primary-controller level while allowing the secondary processor to manage rule-based local control decisions and cloud data publishing. The per-load sensing arrangement also allowed the system to distinguish between essential and non-essential appliances, which is necessary for selective load control rather than whole-house disconnection.
The experimental scenarios demonstrate the practical behavior of the prototype under different operating conditions. In the overload scenario, the predefined priority-based control rule disconnected non-essential loads and reduced the total power demand while maintaining essential services. In the outage scenario, the backup subsystem maintained the monitoring and communication functions, allowing outage status to be reported even when the main supply was unavailable. In the low-credit scenario, the system applied a credit-aware load-restriction mode, where non-essential loads were disconnected after the user balance fell below a predefined threshold, while essential loads remained energized. This scenario should be interpreted as an application-oriented control mode for prepaid or credit-constrained operation, rather than as a standalone technological novelty.
These results indicate that the implemented platform can support coordinated monitoring, local rule-based control, and cloud reporting under representative residential operating scenarios. However, the current validation remains limited to a laboratory-scale prototype and a predefined set of loads and control thresholds. Therefore, the reported performance should not be generalized to large-scale deployment without further field testing. Future work should evaluate communication latency, command acknowledgement reliability, cybersecurity protection, user override mechanisms, adaptive tariff settings, and larger multi-node deployment under real residential operating condition.

5. Conclusions

This paper presented the design and experimental evaluation of a prototype-level IoT-based energy-management platform for smart load control in residential microgrid applications. The implemented system combines calibrated electrical measurement, per-load monitoring, local relay-based load switching, MQTT-based 4G communication, cloud dashboard visualization, and battery-supported outage reporting within a unified hardware–software prototype.
The system was implemented using a dual-processor architecture. The primary microcontroller performed time-critical sensing, measurement processing, and low-level load switching, while the secondary processor handled data reception, rule-based control decisions, local visualization, and MQTT data publishing. The measurement framework provided voltage, current, active power, apparent power, power factor, and energy-consumption values for the main source and individual load channels.
Experimental evaluation was conducted under three representative operating scenarios. In the overload scenario, the priority-based load-shedding rule disconnected non-essential loads and reduced the total power demand by approximately 75% while maintaining essential loads such as lighting and refrigeration. In the outage scenario, the backup battery preserved the monitoring and communication subsystems, enabling outage reporting during main-grid failure. In the low-credit scenario, the system applied credit-aware load restriction, where non-essential loads were disconnected when the user balance dropped below a predefined threshold while essential services remained active.
Overall, the results show that the proposed prototype can integrate per-load monitoring, local rule-based load control, cloud reporting, and backup-supported supervision in a single residential energy-management platform. The main contribution is therefore associated with system-level integration and scenario-based validation, rather than with the individual hardware or communication components. Future work will focus on larger-scale field deployment, communication-latency analysis, cybersecurity protection, remote-command failure handling, user override policies, renewable-energy integration, and adaptive tariff-based control.

Author Contributions

Conceptualization, A.E. and A.A.E.; methodology, A.E.; software, M.S.; validation, A.E., A.A.E. and M.S.; formal analysis, M.S.; investigation, M.S.; resources, A.E.; writing—original draft preparation, M.S.; writing—review and editing, A.E.; visualization, A.A.E.; supervision, A.E. All authors have read and agreed to the published version of the manuscript.

Funding

This research received no external funding.

Institutional Review Board Statement

Not applicable.

Informed Consent Statement

Not applicable.

Data Availability Statement

The raw data supporting the conclusions of this article will be made available by the authors on request.

Acknowledgments

During the preparation of this manuscript, the authors used ChatGPT (GPT 5.6 Sol) for English-language polishing, improvement of the visual clarity of author-designed figures, and auxiliary programming support. The authors reviewed and edited all AI-assisted outputs and take full responsibility for the content of the published article.

Conflicts of Interest

The authors declare no conflicts of interest.

Abbreviations

The following abbreviations are used in this manuscript:
SSCBssolid-state circuit breakers
CTcurrent transformer
PFpower factor

References

  1. Dora, B.K.; Bhat, S.; Mitra, A.; Ernst, D.; Halinka, A.; Zychma, D.; Sowa, P. The Global Electricity Grid: A Comprehensive Review. Energies 2025, 18, 1152. [Google Scholar] [CrossRef] [Scilit]
  2. Abbasi, A. Statistical techniques in power systems fault diagnostic: Classifications, challenges, and strategic recommendations. Electr. Power Syst. Res. 2025, 239, 111279. [Google Scholar] [CrossRef] [Scilit]
  3. Chen, L. Intelligent Control and Monitoring Frameworks for Real Time Optimization of Energy Consumption in Industrial Automation Systems. Trans. Intell. Control Syst. Autom. Fram. Adapt. Syst. 2025, 15, 1–15. [Google Scholar]
  4. Kumar, A.; Alghamdi, S.; Mehbodniya, A.; Webber, J.; Shavkatovich, S. Smart power consumption management and alert system using IoT on big data. Sustain. Energy Technol. Assess. 2022, 53, 102555. [Google Scholar] [CrossRef] [Scilit]
  5. Choudhary, V.; Sarotiya, S.; Mantri, Y.; Jain, S.; Handa, S.; Singh, R. Iot Based Power Consumption Monitoring. PRATIBODH 2024. [Google Scholar] [CrossRef] [Scilit]
  6. Hartono, H.; Sudjoko, R.; Faizah, F.; Kustori, K.; Hariyadi, S. Design of Electricity Theft Monitoring System Using Differential Power Method Based on Internet of Thing. Proceeding Int. Conf. Adv. Transp. Eng. Appl. Soc. Sci. 2023, 2, 415–421. [Google Scholar]
  7. Chrakie, A.; El Hassan, M.; Daba, J. A Power Management System. WSEAS Trans. Electron. 2025, 16, 60–72. [Google Scholar] [CrossRef] [Scilit]
  8. Nivedhan, V.; Arunkumar, C.; Sriramanujan, S.; Shankar, A.; Thakur, S.K. IoT-based smart energy meter for power theft monitoring and cost detection using ESP8266. In Sustainable Electrical Engineering and Intelligent Systems; CRC Press: London, UK, 2025; pp. 248–252. Available online: https://www.taylorfrancis.com/chapters/edit/10.1201/9781003643142-41/iot-based-smart-energy-meter-power-theft-monitoring-cost-detection-using-esp8266-nivedhan-arunkumar-sriramanujan-anuj-shankar-suman-kumar-thakur (accessed on 26 July 2026).
  9. Sirisha, B. Minimizing electricity theft using IOT. SAMRIDDHI A J. Phys. Sci. Eng. Technol. 2020, 12, 49–52. [Google Scholar]
  10. Onwuemeodo, C.; Duru, C.; Anyasodor, C.; Obiefule, N. Design and construction of Internet of Things (IoT) password based circuit breaker. J. Electr. Eng. Electron. Control Comput. Sci. 2022, 8, 43–48. [Google Scholar]
  11. Sudjoko, R.; Hariyadi, S.; Faizah, F. Design and Control Motorized Circuit Breaker in Electrical Distribution Panel. J. Phys. Conf. Ser. 2021, 2117, 012021. [Google Scholar] [CrossRef] [Scilit]
  12. Aryza, S.; Lubis, Z.; Putra, K. An IoT Design Effectiveness and Reliability of Electric Power Circuit Breakers. J. Comput. Sci. Inf. Technol. Telecommun. Eng. 2024, 5, 654–660. [Google Scholar] [CrossRef] [Scilit]
  13. Rochman, S.; Musthofa, A.; Firmansyah, M.R. Design and Construction of Power Monitoring and Circuit Breaker Devices for PLN Customers based on IoT. Best J. Appl. Electr. Sci. Technol. 2024, 6, 69–74. [Google Scholar] [CrossRef] [Scilit]
  14. Mehta, R.; Saiyad, J.; Smart, N.; Mali, G.; Kamat, V. Development of smart earth leakage circuit breaker using IoT and power electronics. J. Phys. Conf. Ser. 2021, 2809, 012028. [Google Scholar]
  15. Niu, W.; Shi, H.; Hou, X. Intelligent circuit breaker. J. Phys. Conf. Ser. 2023, 2528, 012065. [Google Scholar] [CrossRef] [Scilit]
  16. Rahimpour, S.; Husev, O.; Vinnikov, D. Design and analysis of a DC solid-state circuit breaker for residential energy router application. Energies 2022, 15, 9434. [Google Scholar] [CrossRef] [Scilit]
  17. Wei, B.; Xiao, H.; Liu, H.; Li, D.; Deng, F.; Pan, B.; Li, Z. Solid-State Circuit Breaker Topology Design Methodology for Smart DC Distribution Grids with Millisecond-Level Self-Healing Capability. Energies 2025, 18, 3613. [Google Scholar] [CrossRef] [Scilit]
  18. Zulu, C.; Dzobo, O. Real-time power theft monitoring and detection system with double connected data capture system. Electr. Eng. 2023, 105, 3065–3083. [Google Scholar] [CrossRef] [Scilit]
  19. Munoz, O.; Ruelas, A.; Rosales, P.; Acuña, A.; Suastegui, A.; Lara, F. Design and development of an IoT smart meter with load control for home energy management systems. Sensors 2022, 22, 7536. [Google Scholar] [CrossRef] [Scilit] [PubMed]
  20. Quan, L.; Hasan, M.; Khalid, N. Design of Remote Warning System for Miniature Circuit Breaker (MCB) Power Shortage via Internet of Things (IOT). J. Phys. Conf. Ser. 2021, 2107, 012015. [Google Scholar] [CrossRef] [Scilit]
  21. Yin, J.; Lang, X.; Xu, H.; Duan, J. High-performance breaking and intelligent of miniature circuit breakers. Sensors 2022, 22, 5990. [Google Scholar] [CrossRef] [Scilit] [PubMed]
  22. Jain, A.; Bhullar, S. Network performance evaluation of smart distribution systems using smart meters with TCP/IP communication protocol. Energy Rep. 2022, 8, 19–34. [Google Scholar] [CrossRef] [Scilit]
  23. Rao, J. Design of an Energy Efficient IOT Enabled Smart System based on Dali Network Over MQTT Protocol. Int. J. Recent Trends Comput. Commun. 2023, 11, 1535–1539. [Google Scholar]
  24. Rahman, M.; Choudhary, J. IoT-based compensation and control of power theft in weak distribution system. Eng. Res. Express 2023, 5, 045051. [Google Scholar] [CrossRef] [Scilit]
  25. Khasawneh, H.; Al Asbahi, R.; Alzariqi, A.W.; Al Qada, D.R.; Bujuk, A.; Nawfal, M.A.; Tareen, M. Industrial IoT-based submetering solution for real-time energy monitoring. Discov. Internet Things 2025, 5, 15. [Google Scholar] [CrossRef] [Scilit]
  26. Chen, Y.; Lu, J.; Tang, Z.; Zhu, J.; Wang, S.; Dong, H.; Wang, K. Recent Progress in the Physics-Constrained State of Health Estimation for Lithium-Ion Batteries. Energies 2026, 19, 1920. [Google Scholar] [CrossRef] [Scilit]
  27. Lei, M.; Zhang, M.; Wang, K. Research on bidding optimization strategy for virtual power plants with wind–solar–storage systems based on IGDT–DRO. Electr. Eng. 2026, 108, 208. [Google Scholar] [CrossRef] [Scilit]
  28. Lv, X.; Cui, S.; Wang, Y.; Lu, J.; Yu, P.; Wang, K. Patch Time Series Transformer-Based Short-Term Photovoltaic Power Prediction Enhanced by Artificial Fish. Energies 2026, 19, 284. [Google Scholar] [CrossRef] [Scilit]
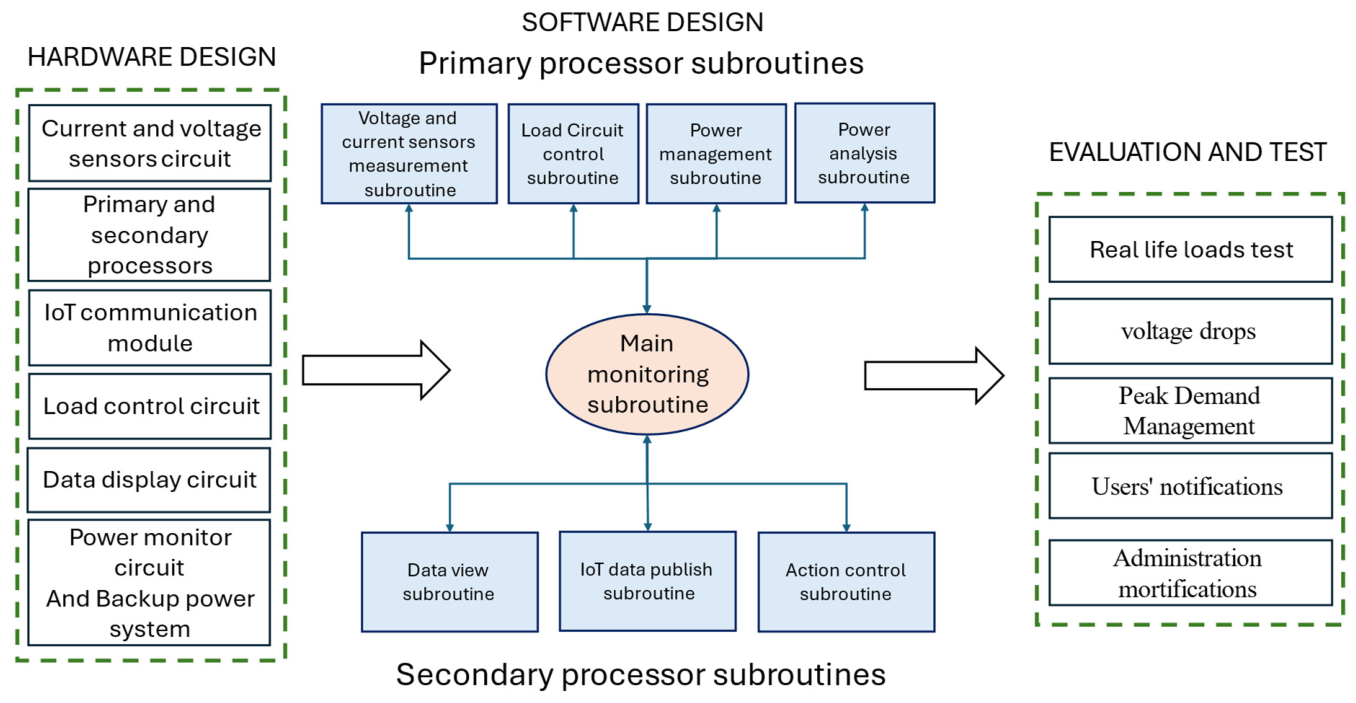
Figure 1. Methodology flowchart for the IoT-based smart energy-monitoring and -management system.
Eng 07 00418 g001
Figure 2. System-level hardware architecture of the IoT energy meter and smart load controller.
Eng 07 00418 g002
Figure 3. Power measurement and management subroutines.
Eng 07 00418 g003
Figure 4. Demand–response and load-shedding control subroutine.
Eng 07 00418 g004
Figure 5. Action control subroutine.
Eng 07 00418 g005
Figure 6. IoT–MQTT communication subroutine.
Eng 07 00418 g006
Figure 7. Prototype implementation of the proposed IoT-based smart energy-monitoring system.
Eng 07 00418 g007
Figure 8. Experimental setup for voltage and current sensor calibration using a function generator and reference measurement instruments.
Eng 07 00418 g008
Figure 9. Voltage and current sensor calibration curves.
Eng 07 00418 g009
Figure 10. Geographic distribution of the deployed IoT-based energy-monitoring devices in Iraq.
Eng 07 00418 g010
Figure 11. Real-time IoT dashboard visualization for monitoring station PM-001 during normal operation mode.
Eng 07 00418 g011
Figure 12. Quantitative response of the overload-control scenario: (a) total active power before and after automatic load shedding, including the overload threshold and control-event markers; and (b) load-state transitions showing the retention of essential loads and disconnection of non-essential loads.
Eng 07 00418 g012
Figure 13. Quantitative response of the main-power-outage scenario: (a) grid RMS voltage and outage-control event markers; (b) mains supply, backup supply, and MQTT communication status; and (c) estimated battery state of charge and backup-sustainment duration.
Eng 07 00418 g013
Figure 14. Quantitative response of the low-credit scenario: (a) available credit balance relative to the predefined credit threshold (50 EGP), showing the threshold-crossing event at 15.625 s; (b) total active power before and after load restriction, highlighting the reduction in total demand after the control action; and (c) load-state transitions, showing that the refrigerator and lighting remained energized, whereas the air conditioner and television were disconnected after the low-credit condition was detected. Vertical event markers indicate the trigger event (15.625 s), control-command transmission (15.651 s), and disconnection of the non-essential loads (15.756 s).
Eng 07 00418 g014
Table 1. Revised comparative analysis of related IoT-based smart-metering and energy-management systems.
Ref.Main ApplicationCommunication MethodControlled ObjectNo. of Controlled LoadsResponse/Control MethodValidation/Application ConditionMain Limitation Relative to This Study
[4]Smart power-consumption management and alertingIoT/cloud with big-data supportConsumer energy-consumption dataNS 1Monitoring, alert generation, and consumption-management supportData-oriented IoT energy-management studyFocuses mainly on consumption monitoring and alerting; no coordinated per-load switching, outage reporting, or credit-based restriction
[5]IoT-based power-consumption monitoringIoT-based monitoring linkSmart/prepaid energy meterNS 2Real-time monitoring and user informationPrototype/project-level monitoringMonitoring-oriented; limited discussion of load-priority control, backup operation, and scenario-based validation
[6]Electricity-theft monitoring using differential power methodIoT-based data reportingMeter/distribution measurement pointsN/ATheft detection and utility alertingPrototype/test-case validationFocuses on non-technical loss detection rather than residential load management
[7]Power management with theft and limit detectionIoT integrationSmart-meter/distribution-management unitNSPower theft detection, current-limit control, and warningSystem-level power-management designIncludes monitoring and limit detection, but does not demonstrate coordinated per-load shedding with backup-supported outage reporting
[8]Smart energy meter for theft and cost detectionESP8266/IoTSmart energy meterN/ATheft monitoring and cost detectionPrototype/chapter-level implementationFocuses on theft and billing-related monitoring rather than multi-load control scenarios
[9]Electricity-theft minimizationIoT-based communicationMeter/consumer connectionN/ATheft alarm and monitoringPrototype/conceptual implementationTheft-focused; no load-priority logic or outage-resilient communication
[10]Password-based IoT circuit breakerGSM/IoT moduleSingle circuit breaker1Password-based remote switching and SMS/IoT interactionHardware prototypeProtection/switching-focused; does not monitor and control multiple household loads
[11]Motorized circuit breaker in distribution panelLocal/remote control interfaceMotorized circuit breaker/panel1 or panel-levelMotorized breaker switchingLaboratory prototypeFocuses on breaker actuation, not IoT-based per-load energy-management workflow
[12]IoT reliability of electric power circuit breakersIoT-based breaker monitoring/controlElectric power circuit breaker1 or breaker-levelFault response and reliability evaluationLaboratory experiments and case-study-oriented evaluationCircuit-breaker reliability focus; limited household load-management and credit/outage scenarios
[13]Power monitoring and circuit breaker for utility customersIoT-based monitoring/controlCustomer-side power-monitoring and breaker device1 or customer-levelMonitoring and breaker controlHardware prototypeCombines monitoring and breaker action, but remains breaker/customer-level rather than calibrated per-load residential control
[14]Smart earth leakage circuit breakerIoT/web-server interfaceEarth leakage circuit breaker1Earth-leakage protection and remote interactionHardware prototypeProtection-focused; not designed for energy-priority load shedding or credit-aware operation
[15]Intelligent circuit breakerEmbedded/intelligent breaker controlCircuit breaker1Intelligent protection and switchingCircuit-breaker prototype/designFocuses on breaker intelligence, not residential energy-management integration
[16]DC solid-state circuit breaker for residential energy routerLocal power-electronics controlDC feeder/energy-router breakerFeeder-levelFast DC fault isolationDesign, analysis, and simulation/experimental validationProtection-oriented; not an IoT smart-metering or residential load-control platform
[17]SSCB topology for smart DC-distribution gridsLocal protection/control architectureDC distribution grid section/tie switchesFeeder/grid-section levelMillisecond-level fault isolation and self-healing supportDC distribution-grid protection studyTargets DC grid protection, not household per-load monitoring, 4G cloud reporting, or low-credit restriction
[18]Real-time power-theft monitoring with double data captureGSM/cloud storageSmart meters at distribution and consumer pointsN/ATheft detection using double-connected measurementSimulation and hardware-module testingStrong theft-detection focus; limited demand–response and essential-load retention logic
[19]IoT smart meter with load control for HEMSBuilt-in Wi-Fi/internet connectionSmart meter/outlet-connected loadMainly outlet/device-levelMonitoring and load control for home energy managementHardware prototype with calibration and validationClosest related work; however, it mainly uses Wi-Fi and does not jointly address 4G/MQTT reporting, backup-supported outage notification, and low-credit load restriction
[20]Remote warning system for MCB power shortageESP8266/Wi-Fi/BlynkMiniature circuit breaker1Remote warning and status notificationMCB prototype with mobile-app interfaceWarning-focused; no per-load control hierarchy or multi-scenario residential energy-management validation
[21]High-performance/intelligent miniature circuit breakerIntelligent breaker mechanismMiniature circuit breaker1Breaking-performance enhancement and intelligent protectionSensor/breaker experimental designDevice-protection focus, not IoT energy-management integration
[22]Network performance of smart-distribution systemsTCP/IP communication protocolSmart-meter communication networkN/ACommunication-network performance evaluationSimulation/network evaluationFocuses on communication performance, not embedded load-control implementation
[23]Energy-efficient IoT system based on DALI over MQTTDALI network over MQTTLighting networkMultiple lighting nodesLighting control/energy-efficient operationIoT lighting-network implementationLighting-specific; does not address whole residential load classes, outage backup, or credit-aware restriction
[24]IoT-based theft compensation/control in weak distribution systemIoT-based distribution communicationDistribution system/theft-compensation pointsN/ATheft detection, compensation, and controlDistribution-system studyDistribution-theft focus; not a residential per-load management prototype
[25]Industrial IoT submetering for real-time energy monitoringIndustrial IoT/submetering communicationIndustrial submeters/circuitsMultiple metered circuitsReal-time energy monitoring and submeteringIndustrial monitoring implementationMonitoring-focused; no residential priority-based load shedding, backup outage reporting, or low-credit operation
Proposed systemResidential smart load monitoring and control4G/MQTT/cloud dashboardMain source and individual household loads4 controlled loads in prototypeCalibrated per-load monitoring, priority-based load shedding, outage reporting, and low-credit-based load restrictionHardware prototype tested under overload, outage, and low-credit scenariosLaboratory-scale validation; requires future large-scale field testing
1 NS = not specified; 2 N/A = not applicable.
Table 2. Voltage sensor calibration results for the four sensing channels.
Reference Voltage (V)SensorR1R2R3R4R5R6R7R8R9R10Mean (V)Error (%)
20S119.619.719.619.819.719.619.719.619.819.719.68−1.60
S219.819.919.819.719.819.919.819.819.719.919.81−0.95
S319.719.619.719.619.819.719.719.619.719.719.68−1.60
S419.919.819.919.919.819.919.919.819.919.919.88−0.60
30S129.329.429.429.529.429.329.429.429.529.429.41−1.97
S229.529.629.529.629.529.629.529.529.629.529.55−1.50
S329.429.529.429.529.429.529.429.429.529.429.48−1.73
S429.629.729.629.729.629.729.629.629.729.629.62−1.26
40S139.039.139.139.239.139.039.139.139.239.139.11−2.22
S239.339.439.339.439.339.439.339.339.439.339.32−1.70
S339.239.239.339.239.239.339.239.239.339.239.21−1.97
S439.439.539.439.539.439.539.439.439.539.439.40−1.50
50S148.848.949.048.948.948.848.949.048.948.948.90−2.20
S249.149.249.149.249.149.249.149.149.249.149.12−1.76
S349.049.149.049.149.049.149.049.049.149.049.01−1.98
S449.249.349.249.349.249.349.249.249.349.249.18−1.64
Table 3. Current sensor calibration results for the four sensing channels.
Reference Current (A)SensorR1R2R3R4R5R6R7R8R9R10Mean (A)Error (%)
0.5S10.490.490.500.480.490.490.500.490.480.490.49−2.0
S20.500.500.490.500.490.500.500.490.500.500.497−0.6
S30.480.490.480.480.490.480.490.480.490.480.484−3.2
S40.490.500.490.490.500.490.490.500.490.490.493−1.4
1.0S10.980.980.990.970.980.980.990.980.970.980.98−2.0
S20.990.991.000.990.991.000.990.991.000.990.994−0.6
S30.970.970.980.960.970.970.980.970.960.970.97−3.0
S40.980.990.980.980.990.980.980.990.980.980.983−1.7
2.0S11.961.971.961.951.961.961.971.961.951.961.96−2.0
S21.981.991.981.991.981.991.981.981.991.981.986−0.7
S31.951.951.961.941.951.951.961.951.941.951.95−2.5
S41.971.981.971.971.981.971.971.981.971.971.973−1.3
Table 4. System evaluation scenarios for the proposed IoT-based smart energy-management system.
Scenario IDScenario NameTrigger ConditionExpected System ActionExpected Reported Status
S1Overload conditionTotal load exceeds preset power limitDisconnect non-essential loads and retain essential loadsLoad shedding active, extra loads OFF, alarm generated
S2Main power outageGrid voltage lost/mains failure detectedDisconnect all loads, switch controller and communication unit to battery supplyGrid OFF, battery mode active, all loads OFF, outage alarm sent
S3Low-credit conditionRemaining credit drops below thresholdDisconnect non-essential loads and preserve essential loadsLow-credit mode active, extra loads OFF, warning/alarm sent
Table 5. Quantitative validation results for the overload and automatic load-shedding scenario.
ParameterResult
Overload threshold1800 W
Trigger persistence time0.50 s
Mean pre-action total active power2242.63 W
Mean post-action total active power586.50 W
Mean power reduction73.84%
Retained loadsRefrigerator and lighting
Disconnected loadsAir conditioner and television
Acknowledged end-to-end response time240.5 ± 23.4 ms
MQTT publishing success rate99.42 ± 0.47%
Mean MQTT publishing latency115.19 ms
Final operating stateRefrigerator ON; lighting ON; AC OFF; TV OFF
Table 6. Quantitative validation results for the main-power-outage scenario.
ParameterResult
Outage detection thresholdGrid RMS voltage < 50 V
Trigger persistence time0.20 s
Mean pre-action total active power2030.93 W
Mean post-action total active power0 W
Power reduction100%
Load-control actionAll household loads disconnected
Retained subsystemsMonitoring, processing, and communication
Acknowledged end-to-end response time239.5 ± 28.8 ms
MQTT publishing success rate99.50 ± 0.43%
Mean MQTT publishing latency114.42 ms
Estimated battery sustainment time259.2 min
Final operating stateAll loads OFF; monitoring and communication active
Table 7. Quantitative validation results for the low-credit load-restriction scenario.
ParameterResult
Low-credit threshold1 USD
Trigger conditionCredit balance ≤ 1 USD
Mean pre-action total active power2040.33 W
Mean post-action total active power581.43 W
Mean power-demand reduction71.49%
Retained essential loadsRefrigerator and lighting
Disconnected non-essential loadsAir conditioner and television
Acknowledged end-to-end response time236.8 ± 21.3 ms
Mean MQTT publishing success rate99.64 ± 0.36%
Mean MQTT publishing latency115.38 ms
Credit-threshold crossing time *15.625 s
Control-command transmission time *15.651 s
Command-reception time *15.686 s
Load-state transition time *15.756 s
Acknowledgement-reception time *15.863 s
Post-action stable-state time *16.028 s
Backup-battery statusNot activated
Final operating stateRefrigerator ON; lighting ON; air conditioner OFF; television OFF
* Representative event-sequence timestamps measured during the illustrated low-credit scenario.
Disclaimer/Publisher’s Note: The statements, opinions and data contained in all publications are solely those of the individual author(s) and contributor(s) and not of MDPI and/or the editor(s). MDPI and/or the editor(s) disclaim responsibility for any injury to people or property resulting from any ideas, methods, instructions or products referred to in the content.