Article

AI-Enhanced Macro-Mechanic Property Prediction Using Rock Slice Using Zero-Sample Segmentation and Numerical Analysis

1
Engineering Technology Branch, CNOOC Energy Development Co., Ltd., Tianjin 300452, China
2
Key Laboratory of Unconventional Exploration and Development, CNOOC Energy Development Co., Ltd., Tianjin 300452, China
3
Research Institute of Geotechnical Engineering, Hohai University, Nanjing 210098, China
*
Author to whom correspondence should be addressed.
Eng 2026, 7(8), 392; https://doi.org/10.3390/eng7080392
Submission received: 11 May 2026 / Revised: 20 June 2026 / Accepted: 28 June 2026 / Published: 6 August 2026

Abstract

This paper proposes an intelligent analysis method of rock sheet based on the segment anything model (SAM) with zero samples, which combines small sample training with deep learning to realize high-precision automatic identification and segmentation of rock minerals, and then converts the segmentation results into vectorized data by using image processing technology to construct the numerical model of rock minerals, and ultimately realizes rock sheet from image identification to physical and mechanical research. The results show that the SAM-based zero-sample segmentation method can accurately and efficiently identify different mineral components in multi-component complex rock flakes. Numerical simulation results show that the numerical model of rock minerals generated by the method can effectively reflect the microstructural characteristics of rocks and accurately predict their mechanical behaviors, and the resulting elastic modulus matches well with the existing literature data, with a relative error of only 3.4%, suggesting that the proposed method provides reasonable predictive capability for rock mechanical behavior. Compared with the traditional measurement methods, this method realizes the automation and intelligence of rock thin-section analysis and enhances the adaptability to different rock samples, providing an efficient tool means for geological exploration, petroleum engineering, and geotechnical research.

1. Introduction

Rock thin-section identification and analysis is an important basic research work for identifying lithology and exploring oil reservoirs and engineering implementation [1]. With the development of testing technology, especially the development of software and hardware based on scanning electron microscope, there are more and more rock thin sections with large field of view and high resolution [2,3,4]. It is of great theoretical significance and engineering value to accurately recognize the mineral composition of rock slices and evaluate the physical and mechanical properties of rocks quickly and accurately on the basis of these slices.
As the mineral composition of rocks is complicated and the morphology is different, accurate and efficient image segmentation is the prerequisite for the identification of rock slices [5]. Image segmentation is also an important research content of computer graphics and machine vision. Image segmentation can be divided into two stages. The traditional image segmentation mainly includes the threshold method, difference operator, and watershed algorithm [6]. However, these methods are generally applicable to images with more obvious gray-scale changes, and it is difficult to deal with images with complex shapes, different brightnesses, and contrast differences [7]. In addition, the segmentation accuracy and computational efficiency are not high enough to meet the segmentation and recognition of rock sheet images with large field of view and high resolution [8].
Deep learning techniques, relying on the advanced architecture of artificial neural networks, have triggered technological innovations in the field of rock image segmentation [9]. With continuous research, image segmentation techniques have derived various neural network models, such as full convolutional network (FCN) [10], U-Net [11], SegNet [12], pyramid scene parsing network (PsPNet) [13], and DeepLab [14], etc., which started with a perceptual field of view proposed to simulate the visual nerves of the cat’s brain. Since the deep convolutional network model was first proposed in 2012, more and more segmentation models have been developed, and the segmentation accuracy of the models is getting higher and higher, the difficulty of using them is gradually decreasing, and the ability of adaptive segmentation for different targets is becoming progressively stronger [15].
Existing image segmentation models tend to focus on specific segmentation tasks, with insufficient adaptability to multimodal images. They need to be retrained in the face of different downstream tasks, with low generalization ability, and they require a large amount of labeled image data [16]. Inspired by the basic model in the NLP field, Kirillov et al. [17] proposed the image segmentation macromodel SAM, which is an innovative breakthrough in the field of computer vision. Unlike traditional segmentation models, the SAM not only possesses efficient segmentation capability, but also has unprecedented adaptivity and generality [18]. In addition, it introduces a spatial attention mechanism, which can better capture the spatial relationships in the image, thus improving the performance of semantic segmentation [19]. Therefore, the SAM has a wide range of applications in areas such as rock image segmentation [20]. Amankwah et al. [21] developed an improved watershed segmentation method for rock fragmentation. The proposed method outperforms the original watershed segmentation method in the prediction of fine-grained rock samples. Sereshki et al. [22] proposed an algorithm for particle image enhancement during rock fragmentation. Accurate rock fragmentation prediction is performed by integrating a filtering algorithm, image binarization, edge detection, and image morphology methods. The accuracy of the obtained results exceeds that of Split Desktop and Gold Size software. Guo et al. [23] proposed a new watershed seed point labeling method, based on which an improved watershed algorithm for rock fragmentation was created. The accuracy of the obtained results reaches the level of manual measurements.
The acquisition of physico-mechanical parameters based on digital images of geotechnical bodies is equally valuable for oil and gas drilling [24]. With the progress of numerical analysis methods, modeling techniques based on accurate segmentation and identification of rocks have gradually become possible [25]. Many scholars at home and abroad have proposed various rock segmentation methods based on digital images. Yue et al. used digital image technology to study the mechanical properties of asphalt concrete materials [26]. Wenjie Xu et al. studied the damage mechanism of a soil–rock mixture by using digital image processing technology [27]. Yan Long et al. investigated the seepage characteristics of non-homogeneous geotechnical materials by digital image processing [28]. Qingxiang Meng et al. used the Douglas smoothing technique to realize digital image vectorization and proposed the open-source digital image tool DigiSim [29].
Traditional image segmentation methods often require tedious steps to achieve satisfactory results on specific data [30,31]. They have obvious limitations in dealing with images with different brightness, shadow, and surface texture features. Convolutional neural networks (CNNs) based on deep learning have shown excellent performance in various fields of computer vision and thus have been widely used by scholars at home and abroad in tasks such as image classification and image segmentation [32,33]. Guo et al. [23] proposed a rock fragmentation network based on multiple CNN structures. A total of 14,628 labeled image blocks extracted from the entire blast rock pile image using data augmentation methods were used for model development. The model performed well on two test images and achieved a high R2 value of 0.9989. In another study, Li et al. [1] used an edge detection model of the DexiNed network and an image morphology technique to measure the grain size of the crushed aggregates, and this method proved to be highly capable of recognizing the edge features of the rock. Zhao et al. [2] used the SAM to segment the rock fragments automatically with the use of a method that employs pixel-level accuracy (PA), intersection over union (IoU), and dice coefficient (Dice) to evaluate the model’s pixel-level segmentation performance, and the results obtained were more accurate than Split Desktop V 4.0. This study demonstrates the effectiveness of the SAM for rock image segmentation.
The image data of rock flakes and their labeling require a lot of hand labeling by professionals, and there is no large training set of publicly available data. Although large-scale deep vision models perform well in natural image segmentation, there are still problems in associating the segmented regions with specific semantic categories of rock flakes to achieve accurate segmentation of mineral components, limiting their application in efficient and accurate identification of rock flakes.
In order to realize the efficient and accurate segmentation of rock flake images and the evaluation of physical and mechanical properties, in this paper, on the basis of the large model of zero-sample segmentation, the semantic association of segmented images is realized by combining the small sample training based on deep learning, and the conversion of segmented images to numerical models is further realized by adopting image processing technology. Localized deployment is achieved without requiring a large amount of computational resources, and the segmentation, recognition, and analysis of multiple complex rock flakes are realized under a unified framework.

2. Research Methods

2.1. Zero-Sample Segmentation of Large Models

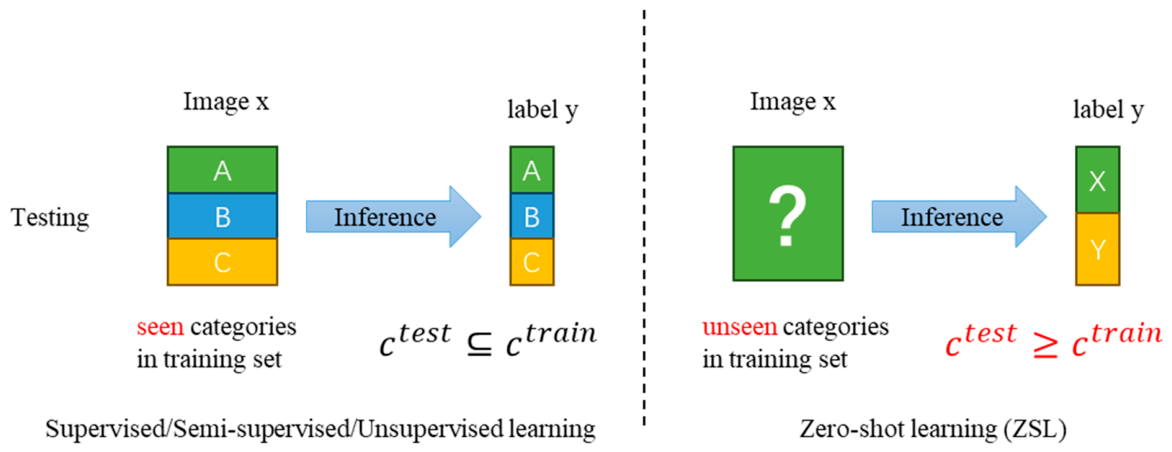
Since deep learning methods are data-driven, the strong demand for large-scale labeled training samples leads to great challenges. In the past, supervised learning, unsupervised learning, semi-supervised learning, and self-supervised learning relied on categories that have been seen during training when performing recognition learning—unseen categories cannot be classified and lack heterogeneous generalization performance. Zero-sample learning is able to categorize categories it has never seen before, giving the machine the ability to reason, as shown in Figure 1.
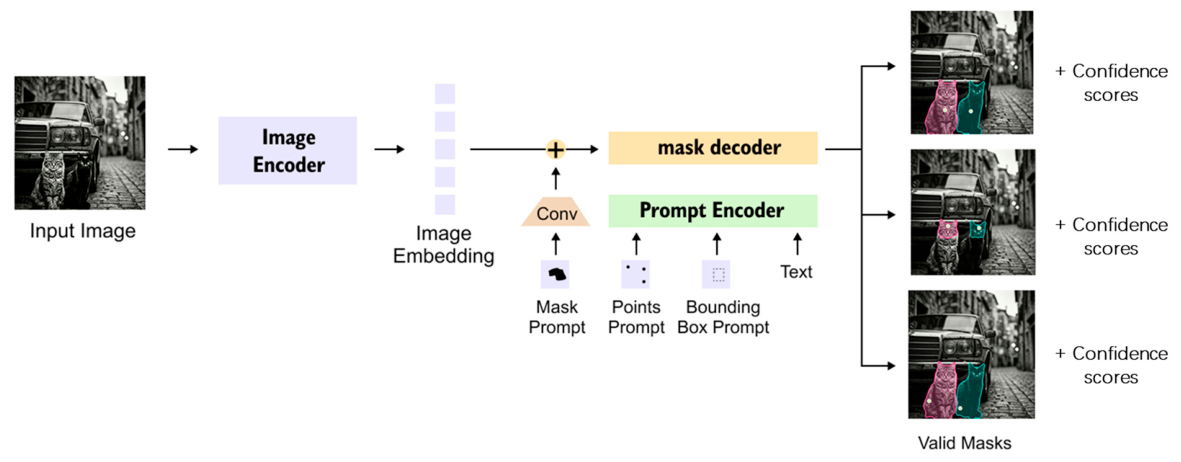
The segment anything model (SAM) is an AI model released by Meta in 2023 [16]. It breaks with existing segmentation techniques and opens up a new era of discovering the possibilities of objects and regions in the world by solving the problem of segmenting arbitrary input images. The SAM has a profound impact on the human digital world and the entire ecosystem of visual applications, driving the way software interacts with users to new heights. Thanks to the immense dataset of the SAM Big Model, it produces segmentation boundaries that are accurate and cover all targets in the input image. The core process is as follows: The image is processed by a particularly large image encoder and transformed into feature vectors, i.e., image embeddings. Various types of user input cues, including mask, points, box, and text, are encoded accordingly. Mask cues are encoded by a convolution operation, while points, box, and text cues are processed by a special encoder and transformed into cue encoding. The mask coding interacts with the image coding to focus on a specific region of the image. Finally, the image encoding and cue encoding are combined and fed into a decoder to generate the final mask. The model structure of the SAM follows the classical encoder–decoder framework, which is currently used by almost all semantic segmentation models, as shown in Figure 2. It is divided into three parts: image encoder, prompt encoder, and mask decoder.

2.1.1. Image Encoder

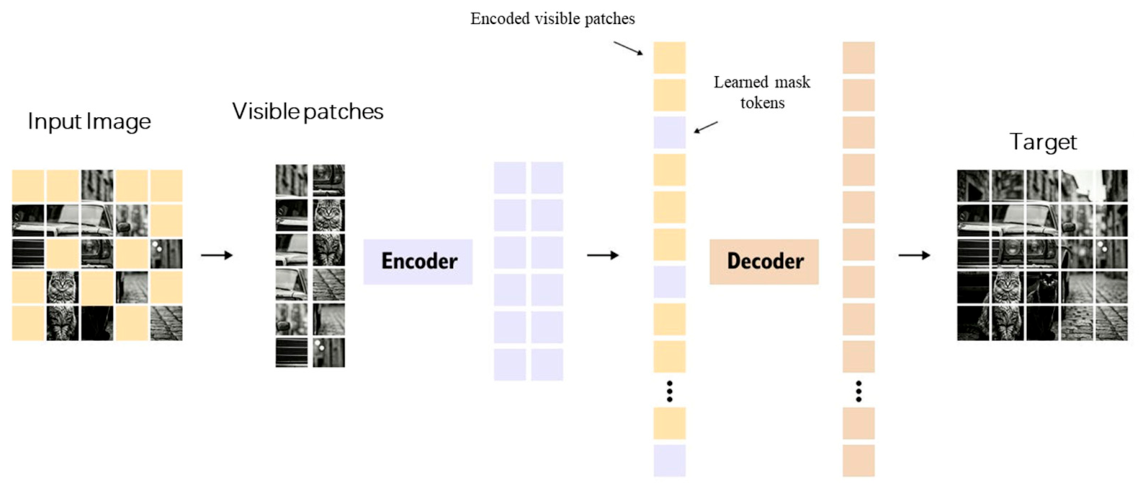
As shown in Figure 3, the encoder is based on the MAE-trained visual transformer (ViT) model [20], which is initialized using the pre-trained weights of the MAE. During the inference phase of the model, each image is processed by the encoder only once, and the resulting image embeddings are subsequently reused in different phases of the model. In the SAM framework, if the dimension of the input image is 1 × 3 × 1024 × 1024, the encoder will generate a 1 × 256 × 64 × 64 feature representation.

2.1.2. Cue Encoder

The cue encoder is designed to handle two main types of cues: sparse cues and dense cues. Sparse cues include point cues, box cues, and text cues, which are processed by position encoding techniques. Point cues and box cues are combined with specific learnable codes through position coding, e.g., the position coding of point cues is combined with a code that distinguishes between the foreground and background of an object, and the position coding of the top-left point of a box cue is combined with a code that denotes the top-left corner. The text cues, on the other hand, are encoded and processed using the text image alignment encoder CLIP. After encoding, these sparse cues are transformed into a 256-dimensional space. For the processing of dense cues, the mask cues are mapped to the same dimension as the image encoding through a convolution operation and then summed with the image encoding. If the mask cue does not exist, the encoder uses a learnable encoding to represent the absence of a mask and adds this encoding to the image embedding.

2.1.3. Mask Decoder

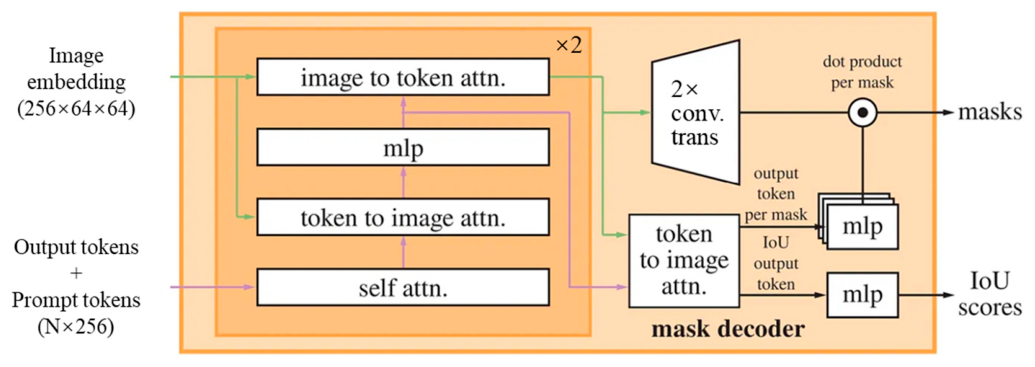
Inspired by the Transformer architecture, the mask decoder utilizes a two-layer decoder structure with integrated learnable output tokens. Each decoder layer incorporates a self-attention mechanism and a bidirectional cross-attention mechanism. In this process, the tokens are used as a query to perform attention computation with the image encoding to update the state of the tokens; at the same time, the image encoding is also used as a query to perform attention computation with the tokens to update the image encoding, as shown in Figure 4.
Degradation loss is a loss function used in the training process of the SAM, which aims to reduce the model’s dependence on cues when generating masks, and prompt the model to learn more from the image content. During the training process, the SAM receives an image and a cue, then generates one or more masks and compares these masks with the real masks to calculate the IoU number. If the IoU score does not meet the preset criteria, the model calculates the degradation loss and adds this loss to the total loss as a way to encourage model generation.

2.2. Deep Image Recognition Model

The SAM Big Model was trained on 11 million images and 1 billion masks, which is the largest dataset available today, and 400 times more masks than currently available datasets. Highly accurate segmentation masks can be generated by the SAM owing to its large-scale training dataset and substantial computational resources. However, semantic category labels are not provided for the generated masks, which limits its direct application to semantic segmentation tasks, where a specific class label is required to be assigned to each pixel in the image.
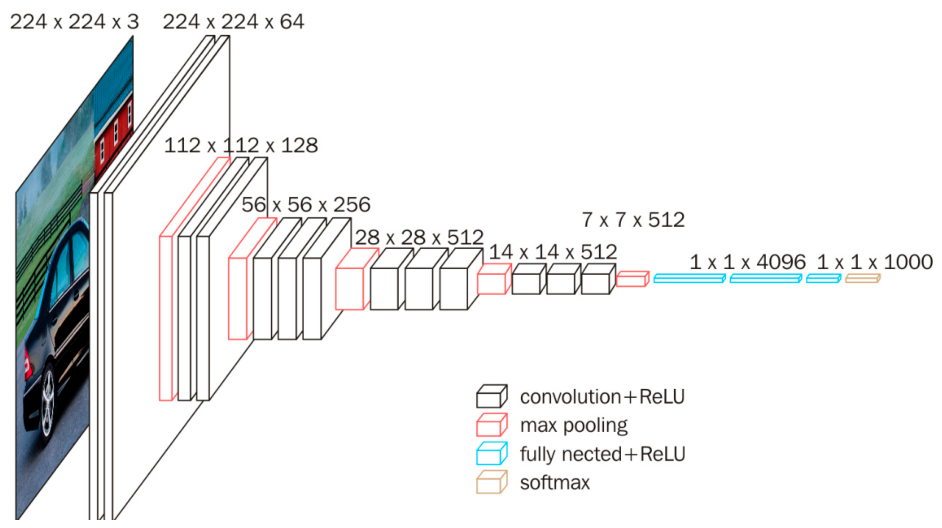
To address the semantic gap in pure segmentation models, deep convolutional neural networks (CNNs) have been widely adopted as the foundational architecture for image classification and semantic segmentation tasks. As illustrated in Figure 5, the typical CNN structure for image categorization comprises multiple convolutional layers for hierarchical feature extraction, pooling layers for spatial dimension reduction, and fully connected layers for high-level semantic inference. This architecture enables the network to learn discriminative representations from raw pixel data, bridging the gap between low-level visual features and high-level semantic concepts.

2.3. Graphics Automatic Vectorization Technique

Image auto-vectorization (IV) is a key technique for converting raster images into vector data, which has a wide range of applications in the fields of numerical simulation and engineering modeling. The DigiSim v1.0 software package [28] performs the conversion from CT, MRI, or high-resolution digital images to finite element (FEM) and discrete element (DEM) numerical models seamlessly. This process eliminates the need for human intervention, directly identifies different material phases in the image, and generates high-quality vector curves, providing an efficient tool for microstructure modeling of heterogeneous materials.
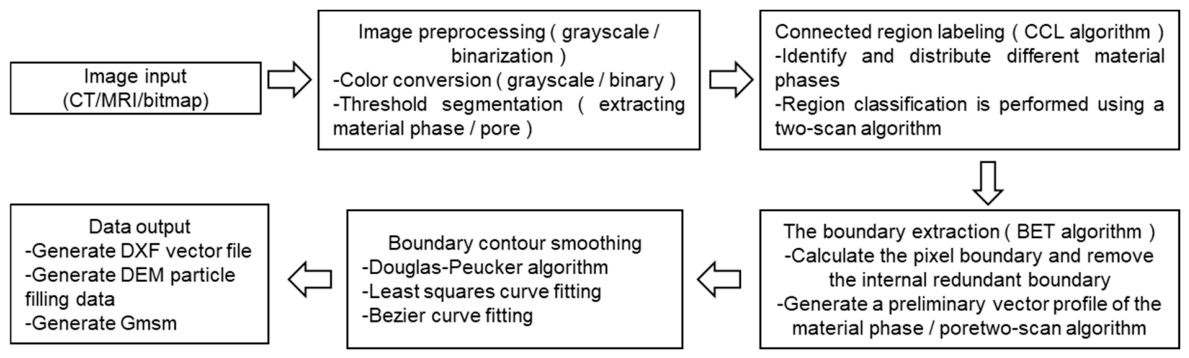
DigiSim’s vectorization process transforms raster images into accurate vector data through a series of algorithms to support numerical simulations and engineering calculations. As shown in Figure 6, the Connected Region Labeling (CCL) algorithm is used to identify separate material phases in the image and assign a unique label to each connected region for subsequent processing. Then, the Boundary Extraction (BET) algorithm is used to form a preliminary vector curve by analyzing the adjacencies between pixels, removing duplicate boundaries, and retaining only the outer contours of the material phases. In order to improve the quality of the curve, the Boundary Refinement (BOR) algorithm employs the maximum vertical distance iterative segmentation (MVDIS) method to smooth the boundary curves, reduce the jagged effect, and decrease the number of unnecessary vertices, thus improving the quality of the finite element meshing.
In addition, to ensure that the numerical model is accurately scaled, DigiSim uses a Geometry Scaling algorithm to convert pixel dimensions to real physical units (e.g., millimeters or micrometers) through a known scale factor to ensure the accuracy of subsequent numerical calculations. Ultimately, all vector data can be exported to a DXF file or other standard formats that are compatible with commonly used FEM/DEM-based numerical simulation platforms, enabling automated meshing and subsequent numerical simulation. Through this process, DigiSim is able to efficiently transform the microstructure of complex materials into a high-precision computational model base.

3. Analysis of Gneiss Samples

3.1. Color Characteristics of Rock Minerals

As different rock minerals have different absorptions for different wavelengths of light, minerals of different compositions show different colors after absorption, projection, reflection, scattering, and interference, and the polarizing microscope is based on these color differences to identify the mineral composition. In addition to the shape of the rock minerals, the texture characteristics are also features of the identification of mineral compositions.
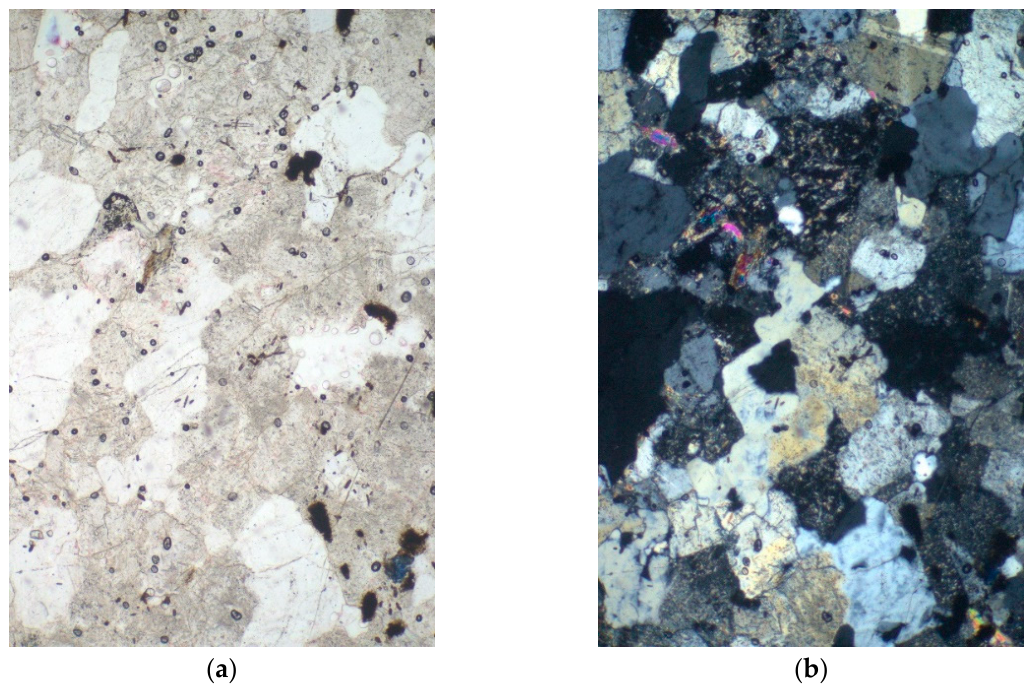
Under single-polarized light conditions, the light is shot into the rock section with plane-polarized light vibrating in a single direction (generally fixed in the east–west direction). The result is the color of different mineral compositions that are unevenly absorbed by each monochromatic light wave in white light. As shown in Figure 7a, the variability of rock minerals in a single-polarized image is relatively small and can generally be used to distinguish between homogeneous and non-homogeneous minerals.
Under cross-polarized light (XPL), as shown in Figure 7b, minerals display richer color variations owing to birefringence-induced interference colors. As light propagates through anisotropic minerals, phase differences develop between the split polarized rays, producing characteristic colors after recombination by the analyzer. Together with extinction phenomena observed at specific orientations, these optical responses enhance the discrimination of different mineral phases.
The extinction feature refers to the placement of minerals under orthogonal polarization: the polarized light from the lower polarizer after penetrating the minerals, at all angles or a specific angle, cannot pass through the upper polarizer, thus making the field of view a dark phenomenon. This specific angle is known as the extinction angle. The type of extinction produced by different minerals is different, mainly including two types of full extinction and four times extinction.

3.2. Segmentation and Recognition of Rock Mineral Images

In the recognition of rock images, traditional computer vision methods usually rely on hand-designed features (e.g., color, texture, or edge information) or fully supervised methods in deep learning, whereas the SAM (which is used in this study) provides a flexible and efficient unsupervised or weakly supervised segmentation scheme for automatic identification and segmentation of rock specimens. Its pre-trained model is able to adapt to a wide range of rock samples with morphological and textural features, and can optimize the segmentation results through interactive prompts, which can effectively improve the processing efficiency and accuracy of test data. The specific processes are as follows:
(1)
Data preprocessing: High-resolution rock sample images were collected and annotated, and the image size was adjusted to satisfy the input requirements of the SAM2.
(2)
Model inference: Segmentation of rock samples is performed using the SAM2.1 Hiera Large Model in the SAM2. The model generates segmentation masks based on prompt inputs, such as points and bounding boxes, to identify mineral components in thin-section images.
(3)
Interactive optimization: Based on the preliminary segmentation results, segmentation accuracy optimization is carried out by additional hint information (e.g., adding extra points or boxes), and the mis-segmented regions are corrected.
(4)
Evaluation and analysis: The segmentation performance is quantitatively evaluated using the Dice coefficient and intersection over union (IoU) to measure the spatial agreement between segmentation results obtained under different sampling densities. The highest-resolution case (128 sampling points) is treated as the reference configuration for consistency-based evaluation.
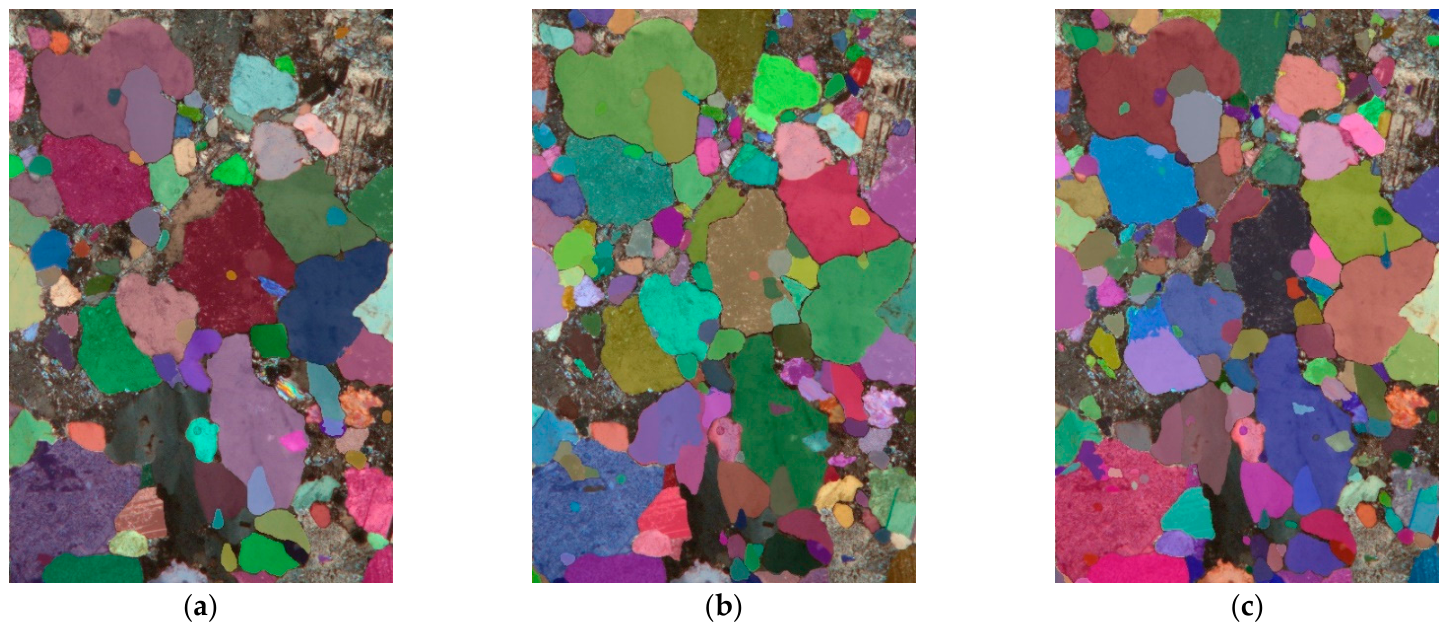
As shown in Figure 8, the SAM2 can recognize rock specimens efficiently and accurately and maintains high segmentation consistency on multiple rock types, and with the increase of the number of sampling points and the increase of the number of masks in the image, the recognition accuracy improves. Especially when dealing with rock samples with complex backgrounds or irregular morphology, the SAM2 has stronger generalization ability and robustness compared with traditional methods. As an efficient image recognition and segmentation tool, the SAM2 can provide an intelligent image processing solution for rock mechanics testing and digital rock modeling.
As shown in Table 1, the segmentation performance improves with increasing sampling density. Both the Dice coefficient and IoU increase from 0.85 and 0.74 at 32 sampling points to 0.93 and 0.87 at 64 sampling points, respectively, indicating a significant improvement in segmentation consistency. The highest-resolution case (128 sampling points) is used as the reference, achieving perfect agreement by definition.

3.3. Numerical Modeling of Rock Minerals

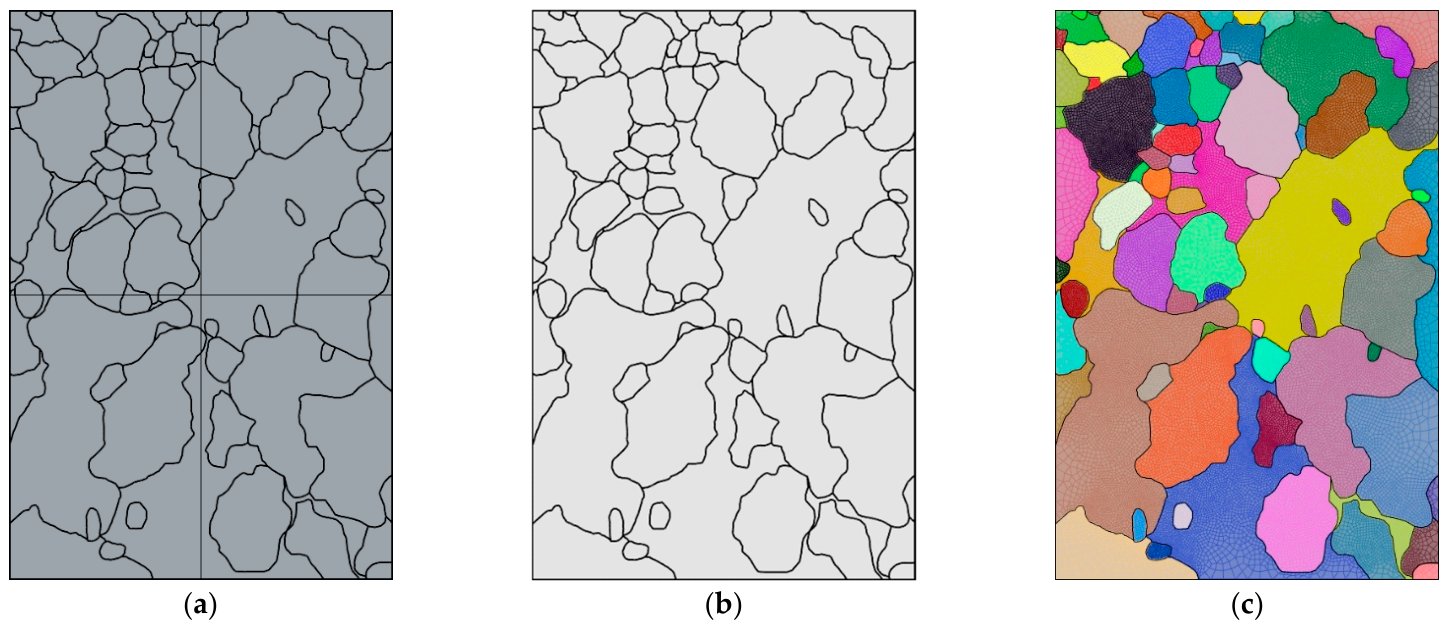
In order to convert the mineral segmentation results of rock thin sections into a computational model for numerical analysis, this study adopts a unified DigiSim-based vectorization workflow, as shown in Figure 9. The mineral boundaries extracted from the SAM2 segmentation results are directly processed in DigiSim to generate vectorized geometric representations of different mineral phases. In this process, pixel-level segmentation masks are converted into computational geometries suitable for numerical simulation, while noise is reduced and the geometric consistency of mineral boundaries is improved.
The vectorized model generated by DigiSim is then used to construct the numerical model of the rock thin section. As illustrated in Figure 9a, the extracted mineral boundaries are first converted into model contour lines. These contours are subsequently transformed into model surfaces (Figure 9b), and the corresponding mesh model is generated for numerical analysis (Figure 9c). The resulting geometry is scaled according to the actual thickness of the rock thin section to ensure consistency with the physical specimen. Finally, the model is exported as an *.f3grid file for FLAC3D numerical simulations.

4. Numerical-Simulation-Based Estimation of Physical and Mechanical Properties

4.1. Numerical Triaxial Mechanical Testing of Rocks

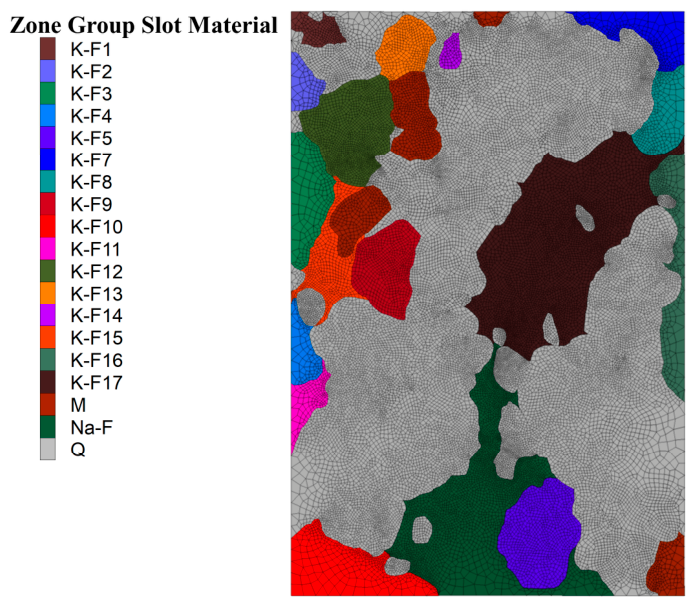
As shown in Figure 10, this study adopts a pseudo-3D modeling strategy based on a two-dimensional thin-section reconstruction, which is extruded along a constant thickness to generate a three-dimensional numerical model in FLAC3D 9.0. This approach assumes that the mineral fabric is invariant in the out-of-plane direction.
The generated mesh file (*.f3grid) is then imported into FLAC3D 9.0 for numerical simulation, and the mechanical properties of component materials are assigned and calibrated accordingly. The rock-forming minerals are mainly quartz (Q), plagioclase feldspar (Na-F), potassium feldspar (K-F), and mica (M). The corresponding material parameters are listed in Table 2.
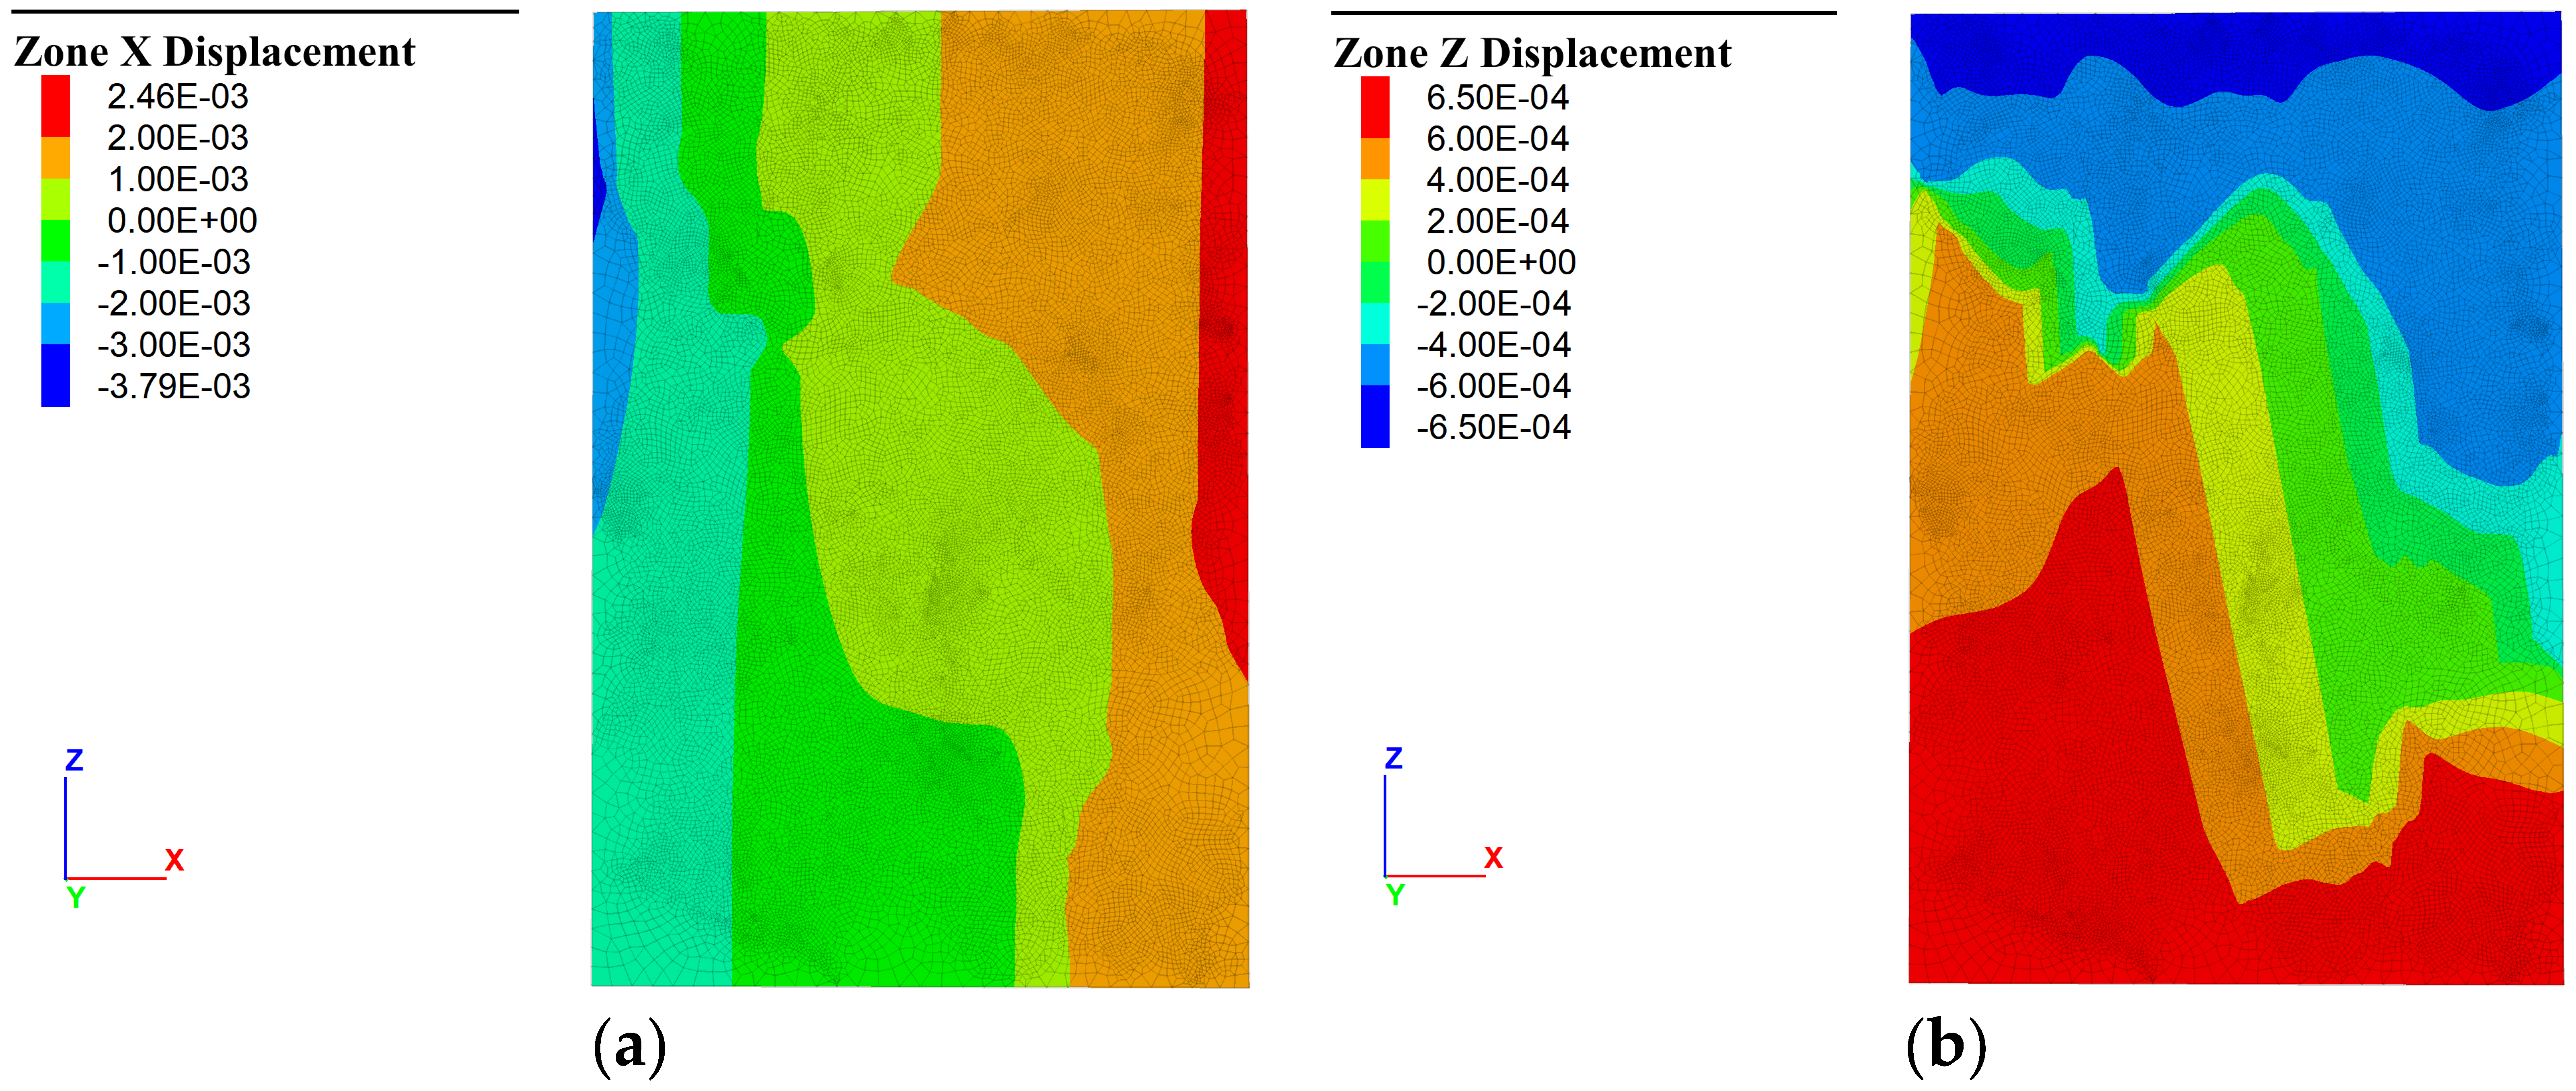
On the basis of the constructed rock mineral numerical model, triaxial mechanical tests were carried out to evaluate the mechanical properties of the rocks and to study the stress–strain relationship and damage patterns. The total mesh of the numerical model was 31,760, and the lengths of X, Y, and Z directions were 7, 0.25, and 11 cm. The Mohr–Coulomb intrinsic model was selected for uniaxial compression simulation tests, and the material parameters included the modulus of elasticity, Poisson’s ratio, angle of internal friction, cohesion, etc. The axial loading in the Z direction was performed by a displacement-controlled method, and the top and bottom loading rates were set at 5 × 10⁻⁷ m/step. The peripheral pressure loading adopts constant pressure mode, the Y direction is set to 15 MPa to simulate the rock mechanical behavior under geological environment, the X direction is not processed, and the model step is set to 8000, and the calculation results are shown in Figure 11.
The displacement distribution of the rock specimen is characterized by the maximum displacement in the X direction occurring on the left side of the rock specimen, with the maximum value of 3.79 mm, which is due to the fact that the left side of the rock is mainly composed of mica and potassium feldspar, and the modulus of elasticity is lower than that of quartz and plagioclase feldspar. The Z-direction displacement at the bottom of the top is more symmetrical, while the center area shows a slightly staggered tendency, which is mainly due to the fact that this is the boundary between the quartz component and potassium feldspar component, and there are more microfractures.
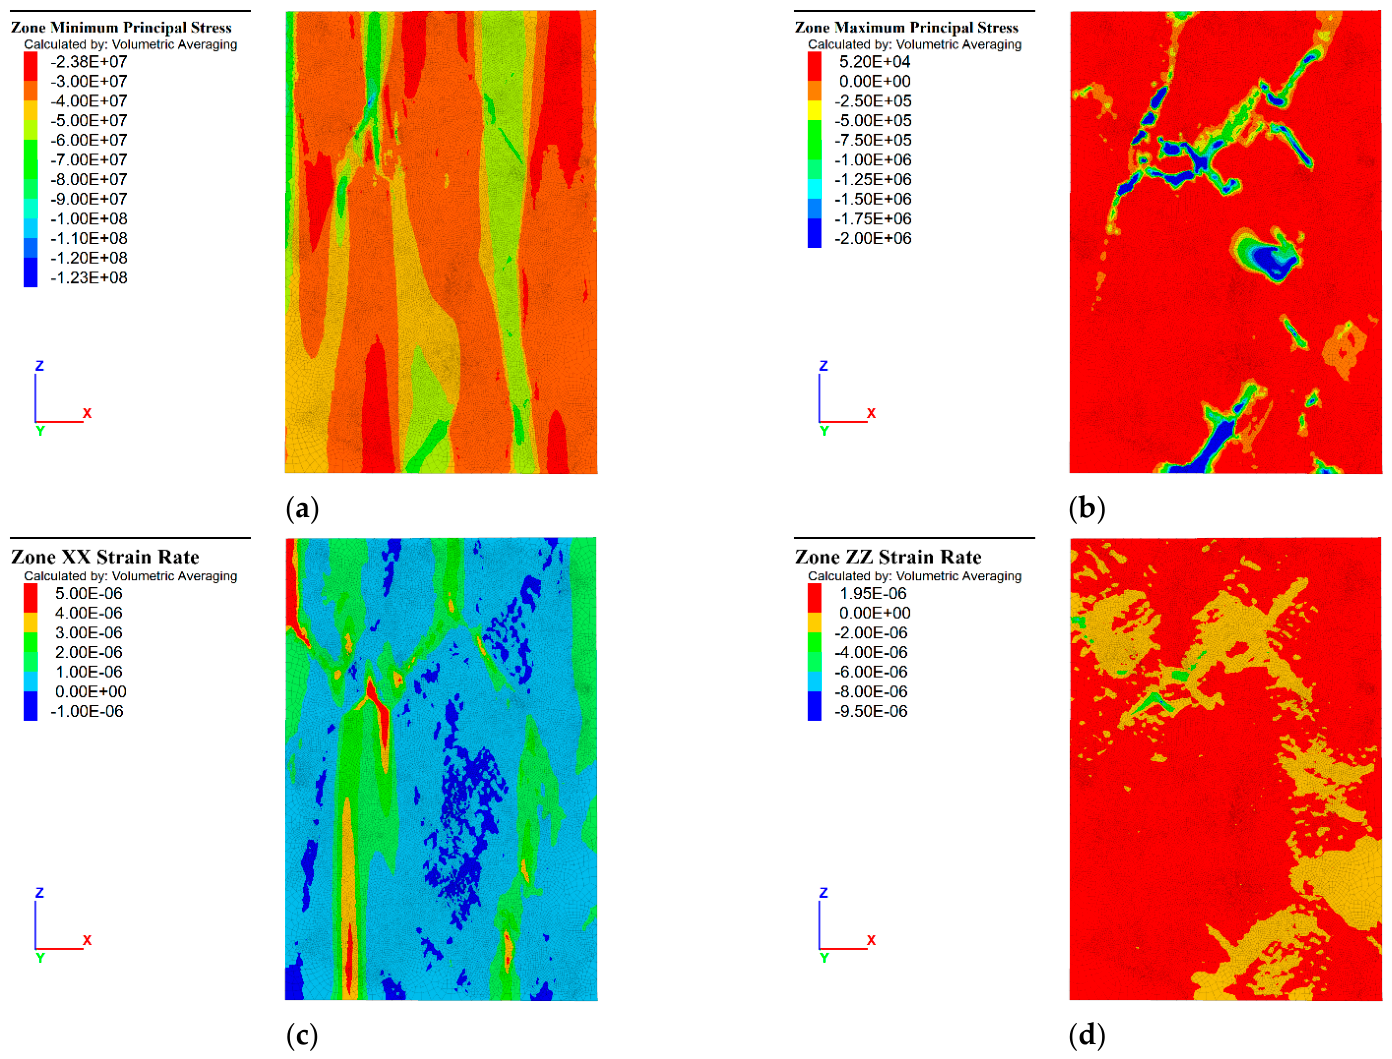
As shown in Figure 12, the stress–strain distribution characteristics of the rock specimens indicate that the maximum compressive stress reaches 123.0 MPa and the maximum tensile stress is 52.0 KPa. The maximum strain in the X direction is 5 × 10⁻⁶, while the maximum strain in the Z direction reaches 9.5 × 10⁻⁶. Further analysis shows that the distribution of the maximum principal stresses is more consistent with the variation of the strain in the X direction, while the distribution of the minimum principal stresses is similar to the variation of the strain in the Z direction. In addition, the mineral boundaries have a significant effect on the damage patterns of the rocks, especially in the boundary regions of K-F4, Na-F, and M components, where the low-strength mineral particles are prone to form stress concentrations, which in turn lead to localized damage.

4.2. Parameter Estimation and Comparison

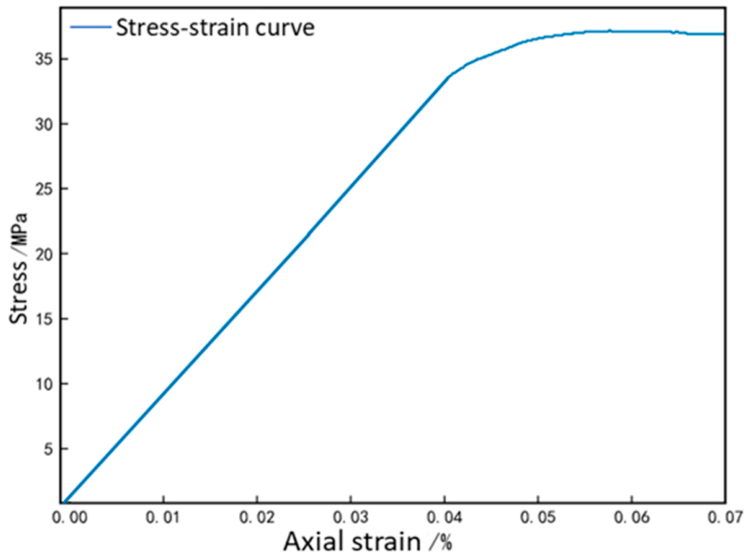
The uniaxial compression experiments were carried out using FLAC3D to obtain the rock stress–strain test results of rock specimens under uniaxial conditions. The stress–strain data of the elastic stage (axial strain 0.02–0.04%) were selected to calculate the elastic modulus of 81.95 GPa by taking the slope, and the stress–strain curves were plotted as shown in Figure 13. The specimens enter the plastic stage when the axial strain reaches 0.04%. The stress values reported in this study include both local peak stresses and volume-averaged macroscopic stresses, depending on the analysis scale.
As shown in Table 3, the elastic modulus obtained from the numerical simulation in this study was compared with the equivalent elastic modulus reported in the literature [31] which was determined based on nanoindentation tests and parameter homogenization analysis of deeply buried granite. The comparison shows that the elastic modulus obtained in this study has a relative error of only 3.4% and is slightly higher than the literature value. This difference may be attributed to the fact that the specimen reported in the literature contained a higher proportion of low-modulus mineral components than the specimen modeled in this study, resulting in a slightly lower equivalent elastic modulus.

5. Conclusions

In this study, an intelligent method for fine-structure extraction and physico-mechanical analysis of rock flakes was proposed based on the zero-sample segmentation algorithm (SAM). Aiming at the problems such as the difficulty of identifying rock mineral components, the limited accuracy of traditional segmentation methods, and the complexity of the numerical modeling process, this study realized the accurate segmentation of rock mineral components by combining the deep convolutional neural network with the small-sample training and converted the segmentation results into vectorized numerical models by using the image processing technology, so as to support the subsequent analysis of physical and mechanical properties. The experimental results showed that the method can efficiently and accurately recognize multiple mineral components and still has high segmentation accuracy under complex backgrounds. Compared with traditional manual labeling or rule-based methods, the method significantly reduces the data labeling work, improves automation, and enhances the adaptability to different rock samples.
In terms of physico-mechanical characterization, this study carried out mechanical response simulation tests on the extracted rock sheet mineral model based on numerical simulation methods and obtained the stress–strain characteristics and related mechanical parameters of the rocks. The simulation results are in good agreement with the existing literature data, indicating that the proposed method can reasonably capture the mechanical behavior of rocks under different working conditions and suggesting its potential applicability. Especially, in the simulation of the triaxial compression test, it was found that the mineral boundaries and component distributions have a significant influence on the local stress concentration and damage mode of the rock, which further reflects the advantages of this method on the fine scale. Compared with traditional mechanical analysis methods based on empirical parameters, the proposed process can more accurately simulate the microstructure of rocks and predict their mechanical properties, providing a more refined analysis tool for rock mechanics research. The main novelty of this work lies in the development of a unified and reproducible workflow that bridges SAM2-based mineral segmentation with DigiSim-based geometric reconstruction for numerical modeling of rock thin sections.

Author Contributions

W.-Q.H., methodology, formal analysis; Y.-B.L., writing—original draft, validation; C.L., conceptualization, writing—review and editing; L.-T.M., supervision; J.-Q.C., data curation; Q.-X.M., investigation. All authors have read and agreed to the published version of the manuscript.

Funding

This research received no external funding.

Data Availability Statement

The data presented in this study are available on request from the corresponding author due to privacy.

Conflicts of Interest

Authors Wei-Qiang Hu, Yang-Bing Li, Cheng Liu, Li-Tao Ma, and Jian-Qi Chen were employed by the Engineering Technology Branch, CNOOC Energy Development Co., Ltd and the Key Laboratory of Unconventional Exploration and Development, CNOOC Energy Development Co., Ltd. The remaining authors declare that the research was conducted in the absence of any commercial or financial relationships that could be construed as a potential conflict of interest.

References

  1. Li, H.; Asbjörnsson, G.; Lindqvist, M. Image Process of Rock Size Distribution Using DexiNed-Based Neural Network. Minerals 2021, 11, 736. [Google Scholar] [CrossRef] [Scilit]
  2. Zhao, J.; Li, D.; Yu, Y. Identification of Rock Fragments after Blasting by Using Deep Learning-Based Segment Anything Model. Minerals 2024, 14, 654. [Google Scholar] [CrossRef] [Scilit]
  3. Osco, L.P.; Wu, Q.; de Lemos, E.L.; Gonçalves, W.N.; Ramos, A.P.M.; Li, J.; Marcato, J. The segment anything model (SAM) for remote sensing applications: From zero to one shot. Int. J. Appl. Earth Obs. Geoinf. 2023, 124, 103540. [Google Scholar] [CrossRef] [Scilit]
  4. Li, L.; Chen, T.; Liu, H.; Guo, R.; He, R.; Meng, Q. Coupled LEM–CZM Numerical Framework for Landslide Simulation and Its Application to Geotechnical Design. Designs 2025, 9, 133. [Google Scholar] [CrossRef] [Scilit]
  5. Liu, H.; Ren, Y.; Li, X. Rock thin-section analysis and identification based on artificial intelligent technique. Pet. Sci. 2022, 19, 1605–1621. [Google Scholar] [CrossRef] [Scilit]
  6. Dell’Aversana, P. An Integrated Deep Learning Framework for Classification of Mineral Thin Sections and Other Geo-Data, a Tutorial. Minerals 2023, 13, 584. [Google Scholar] [CrossRef] [Scilit]
  7. Zhang, P.; Zhou, J.; Zhao, W.; Li, X.; Pu, L. The edge segmentation of grains in thin-section petrographic images utilising extinction consistency perception network. Complex Intell. Syst. 2024, 10, 1231–1245. [Google Scholar]
  8. Su, C.; Xu, S.; Zhu, K.; Zhang, X. Rock classification in petrographic thin section images based on concatenated convolutional neural networks. Earth Sci. Inform. 2020, 13, 1477–1484. [Google Scholar] [CrossRef] [Scilit]
  9. Zhou, Y.; Xia, B.; Zhang, S.; Zhou, L.; Zhang, X.; Li, X. Deep learning-based nanoindentation for evaluating the mechanical properties of rock-forming minerals. J. Rock Mech. Geotech. Eng. 2025, 18, 1892–1908. [Google Scholar]
  10. Yadav, A.; Behera, B.; Singh, G.S.P.; Sharma, S.K. Numerical modelling of post-failure behaviors of coal specimens. J. Rock Mech. Geotech. Eng. 2024, 16, 789–802. [Google Scholar] [CrossRef] [Scilit]
  11. Hassan, S.M.; Laban, N.; Khashaba, S.M.A.; El-Shibiny, N.H.; Bashir, B.; Azer, M.K.; Drüppel, K.; Keshk, H.M. Semantic Segmentation of Some Rock-Forming Mineral Thin Sections Using Deep Learning Algorithms: A Case Study from the Nikeiba Area, South Eastern Desert, Egypt. Remote Sens. 2024, 16, 2276. [Google Scholar] [CrossRef] [Scilit]
  12. Chen, Z.; Liu, X.; Yang, J.; Little, E.; Zhou, Y. Deep learning-based method for SEM image segmentation in mineral characterization, an example from Duvernay Shale samples in Western Canada Sedimentary Basin. Comput. Geosci. 2020, 138, 104450. [Google Scholar] [CrossRef] [Scilit]
  13. Carbonari, R.; Emmanuel, S.; Day-Stirrat, R.J. Identification of quartz cement in sandstone through deep learning segmentation of electron microscopy images. Geoenergy Sci. Eng. 2024, 233, 213049. [Google Scholar] [CrossRef] [Scilit]
  14. Minaee, S.; Boykov, Y.Y.; Porikli, F.; Plaza, A.J.; Kehtarnavaz, N.; Terzopoulos, D. Image segmentation using deep learning: A survey. IEEE Trans. Pattern Anal. Mach. Intell. 2022, 44, 3523–3542. [Google Scholar] [PubMed]
  15. Rahmon, G.; Bunyak, F.; Seetharaman, G.; Palaniappan, K. Motion U-Net: Multi-cue encoder-decoder network for motion segmentation. In 2020 25th International Conference on Pattern Recognition (ICPR); IEEE: Piscataway, NJ, USA, 2021; pp. 653–667. [Google Scholar]
  16. Fan, H.; Tian, Z.; Xu, X.; Sun, X.; Ma, Y.; Liu, H.; Lu, H. Rockfill material segmentation and gradation calculation based on deep learning. Case Stud. Constr. Mater. 2022, 17, e01216. [Google Scholar] [CrossRef] [Scilit]
  17. Kirillov, A.; Mintun, E.; Ravi, N.; Mao, H.; Rolland, C.; Gustafson, L.; Xiao, T.; Whitehead, S.; Berg, A.C.; Lo, W.Y.; et al. Segment Anything. In 2023 IEEE/CVF International Conference on Computer Vision (ICCV); IEEE: Piscataway, NJ, USA, 2023; pp. 3992–4003. [Google Scholar]
  18. Ma, J.; He, Y.; Li, F.; Han, L.; You, C.; Wang, B. Segment anything in medical images. Nat. Commun. 2024, 15, 654. [Google Scholar] [CrossRef] [Scilit] [PubMed]
  19. He, K.; Chen, X.; Xie, S.; Li, Y.; Dollár, P.; Girshick, R. Masked autoencoders are scalable vision learners. In Proceedings of the IEEE/CVF Conference on Computer Vision and Pattern Recognition; IEEE: Piscataway, NJ, USA, 2022; pp. 16000–16009. [Google Scholar]
  20. Dosovitskiy, A.; Beyer, L.; Kolesnikov, A.; Weissenborn, D.; Zhai, X.; Unterthiner, T.; Dehghani, M.; Minderer, M.; Heigold, G.; Gelly, S.; et al. An image is worth 16x16 words: Transformers for image recognition at scale. arXiv 2021, arXiv:2010.11929. [Google Scholar]
  21. Amankwah, A.; Aldrich, C. Rock image segmentation using watershed with shape markers. In Proceedings of the 2010 IEEE 39th Applied Imagery Pattern Recognition Workshop (AIPR); IEEE: Piscataway, NJ, USA, 2010. [Google Scholar]
  22. Sereshki, F.; Hoseini, S.M.; Ataei, M. Blast fragmentation analysis using image processing. Int. J. Min. Geo-Eng. 2017, 50, 211–218. [Google Scholar]
  23. Guo, Q.; Wang, Y.; Yang, S.; Xiang, Z. A method of blasted rock image segmentation based on improved watershed algorithm. Sci. Rep. 2022, 12, 7143. [Google Scholar] [CrossRef] [Scilit] [PubMed]
  24. Guo, Q.; Yang, S.; Wang, Y.; Zhang, H. Size measurement of blasted rock fragments based on FRRSnet+. Measurement 2023, 218, 113305. [Google Scholar] [CrossRef] [Scilit]
  25. Liang, Z.; Nie, Z.; An, A.; Gong, J.; Wang, X. A particle shape extraction and evaluation method using a deep convolutional neural network and digital image processing. Powder Technol. 2019, 353, 156–170. [Google Scholar] [CrossRef] [Scilit]
  26. Yue, Z.Q.; Bekking, W.; Morin, I. Application of digital image processing to quantitative study of asphalt concrete microstructure. Transp. Res. Rec. 1995, 1492, 53–60. [Google Scholar]
  27. Xu, W.; Hu, R.; Yue, Z. Meso-structure character of soil-rock mixtures based on digital image. J. Liaoning Tech. Univ. (Nat. Sci.) 2008, 27, 14–17. [Google Scholar]
  28. Yan, L.; Meng, Q.-X.; Xu, W.-Y.; Wang, H.-L.; Zhang, Q.; Zhang, J.-C.; Wang, R.-B. A numerical method for analyzing the permeability of heterogeneous geomaterials based on digital image processing. J. Zhejiang Univ.-Sci. A 2017, 18, 124–137. [Google Scholar] [CrossRef] [Scilit]
  29. Meng, Q.-X.; Xu, W.-Y.; Wang, H.-L.; Zhuang, X.-Y.; Xie, W.-C.; Rabczuk, T. DigiSim—An Open Source Software Package for Heterogeneous Material Modeling Based on Digital Image Processing. Adv. Eng. Softw. 2020, 148, 102836. [Google Scholar] [CrossRef] [Scilit]
  30. Long, J.; Shelhamer, E.; Darrell, T. Fully convolutional networks for semantic segmentation. In Proceedings of the IEEE Conference on Computer Vision and Pattern Recognition; IEEE: Piscataway, NJ, USA, 2015; pp. 3431–3440. [Google Scholar]
  31. Zhang, P.; Jin, H.; Guo, R.; Xu, X.; Li, S.; Meng, Q. Optimization of the Prestress Value for Multi-Row Anchor in Anti-Slide Pile Based on a Staged Orthogonal Design. Designs 2025, 9, 142. [Google Scholar] [CrossRef] [Scilit]
  32. Ronneberger, O.; Fischer, P.; Brox, T. U-Net: Convolutional networks for biomedical image segmentation. In Proceedings of the International Conference on Medical Image Computing and Computer-Assisted Intervention; Springer: Cham, Switzerland, 2015; pp. 234–241. [Google Scholar]
  33. Yi, S.F.; Zhang, Y.H.; Li, C.D.; Li, Z.F.; Zeng, F.J. Micromechanical properties of key rock-forming minerals based on nanoindentation. Rock Soil Mech. 2025, 46, 3841–3854+3912. [Google Scholar]
Figure 1. Schematic illustration of zero-sample learning fundamentals and its application in rock mineral segmentation without labeled training data.
Eng 07 00392 g001
Figure 2. Schematic diagram of the SAM’s integrated architecture.
Eng 07 00392 g002
Figure 3. Encoder ViT model based on MAE training.
Eng 07 00392 g003
Figure 4. Mask decoder model structure diagram.
Eng 07 00392 g004
Figure 5. Explanation of the image categorization CNN structure.
Eng 07 00392 g005
Figure 6. DigiSim image vectorization processing flow chart.
Eng 07 00392 g006
Figure 7. Appearance of rock minerals under plane-polarized light (PPL) and cross-polarized light (XPL). (a) Single-polarized light and (b) orthogonal polarization.
Eng 07 00392 g007
Figure 8. Rock image recognition results with different sampling points. (a) Number of sampling points = 32, (b) number of sampling points = 64, and (c) number of sampling points = 128.
Eng 07 00392 g008
Figure 9. Numerical modeling workflow from SAM2-based mineral segmentation to FLAC3D mesh generation: (a) Model contour lines, (b) model surface, and (c) mesh model.
Eng 07 00392 g009
Figure 10. The numerical modeling and mineral calibration of rock specimens were carried out by FLAC3D 9.0.
Eng 07 00392 g010
Figure 11. Displacement distribution characteristics of rock specimens in different directions. (a) X-direction displacement and (b) Z-direction displacement.
Eng 07 00392 g011
Figure 12. Stress–strain distribution characteristics of rock specimens in different directions. (a) Maximum principal stress, (b) minimum principal stress, (c) X-direction strain, and (d) Z-direction strain.
Eng 07 00392 g012
Figure 13. Stress–strain curve of uniaxial compression.
Eng 07 00392 g013
Table 1. Segmentation performance under different sampling densities.
Sampling PointsDice CoefficientIoU
320.850.74
640.930.87
128 (reference)1.001.00
Table 2. Mohr–Coulomb parameters used in numerical simulation.
MaterialDensity (kg/m3)Young’s Modulus/GPaPoisson’s RatioCohesion/MPaFriction Angle/°
K-F12600540.35536
K-F22700680.30831
K-F32600560.30530
K-F42680650.30432
K-F52600540.31430
K-F72680660.30533
K-F82600510.35534
K-F92600510.35635
K-F102700680.32635
K-F112600530.35735
M2600530.35535
Na-F2700970.30632
Q26001020.25833
Table 3. Comparison of elastic modulus with previous research results.
Source of DataModulus of Elasticity/GPa
Simulated test81.95
Literature [31]79.20
Disclaimer/Publisher’s Note: The statements, opinions and data contained in all publications are solely those of the individual author(s) and contributor(s) and not of MDPI and/or the editor(s). MDPI and/or the editor(s) disclaim responsibility for any injury to people or property resulting from any ideas, methods, instructions or products referred to in the content.