Article

Influence of Clay Soil Mineralogy on the Microstructure and Physico-Mechanical Properties of Natural Rubber Composites for Inner Tube Applications


by
Lohami Valentin Landry Gnoumou
1,2,3,
Halidou Bamogo
1,4,
Abdel Aziz Tinto
1,5,
Issiaka Sanou
1,4,
Jean-Emmanuel Aubert
6,* and
Younoussa Millogo
1,4
1
Laboratoire de Chimie et Énergies Renouvelables (LaCER), Université Nazi BONI, Bobo-Dioulasso BP 1091, Burkina Faso
2
Laboratoire de Chimie Analytique, Physique de l’Espace et de l’Énergie (LACAPSE), Université Norbert ZONGO, Koudougou BP 376, Burkina Faso
3
Département de Génie Civil, Institut Universitaire de Technologie (IUT), Université Norbert ZONGO, Koudougou BP 376, Burkina Faso
4
Unité de Formation et de Recherche Sciences Exactes et Appliquées (UFR/SEA), Université Nazi BONI, Bobo-Dioulasso BP 1091, Burkina Faso
5
Département de Génie Civil, Institut Universitaire de Technologie (IUT), Université Nazi BONI, Bobo-Dioulasso BP 1091, Burkina Faso
6
Laboratoire Matériaux et Durabilité des Constructions (LMDC), Institut National des Sciences Appliquées (INSA) de Toulouse, Université de Toulouse, 135 Avenue de Rangueil, 31077 Toulouse, France
*
Author to whom correspondence should be addressed.
Eng 2026, 7(8), 370; https://doi.org/10.3390/eng7080370
Submission received: 25 June 2026 / Revised: 16 July 2026 / Accepted: 20 July 2026 / Published: 27 July 2026
(This article belongs to the Section Chemical, Civil and Environmental Engineering)

Abstract

The limited utilization of raw clays in the rubber industry is primarily attributed to an inadequate understanding of the complex interactions between clay minerals, their accessory minerals, and the polymer matrix. This study compares two local raw clays (SIT and KLE) with a reference industrial clay (REF) to demonstrate how differences in mineralogical composition affect the mechanical properties of natural rubber (NR)-based composites. Mineralogical characterization techniques (XRD, TGA-DSC, and IR) reveal distinct profiles: REF exhibits well-crystallized kaolinite as its dominant phase, whereas SIT contains a high proportion of quartz with less crystalline kaolinite, and KLE shows a complex mineral assemblage including swelling minerals (montmorillonite and chlorite). Microstructural analysis of NR/clay composites reveals a physical dispersion of clay particles within the polymer matrix without evidence of intercalation, with greater homogeneity observed for REF and SIT. Rheological properties indicate that curing times increase with increasing filler content, a trend that is particularly pronounced for KLE due to its interactions with the curing system. NR/REF composites outperform NR/SIT and NR/KLE in all evaluated mechanical properties, including the modulus at 300% elongation (6.1 MPa vs. 3.3 and 2.7 MPa), tensile strength, hardness, and tear resistance. This study establishes that reinforcement efficiency is directly linked to high kaolinite crystallinity, the absence of swelling minerals, and low concentrations of accessory minerals. Based on these findings, untreated local clay soils are not suitable for the manufacture of NR inner tubes and require appropriate pre-treatment prior to use.

1. Introduction

Clays, such as bentonite and kaolin, are strategic mineral resources with an estimated global production of 19.2 million and 29 million tonnes, respectively [1]. Their unique physicochemical properties make them materials of choice for a wide range of industrial applications, particularly in the paper [2], paint, and construction industries [3,4]. In the field of elastomers, clays are increasingly used as reinforcing fillers to replace traditional materials such as carbon black and silica, owing to their lower cost, wider availability, and improved environmental sustainability [5].
Several studies have reported significant improvements in the mechanical and physical properties of elastomers reinforced with modified clays. For instance, Ogbebor et al. [6] demonstrated that the intercalation of Cetyl Trimethyl Ammonium Bromide (CTAB) into kaolinite increased the tensile modulus and mechanical strength of NR by 35% compared with unmodified clay. These findings were corroborated by Peter et al. [7], who observed simultaneous increases in chemical cross-link density, tensile modulus, hardness, and tensile and tear strengths in CTAB-modified NR/kaolin composites. Similarly, studies conducted by Zhang et al. [8,9,10] on silane-modified kaolins (SMKs) revealed exceptional mechanical performance in styrene–butadiene rubber (SBR), with tensile strengths reaching 19.6 MPa and tear strengths of 4.6 kN/m. These materials also exhibited reduced vulcanisation times and excellent gas barrier properties, thereby outperforming precipitated silica-filled composites. Liu et al. [11] reported that NR/nanokaolin nanocomposites exhibited superior thermal stability and improved processability compared with silica-filled systems. Furthermore, these nanocomposites showed slightly higher tear strength (42.8 kN/m) and tensile modulus (7.1 MPa) than composites containing precipitated silica (35.0 kN/m and 6.3 MPa, respectively).
Other modification approaches have also produced promising results. Keereerak et al. [12] enhanced the intercalation and exfoliation of bentonite in NR through ultrasonic treatment in ethanol, leading to significant improvements in microstructural and mechanical properties. Arroyo et al. [13] achieved mechanical performance comparable to that of a compound containing 40 wt% carbon black using only 10 wt% of fatty alkyl amine-modified montmorillonite. In parallel, Surya and Khosman [14] highlighted the dual role of montmorillonite as both a reinforcing filler and a vulcanising agent, resulting in reduced optimum curing times. Kader et al. [15] demonstrated that the mechanical properties of NBR/Na-montmorillonite nanocomposites varied proportionally with filler concentration. Likewise, Wang et al. [16] reported that CTAB-modified illite increased the modulus at 300% elongation by 71.9% and reduced wear by 23.8% compared with untreated illite in NR composites.
Collectively, these studies confirm that modified clays represent effective alternatives to conventional fillers such as carbon black and silica. Overall, the literature indicates that the physical and mechanical performances of elastomer–clay composites depend strongly on the clay type, the modification technique employed, and the degree of compatibility with the polymer matrix. The best results are generally obtained for filler contents ranging from 10 to 40 wt% using clays that have undergone suitable chemical or physical modification to optimize their dispersion and interfacial interactions with the elastomer matrix.
However, these approaches present significant limitations within the Burkinabe industrial context. Clay modification processes involve substantial costs and require specialized infrastructure, whereas the importation of pre-treated materials generates additional transportation, storage, and logistics expenses, thereby reducing the competitiveness of local industries. Under these conditions, the direct utilization of locally available natural clays represents a promising alternative for the tyre industry.
To the best of our knowledge, the use of raw clays as fillers in elastomers remains relatively unexplored. Seynou et al. [17] and Gnoumou et al. [5] demonstrated the technical feasibility of employing untreated local clays in NR composites. The latter study showed that a local clay (DIE), used without chemical modification, could achieve performance comparable to that of an imported commercial filler in inner tube manufacturing. Nevertheless, these studies present several limitations. The interaction mechanisms at the clay–rubber interface remain insufficiently understood, with reinforcement arising primarily from physical dispersion rather than the formation of a nanostructured morphology. In addition, the use of a single high filler loading (50 wt%) prevents the identification of optimum filler concentrations and the evaluation of potential synergistic effects at lower loadings. Finally, previous investigations have focused mainly on kaolinitic clays, without considering the potential influence of other mineral phases such as smectites, chlorites, and accessory minerals including quartz.
This study evaluates the potential of two local clays, Sitiéna (SIT) and Klésso (KLE), as semi-reinforcing fillers for NR. Using a commercial kaolinite-rich clay (REF) as a reference material, the investigation combines several complementary approaches, including detailed mineralogical characterization of the local clays, analysis of the interaction mechanisms at the clay–rubber interface, and systematic evaluation of mechanical performance as a function of filler loading. This comprehensive methodology aims not only to address the limitations identified in previous studies but also to establish clear correlations between clay mineralogy and the performance of these materials as semi-reinforcing fillers.

2. Raw Materials and Experimental Methods

2.1. Clayey Raw Materials

The local clay samples (KLE and SIT) were collected from two sites in Burkina Faso: Klésso (latitude 10°56′39.2″ N, longitude 3°58′55.3″ W) and Sitiéna (latitude 10°36′26.0″ N, longitude 4°48′09.9″ W). A commercial industrial clay (REF), commonly used by the Burkinabe tyre industry, was employed as a reference material. The KLE and SIT deposits are readily accessible open-pit quarries. The raw clays were subjected to comminution via a mechanical disc pulveriser to achieve a fine and homogeneous particle size distribution. NR was supplied by the Société Africaine de Plantations d’Hévéas (SAPH), Côte d’Ivoire. Sulphur, used as the vulcanising agent, was supplied by Solvay (Germany). Stearic acid and zinc oxide, which function as vulcanisation activators, together with the accelerator N-tert-butylbenzothiazole-2-sulfenamide (TBBS) and the retarder N-(cyclohexylthio)phthalimide (PVI), were obtained from commercial chemical suppliers.

2.2. Preparation of Compounds

The raw clays and other ingredients were incorporated into NR using a two-roll mill at ambient temperature, as described by Gnoumou et al. [5]. Table 1 presents the compound formulations, expressed in parts per hundred rubber (phr). The resulting compounds were subsequently vulcanized at 175 °C in a standard mould measuring 190 mm × 130 mm × 2 mm.
The loading range of 30 to 70 phr was selected to cover a broad spectrum of concentrations, thereby enabling the clear identification of property optima and the decline in performance beyond a certain threshold (attributable to dilution and agglomeration phenomena). The extension to 70 phr, which exceeds typical industrial loadings (<50 phr), was essential for capturing these trends, which remained undetectable in our previous study conducted at a single loading of 50 phr. Loadings below 30 phr were deliberately excluded, as they would not be economically viable for replacing a conventional filler in an industrial context.

2.3. Characterisations

Particle size parameters were determined using a CILAS PSA 1090 LD laser particle size analyser (Compagnie Industrielle des Lasers, Orleans, France) operating in liquid mode. The specific surface area of the KLE, SIT, and REF powders was measured using a Micromeritics TriStar II Plus analyser (Micromeritics Instrument Corporation, Norcross, GA, USA).
The Cation Exchange Capacity (CEC) of the three clay samples was determined according to the method described by Metson [18] and Ciesielski et al. [19], following the ISO NF X31-130 standard [20]. The samples were saturated with ammonium ions (NH4+) through successive percolations of a 1 mol L−1 ammonium acetate solution (CH3CO2NH4). The buffering capacity of this solution maintained the pH of the medium at approximately 7, which constitutes one of the principal features of the method. After removal of excess ammonium ions by ethanol percolation, the adsorbed NH4+ ions were displaced using a 1 mol L−1 sodium chloride solution. The released ammonium ions were subsequently quantified by UV–Vis spectroscopy, and the resulting concentrations were expressed in meq/100 g or cmol+/kg [18,19].
The determination of the specific surface area is based on the adsorption of a gas with known molecular dimensions and packing characteristics onto the surface of the sample. Nitrogen is commonly employed because it exhibits negligible specific interactions during adsorption [21]. The specific surface area is then calculated using the BET (Brunauer–Emmett–Teller) model based on the quantity of adsorbed gas, the molecular dimensions of the adsorbate, and its packing arrangement [22].
The oxide composition was determined by inductively coupled plasma atomic emission spectrometry (ICP–AES) (PerkinElmer, Inc., Waltham, MA, USA). The KLE and SIT samples were first ground to a particle size below 80 μm, whereas the REF powder was analysed as received. The powders were then fused with lithium metaborate (LiBO2) to form glass beads, which were dissolved in an acid mixture containing hydrofluoric acid (HF), nitric acid (HNO3), and hydrochloric acid (HCl). The loss on ignition (LOI) was determined after calcination at 1000 °C.
X-ray diffraction (XRD) analyses of the clays and composites were performed using a Bruker D8 Advance diffractometer (Bruker AXS GmbH, Karlsruhe (Bade-Wurtemberg), Germany) equipped with a SOL-X detector and a copper X-ray source (Cu Kα radiation). The operating conditions were 40 kV and 30 mA. To identify potentially expansive clay minerals, including smectites, chlorites, and vermiculites, XRD analyses were performed on oriented clay-fraction preparations. Soil samples were dispersed in demineralised water and subjected to gravitational sedimentation to isolate the fine fraction enriched in clay minerals. The collected fraction was deposited as a thin layer on glass slides, and the procedure was repeated several times to obtain deposits of sufficient thickness for reliable XRD analysis. The oriented specimens were analysed under three conditions: (i) air-dried, (ii) heated at 550 °C for 1 h to destroy thermally unstable expandable minerals, and (iii) saturated with ethylene glycol, which induces expansion of the clay layers and produces characteristic shifts in diffraction peaks. Interpretation of the diffractograms obtained under these conditions, using ASTM reference cards, enabled the accurate identification and discrimination of the clay phases present.
Simultaneous differential scanning calorimetry and thermogravimetric analyses (DSC–TGA) were performed on pre-ground clay samples using a Netzsch STA 449 F3 Jupiter thermal analyser (NETZSCH-Gerätebau GmbH, branche NETZSCH Analyzing & Testing, Selb (Bavière), Germany).
Fourier transform infrared (FTIR) spectra of the raw clays and vulcanizates were recorded using a PerkinElmer Frontier spectrometer (PerkinElmer, Inc., Waltham, MA, USA) over the wavenumber range of 4000–600 cm−1.
The morphology of the composite surfaces was examined using a JEOL JSM-6380LV scanning electron microscope (SEM) (JEOL Ltd., Akishima (Tokyo), Japan) equipped with an energy-dispersive X-ray spectroscopy (EDS) system.
Vulcanization characteristics, including the scorch time (ts2) and optimum cure time (tc90), were determined using a GOTECH MDR-3000 (Gotech Testing Machines Inc., Taichung, Taiwan) moving die rheometer in accordance with ISO 6502-3 [23]. Measurements were performed at a frequency of 1.67 Hz, an oscillation amplitude of 0.5°, a pressure of 0.35 MPa, and a temperature of 175 °C.
Mechanical properties were evaluated using a Zwick/Roell Z050 universal testing machine (ZwickRoell GmbH & Co. KG, Ulm (Bade-Wurtemberg), Germany). Tensile strength and tear resistance were measured directly, while elongation was monitored using an extensometer. The modulus at 300% elongation, tensile strength, and elongation at break were determined according to ISO 37 [24]. Tear strength was calculated as the average of five measurements performed in accordance with ISO 34-1. Shore A hardness (Hildebrand Prüf- und Messtechnik GmbH, Oberboihingen, Germany) was measured on 6 mm-thick specimens following ISO 48-4 [25].

3. Results and Discussion

3.1. Characterisation of Clayey Raw Materials

3.1.1. Mineralogical and Chemical Properties of Clayey Raw Materials

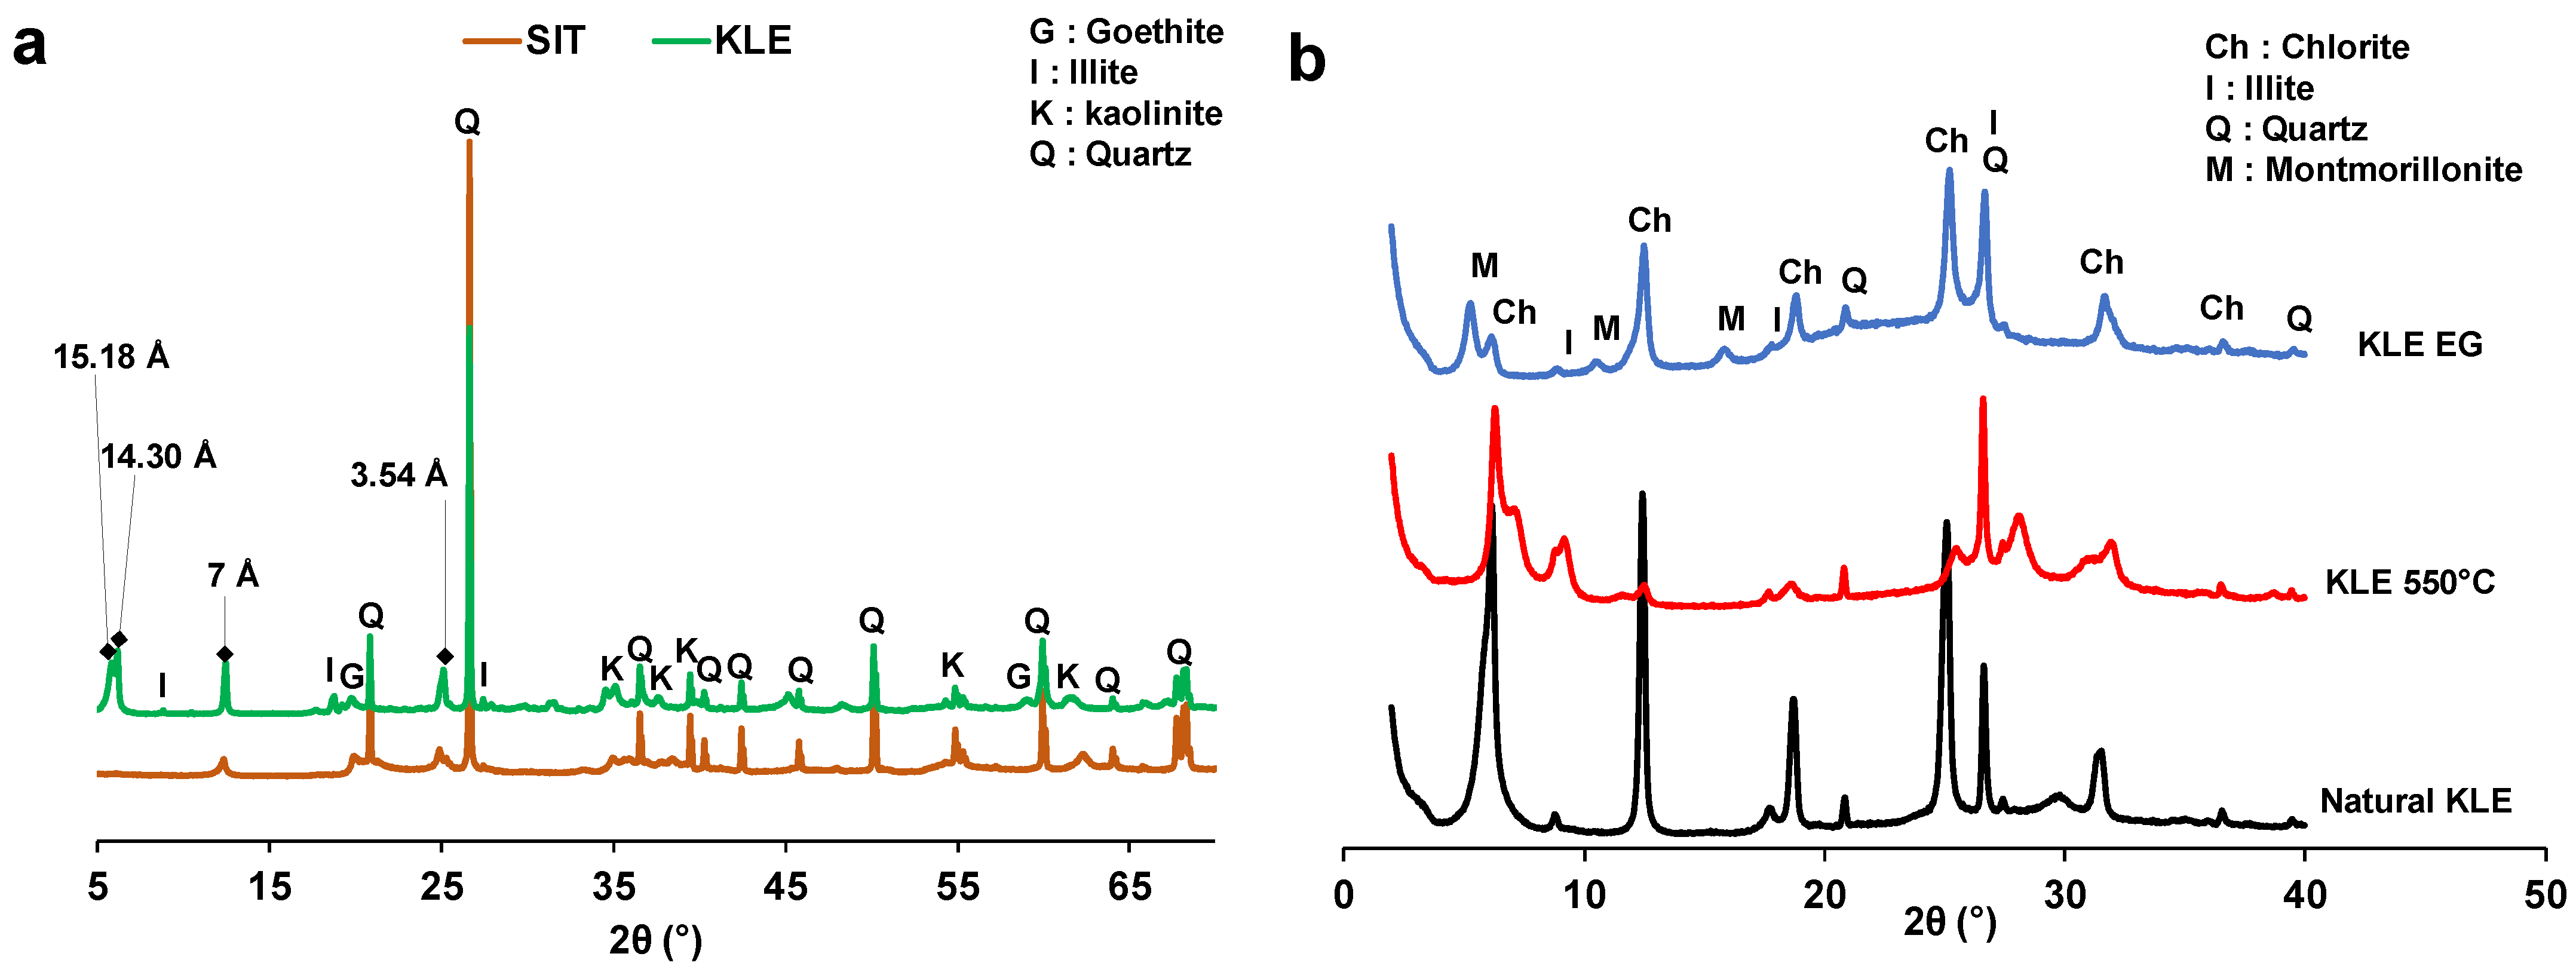
Comparative analysis of the X-ray diffractograms of the raw clay materials SIT and KLE, presented in Figure 1a, with those of the REF sample previously reported by [5] highlights significant mineralogical differences. Whereas the REF diffractograms indicate an assemblage of kaolinite (Al2Si2O5(OH)4), quartz (SiO2) and illite (KAl2(AlSi3)O10(OH)2) [5], the SIT sample is distinguished by a more intense quartz diffraction peak at 3.35 Å, suggesting a predominance of this mineral phase. In contrast, the characteristic kaolinite reflections, notably at 7.17 Å and 3.58 Å, appear considerably less intense in SIT than in REF [5], indicating a lower degree of crystallinity and/or a reduced content of this phyllosilicate. The KLE sample shares the presence of illite with REF, in contrast to SIT, where this mineral is not detected.
A detailed examination of the diffractogram presented in Figure 1b reveals low-intensity reflections at low diffraction angles, corresponding to large interplanar spacings, in the KLE sample. These reflections suggest the presence of swelling clay minerals. To identify these phases more precisely, the mineralogy of the clay fraction was further investigated using the oriented aggregate technique. The X-ray diffraction patterns of the oriented KLE samples subjected to different treatments are presented in Figure 1b. The interpretation focused on the evolution of the first four diffraction peaks (from left to right) under each treatment condition.
In the natural KLE sample, the reflections observed at approximately 14 Å and 7 Å correspond to the (001) and (002) planes of smectites, chlorites, or vermiculites [26]. The peaks near 10 Å and 5 Å indicate the presence of illite [26,27]. Furthermore, ethylene glycol treatment shifted the basal reflection from 15.2 Å to 16.7 Å, thereby confirming the presence of an expandable smectite phase. Heating the KLE sample at 550 °C resulted in a reduction in the intensity of the 14 Å and 7 Å reflections, accompanied by broadening of the 10 Å peak. However, the incomplete disappearance of these peaks suggests the presence of chlorite ((Mg,Fe)6(Si,Al)4O10(OH)8). Consequently, the XRD analysis of oriented preparations demonstrates that the KLE sample consists of illite, chlorite, and smectite.
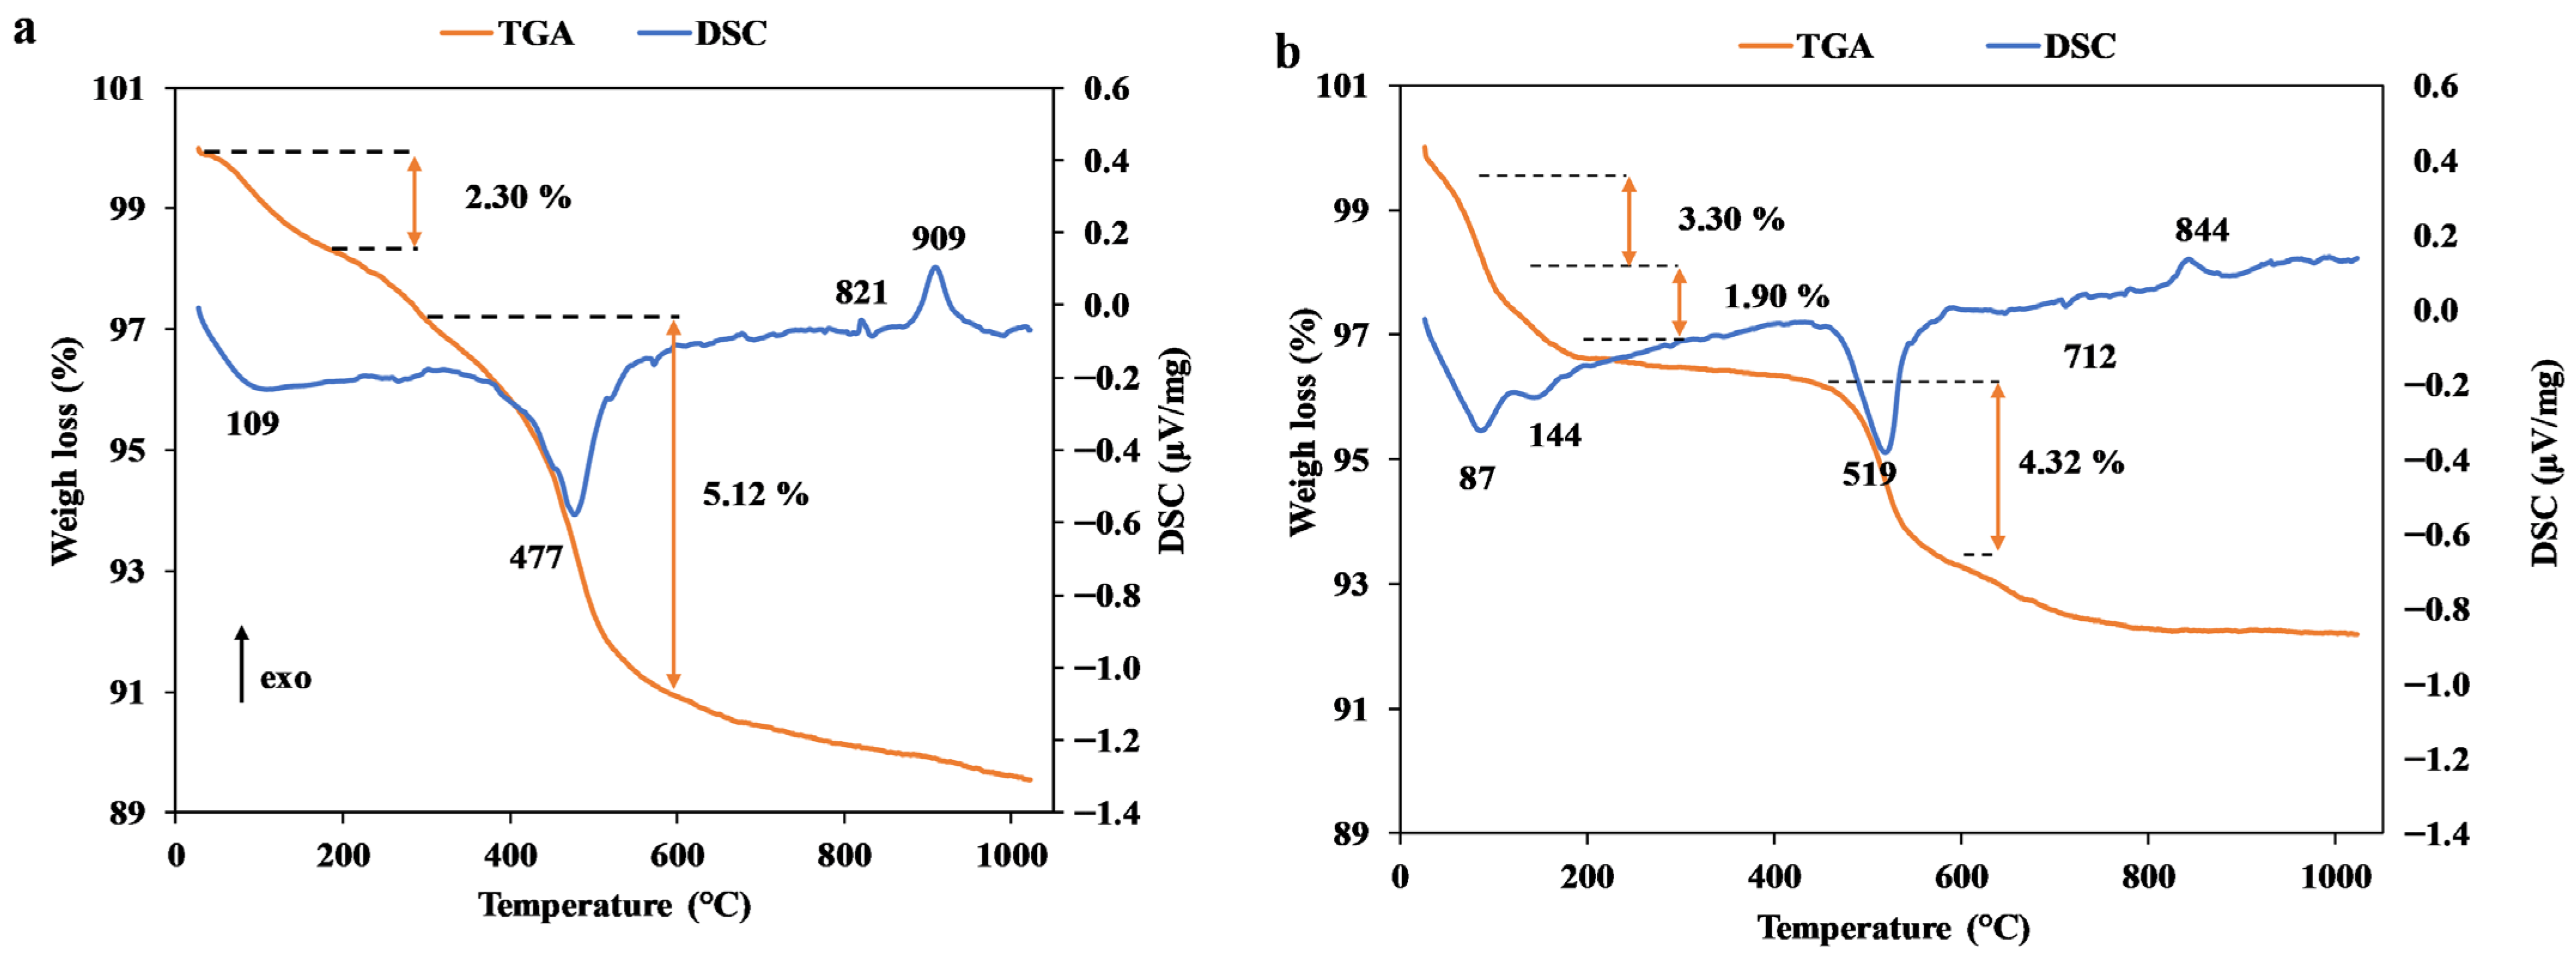
To complement the mineralogical characterisation, the raw clay samples were analysed by simultaneous differential scanning calorimetry and thermogravimetric analysis (DSC–TGA). The corresponding thermograms are presented in Figure 2.
The DSC–TGA curve of SIT (Figure 2a) displays endothermic and exothermic events within temperature ranges similar to those previously reported for the DIE clay in earlier work [5]. The broad endothermic peaks centred at 109 °C and 253 °C are respectively attributed to the release of hygroscopic water and the dehydroxylation of goethite. The endothermic peak at 477 °C corresponds to the dehydroxylation of kaolinite. A single exothermic event occurring between 900 and 1000 °C is associated with the recrystallisation or structural reorganisation of metakaolinite into spinel and amorphous silica phases [27]. REF [5] and SIT display similar thermal behaviour, thereby corroborating the qualitative XRD results, albeit with markedly different intensities. REF [5] exhibits a greater mass loss of 8.78 wt% at around 500 °C, attributed to the dehydroxylation of kaolinite and illite, whereas SIT shows a mass loss of only 5.12 wt%. This difference indicates a higher clay mineral content in REF. Furthermore, well-ordered kaolinite typically dehydroxylates at temperatures close to 600 °C, whereas poorly ordered kaolinite dehydroxylates at lower temperatures [28]. These observations suggest that the REF clay could offer superior reinforcement when used as a filler in NR composites. Yvon et al. [29] demonstrated that the crystallinity, and consequently the particle size distribution, of clay minerals, particularly kaolinite, significantly influences the properties of vulcanisates. Their study showed that highly crystalline clay fillers consistently improve composite performance.
The thermogram of KLE (Figure 2b) is characterized by a two-stage dehydration process. Two endothermic peaks observed at 87 °C and 144 °C, accompanied by mass losses of 3.30 wt% and 1.90 wt%, respectively, are characteristic of smectitic minerals [28]. The thermal event near 275 °C corresponds to the dehydroxylation of goethite.
The third and most significant mass loss, occurring at 519 °C (4.32 wt%), is associated with the dehydroxylation of structural hydroxyl groups. This temperature range (450–550 °C) is characteristic of dioctahedral smectites, particularly montmorillonite, thereby confirming the identity of the swelling phase previously detected by XRD [30,31,32]. Additionally, a weak endothermic event at 712 °C is observed on the DSC curve without a corresponding mass loss on the TGA curve, indicating only trace amounts of chlorite. Finally, the exothermic peak located near 844 °C is attributed to the decomposition of chlorite into MgO and SiO2 and the crystallization of amorphous phases [33].
Taken together, the DSC–TGA results confirm that the smectite phase corresponds to montmorillonite (Ca0.15(Al,Mg)2Si4O10(OH)2·nH2O) and corroborate the mineralogical assemblage identified by XRD, namely montmorillonite, illite, and chlorite.
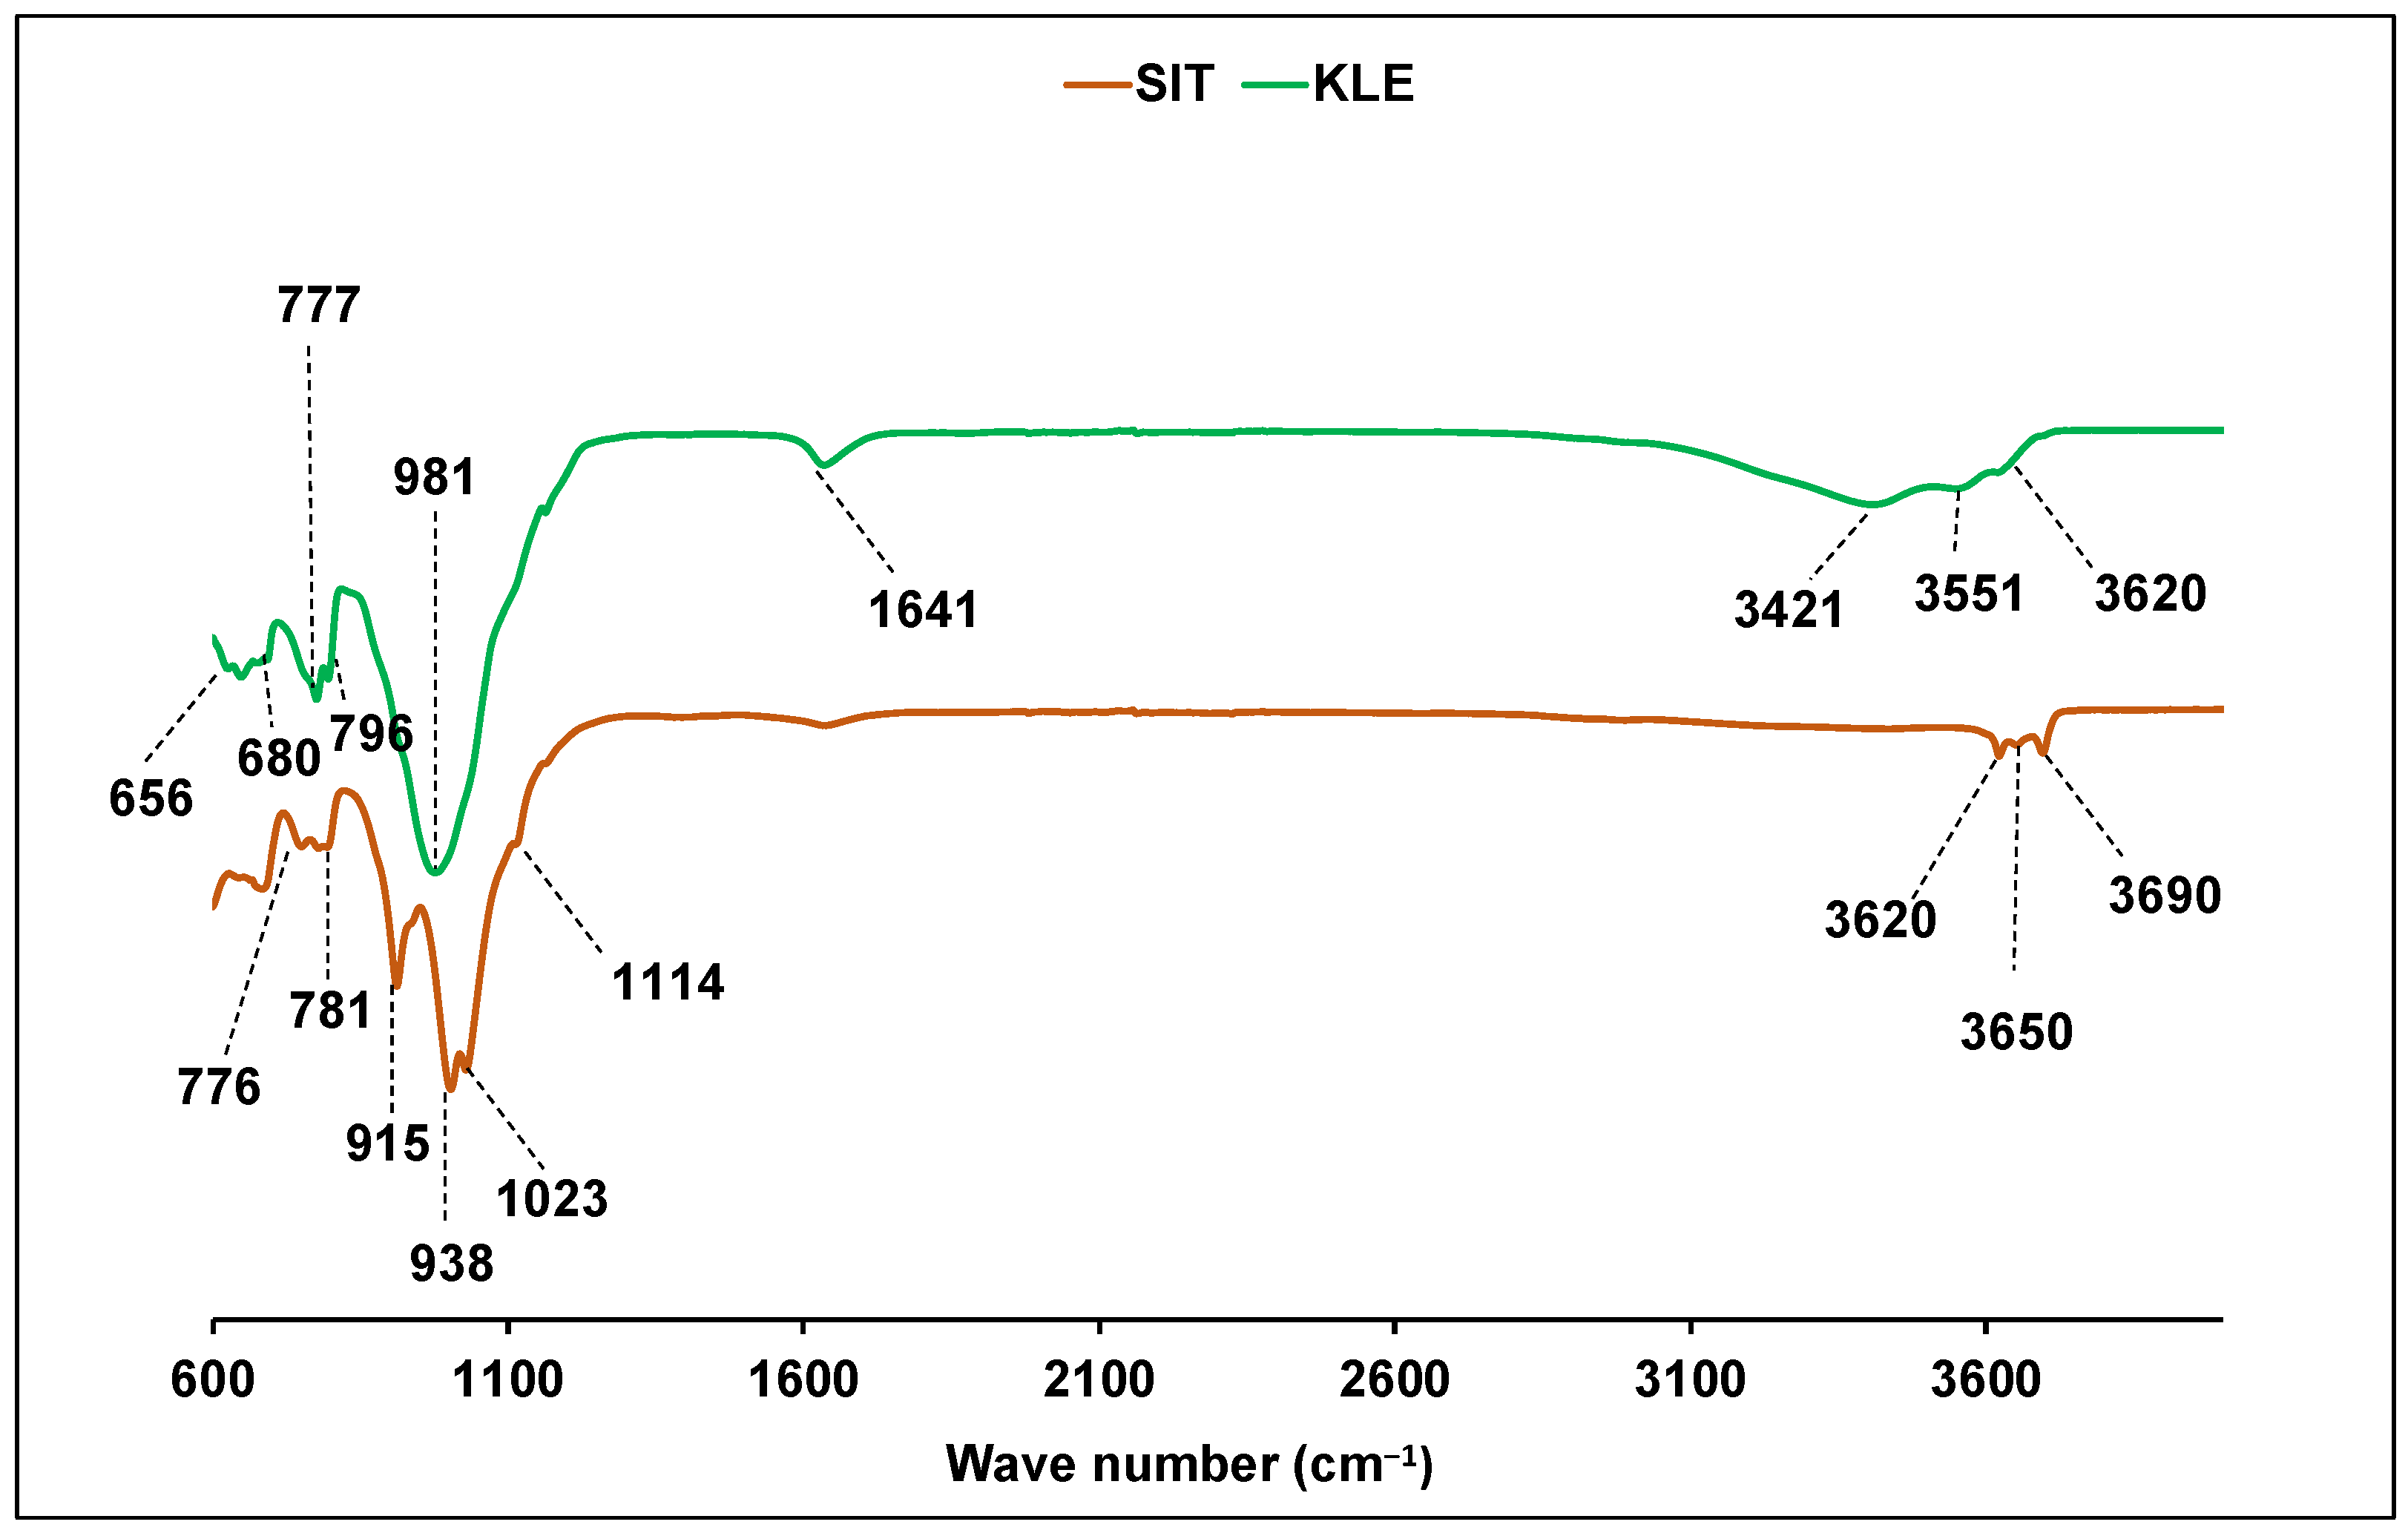
The FTIR spectrum of SIT (Figure 3) exhibit absorption bands at approximately 776 and 781 cm−1, characteristic of kaolinite-group minerals and assigned to OH vibrational modes on the clay surface [34]. Bands observed near 908 and 938 cm−1 correspond to Al–OH vibrations, with the former attributed to internal hydroxyl groups and the latter to surface hydroxyls [35]. Additional bands located at approximately 1009, 1023, and 1114 cm−1 are assigned to Si–O stretching vibrations [36].
In the high-frequency region, the spectrum of SIT display three distinct bands near 3690, 3650, and 3620 cm−1, which are characteristic of kaolinite and correspond to Al2OH stretching vibrations. The intense band at 3620 cm−1 is associated with internal hydroxyl groups located in the median plane of 1:1 phyllosilicates [37,38]. In contrast to REF [5], the kaolinite within the SIT exhibits structural disorder, as evidenced by the absence of the 3670 cm−1 band [39].
The FTIR spectrum of KLE is characterized by three absorption bands centred at 3620, 3551, and 3421 cm−1. The first band, of relatively low intensity, is attributed to AlMgOH stretching vibrations associated with chlorite and/or montmorillonite [40]. The band at 3551 cm−1 corresponds to FeFeOH and FeMgOH stretching vibrations in chlorite [41]. The substitution of iron by magnesium in iron-rich clay minerals generally shifts the Mg3OH stretching vibration toward lower frequencies [42]. The broad band centred at 3421 cm−1, assigned to OH stretching vibrations of adsorbed water molecules, confirms the presence of montmorillonite. The band at 1641 cm−1 is attributed to the bending vibration of water molecules [43].
In the low-frequency region, the spectrum exhibits characteristic quartz bands at 981, 796, and 777 cm−1. A weak deformation band at 680 cm−1, attributed to Mg3OH vibrations, indicates the presence of trioctahedral structural units [44]. The low intensity of this band results from the generally greater intensity of dioctahedral bands, meaning that the relative peak intensities are not directly proportional to the abundance of the corresponding structural units [44]. Finally, a weak absorption band at 656 cm−1, associated with Mg–O vibrations within octahedral sheets, is observed [29,45].
The chemical compositions of the three raw clay materials are presented in Table 2.
Chemical analysis indicates that the raw clays are predominantly composed of silica (SiO2) and alumina (Al2O3). Consistent with previously reported data [5], the REF sample is characterised by a high Al2O3 content (35.7 wt%) and a lower K2O concentration. In contrast, the newly investigated KLE and SIT samples exhibit significantly higher iron oxide contents, reaching 11.4 wt% and 7.1 wt%, respectively. Furthermore, KLE is distinguished by appreciable amounts of magnesia (MgO, 7.2 wt%) and calcium oxide (CaO, 1.4 wt%). These compositional profiles are in excellent agreement with the mineralogical phases identified via XRD.

3.1.2. The Physical Properties of Clayey Raw Materials

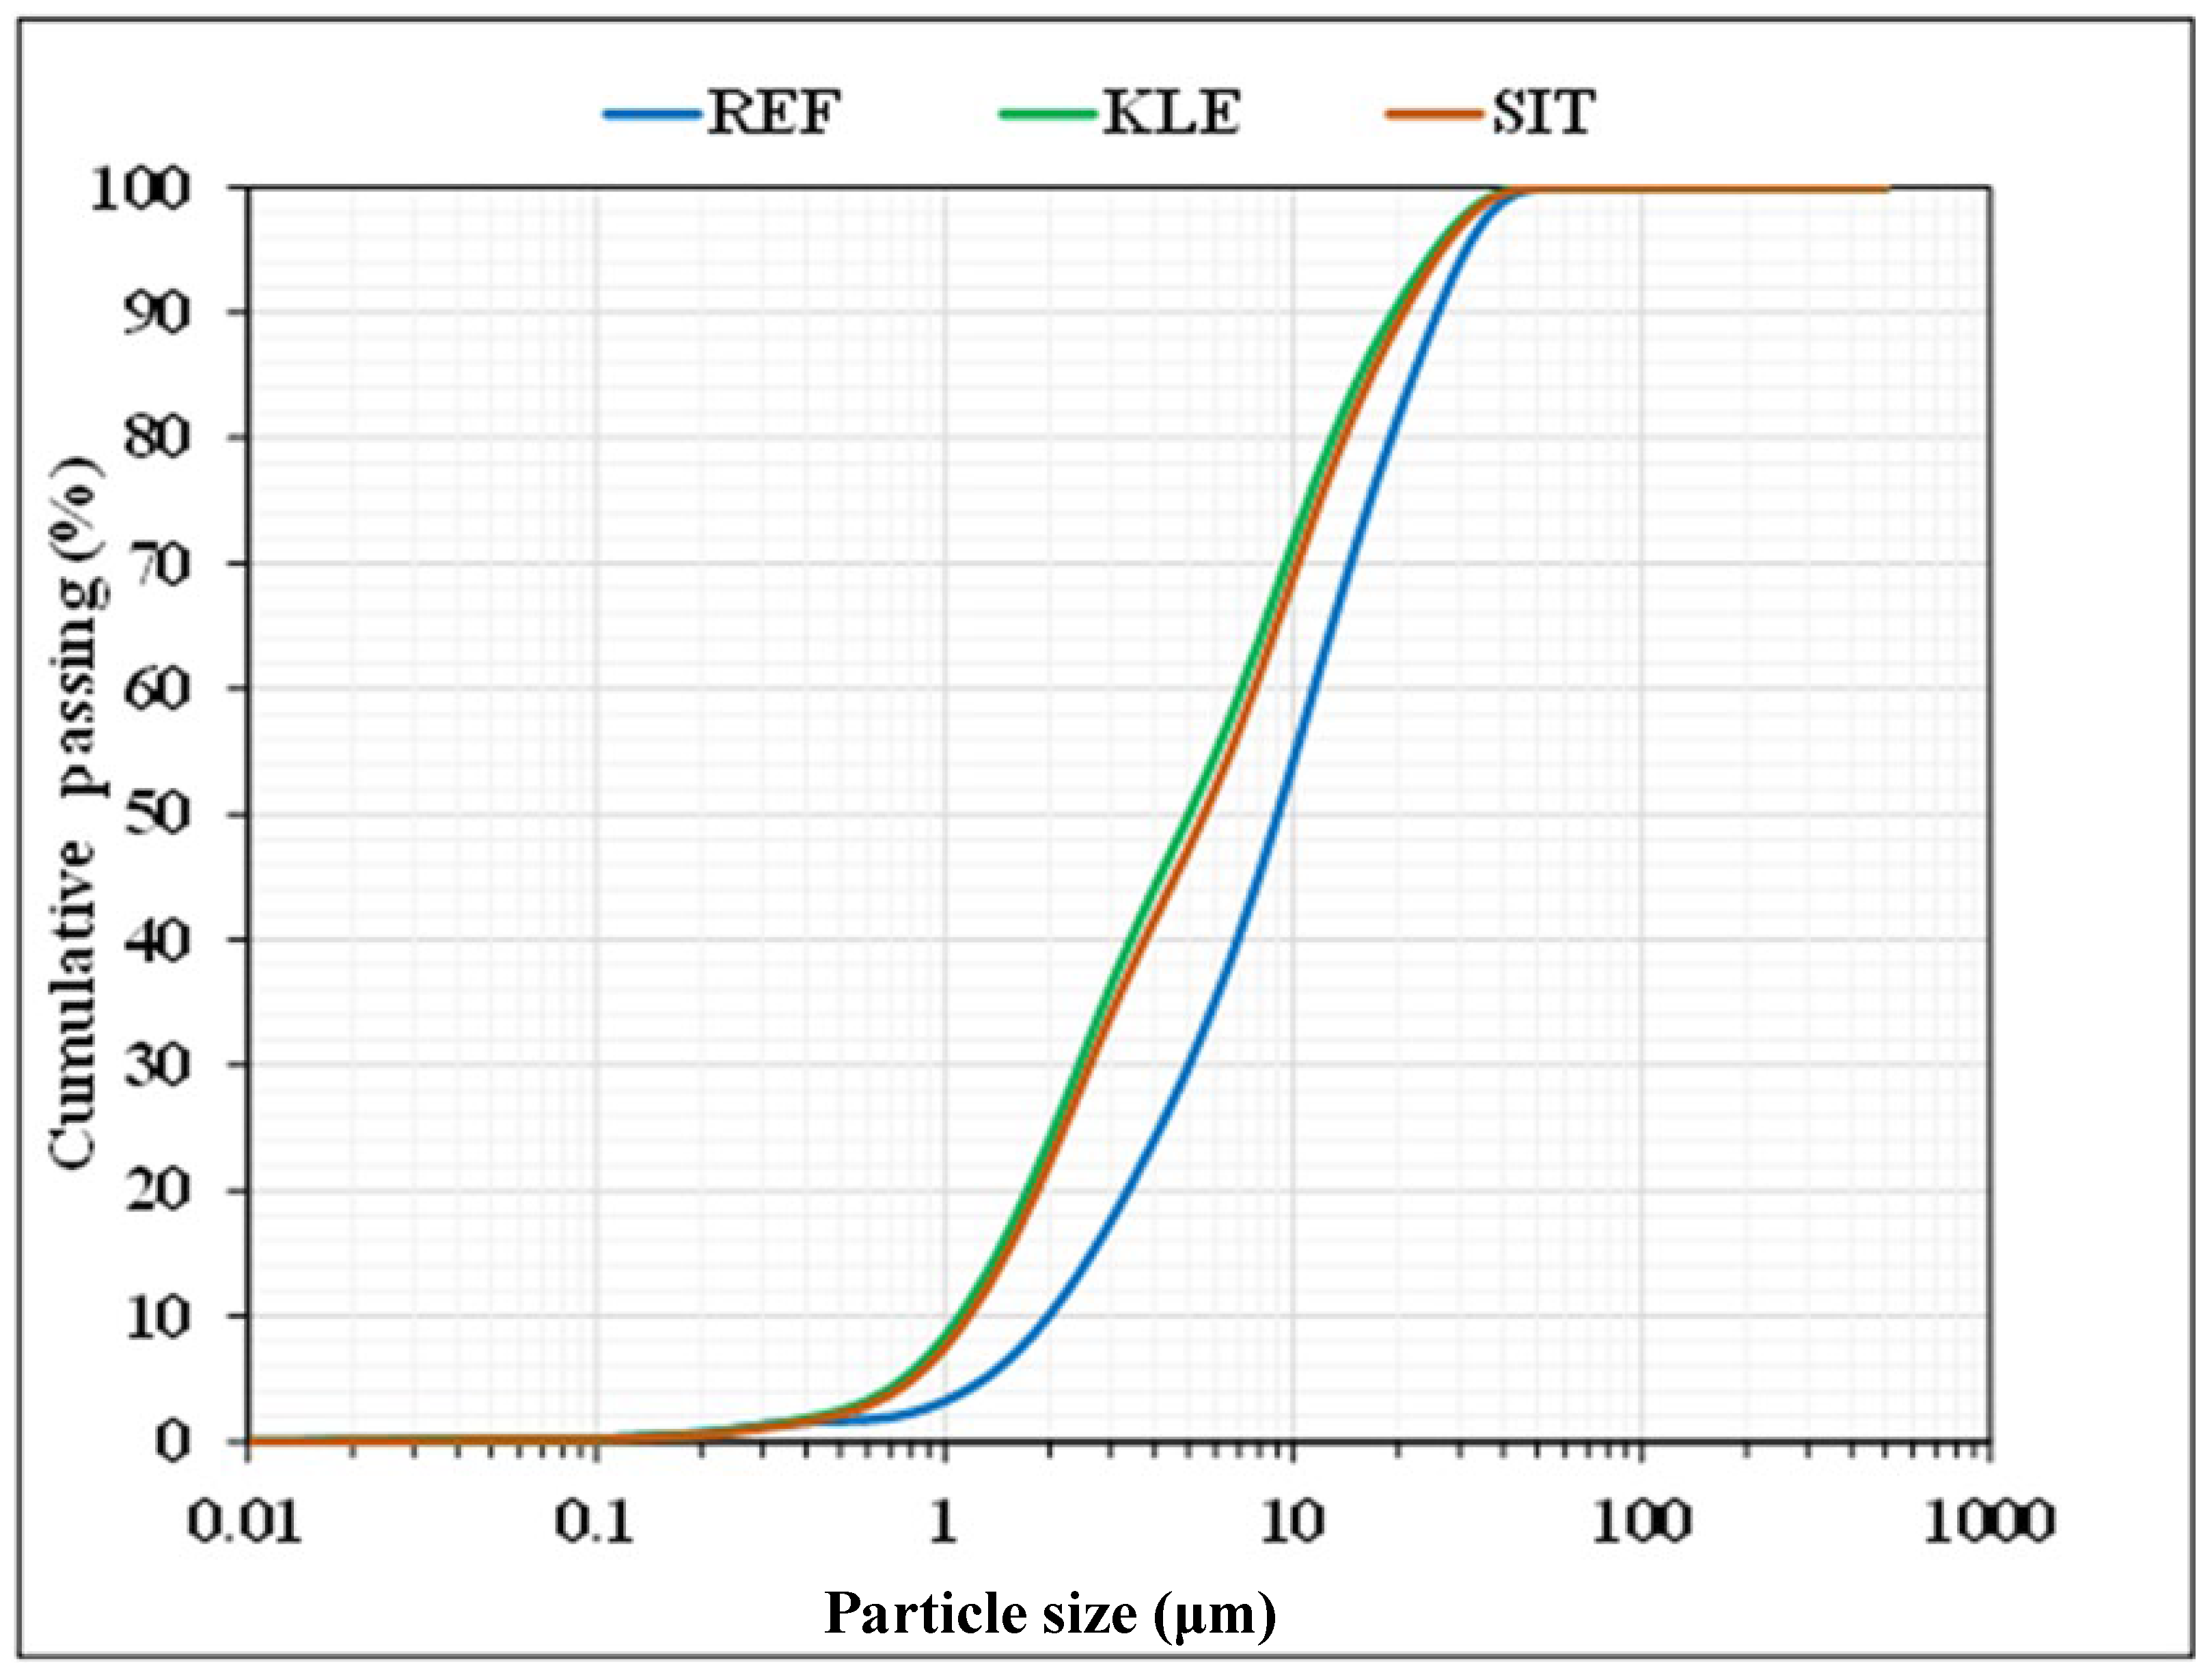
The particle size distribution of the clayey materials is shown in Figure 4.
The particle size distributions are generally similar among the different raw clay materials. However, KLE clay (D50 = 4 μm) is slightly finer than REF and SIT, which exhibit D50 values of 9 μm and 7 μm, respectively. The samples consist predominantly of fine silt (65–72 wt%), accompanied by clay-sized particles (10–28 wt%) and coarse silt (7–18 wt%). These results indicate that the raw materials are predominantly silty, although they contain appreciable amounts of clay minerals.
The specific surface area (BET) and cation exchange capacity (CEC) of the raw clay materials were also determined, and the corresponding results are presented in Table 3.
The specific surface area of REF was determined to be 16 m2/g, which is consistent with values typically reported for kaolinite-rich materials [46]. In contrast, SIT exhibits a significantly higher specific surface area (41.0 m2/g) than those generally associated with kaolinitic clays [47]. Chemical analysis revealed that SIT contains a relatively high iron oxide content (7.1 wt%), which may contribute to its elevated specific surface area [48,49]. The KLE clay exhibits a specific surface area of 26 m2/g, which is comparatively low for a swelling clay dominated by smectitic minerals. This behaviour may be attributed to the coexistence of illite and chlorite, which possess lower specific surface areas than pure smectites.
With regard to the cation exchange capacity (CEC), REF (19.3 meq/100 g) and SIT (21.0 meq/100 g) exhibit relatively high values for kaolinitic clays. These results support the presence of illite within these materials, as suggested by the XRD analysis [50,51]. The KLE sample shows a considerably higher CEC (36.8 meq/100 g), which is characteristic of smectitic clay minerals. Nevertheless, this value remains lower than those typically reported for pure smectites [52], indicating that the smectite phase occurs together with non-expanding minerals such as illite and chlorite.

3.2. Characterisation of Compounds

3.2.1. Compound Structures

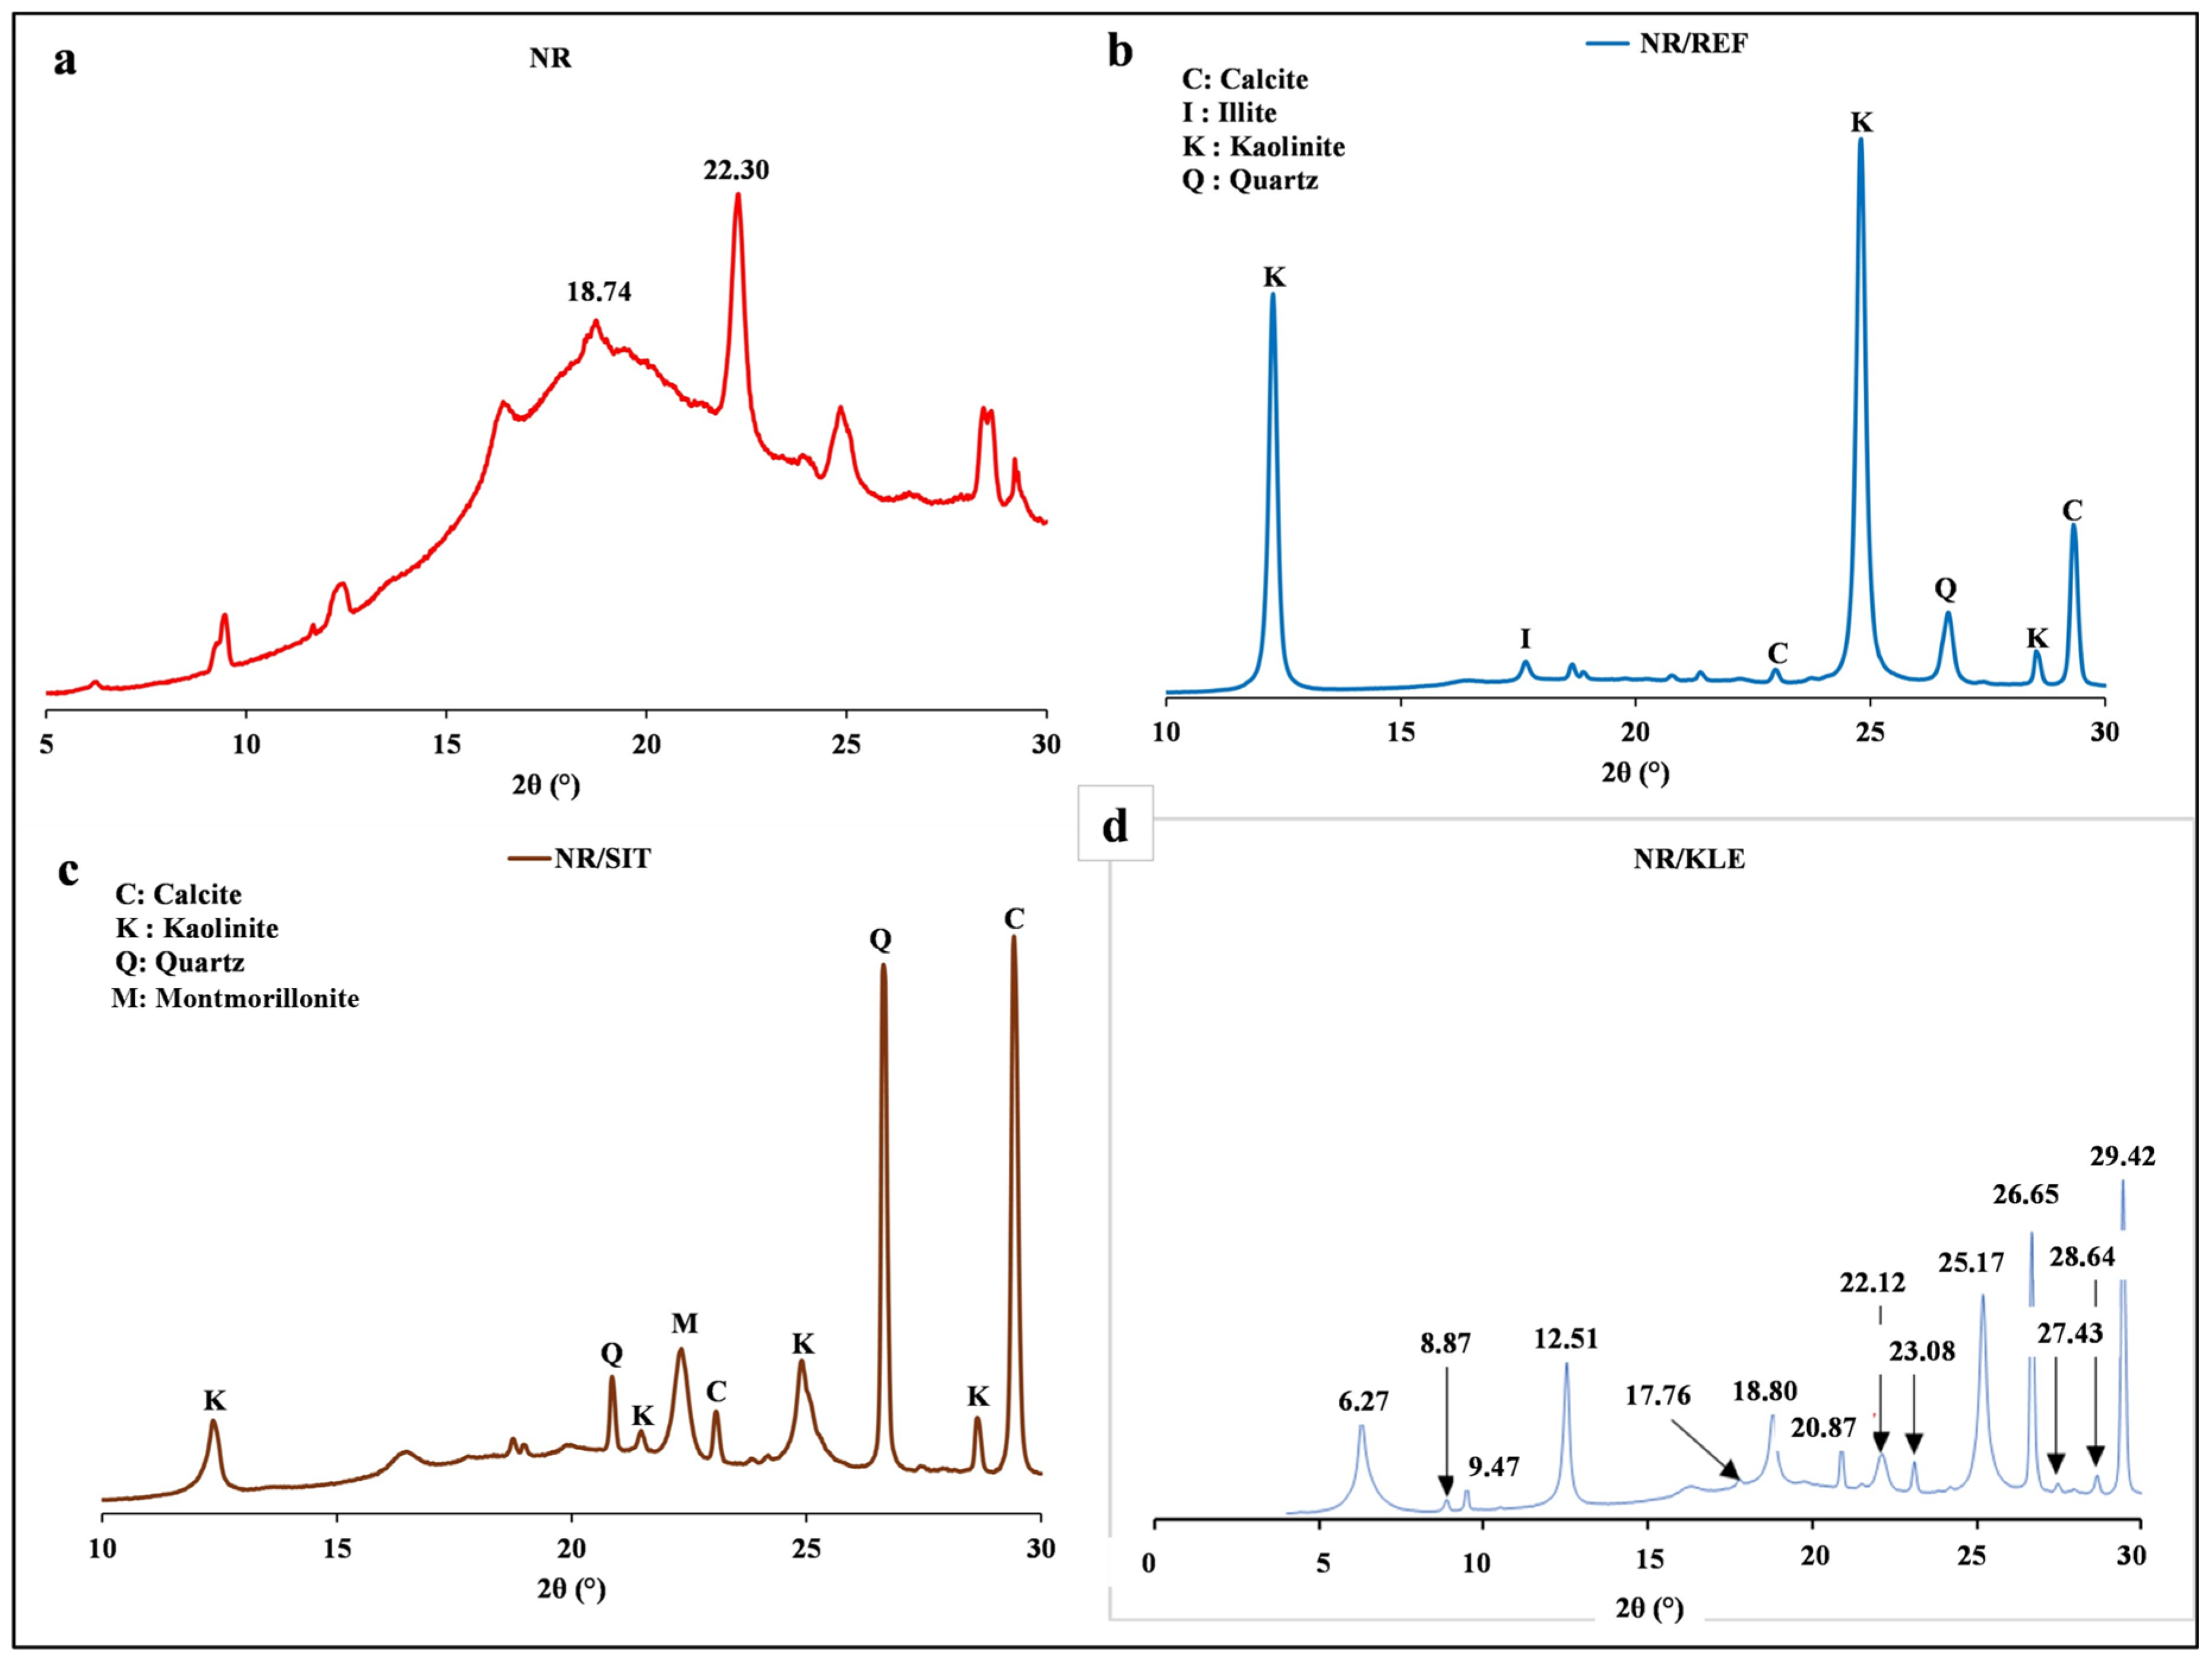
The structural analysis of the NR–clay composites was performed using X-ray diffraction (XRD) in order to evaluate the dispersion state of the clay particles within the polymer matrix. The diffractograms of unfilled NR (Figure 5a) and the NR/REF composite (Figure 5b) were used as reference materials [5], while the diffraction patterns of the NR/KLE and NR/SIT composites are presented in Figure 5c and Figure 5d, respectively.
The X-ray diffractogram of the unfilled NR compound is characteristic of an amorphous polymer, exhibiting a broad halo centred at approximately 2θ = 18.74° [53]. The absence of sharp and well-defined reflections confirms the predominantly amorphous nature of the rubber matrix. The diffractogram of the NR/KLE composite exhibits distinct reflections at 2θ = 6.27°, 12.51°, 18.80°, and 25.17°, which are characteristic of chlorite. Additional reflections corresponding to illite (2θ = 8.87°, 17.76°, and 28.64°), calcite originating from chalk (2θ = 23.08° and 29.42°), and quartz (2θ = 20.87° and 26.65°) were also identified. No characteristic reflections attributable to montmorillonite were detected. This absence is likely due to the overlap or masking of the basal reflections of montmorillonite by the more intense chlorite peaks.
Importantly, the positions of the characteristic clay mineral reflections within the NR matrix remained unchanged relative to those of the corresponding raw clays. This observation indicates that no intercalation of NR chains into the interlayer galleries of the clay minerals occurred. The hydrophilic nature of smectites is inherently incompatible with the hydrophobic NR chains, thereby hindering the formation of intercalated or exfoliated structures during processing [54]. The incorporation of KLE clay resulted in a reduction in the intensity of the broad amorphous halo of NR, suggesting an increase in the overall crystallinity of the composite [12]. Similarly, the NR/SIT composite exhibited diffraction reflections characteristic of kaolinite. The basal spacing associated with the (001) reflection of kaolinite remained unchanged after incorporation into the rubber matrix. Since polymer intercalation is generally characterized by an increase in basal spacing, whereas exfoliation is indicated by the disappearance of the corresponding diffraction peak [5,55], the observed behaviour demonstrates that neither intercalation nor exfoliation occurred. This observation is consistent with previous findings reported in the literature [5]. These results indicate that the polymer chains are not confined within the kaolinite interlayers but instead occupy the interparticle spaces, resulting in a physical dispersion of the clay particles within the NR matrix [10]. The calcite reflections observed in the various composites originate from the addition of chalk during the formulation of the inner tube compounds.
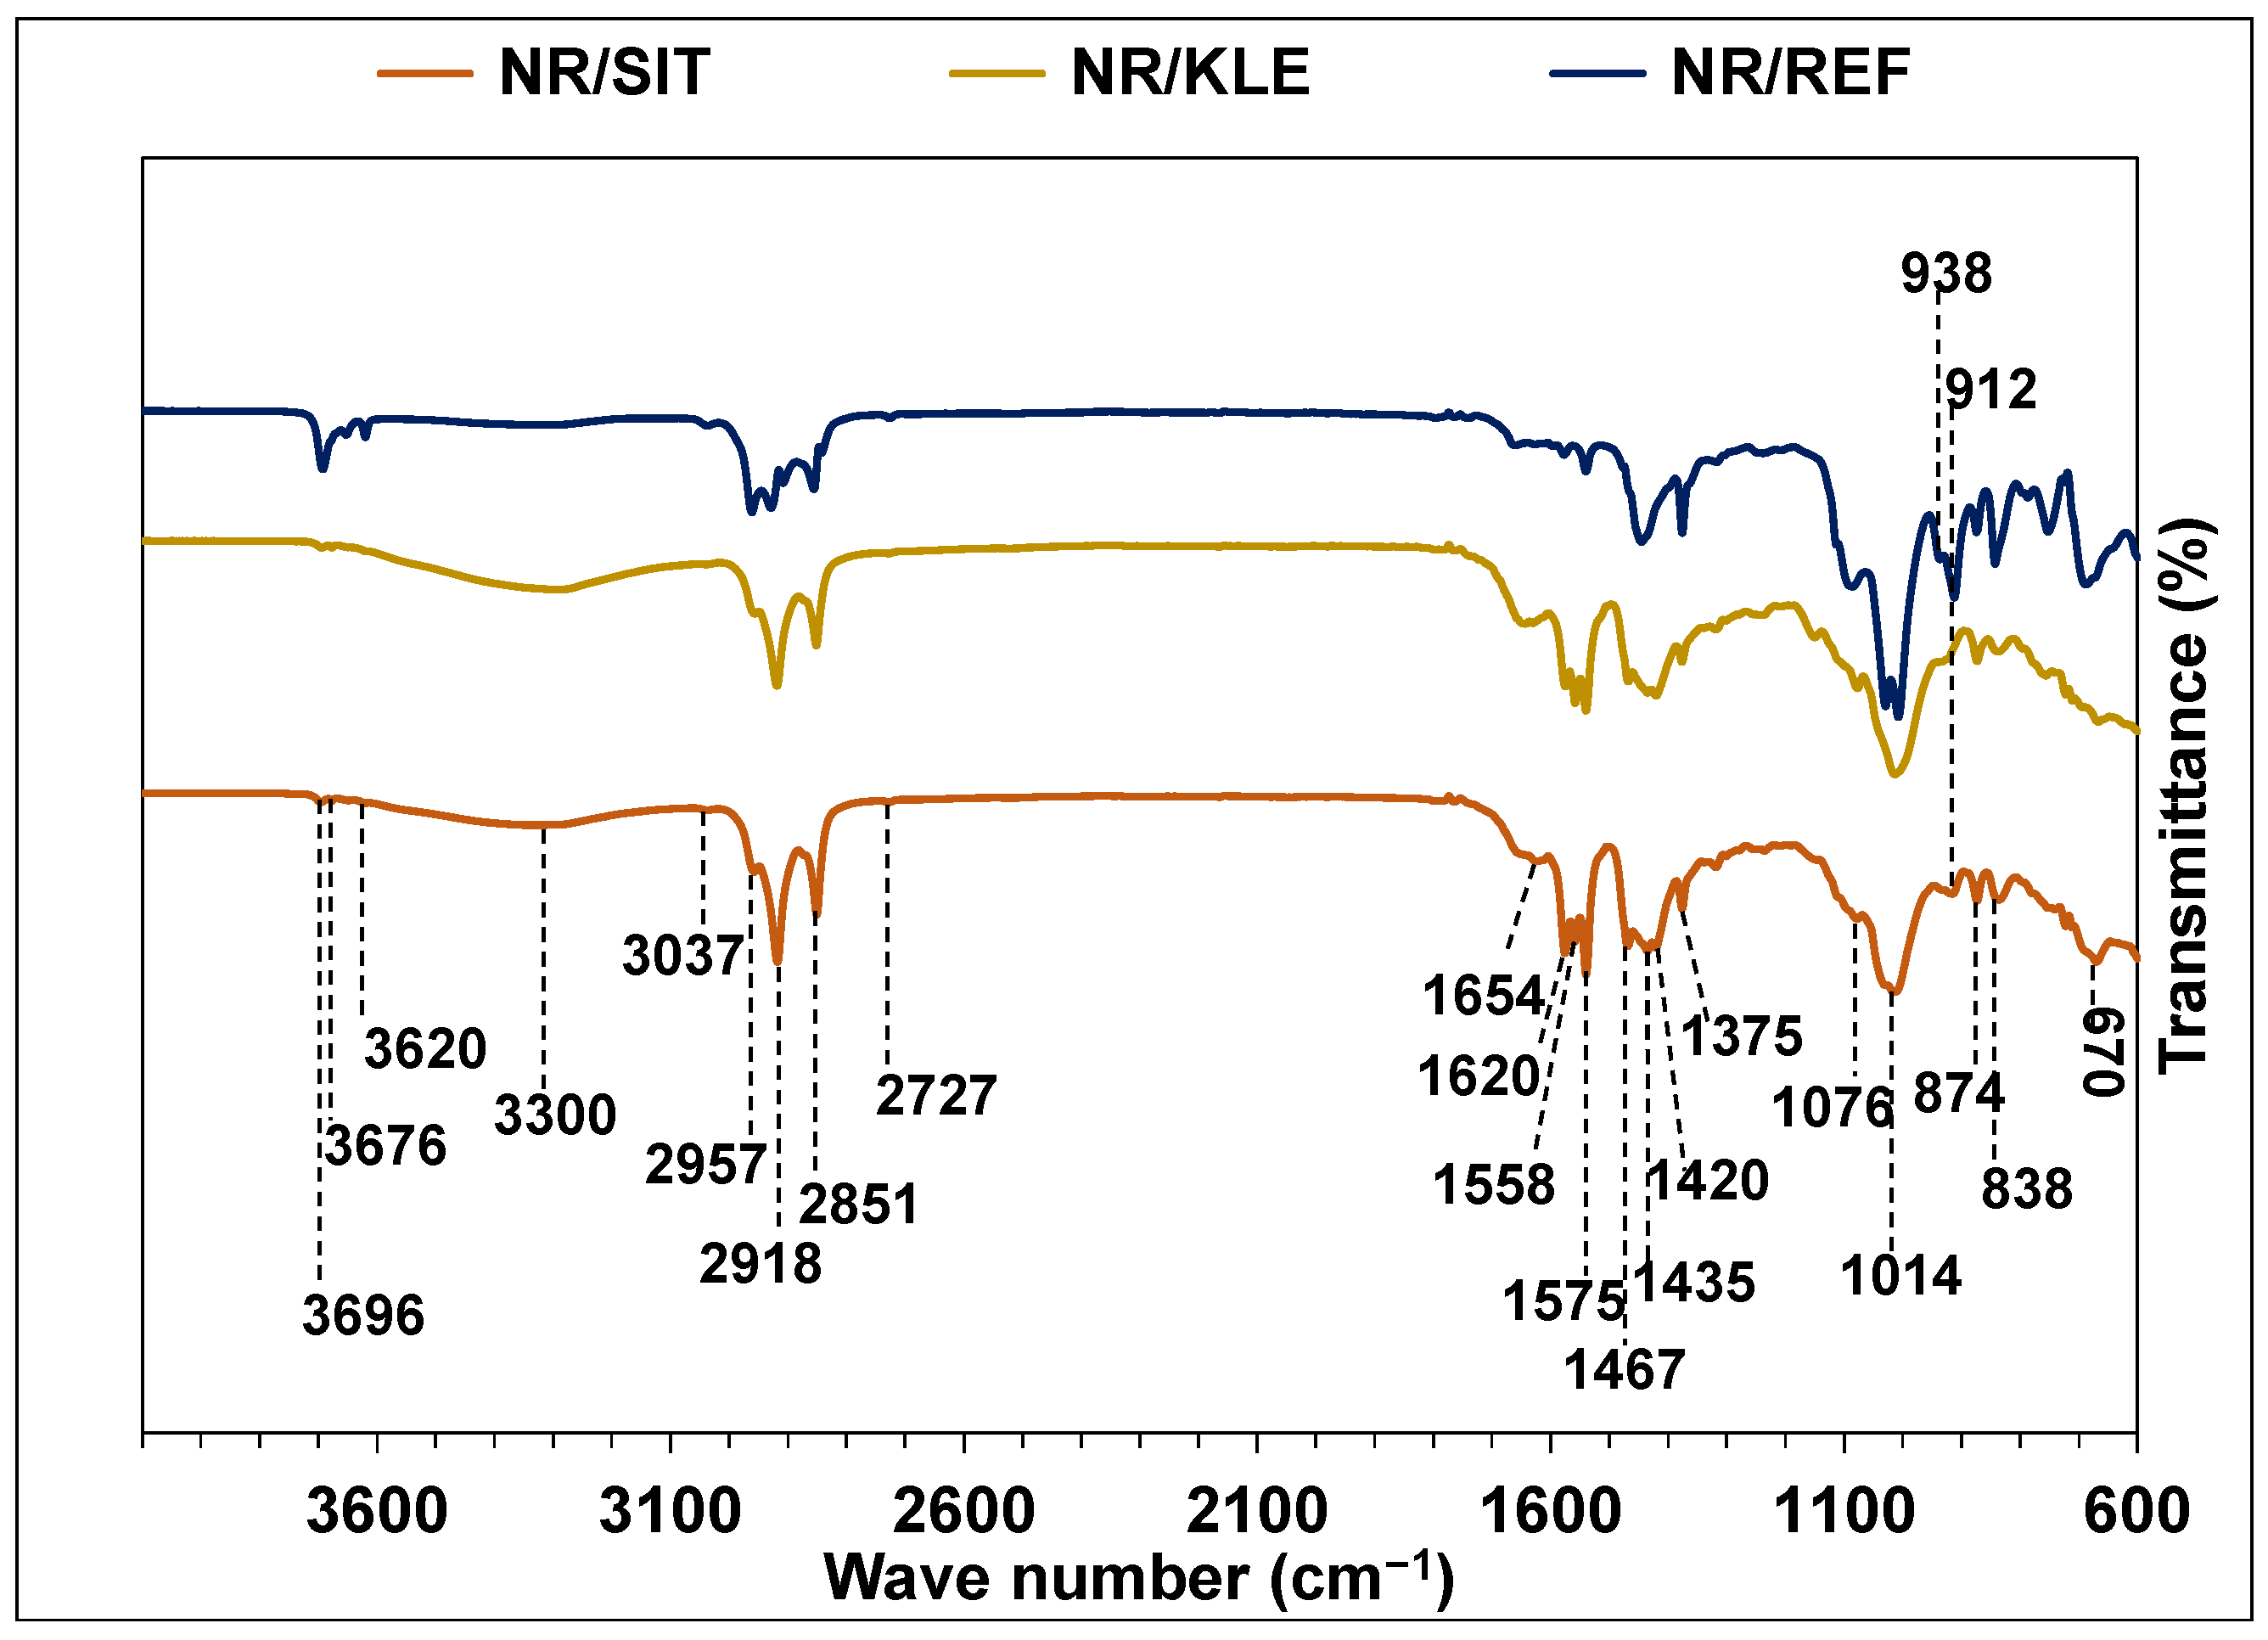
The FTIR spectra of the NR–clay composites are presented in Figure 6. Absorption bands in the 3700–3600 cm−1 region are attributed to the structural hydroxyl groups of kaolinite in the NR/SIT composite and smectite in the NR/KLE composite. The intensity of these bands is considerably reduced compared with those observed in the corresponding pure clay samples (SIT and KLE).
A broad absorption band centred at approximately 3300 cm−1, assigned to O–H stretching vibrations (ν(O–H)) [56], is observed in both the NR/SIT and NR/KLE spectra. This band is more intense in the NR/KLE composite and is attributed to intra- and intermolecular hydrogen bonding [57]. A moderately intense peak located at 3037 cm−1 in the spectra of unfilled NR and the NR/REF composite corresponds to the asymmetric ν(=C–H) stretching vibration of the NR matrix [5,58]. This band becomes less distinct and decreases in intensity in the NR/SIT and NR/KLE composites and is no longer detectable in the NR/KLE spectrum.
Strong absorption bands within the 3000–2700 cm−1 region are attributed to C–H stretching vibrations (ν(CH)) of methyl (CH3) and methylene (CH2) groups. The absorption peak at 2961 cm−1 exhibits lower intensity in all clay-filled composites compared with unfilled NR. In the NR/REF composite, the absorption band initially observed at approximately 2915 cm−1 in NR splits into two components located at 2928 and 2906 cm−1. Similarly, the band at 2852 cm−1 in unfilled NR is resolved into two peaks at 2854 and 2841 cm−1 in the NR/REF spectrum. Such spectral modifications are not observed in the NR/SIT and NR/KLE composites, where the bands near 2918 and 2852 cm−1 remain more intense than those of unfilled NR.
The vibration band at 1662 cm−1, corresponding to the ν(C=C) stretching mode of NR, remains visible in the NR/REF spectrum, although with reduced intensity. In contrast, the NR/SIT and NR/KLE composites exhibit two distinct shoulders centred near 1654 and 1620 cm−1. The presence of water within the composites is evidenced by hydroxyl deformation bands. High-intensity bands are observed at 1575, 1558, and 1540 cm−1 in the NR/SIT and NR/KLE spectra, whereas the NR/REF composite exhibits bands at 1579 and 1540 cm−1. Since these absorption bands are absent in unfilled NR, the associated water molecules are inferred to originate from the clay minerals. Furthermore, the sharper and more intense O–H deformation bands observed in the NR/SIT and NR/KLE composites, compared with NR/REF, indicate a higher surface density of hydroxyl groups in the SIT and KLE clays [59].
In the NR/SIT and NR/KLE spectra, three absorption bands located at 1467, 1435, and 1420 cm−1, assigned to CH2 deformation vibrations, are observed instead of the single band at 1446 cm−1 detected in the NR/REF composite. The CH3 deformation band at 1375 cm−1 also undergoes modification: it remains moderately intense in the NR/REF composite but decreases in intensity in the NR/SIT and NR/KLE systems.
The presence of quartz is indicated by Si–O stretching vibrations at 1076 and 1014 cm−1 in the NR/clay composites, although the intensities of these bands are considerably lower than those observed in the pure clay spectra. An absorption band at 838 cm−1, present in the spectra of NR, NR/SIT, and NR/KLE, is assigned to the out-of-plane deformation of the =C–H bond in cis-1,4-isoprene units.
Overall, the various spectral modifications observed in the composites indicate the existence of interfacial interactions between the clay minerals and the polymer chains. However, the absence of significant shifts in the characteristic mineral bands suggests that these interactions remain predominantly physical rather than resulting from strong chemical bonding. Furthermore, the persistence of the characteristic mineral absorption bands corroborates the mineralogical information obtained from the XRD analysis.

3.2.2. Microstructure of the Compounds

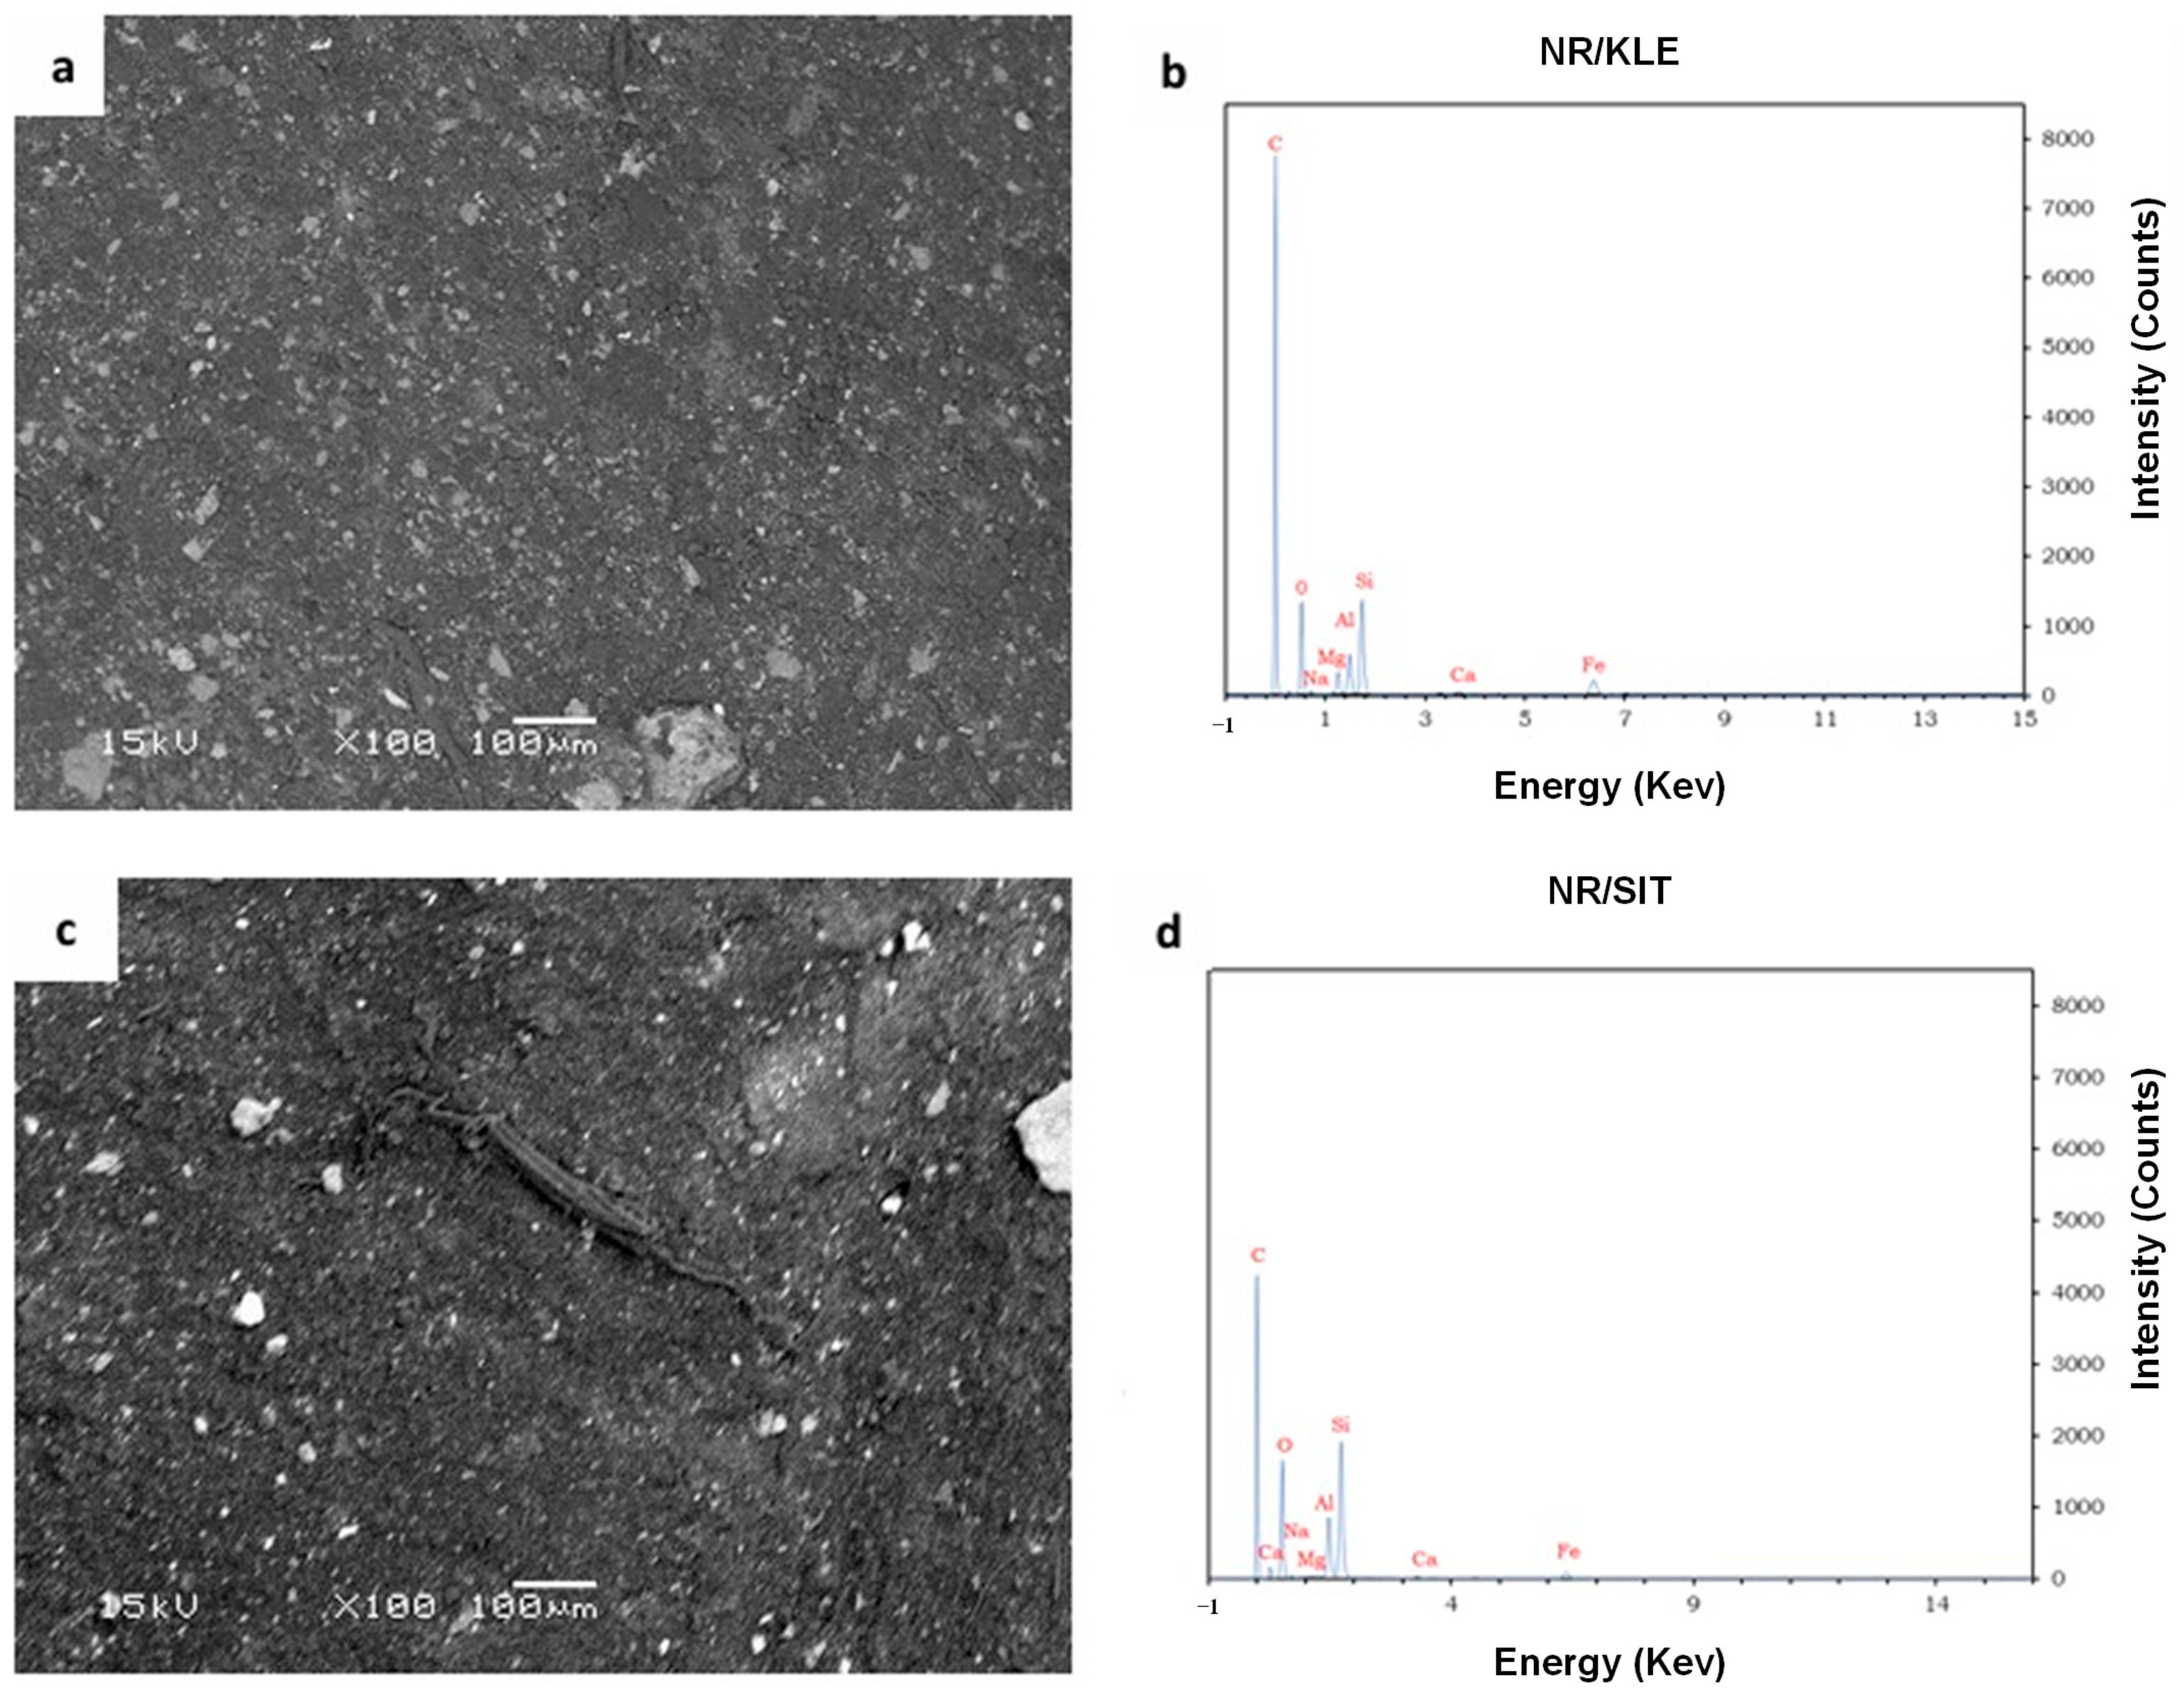
Scanning Electron Microscopy (SEM) micrographs of the NR/KLE and NR/SIT composites are presented in Figure 7a and Figure 7c, respectively. The NR/KLE composite (Figure 7b) exhibits a rough and heterogeneous fracture surface characterized by particle agglomerates and clusters associated with quartz, together with larger particles that are likely attributable to the smectitic component of the filler.
In contrast, the NR/SIT composite (Figure 7c) displays a considerably smoother and more homogeneous morphology than the NR/KLE system, although quartz-rich aggregates were identified by EDS analysis (Figure 7d). Compared with the NR/REF composite, the NR/KLE material exhibits evidence of non-uniform filler dispersion and cavitation phenomena, which may result from the incompatibility between the hydrophilic smectitic clay and the non-polar NR matrix [5]. This observation agrees with the findings of Dai and Huang, who reported that the dispersion of swelling clay minerals in non-polar rubbers such as NR is significantly poorer than that of kaolinitic clays [60].
The principal difference between the NR/SIT and NR/REF composites is the presence of coarse quartz particles on the surface of the former. Overall, these observations indicate that the REF clay exhibits superior dispersion within the NR matrix compared with both KLE and SIT. The improved dispersion of REF is expected to promote more efficient stress transfer between the filler and the polymer matrix, thereby contributing to the enhanced mechanical properties observed for the corresponding composites.

3.3. Physical and Mechanical Properties of the NR Compounds

3.3.1. Influence of Filler Loading on Vulcanisation Parameters

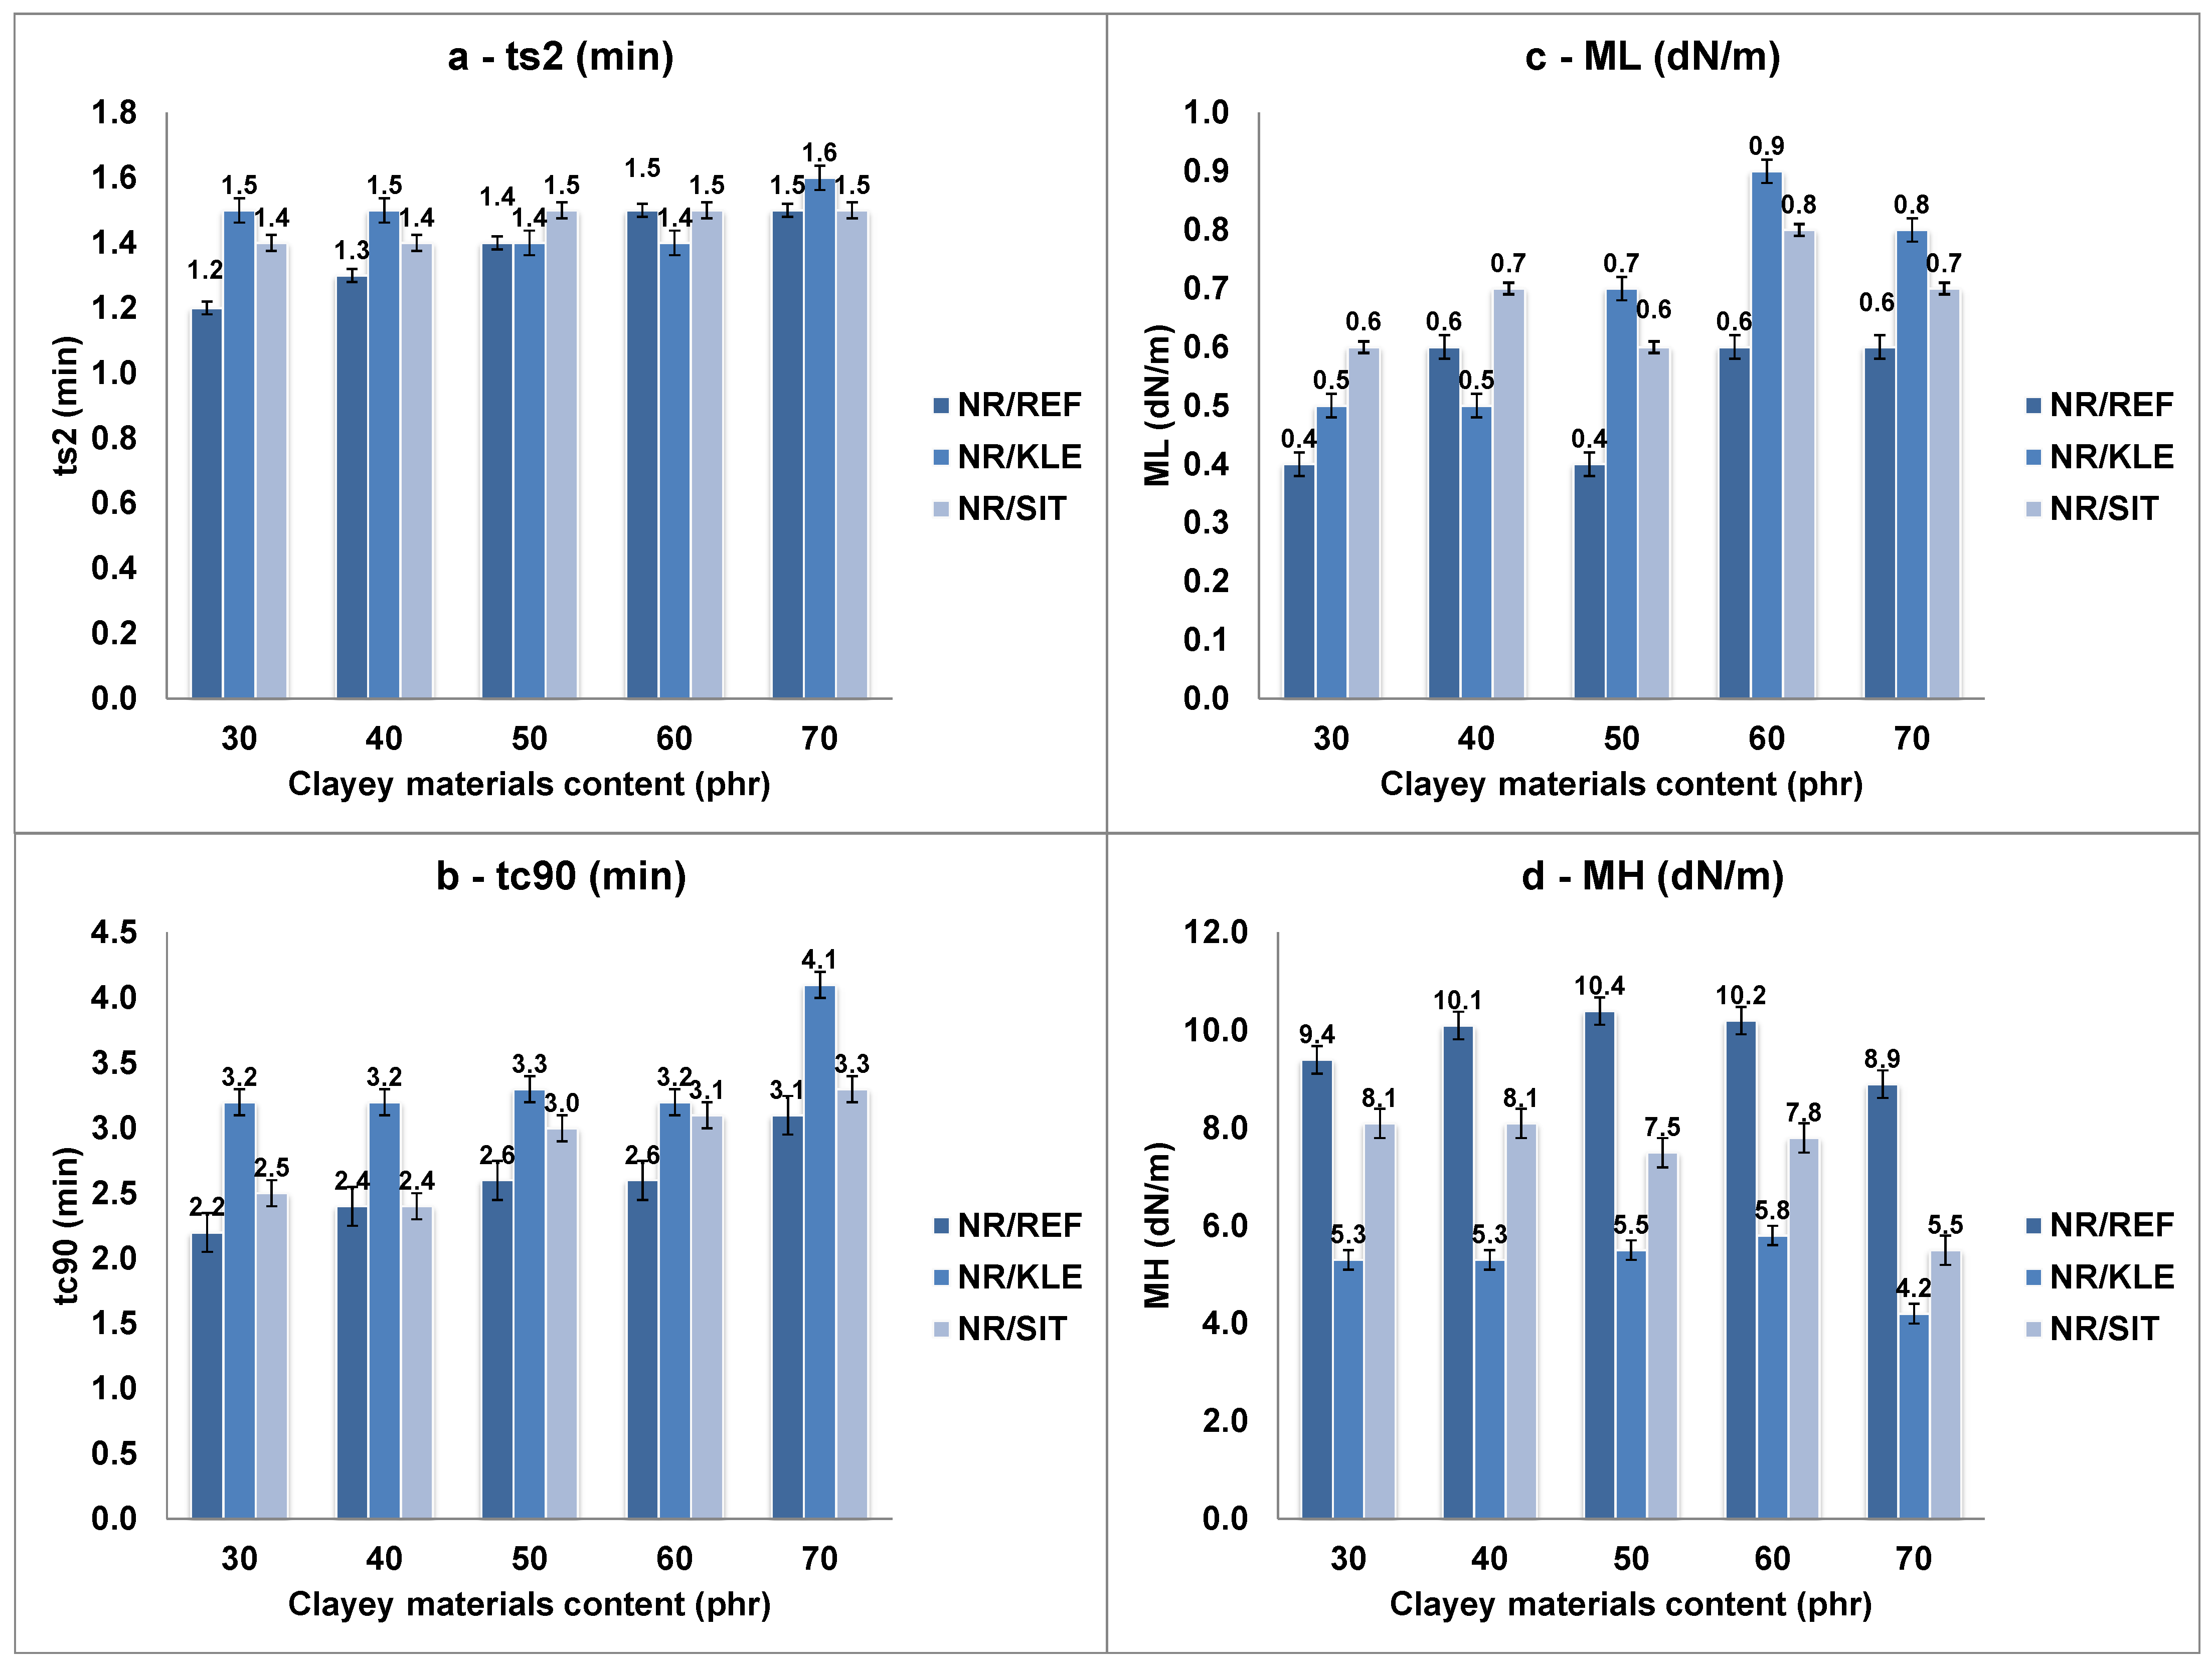
Figure 8a,b illustrate the variation in curing times of the different compounds as a function of filler loading, expressed in parts per hundred rubber (phr).
An increase in the clay content within the NR matrix results in an increase in both the scorch time (ts2) and the optimum vulcanisation time (tc90). This behaviour is attributed to interactions between the hydroxyl (OH) groups present on the clay surfaces and the components of the vulcanisation system, particularly zinc oxide and stearic acid [61]. Such interactions, which lead to longer vulcanisation times, have previously been reported by Yvon et al. [29]. The ts2 and tc90 values of the NR composites filled with KLE clay are greater than those of the NR/SIT and NR/REF composites. This behaviour is attributed to the predominance of swelling minerals in KLE. It is likely that the vulcanisation accelerator (TBBS) is adsorbed onto these swelling minerals, thereby reducing its availability for the vulcanisation reaction. Similar behaviour has been reported by Sookyung et al. [62].
Figure 8c,d show the variation in the minimum and maximum torque values as a function of the loading level of the raw clay materials in NR. The minimum torque (ML) and maximum torque (MH) of the various composites increase with increasing clay loading, reach a maximum value, and subsequently decrease. The highest ML values were obtained at 40, 50, and 60 parts per hundred rubber (phr) for the NR/REF (0.60 dN·m), NR/KLE (0.93 dN·m), and NR/SIT (0.84 dN·m) composites, respectively. Furthermore, the ML values follow the order MLKLE > MLSIT > MLREF. These results are consistent with the microstructural observations. The ML value provides an indication of the state of the composite before curing, with lower values generally corresponding to improved filler dispersion within the NR matrix [10]. The results therefore suggest better dispersion of the SIT and REF clays within the NR matrix compared with KLE. This behaviour is associated with the swelling nature of KLE, which is more hydrophilic than the kaolinitic clays SIT and REF, making its incorporation into the hydrophobic NR matrix more difficult [60]. Kaolinite particles are characterized by electrically neutral surfaces and a relatively low density of hydroxyl groups. These characteristics are particularly advantageous for highly viscous rubbers such as NR, as they facilitate mixing and processing [11]. The slightly higher ML value observed for the NR/SIT composite compared with the NR/REF composite may be attributed to stronger interactions between the NR matrix and the coarse quartz particles present in SIT [11].
With regard to MH, the maximum values were obtained at 50, 60, and 30 phr for the NR/REF (10.36 dN·m), NR/KLE (5.78 dN·m), and NR/SIT (8.11 dN·m) composites, respectively. Regardless of the filler loading, the MH values of the NR/REF composites remain higher than those of the NR/KLE and NR/SIT systems. This behaviour reflects the greater stiffness and reinforcement efficiency of the NR/REF composites. In contrast, the poor compatibility between KLE and the NR matrix results in a reduced reinforcing effect.
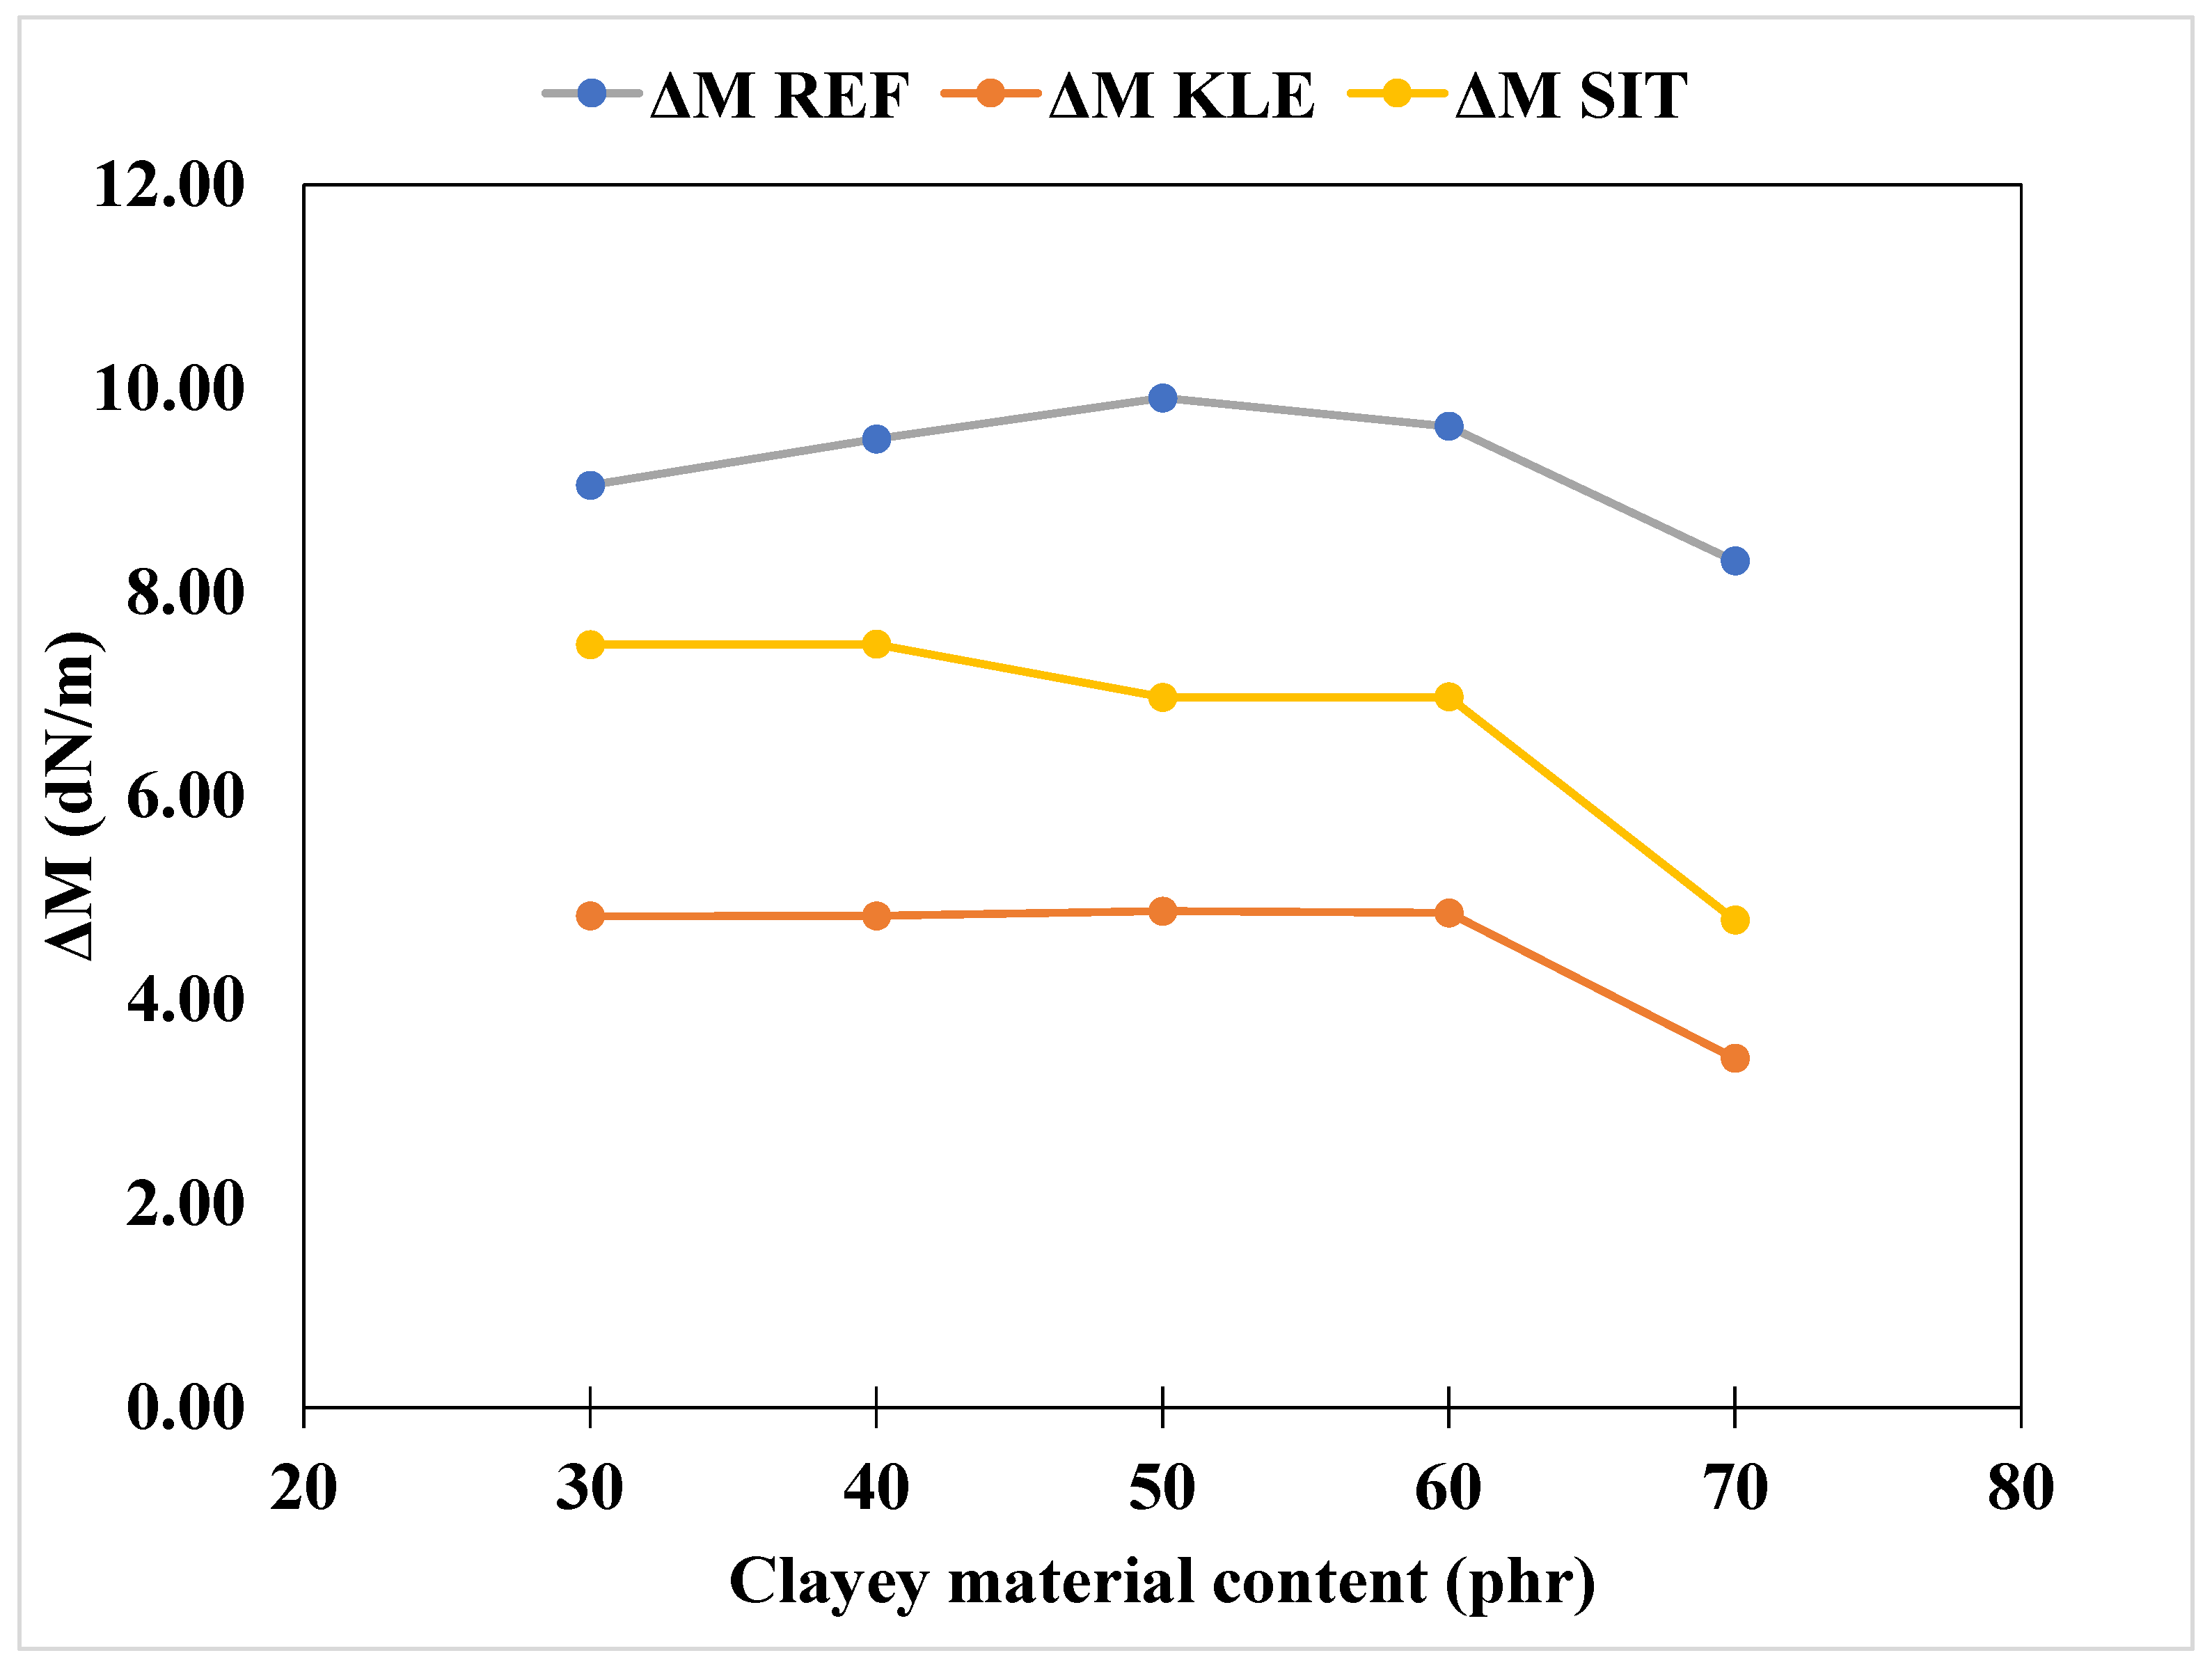
The variation in torque (ΔM) as a function of the loading level of the raw clay materials in NR is shown in Figure 9. In general, higher ΔM values indicate greater cross-link density within the vulcanisates [63]. The largest ΔM values were observed for the REF-filled composites, suggesting stronger filler–rubber interactions and a greater contribution of the filler to the development of the cross-linked network during vulcanisation.
The various rheometric results are consistent with the findings obtained from the mineralogical and microstructural analyses. These results demonstrate that the reinforcing efficiency of clay fillers in NR strongly depends on their mineralogical composition. Although kaolinitic clays are hydrophilic, their limited swelling capacity facilitates their incorporation into the hydrophobic NR matrix. In contrast, swelling clays exhibit greater hydrophilicity and consequently poorer compatibility with the rubber matrix.
This difference in behaviour is reflected by the lower minimum torque (ML) values observed for the kaolinitic clay composites (REF and SIT) compared with the swelling clay composite (KLE), indicating improved processability and filler dispersion. Furthermore, the higher maximum torque (MH) and torque variation (ΔM) values obtained for the REF and SIT composites indicate a greater reinforcing effect of these kaolinitic clays within the NR matrix.

3.3.2. Tensile Modulus at 300% Elongation as a Function of Clay Loading

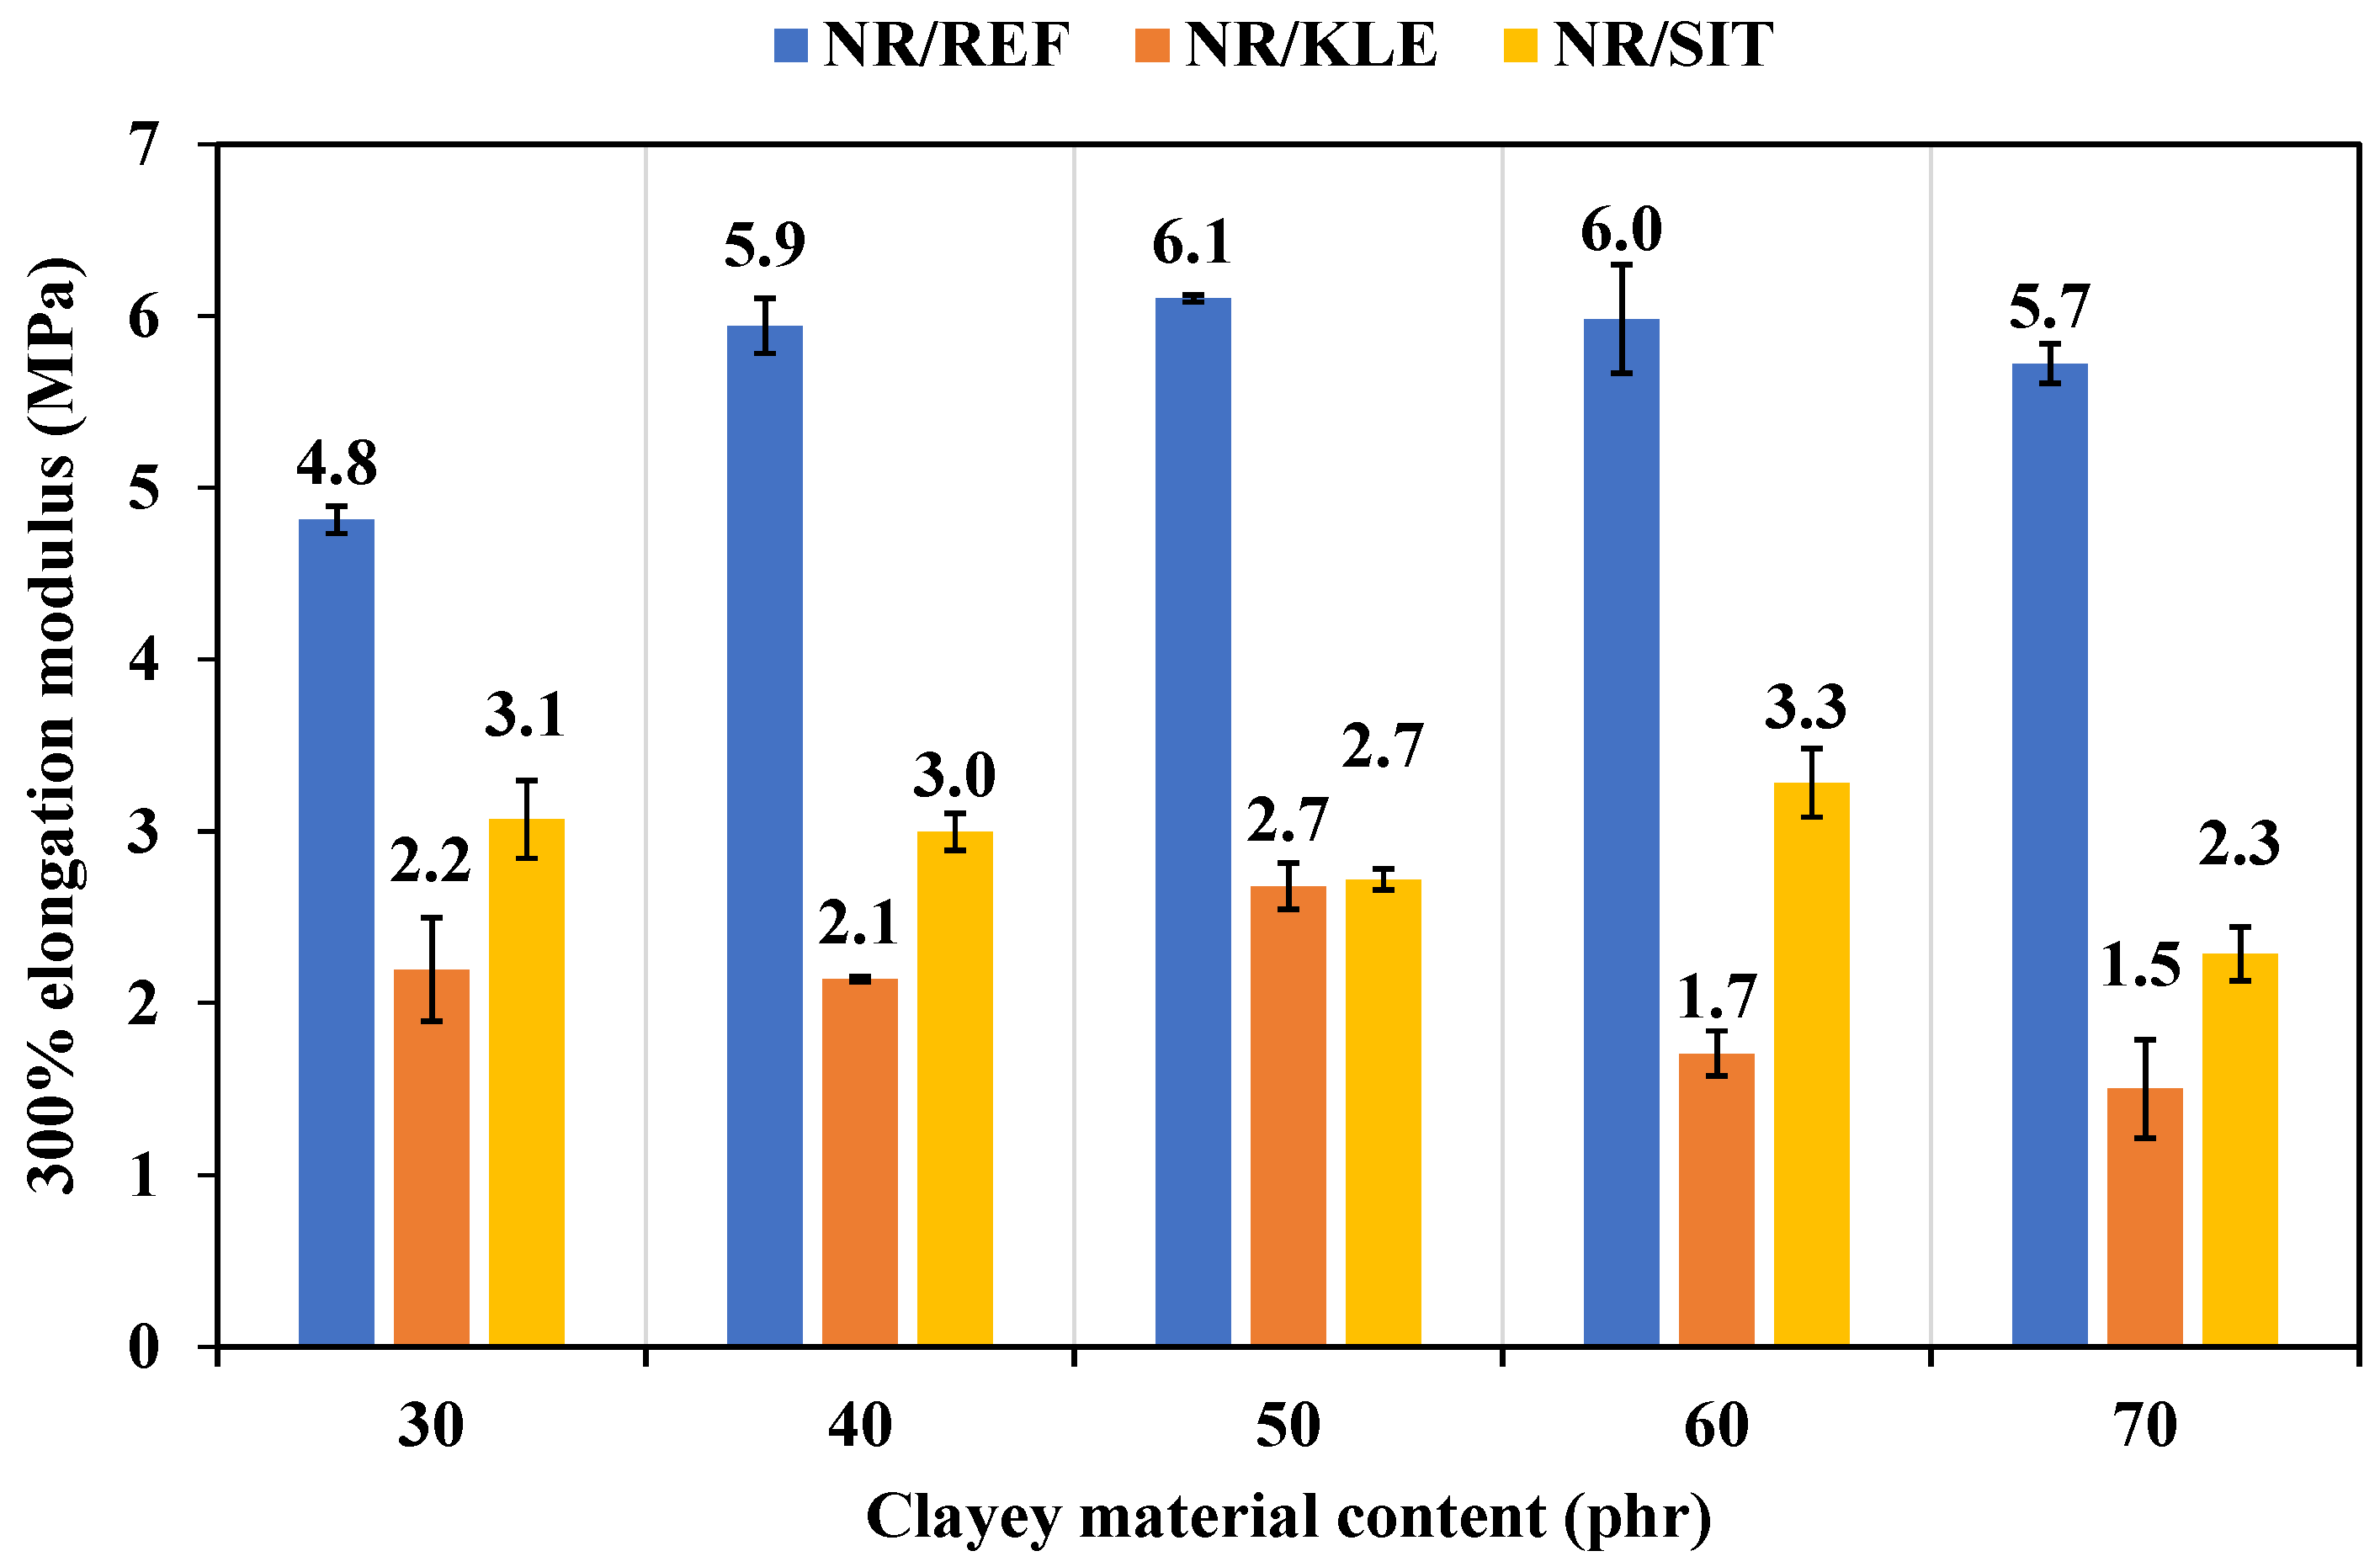
Figure 10 illustrates the variation in the tensile modulus at 300% elongation (MOD) as a function of clay loading.
Analysis of the data in Figure 10 reveals two distinct trends. For the NR/REF and NR/KLE mixtures, the tensile modulus at 300% elongation (MOD) increases between 30 and 50 phr, followed by a decrease at higher filler loadings. In contrast, the MOD of the NR/SIT mixture remains relatively constant over the 30–60 phr loading range and decreases only beyond 60 phr. The maximum MOD values were obtained at filler loadings of 50, 50, and 60 phr for the NR/REF (6.1 MPa), NR/KLE (2.7 MPa), and NR/SIT (3.3 MPa) mixtures, respectively.
The tensile modulus depends on both the cross-link density of the rubber compounds [14] and the crystallinity of the mineral fillers [29]. The relatively poor crystallinity of the kaolinite present in SIT likely explains the lower modulus of the NR/SIT mixture compared with NR/REF. Yvon et al. [29] demonstrated that the tensile modulus at 120% elongation of NR compounds filled with kaolinitic clays decreases with increasing hydrazine test values. Furthermore, although SIT contains a relatively high kaolinite content (45 wt%) compared with the DIE clay (31 wt%) investigated in previous work, the MOD values of the NR/SIT composites remain considerably lower than those of NR/DIE at equivalent filler loadings [29]. This observation further supports the conclusions reported by Yvon et al. [29].
The increase in MOD is primarily attributed to an increase in the cross-link density of the NR/clay mixtures. In addition, interfacial interactions between the NR matrix and the clay particles are believed to contribute to this behaviour. Some authors have described these interactions as physical cross-links [14,64]. Both physical and sulphur cross-links contribute to the overall cross-link density of rubber vulcanisates [65].
The reduction in MOD beyond 50 phr for the NR/REF and NR/KLE mixtures, and beyond 60 phr for NR/SIT, can be attributed to a dilution effect arising from the reduced volume fraction of polymer in the composites. When the amount of rubber becomes insufficient to adequately wet and bind the filler particles, the resulting vulcanisate becomes increasingly rigid and brittle at low elongations.
The MOD values obtained for the NR/REF mixtures are consistently higher than those of the NR/SIT and NR/KLE systems. This behaviour is attributed to the superior compatibility between REF and the NR matrix. Moreover, as previously discussed, the improved dispersion of REF promotes more effective stress transfer and increased rigidity within the composite. These observations are consistent with the torque difference (ΔM) results presented in Figure 9, where the NR/REF mixtures exhibit higher ΔM values than the corresponding SIT- and KLE-filled compounds.

3.3.3. Influence of Clay Loading on the Tensile Strength and Elongation at Break of NR Mixtures

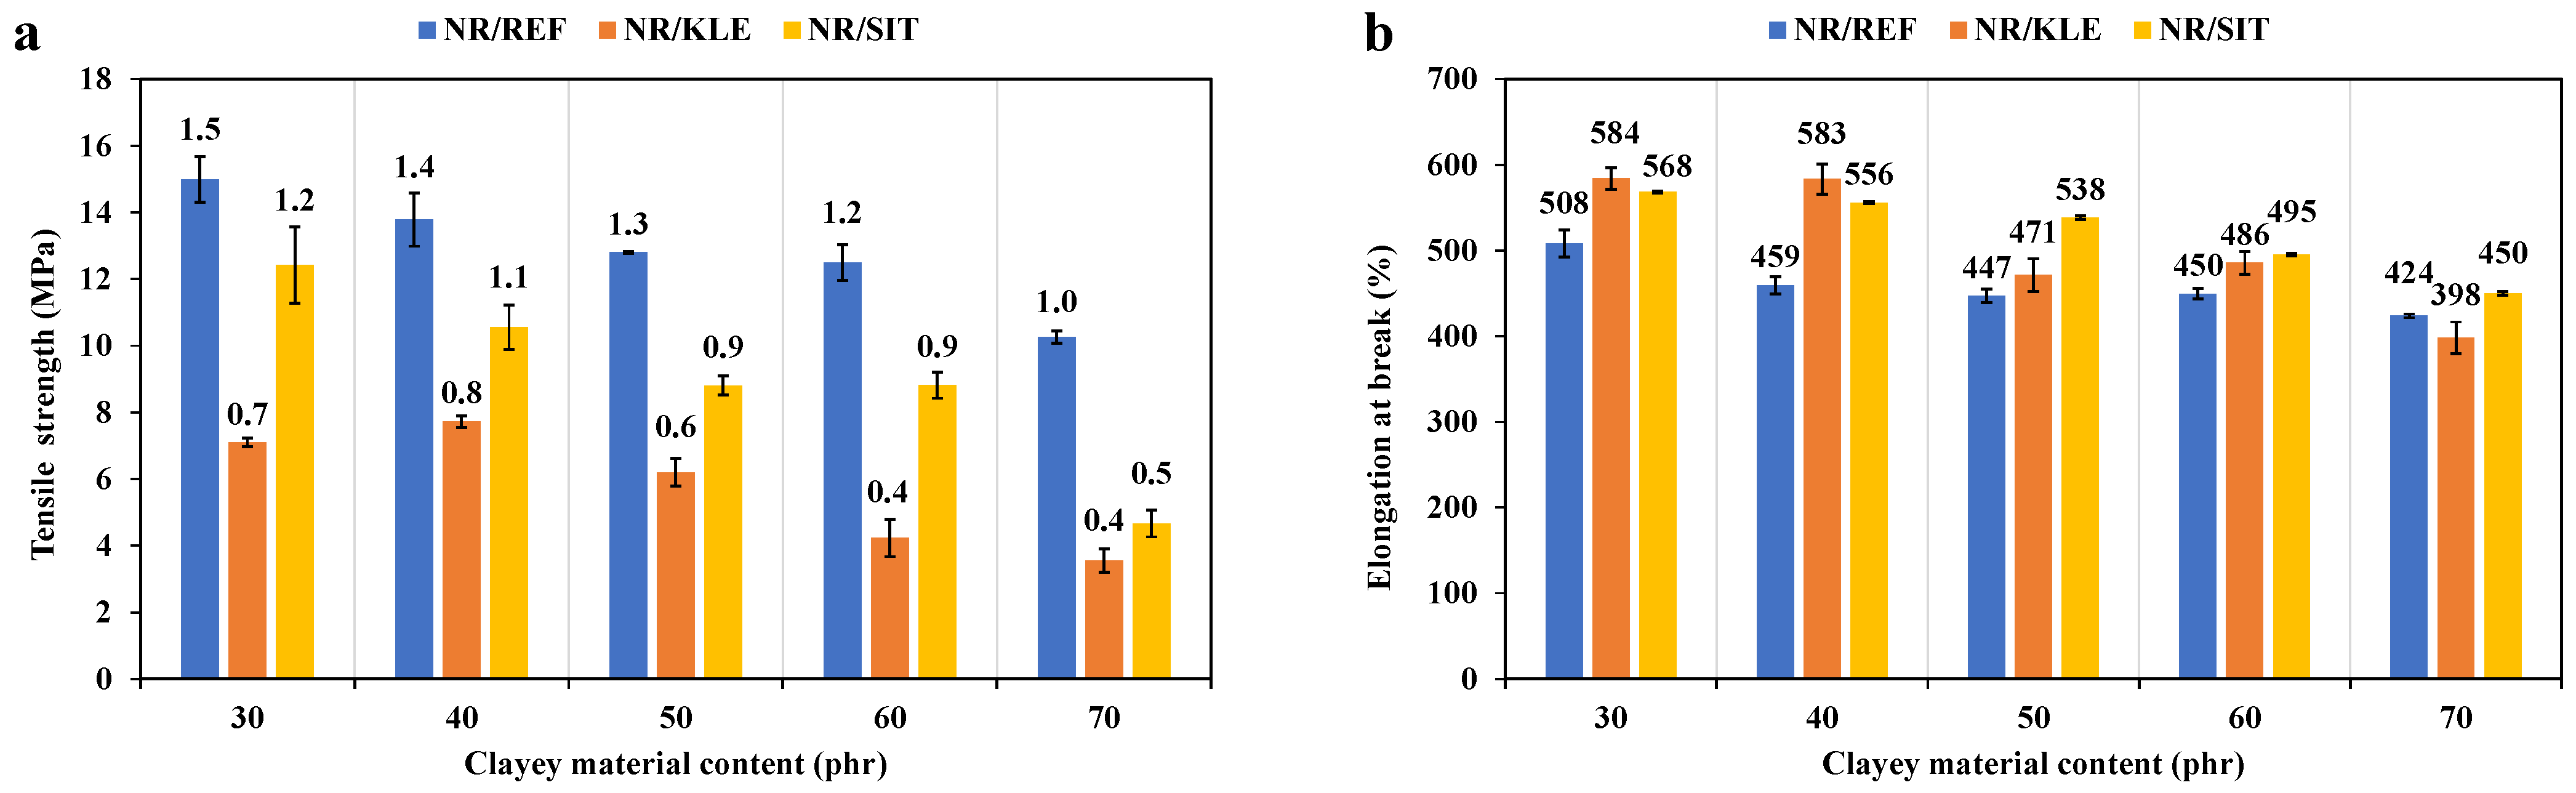
Figure 11a and Figure 11b illustrate the variations in Tensile Strength (TS) and Elongation at Break (EB) of the NR/clay mixtures, respectively.
Both mechanical properties decrease with increasing clay loading. This behaviour is consistent with the general response of NR filled with rigid particles, where the incorporation of mineral fillers typically results in reductions in both tensile strength and elongation at break [66]. A similar trend was reported by Surya and Khosman, who observed a decrease in tensile strength beyond 8 phr of montmorillonite in NR, accompanied by a gradual reduction in elongation at break [14].
The high tensile strength of NR originates from its ability to undergo strain-induced crystallization. Under applied stress, the polymer chains orient and crystallize along the direction of deformation, thereby enhancing energy absorption and delaying failure. As previously discussed, increasing the clay loading reduces the effective volume fraction of rubber within the composite [67]. Furthermore, higher filler contents promote the agglomeration of clay particles, generating stress-concentration sites that weaken the reinforcing effect and act as initiation points for crack propagation [15,66].
With respect to tensile strength (TS), reductions of 32%, 50%, and 62% were observed for the NR/REF, NR/KLE, and NR/SIT compounds, respectively. Similarly, elongation at break (EB) decreased by 17%, 32%, and 21% for the corresponding compounds. The highest TS values were obtained for the NR/REF compound, whereas the highest EB values were observed for the NR/KLE compound. These results indicate the superior reinforcing efficiency of REF clay compared with SIT and KLE. The observed behaviour is consistent with the microstructural observations and the torque difference (ΔM) results discussed previously.

3.3.4. Influence of Clay Loading on the Tear Strength of NR Mixtures

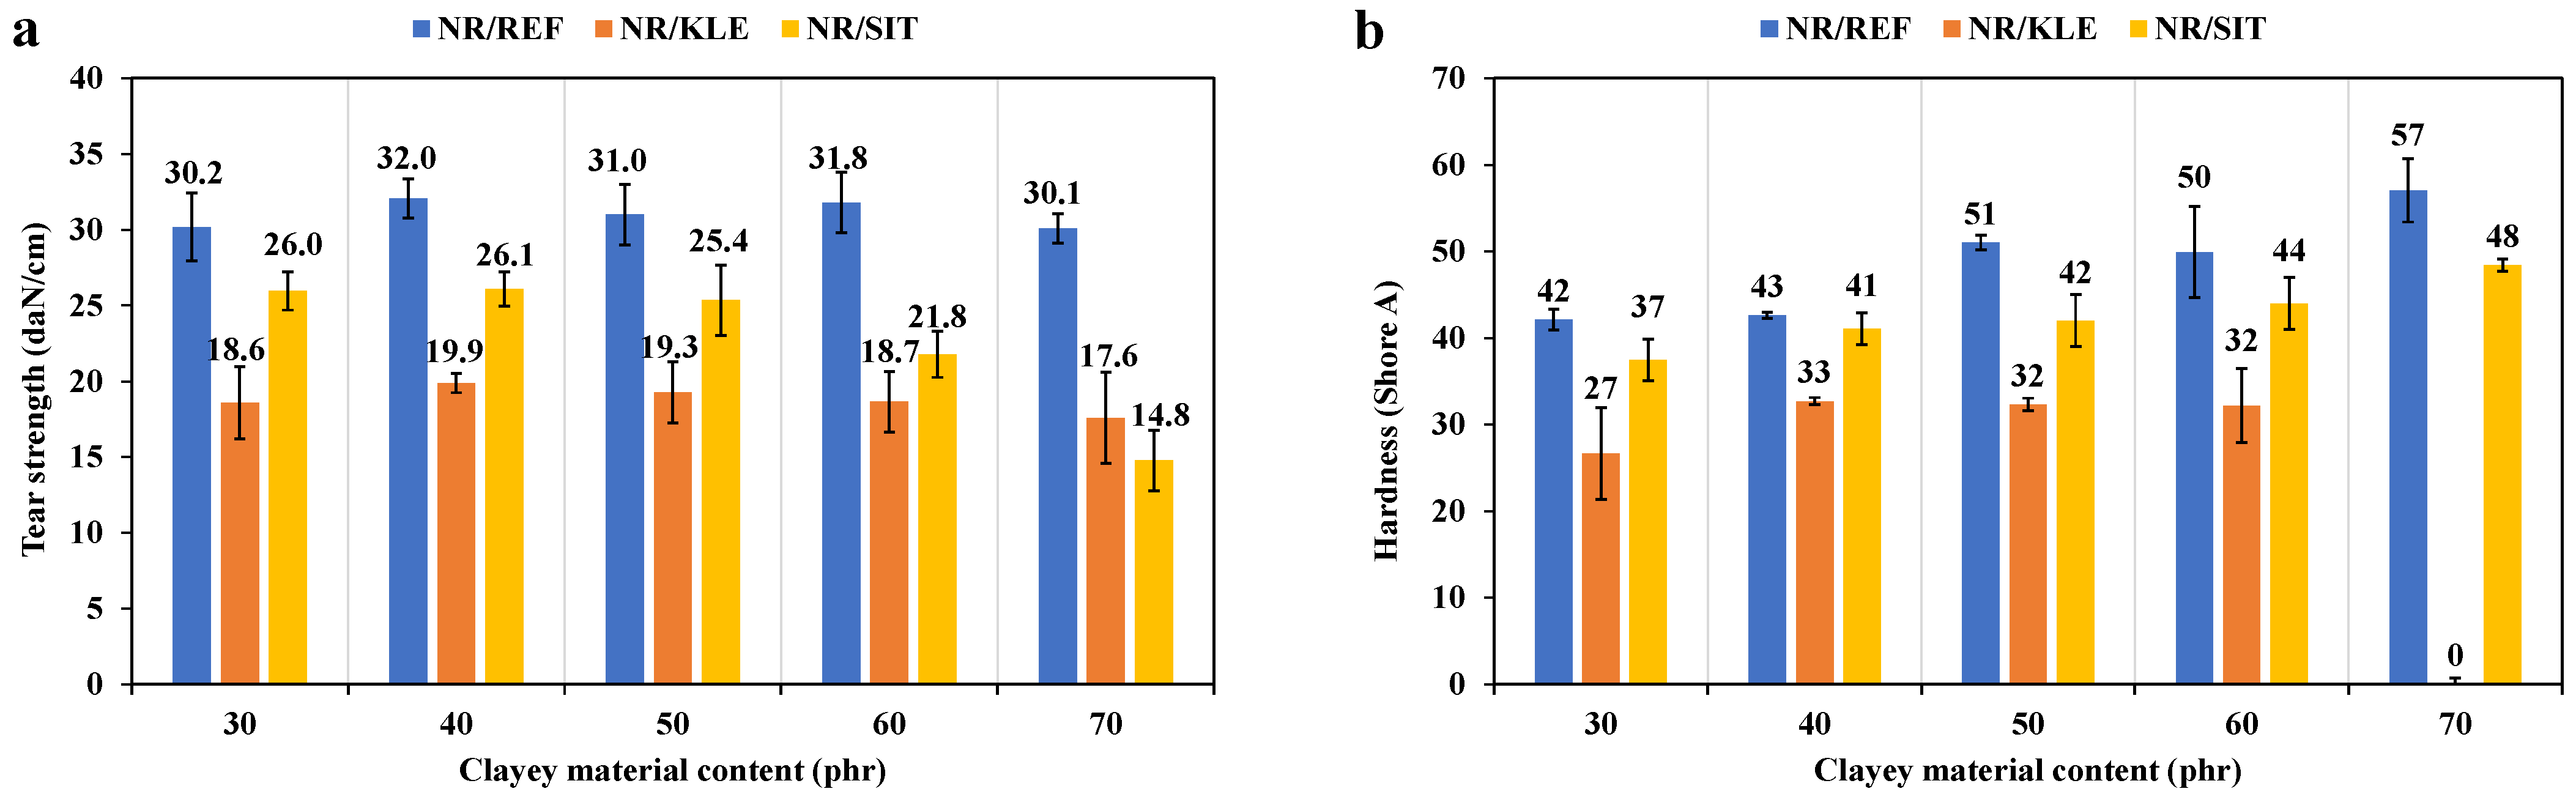
The tear strength of the NR/clay compounds increases with increasing clay loading, reaches a maximum value, and subsequently decreases, as illustrated in Figure 12a.
For all mixtures, the tear resistance increases with clay loading up to 60 phr and subsequently decreases. This behaviour can be attributed to the dispersion state of the filler. At low filler loadings, the clay particles are more effectively dispersed within the rubber matrix, thereby hindering crack initiation and propagation. At higher loadings, however, the fillers tend to agglomerate, creating stress-concentration sites that promote failure and reduce the overall tear resistance. Similar behaviour has been reported for epoxidised NR nanocomposites containing organo-modified montmorillonite [68].
The tear resistance is highest for the NR/REF mixture and lowest for the NR/KLE mixture. The superior dispersion of REF within the NR matrix, as indicated by its lower minimum torque (ML) compared with the NR/SIT and NR/KLE mixtures, contributes to this improved performance. Well-dispersed clay particles and small tactoids act as effective barriers to crack propagation, thereby enhancing the tear resistance of the composites [68].

3.3.5. Influence of Clay Fillers on the Hardness of NR Mixtures

Cross-link density is a key parameter governing the properties of NR compounds. Similar to the tensile modulus, hardness is strongly dependent on the degree of cross-linking. Figure 12b shows the hardness of NR compounds filled with the various clays. The hardness of the NR/clay vulcanisates increases with increasing clay loading.
These results confirm that an increase in the torque difference (ΔM) corresponds to an increase in vulcanisate hardness [63]. This improvement is attributed to stronger interactions between the clay fillers and the NR matrix, as reflected by the ΔM values, as well as to the restricted mobility of the polymer chains caused by filler incorporation. Similar observations have been reported for NR composites reinforced with illite [16]. However, Gnoumou et al. [5] reported higher hardness values for an NR compound containing 50 phr of a clay soil filler.
The hardness values obtained for the NR compounds containing kaolinitic clays (REF and SIT) are higher than those of the NR/KLE compounds. Furthermore, the hardness of the NR/SIT compounds remains lower than that of the NR/REF compounds. These observations are attributed to the stronger interactions between the kaolinitic clays and the NR matrix, as reflected by the higher ΔM values compared with those of the NR/KLE compounds. In addition, the higher kaolinite content and better crystallinity of REF relative to SIT contribute to the greater rigidity of the NR/REF compounds.
It should be noted that hardness measurements could not be performed for the NR compound containing 70 phr of KLE because the specimens exhibited poor integrity and did not provide reliable test results.

4. Conclusions

Mineralogical, microstructural, physical, and mechanical analyses of the NR/clay compounds lead to the following conclusions. XRD and FTIR analyses indicate that the internal structures of the KLE and SIT clays were not significantly modified after incorporation into the NR matrix. Nevertheless, the results demonstrate that both raw clay materials were physically dispersed within the NR. Microstructural observations revealed that the kaolinitic clays (REF and SIT) exhibited better dispersion within the NR matrix than the swelling clay KLE. This behaviour is attributed to the incompatibility between the hydrophilic swelling minerals and the hydrophobic NR matrix, as confirmed by SEM observations.
Both the scorch time (ts2) and the optimum cure time (tc90) increased with increasing clay loading. The NR/KLE compounds exhibited significantly longer vulcanisation times, which are attributed to interactions between the hydroxyl groups present on the clay surface and the vulcanisation system, particularly the accelerator. The minimum torque (ML) was consistently higher for the NR/KLE compounds than for the NR/SIT and NR/REF compounds and generally increased with filler loading. This behaviour is associated with the tendency of clay particles to form agglomerates that are difficult to disperse within NR, a phenomenon that is particularly pronounced for the hydrophilic KLE clay.
The maximum torque (MH) and torque difference (ΔM) values were higher for the NR/REF compounds than for the NR/SIT and NR/KLE compounds. This behaviour is attributed to stronger interactions between the NR macromolecular chains and kaolinite, which is more abundant and better crystallized in REF, as well as to a higher cross-link density within the NR/REF compounds.
The incorporation of clay fillers improved the tensile modulus at 300% elongation (MOD) and tear strength up to a filler loading of 60 phr, while hardness increased continuously with clay content. Compounds filled with kaolinitic clays (REF and SIT) exhibited higher modulus, hardness, and tear strength than those containing KLE. In contrast, both tensile strength and elongation at break generally decreased with increasing filler loading. Among the investigated systems, the NR/REF compounds exhibited the highest tensile strength.
Overall, the physical and mechanical properties of the NR/REF compounds were superior to those of the NR/SIT and NR/KLE compounds. Although the NR/SIT and NR/KLE compounds exhibited higher elongation at break, their remaining mechanical properties were significantly inferior to those obtained with the commercial REF clay. According to the manufacturer’s technical requirements, the KLE and SIT clays cannot be used directly, in their raw state, as substitutes for REF in the manufacture of high-quality inner tubes. However, suitable physicochemical treatments aimed at improving the compatibility between these local clays and the NR matrix could enhance their reinforcing efficiency and potentially enable their use as alternative fillers in inner tube production. Beyond recovering this mechanical deficit, achieving optimal dispersion and interfacial adhesion through such modifications is expected to profoundly influence the functional performance of the resulting composites. Consequently, to fully validate the practical viability of these treated local resources, future investigations will focus on characterising their gas barrier properties via targeted permeability measurements. Alongside these functional evaluations, a comprehensive assessment of their thermal ageing behaviour will be imperative to ensure long-term microstructural stability and operational resilience.

Author Contributions

Conceptualization, L.V.L.G., H.B. and A.A.T.; Methodology, L.V.L.G., H.B. and A.A.T.; Data curation, L.V.L.G., H.B. and A.A.T.; Formal analysis,. L.V.L.G., H.B. and A.A.T.; Investigation, L.V.L.G., H.B. and A.A.T.; Writing—Original draft preparation, L.V.L.G., H.B. and A.A.T.; Visualization, I.S., J.-E.A. and Y.M.; Supervision, I.S., J.-E.A. and Y.M.; Software, I.S., J.-E.A. and Y.M.; Validation, I.S., J.-E.A. and Y.M.; Writing—Review & Editing, I.S., J.-E.A. and Y.M.; Project Administration, I.S., J.-E.A. and Y.M. All authors have read and agreed to the published version of the manuscript.

Funding

This research received no external funding.

Institutional Review Board Statement

Not applicable.

Informed Consent Statement

Not applicable.

Data Availability Statement

The original contributions presented in this study are included in the article. Further inquiries can be directed to the corresponding author.

Acknowledgments

The authors sincerely thank the technicians of the Laboratory of Materials and Durability of Constructions (LMDC) in Toulouse (France) and the African Tire Company for respectively carrying out the microstructural analyses and the physico-mechanical tests on the studied samples.

Conflicts of Interest

The authors declare no conflicts of interest.

References

  1. Idoine, N.E.; Raycraft, E.R.; Price, F.; Hobbs, S.F.; Deady, E.A.; Everett, P.; Shaw, R.A.; Evans, E.J.; Mills, A.J. World Mineral Production; British Geological Survey: Nottingham, UK, 2023; 98p. [Google Scholar]
  2. Delon, J.-F.; Liétard, O.; Cases, J.-M.; Richard, M.; Sauret, G.; Maume, J.-P. Possibilités d’emploi des kaolins des Charentes dans le couchage des papiers et cartons. Bull. Minéralogie 1982, 105, 571–581. [Google Scholar] [CrossRef]
  3. Aghzzaf, A.A. Argiles en tant que Réservoirs D’inhibiteurs de Corrosion Métallique Issus de Ressources Naturelles dans des Peintures Pour la Protection des Métaux. Ph.D. Thesis, Université de Lorraine, Nancy, France, Université Cadi Ayyad, Marrakech, Morocco, 2014. [Google Scholar]
  4. Millogo, Y.; Hajjaji, M.; Ouedraogo, R. Microstructure and physical properties of lime-clayey adobe bricks. Constr. Build. Mater. 2008, 22, 2386–2392. [Google Scholar] [CrossRef]
  5. Gnoumou, L.V.L.; Millogo, Y.; Aubert, J.-E.; Ouedraogo, M.; Sanou, I.; Zoungrana, J.; Gomina, M. Use of a Natural Clayey Soil from Burkina Faso to Reinforce Natural Rubber. Chem. Afr. 2023, 6, 2919–2932. [Google Scholar] [CrossRef]
  6. Ogbebor, O.; Okieimen, F.; Ogbeifun, D.; Okwu, U. Organomodified kaolin as filler for natural rubber. Chem. Ind. Chem. Eng. Q. 2015, 21, 477–484. [Google Scholar] [CrossRef]
  7. Peter, R.; Sreelekshmi, R.V.; Menon, A.R.R. Cetyltrimethyl Ammonium Bromide Modified Kaolin as a Reinforcing Filler for Natural Rubber. J. Polym. Environ. 2018, 26, 39–47. [Google Scholar] [CrossRef]
  8. Zhang, Y.; Liu, Q.; Zhang, Q.; Lu, Y. Gas barrier properties of natural rubber/kaolin composites prepared by melt blending. Appl. Clay Sci. 2010, 50, 255–259. [Google Scholar] [CrossRef]
  9. Zhang, Y.; Liu, Q.; Zhang, S.; Zhang, Y.; Cheng, H. Gas barrier properties and mechanism of kaolin/styrene–butadiene rubber nanocomposites. Appl. Clay Sci. 2015, 111, 37–43. [Google Scholar] [CrossRef]
  10. Zhang, Y.; Liu, Q.; Zhang, S.; Zhang, Y.; Zhang, Y.; Liang, P. Characterization of kaolinite/styrene butadiene rubber composite: Mechanical properties and thermal stability. Appl. Clay Sci. 2016, 124–125, 167–174. [Google Scholar] [CrossRef]
  11. Liu, Q.; Zhang, Y.; Xu, H. Properties of vulcanized rubber nanocomposites filled with nanokaolin and precipitated silica. Appl. Clay Sci. 2008, 42, 232–237. [Google Scholar] [CrossRef]
  12. Keereerak, A.; Sukkhata, N.; Lehman, N.; Nakaramontri, Y.; Sengloyluan, K.; Johns, J.; Kalkornsurapranee, E. Development and Characterization of Unmodified and Modified Natural Rubber Composites Filled with Modified Clay. Polymers 2022, 14, 3515. [Google Scholar] [CrossRef] [PubMed]
  13. Arroyo, M.; López-Manchado, M.A.; Herrero, B. Organo-montmorillonite as substitute of carbon black in natural rubber compounds. Polymer 2003, 44, 2447–2453. [Google Scholar] [CrossRef]
  14. Surya, I.; Khosman, H. The physico-mechanical properties of montmorillonite-filled natural rubber. AIP Conf. Proc. 2020, 2221, 030002. [Google Scholar] [CrossRef]
  15. Kader, M.A.; Kim, K.; Lee, Y.-S.; Nah, C. Preparation and properties of nitrile rubber/montmorillonite nanocomposites via latex blending. J. Mater. Sci. 2006, 41, 7341–7352. [Google Scholar] [CrossRef]
  16. Wang, Z.; Wang, S.; Yu, X.; Zhang, H.; Yan, S. Study on the Use of CTAB-Treated Illite as an Alternative Filler for Natural Rubber. ACS Omega 2021, 6, 19017–19025. [Google Scholar] [CrossRef] [PubMed]
  17. Seynou, M.; Zoungrana, J.; Savadogo, M.; Ouattara, R.; Ouedraogo, R. Potential use of clay from Burkina Faso as filler in rubber production. Int. J. Biol. Chem. Sci. 2014, 8, 727. [Google Scholar] [CrossRef]
  18. Saidi, D. Relationship between cation exchange capacity and the saline phase of Cheliff sol. Agric. Sci. 2012, 3, 434–443. [Google Scholar] [CrossRef]
  19. Ciesielski, H.; Sterckeman, T.; Santerne, M.; Willery, J.P. Determination of cation exchange capacity and exchangeable cations in soils by means of cobalt hexamine trichloride. Effects of experimental conditions. Agronomie 1997, 17, 1–7. [Google Scholar] [CrossRef]
  20. NF X31-130; Qualité des Sols—Méthodes Chimiques—Détermination de la Capacité D’échange Cationique (CEC) et des Cations Extractibles. Association Française de Normalisation: La Plaine Saint-Denis, France, 1999.
  21. Bentahar, Y. Caractérisation Physico-Chimique des Argiles Marocaines: Application à L’adsorption de L’arsenic et des Colorants Cationiques en Solution Aqueuse. Ph.D. Thesis, Université de Nice-Sophia Antipolis, Nice, France, Université Abdelmalek ESSAADI, Tétouan, Morocco, 2016. [Google Scholar]
  22. Brunauer, S.; Emmett, P.H.; Teller, E. Adsorption of Gases in Multimolecular Layers. J. Am. Chem. Soc. 1938, 60, 309–319. [Google Scholar] [CrossRef]
  23. ISO 6502-3:2023; Caoutchouc—Mesure des Caractéristiques de Vulcanisation à L’aide de Rhéomètres—Partie 3: Rhéomètre Sans Rotor. International Organization for Standardization: Vernier, Geneva, 2023.
  24. ISO 37:2024; Caoutchouc Vulcanisé ou Thermoplastique-Détermination des Caractéristiques de Contrainte-Déformation en Traction. International Organization for Standardization: Vernier, Geneva, 2024.
  25. ISO 48-4:2018; Caoutchouc Vulcanisé ou Thermoplastique—Détermination de la Dureté—Partie 4: Dureté par Pénétration par la Méthode au Duromètre (Dureté Shore). International Organization for Standardization: Vernier, Geneva, 2018.
  26. Ouédraogo, K.A.J. Stabilisation de Matériaux de Construction Durables et Ecologiques à base de Terre Crue par des Liants Organiques et/ou Minéraux à Faibles Impacts Environnementaux. Ph.D. Thesis, Université Toulouse 3 Paul Sabatier, Toulouse, France, 2019. [Google Scholar]
  27. Martín-Márquez, J.; Rincón JMa Romero, M. Effect of firing temperature on sintering of porcelain stoneware tiles. Ceram. Int. 2008, 34, 1867–1873. [Google Scholar] [CrossRef]
  28. Chanturiya, V.; Minenko, V.; Suvorova, O.; Pletneva, V.; Makarov, D. Electrochemical modification of saponite for manufacture of ceramic building materials. Appl. Clay Sci. 2017, 135, 199–205. [Google Scholar] [CrossRef]
  29. Yvon, J.; Garin, P.; Delon, J.-F.; Cases, J.-M. Valorisation des argiles kaoliniques des Charentes dans le caoutchouc naturel. Bull. Minéralogie 1982, 105, 535–541. [Google Scholar] [CrossRef]
  30. Montoya, J.W.; Baur, G.S. Nickeliferous serpentines, chlorites, and related minerals found in two lateritic ores. Am. Mineral. J. Earth Planet. Mater. 1963, 48, 1227–1238. [Google Scholar]
  31. Földvári, M. Handbook of Thermogravimetric System of Minerals and Its Use in Geological Practice; Geological Institute of Hungary: Budapest, Hungary, 2011. [Google Scholar]
  32. Luo, B.; Peng, T.; Sun, H. Innovative Methodology for Sulfur Release from Copper Tailings by the Oxidation Roasting Process. J. Chem. 2020, 2020, 8090846. [Google Scholar] [CrossRef]
  33. Da Silveira, R.F.; Fernandez, O.J.C.; Da Luz, P.T.S.; Da Costa, J.H.B. Thermal Transformations of the Nickel Laterite Agglomerate Phases and their Metallurgical Influence. Mater. Sci. Forum 2020, 1012, 337–342. [Google Scholar] [CrossRef]
  34. Aarfane, A.; Salhi, A.; Krati, M.E.; Tahiri, S.; Monkade, M.; Lhadi, E.K.; Bensitel, M. Etude cinétique et thermodynamique de l’adsorption des colorants Red195 et Bleu de méthylène en milieu aqueux sur les cendres volantes et les mâchefers. J. Mater. Environ. Sci. 2014, 5, 1927–1939. [Google Scholar]
  35. Coulibaly, V.; Sei, J.; Koffi, L.K.; Oyetola, S.; Jdid, E.-A.; Thomas, F. Mineralogical and Chemical Characteristics of Clays Consumed in the District of Abidjan (Côte D’Ivoire). Mater. Sci. Appl. 2014, 5, 1048–1059. [Google Scholar] [CrossRef]
  36. Farcas, F.; Touzé, P. La spectrométrie infrarouge à transformée de Fourier (IRTF): Une méthode intéressante pour la caractérisation des ciments. BLPC—Bulletin Lab. Ponts Chaussées 2001, 230, 77–88. [Google Scholar]
  37. Fripiat, J.J. Application de la spectroscopie infrarouge à l’étude des minéraux argileux. Bull. Groupe Fr. Argiles 1960, 12, 25–41. [Google Scholar] [CrossRef]
  38. De Kimpe, C.; Colmet Daage, F. Caractérisation des minéraux kaoliniques par diverses techniques. Bull. Groupe Fr. Argiles 1966, 18, 59–66. [Google Scholar] [CrossRef]
  39. Madejová, J. Baseline Studies of the Clay Minerals Society Source Clays: Infrared Methods. Clays Clay Miner. 2001, 49, 410–432. [Google Scholar] [CrossRef]
  40. Steudel, A.; Kleeberg, R.; Koch, C.B.; Friedrich, F.; Emmerich, K. Thermal behavior of chlorites of the clinochlore-chamosite solid solution series: Oxidation of structural iron, hydrogen release and dehydroxylation. Appl. Clay Sci. 2016, 132–133, 626–634. [Google Scholar] [CrossRef]
  41. Dill, H.G.; Dohrmann, R.; Kaufhold, S. Disseminated and faultbound autohydrothermal ferroan saponite in Late Paleozoic andesites of the Saar-Nahe Basin, SW Germany: Implications for the economic geology of intermediate (sub)volcanic rocks. Appl. Clay Sci. 2011, 51, 226–240. [Google Scholar] [CrossRef]
  42. Trujillano, R.; González, B.; Rives, V. Phase Change Materials (PCMs) Based in Paraffin/Synthetic Saponite Used as Heat Storage Composites. Energies 2021, 14, 7414. [Google Scholar] [CrossRef]
  43. Baldermann, A.; Dohrmann, R.; Kaufhold, S.; Nickel, C.; Letofsky-Papst, I.; Dietzel, M. The Fe-Mg-saponite solid solution series—A hydrothermal synthesis study. Clay Miner. 2014, 49, 391–415. [Google Scholar] [CrossRef]
  44. Wilson, M.J. Rock-Forming Minerals: Clay Minerals; Sheet Silicates; Volume 3C; Geological Society of London: London, UK, 2013; Volume 3. [Google Scholar]
  45. Madejová, J. FTIR techniques in clay mineral studies. Vib. Spectrosc. 2003, 31, 1–10. [Google Scholar] [CrossRef]
  46. Guyot, J. Mesure des surfaces spécifiques des argiles par adsorption. Ann. Agron. 1969, 20, 333–359. [Google Scholar]
  47. Belghazdis, M.; Hachem, E.-K. Clay and Clay Minerals: A Detailed Review. Int. J. Recent Technol. Appl. Sci. 2022, 4, 54–75. [Google Scholar] [CrossRef]
  48. Fripiat, J.J.; Gastuche, M.-C.; Couvreur, J. Quelques caractéristiques thermiques des complexes synthétiques: Kaolinite-Oxydes de fer trivalent. Bull. Groupe Fr. Argiles 1953, 5, 42–53. [Google Scholar] [CrossRef]
  49. Soro, N.S. Influence des Ions fer sur les Transformations Thermiques de la Kaolinite. Ph.D. Thesis, Université de Limoges, Limoges, France, 2003. [Google Scholar]
  50. Qlihaa, A.; Dhimni, S.; Melrhaka, F.; Hajjaji, N.; Srhiri, A. Caractérisation physico-chimique d’une argile Marocaine [Physico-chemical characterization of a morrocan clay]. J. Mater. Environ. Sci. 2016, 7, 1741–1750. [Google Scholar]
  51. Carroll, D. Ion exchange in clays and other minerals. Geol. Soc. Am. Bull. 1959, 70, 749. [Google Scholar] [CrossRef]
  52. Dramé, H. Modifications Physico-Chimiques des Argiles de Type Smectite: Caractérisation et Perspectives Environnementales Comme Catalyseurs et Adsorbants. Ph.D. Thesis, University of Ottawa, Ottawa, ON, Canada, 1998. [Google Scholar]
  53. Abraham, E.; Elbi, P.A.; Deepa, B.; Jyotishkumar, P.; Pothen, L.A.; Narine, S.S.; Thomas, S. X-ray diffraction and biodegradation analysis of green composites of natural rubber/nanocellulose. Polym. Degrad. Stab. 2012, 97, 2378–2387. [Google Scholar] [CrossRef]
  54. Sharif, J.; Zin Wan Yunus, W.M.; Mohd Dahlan, K.Z.H.; Ahmad, M.H. Preparation and properties of radiation crosslinked natural rubber/clay nanocomposites. Polym. Test. 2005, 24, 211–217. [Google Scholar] [CrossRef]
  55. Bokobza, L. Natural Rubber Nanocomposites: A Review. Nanomaterials 2018, 9, 12. [Google Scholar] [CrossRef] [PubMed]
  56. Mahmoud, D.S.; Zaher, K.S.A.; El-Sabbagh, S.H.; Yossef, A.M.; Nawwar, G.A.M. Using of aluminum (lignin/silica/fatty acids) hybrid filler in the fabrication of natural rubber conductive elastomers. Sci. Rep. 2025, 15, 25363. [Google Scholar] [CrossRef] [PubMed]
  57. Kadla, J.F.; Kubo, S. Miscibility and Hydrogen Bonding in Blends of Poly(ethylene oxide) and Kraft Lignin. Macromolecules 2003, 36, 7803–7811. [Google Scholar] [CrossRef]
  58. Hasan, A.; Junaidi, R.; Yerizam, M.; Arifin, F. Physical Properties Investigations of Natural Rubber Composites Using Cetyltrimethylammonium Bromide (CTAB) as Modifier of Local Clay Filler. ASEAN J. Chem. Eng. 2023, 23, 290. [Google Scholar] [CrossRef]
  59. Xu, X.; Liu, F.; Jiang, L.; Zhu, J.Y.; Haagenson, D.; Wiesenborn, D.P. Cellulose Nanocrystals vs. Cellulose Nanofibrils: A Comparative Study on Their Microstructures and Effects as Polymer Reinforcing Agents. ACS Appl. Mater. Interfaces 2013, 5, 2999–3009. [Google Scholar] [CrossRef] [PubMed]
  60. Dai, J.C.; Huang, J.T. Surface modification of clays and clay–rubber composite. Appl. Clay Sci. 1999, 15, 51–65. [Google Scholar] [CrossRef]
  61. Arroyo, M.; Lopezmanchado, M.; Valentin, J.; Carretero, J. Morphology/behaviour relationship of nanocomposites based on natural rubber/epoxidized natural rubber blends. Compos. Sci. Technol. 2007, 67, 1330–1339. [Google Scholar] [CrossRef]
  62. Sookyung, U.; Nakason, C.; Thaijaroen, W. Preparation of Natural Rubber/Sodium Montmorillonite Nanocomposites by Latex Mixing Method with Drying Process. AMR 2012, 626, 62–65. [Google Scholar] [CrossRef]
  63. Masłowski, M.; Miedzianowska, J.; Strzelec, K. Natural Rubber Composites Filled with Crop Residues as an Alternative to Vulcanizates with Common Fillers. Polymers 2019, 11, 972. [Google Scholar] [CrossRef] [PubMed]
  64. Andriani, F.; Surya, I. Silica dispersion enhancement in natural rubber composites utilising stearyl alcohol. J. Phys. Conf. Ser. 2018, 1116, 042005. [Google Scholar] [CrossRef]
  65. Surya, I.; Ginting, M.; Ismail, H. Cure characteristics, swelling behaviour and tensile properties of carbon black-filled Natural Rubber (NR)/Chloroprene Rubber (CR) blends in the presence of alkanolamide. MATEC Web Conf. 2018, 197, 12005. [Google Scholar] [CrossRef][Green Version]
  66. Nair, P.K.; Rani, J. Nanokaolin clay as reinforcing filler in Nitrile Rubber. Int. J. Sci. Eng. Res. 2012, 3, 1–9. [Google Scholar]
  67. Yahaya, L.E.; Adebowale, K.O.; Menon, A.R.R. Mechanical properties of organomodified kaolin/natural rubber vulcanizates. Appl. Clay Sci. 2009, 46, 283–288. [Google Scholar] [CrossRef]
  68. Teh, P.L.; Mohd Ishak, Z.A.; Hashim, A.S.; Karger-Kocsis, J.; Ishiaku, U.S. Physical properties of natural rubber/organoclay nanocomposites compatibilized with epoxidized natural rubber. J. Appl. Polym. Sci. 2006, 100, 1083–1092. [Google Scholar] [CrossRef]
Figure 1. X-ray diffractograms of the clay soils (SIT and KLE) (a); X-ray patterns of oriented clay specimens of the KLE sample showing the effects of ethylene glycol (EG) solvation and heat treatment (550 °C) (b).
Eng 07 00370 g001
Figure 2. DSC-TGA curves of SIT (a) and KLE (b). Horizontal dashed lines mark the TGA baseline levels before and after each mass-loss step; the corresponding weight loss (%) is given by the vertical double-headed arrows.
Eng 07 00370 g002
Figure 3. Infrared spectra of SIT and KLE.
Eng 07 00370 g003
Figure 4. Particle size distribution of clayey raw materials.
Eng 07 00370 g004
Figure 5. X-ray diffractograms of vulcanisate NR (a); NR/REF (b); NR/SIT (c) and NR/KLE (d).
Eng 07 00370 g005
Figure 6. Infrared spectra of NR/SIT, NR/KLE and NR/REF composites.
Eng 07 00370 g006
Figure 7. SEM image of NR/KLE (a) and NR/SIT compounds (c) with corresponding EDS spectrum NR/KLE (b) and NR/SIT (d).
Eng 07 00370 g007
Figure 8. The influence of mixture composition on curing parameters: scorch time (ts2) (a); cure time to 90% (tc90) (b); minimum torque (ML) (c); and maximum torque (MH) (d).
Eng 07 00370 g008
Figure 9. Variation in the torque difference ΔM as a function of raw clayey material content.
Eng 07 00370 g009
Figure 10. Influence of raw clayey materials on the tensile modulus at 300% elongation.
Eng 07 00370 g010
Figure 11. Variation in tensile strength (a) and elongation at break of NR/clayey materials mixtures (b).
Eng 07 00370 g011
Figure 12. Variation in tear strength (a) and hardness of NR/clayey material mixtures (b).
Eng 07 00370 g012
Table 1. Composition of rubber compounds.
Raw MaterialAmount (phr)
NR100
Clays30, 40, 50, 60, 70
Chalk31.50
ZnO2.50
Stearic acid1.50
Sulphur2.50
TBBS1.00
PVI0.10
Table 2. Chemical composition of clayey raw materials.
Oxides (%)SiO2Al2O3Fe2O3MnOMgOCaONa2OK2OTiO2P2O5PFTotal
KLE52.614.211.40.17.21.40.20.50.90.110.899.4
SIT59.117.97.10.10.40.30.10.41.40.212.299.2
Table 3. Physical and chemical properties of clayey raw materials.
SampleBET Specific Surface Area (m2/g)Cation Exchange Capacity (meq/100 g)
REF15.919.3
KLE25.736.8
SIT41.020.7
Disclaimer/Publisher’s Note: The statements, opinions and data contained in all publications are solely those of the individual author(s) and contributor(s) and not of MDPI and/or the editor(s). MDPI and/or the editor(s) disclaim responsibility for any injury to people or property resulting from any ideas, methods, instructions or products referred to in the content.