Article

Assessment of Input Parameter Importance in Predicting the Mechanical Properties of Rubberized Cement-Based Materials Using Neural Networks


by
Matija Zvonarić
*,
Irena Ištoka Otković
and
Ivana Barišić
Faculty of Civil Engineering and Architecture Osijek, Josip Juraj Strossmayer University of Osijek, 31000 Osijek, Croatia
*
Author to whom correspondence should be addressed.
Eng 2026, 7(5), 223; https://doi.org/10.3390/eng7050223
Submission received: 2 April 2026 / Revised: 4 May 2026 / Accepted: 5 May 2026 / Published: 7 May 2026
(This article belongs to the Section Materials Engineering)

Abstract

This study presents the development of predictive models for the mechanical properties of a cement-stabilized base layer incorporating waste rubber using artificial neural networks. The considered input parameters included ultrasonic pulse velocity (UPV), compressive strength (fc), rubber content (mass %), cement content (mass %) and curing duration (days). The models were employed to predict indirect tensile strength (ft) and the static modulus of elasticity (Est). A total of ten neural network models were developed and systematically evaluated. The results indicate that UPV is a highly relevant parameter, as its importance remains constant across all models (0.439–0.497 for ft and 0.167–0.225 for Est prediction), reflecting its stable contribution to predictions, while curing duration exerts a particularly significant effect on Est (0.236–0.621). The significance of the remaining input parameters varies depending on their combination within each model, highlighting the critical role of selecting an appropriate set of input variables. Statistical analysis demonstrates that all models exhibit a high level of reliability, confirming the suitability of neural networks for accurately predicting the mechanical behaviour of cement-based materials containing waste rubber. High need for standardisation of such models is highlighted.

1. Introduction

Cement-based materials can be characterised by various parameters, which require large-scale laboratory or in situ testing. Considering the time and cost involved in experiments, researchers aim to determine as many properties as possible while conducting as few tests as necessary. This aim can be addressed by using previously developed accurate prediction models. The traditional approach involves conducting a statistical analysis based on an experimentally derived dataset. This approach often requires iterative procedures in addition to extensive mathematical and statistical knowledge, especially when the results exhibit a nonlinear relationship. As a novel approach, researchers utilise artificial intelligence tools [1], such as support vector machines (SVMs), neural networks (NNs), decision trees (DTs), or K-nearest neighbours (K-NNs), to develop such models. These models, in addition to prediction, can represent the interrelationships among the analysed variables more effectively than statistical tools [2].
When developing prediction models, the goal is to achieve the highest possible reliability with the fewest input parameters, in order to make the models practical for use. Accordingly, the authors of papers [3,4] emphasise that Root Mean Squared Error (RMSE) is a significantly better metric for model evaluation compared to the coefficient of determination (R2). The same authors emphasise the dependence of model reliability primarily on measurement reliability in the case of testing on drilled cores [5]. Due to the difference in concrete compressive strength between laboratory specimens and drilled cores, the combination of an estimation equation and a correction factor is recommended in paper [6]. In the process of developing a predictive model for compressive strength, it was concluded that the non-destructive methods, ultrasonic pulse velocity (UPV) and rebound hammer test (RH), exhibit good mutual correlation, as well as correlation with compressive strength [6,7]. Khoudja et al. [8] also emphasise the importance of a sufficient number of specimens, especially drilled cores. In the assessment of compressive strength in existing structures, specific material properties are typically unknown; consequently, predictive models can be developed based solely on non-destructive testing results [9], but here one must be aware of inevitable experimental errors [10].
Some researchers have employed artificial intelligence tools for the evaluation of concrete, including estimation of compressive strength of normal [11,12] and high-performance concrete [13,14], or a combination of these in a single study [15], based on UPV and RH. In this approach, the SVM has proven to be a reliable tool for the development of predictive models [11,12,13]. Model accuracy can be further enhanced through input optimisation [14] or the hybridisation of models [15].
Given that the mechanical properties of composite materials are directly influenced by their constituents and their relative proportions, some researchers have approached the development of prediction models based on material composition. As input parameters for estimating compressive strength of concrete, the authors of papers [15,16,17,18,19,20,21,22,23,24,25,26] used input parameters such as the amount of cement, aggregate, water, additives, and specimens’ age, temperature, etc. It is to be expected that some of these parameters will have a greater influence, some a lesser, and others a negligible impact on the development of a reliable predictive model. Thus, Han et al. [26] emphasise specimen age and water-to-binder (w/b) ratio as the most influential input parameters for compressive strength prediction. Besides its conclusion that machine learning tools can accurately predict the compressive strength of the material [16,17,21], Ref. [18] implies that models developed for conventional concrete may not apply to concrete with silica fume.
On the other hand, by combining non-destructive test results and concrete constituents, Refs. [27,28,29,30,31] concluded that higher significance is found in non-destructive test results in comparison to concrete constituents, specimen age, or temperature, but ensemble models are superior to single ones [30]. Na et al. [28] emphasise that the amount of binder and the quantity of the retarding agent, if present, should be included as input parameters due to their significant influence on strength development, while the importance of aggregate type was emphasised in [27].
Besides estimating the compressive strength of concrete, Yoon et al. [32] focus on estimation of initial chord elastic modulus (Ei) and static modulus of elasticity (Est). Behnood et al. [18,21,31] focused their research on estimating various mechanical parameters of concretes with waste materials. In [18], the authors predicted the compressive strength of concrete with silica fume based on the measured UPV, whereas [21] focuses on the development of a predictive model for concrete incorporating waste foundry sand, addressing not only the compressive strength of the concrete but also other key mechanical properties, including the modulus of elasticity, flexural strength, and splitting tensile strength. Similarly, in [31], the authors develop a model for estimation of splitting tensile strength of fibre-reinforced concrete, where compressive strength was estimated as the most influential factor. Furthermore, Golafshani and Behnood [23,24,25] estimated compressive strength and optimised the mixture design of silica fume concrete [23], where cement, water, and silica fume amount, as well as specimen age, proved to be the most significant input parameters [23]. The elasticity modulus of recycled aggregate concrete was also estimated in [24,25]. It was proven that the most significant parameters are w/c ratio, fine-total aggregate ratio, and compressive strength [24], and that ANN and support vector regression (SVR) employ the best fitting results [25].
To the best of our knowledge, predictive models are very important in the practical application of materials. Developing a reliable model requires a large database. It has been shown that reliable models of the mechanical properties of concrete can be developed based on its constituents, certain measured mechanical properties, or a combination of both. Emphasis is placed on the use of non-destructive testing methods, with particular attention to the accuracy of the tests performed. Novel cement-based materials usually include some waste material with different characteristics, usually different elasticity properties, whose effect on mechanical properties, especially elastic ones, should be extensively analysed.
The presented literature provides in-depth discussion of concrete properties estimation using artificial intelligence tools. Regarding low-strength concrete or cement-stabilized material, there are very few studies available. Primarily, it has been demonstrated that by using neural networks it is possible to develop a reliable model for predicting the compressive strength of lightweight concrete [33]. Likewise, ultrasonic pulse velocity proved to be a relevant input parameter for predicting compressive strength [34]. Furthermore, higher accuracy of the neural network (NN) model compared to the regression model was established in the prediction of the compressive strength of lightweight concrete with steel fibers [35]. As shown, the available literature on low-strength concretes and cement-stabilized materials addresses only the prediction of compressive strength using neural networks. Considering the significant differences in the behaviour of these materials compared to structural concrete, a notable research gap has been identified. Specifically, due to the differences in material behavior, general conclusions related to concrete cannot be directly applied to low-strength concretes, but they can serve as a foundation for further research. When it comes to cement-stabilized materials, the relevant literature provides examples of neural networks being used to predict the properties of stabilized clay materials [36], in which authors proposed a methodology which could be relevant for other research fields. However, cement-stabilized materials have been truly neglected.
The aim of this study is to develop a model of the mechanical properties of a cement-stabilised base layer incorporating waste rubber, using neural networks. The model development will include the material constituents and their proportions, as well as the measured mechanical properties of the material. In addition, the statistical significance of individual parameters will be analysed as valuable information for the development of future models and predictions. The application of the developed models is focused on predicting the mechanical properties of a cement-stabilized base course with the addition of granulated rubber.

2. Materials and Methods

2.1. Laboratory Test

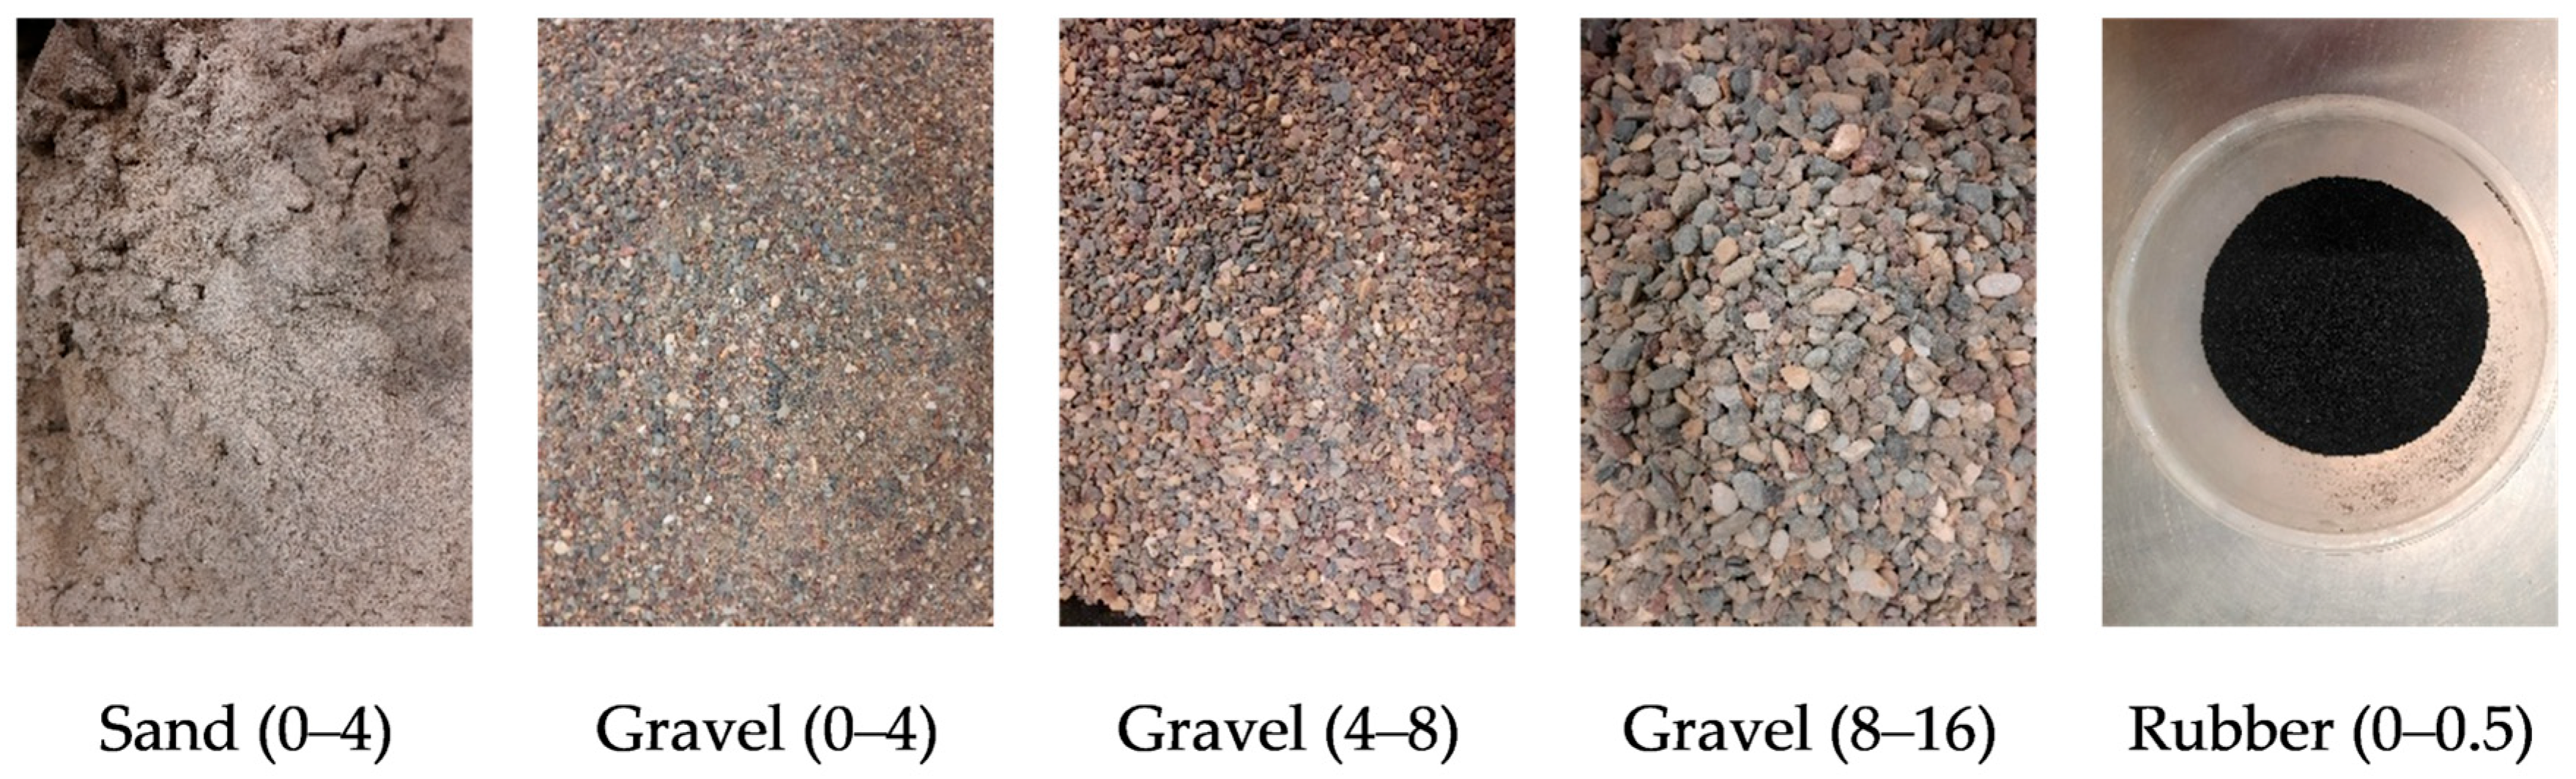
The database for this research is adopted from our previous work (31), where 15 mixtures of cement-stabilised base course (CBC) with the addition of waste rubber were tested. The mixtures are composed of gravel (0–4, 4–8, 8–16 mm) from the Sava river and sand from the Drava river (0–2 mm), while rubber (0–0.5 mm) was used as volumetric replacement for sand in amounts of 10%, 20%, 30% and 40%. The rubber replacement corresponds to about 1%, 2%, 3% and 4% of mixture mass. Constituents are presented in Figure 1. As a binding agent, Portland cement of grade 32.5R was used in amounts of 3%, 5% and 7%. Precise mixture composition and aggregate properties are described in [37]. The Proctor specimens were compacted by the vibrating hammer method [38], the applicability of which was discussed in [39]. The specimens were produced at optimum moisture content, wrapped in cling film and properly cured for 7, 28 and 90 days at 20 °C with relative humidity of 90% in a climatic chamber. Several mechanical property tests were conducted. Compressive and indirect tensile strength were tested (Brazilian test) in a compression machine according to [40,41]. Non-destructive test procedures were conducted on compressive strength test specimens. Specifically, the dynamic modulus of elasticity was determined by measuring p-wave velocity by ultrasonic pulse, as described in [42].
The static modulus of elasticity was also determined by the 3D DIC method, with specific vertical displacement of specific points on the outer surface of the specimens during the compressive testing as defined in paper [43].

2.2. Neural Networks

As can be concluded from the literature overview, models can be developed based on mechanical properties, mixture constituents, or both datasets. Tools such as neural networks provide numerous possibilities for data analysis. Given that the models are created based on laboratory specimens, their application is primarily focused on the mix design phase before field implementation. The fundamental premises of this study involve the development of six models, three of which are aimed at estimating the indirect tensile strength (ft) and three of which are aimed at estimating the static modulus of elasticity (Est). However, the study also demonstrated the need for four additional models in which the input parameters from the two initial groups were combined. This resulted in a total of 10 models.
Due to dynamic traffic loading, tensile stresses develop within the layered pavement structure and, once the material’s tensile strength is exceeded, cracking occurs [37,44]. On the other hand, the static modulus of elasticity is very difficult to measure precisely, particularly on curved specimens with high surface roughness [43], as is typical for cement-stabilised materials intended for use in pavement base layers. Furthermore, unlike the dynamic modulus of elasticity, the determination of the static modulus is carried out using a destructive method. Models ft_I and Est_I estimate both tensile strength and static modulus of elasticity based on measured ultrasonic pulse velocity (UPV) and compressive strength (fc). Compressive strength was used in the model in order to avoid the occurrence of experimental errors, which are characteristic when using only non-destructive methods [10]. Models ft_II and Est_II perform the estimation based on the input data related to the composition of the test mixture, which are the mass percentage of rubber and cement and the age of the specimens. Models ft_III and Est_III combine data from the previous two models for the same purpose. Models are developed based on the results for each specimen, not the average result of the mixture. This approach increases the number of data points and ensures that the model captures the experimental scatter often ignored by averaging.
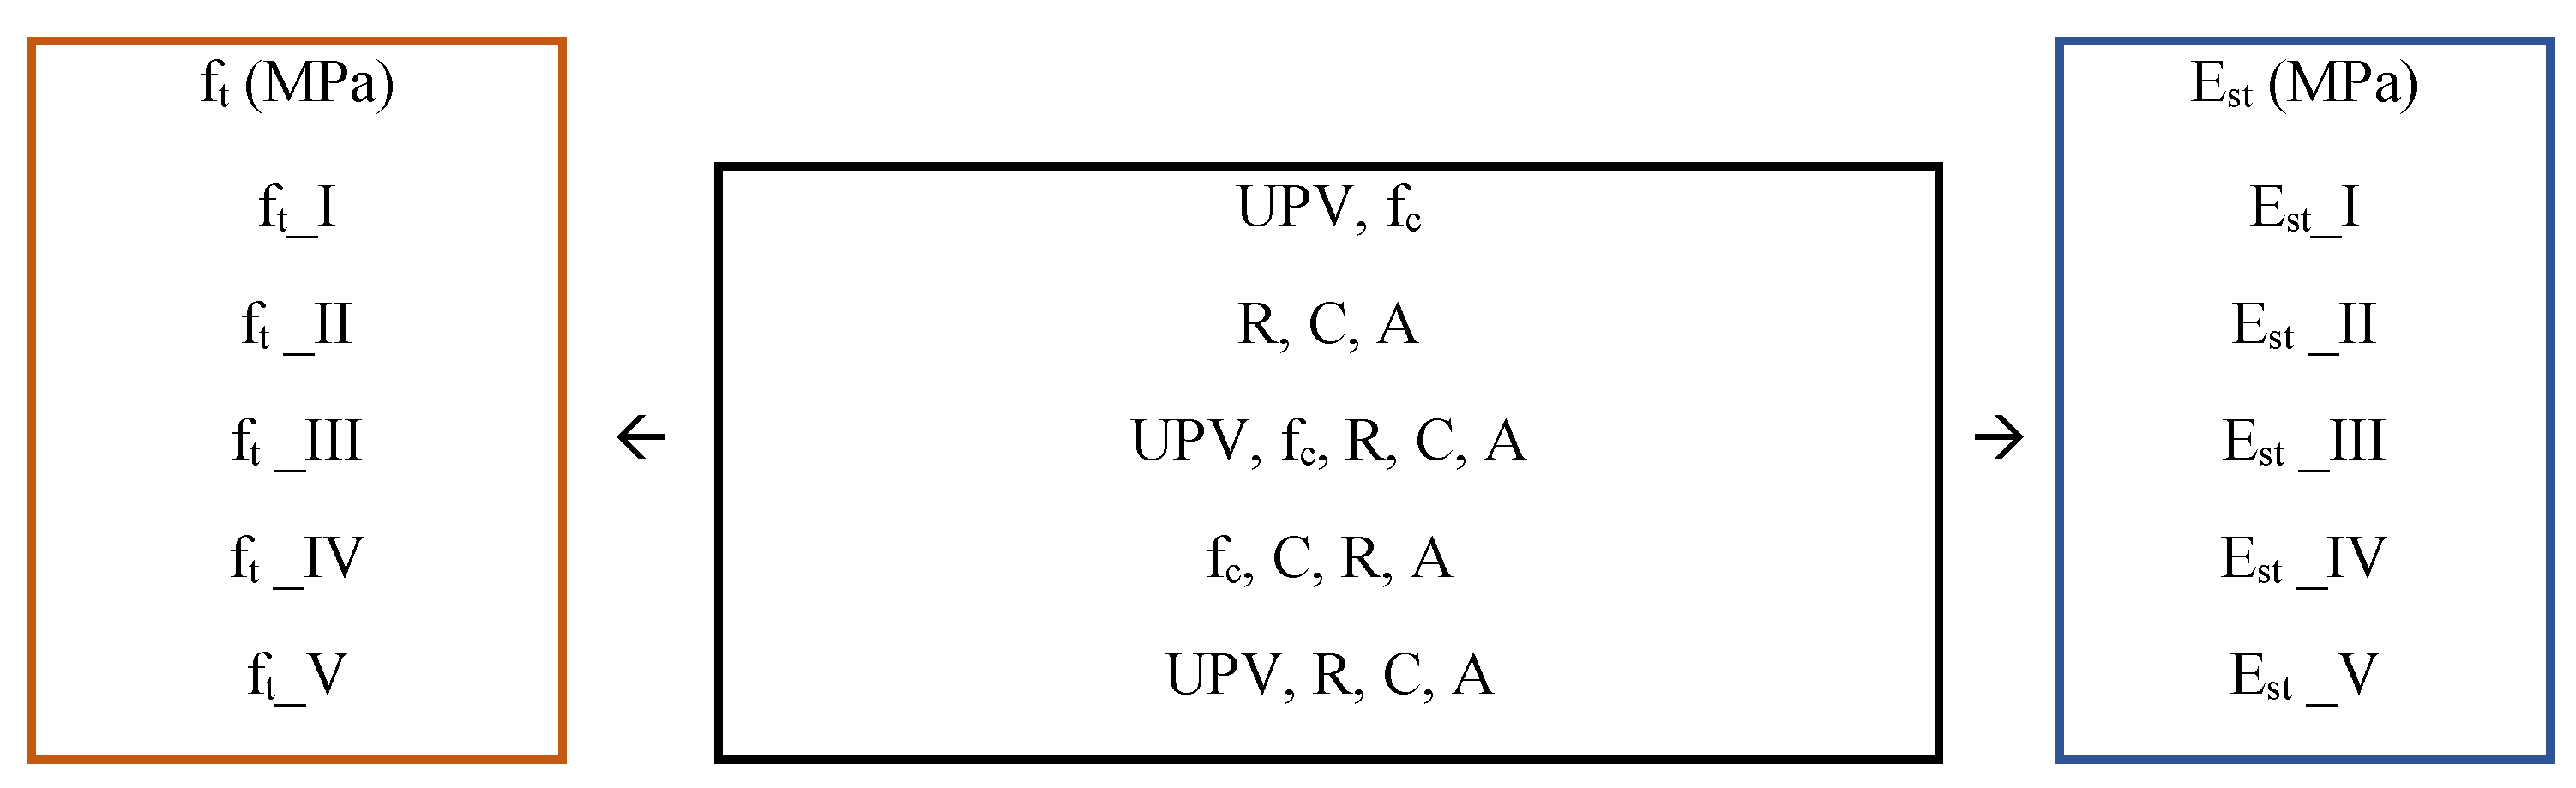
Models consist of three layers: an input layer in which the number of neurons corresponds to the number of input parameters, a hidden layer in which the number of neurons is determined dynamically during the training process and reflects the complexity of the model, and an output layer with a single neuron corresponding to the observed dependent variable. The input and output parameters are graphically presented in Figure 2. The network was trained on the entire dataset, which also served as the validation set. The number of neurons in the hidden layer was limited to 100. Using a larger number of neurons increases the risk of overtraining, which is why this limitation also serves as the stopping criterion for training.
The fc and UPV are input parameters for Models ft_I and Est_I. These values are measured on specimens of the same age; thus, the age of the specimens is not considered as an input parameter for this model. Furthermore, input parameters for Models ft_II and Est_II are rubber in mass proportion of whole aggregate (mass %) (1), cement in mass proportion of whole aggregate (mass %) (2), and specimen age (days). The last models used the input parameters from the first two models for estimation of ft and Est. In the ft_IV and Est_IV, and ft_V and Est_V models, fc and UPV are combined with R, C, and A input parameters:
m a s s   p r o p o r t i o n   o f   r u b b e r = m r u b b e r m a g g r e g a t e   ( g r a v e l + s a n d + r u b b e r ) × 100   ( % )
m a s s   p r o p o r t i o n   o f   c e m e n t = m c e m e n t m a g g r e g a t e   ( g r a v e l + s a n d + r u b b e r ) × 100   ( % )
Input and output parameters for model development are presented in [37]. To form the models, a cascade-correlation neural network was applied, using Neuroshell Predictor. In the early research on artificial neural networks, Fahlman and Lebiere [45] introduced an approach in which the network architecture is not predefined but instead develops during the learning process. Their cascade-correlation algorithm represented a major breakthrough because it allowed the number of neurons in the hidden layer to be determined dynamically, depending on the complexity of the problem and the residual error of the model. The core idea of the algorithm is that each new neuron is trained to maximize its correlation with the current network error, ensuring that the added unit provides the greatest possible improvement in performance. Once the neuron is fully trained, its incoming weights are “frozen,” meaning they are no longer adjusted during subsequent learning. This prevents degradation of previously learned relationships and enables the stable construction of increasingly complex architectures. The algorithm also employs a cascading connection scheme, in which each newly added neuron receives inputs not only from the input layer but also from all previously added hidden neurons, allowing hierarchical learning of progressively more complex representations. This approach marked a turning point in the development of adaptive neural network architectures because it enabled automatic construction of models without the need for manually specifying the number of hidden neurons—traditionally one of the most sensitive hyperparameters. The cascade-correlation algorithm paved the way for later methods that integrate architecture optimization with learning, including modern techniques for automated neural architecture search [46].

3. Results and Discussion

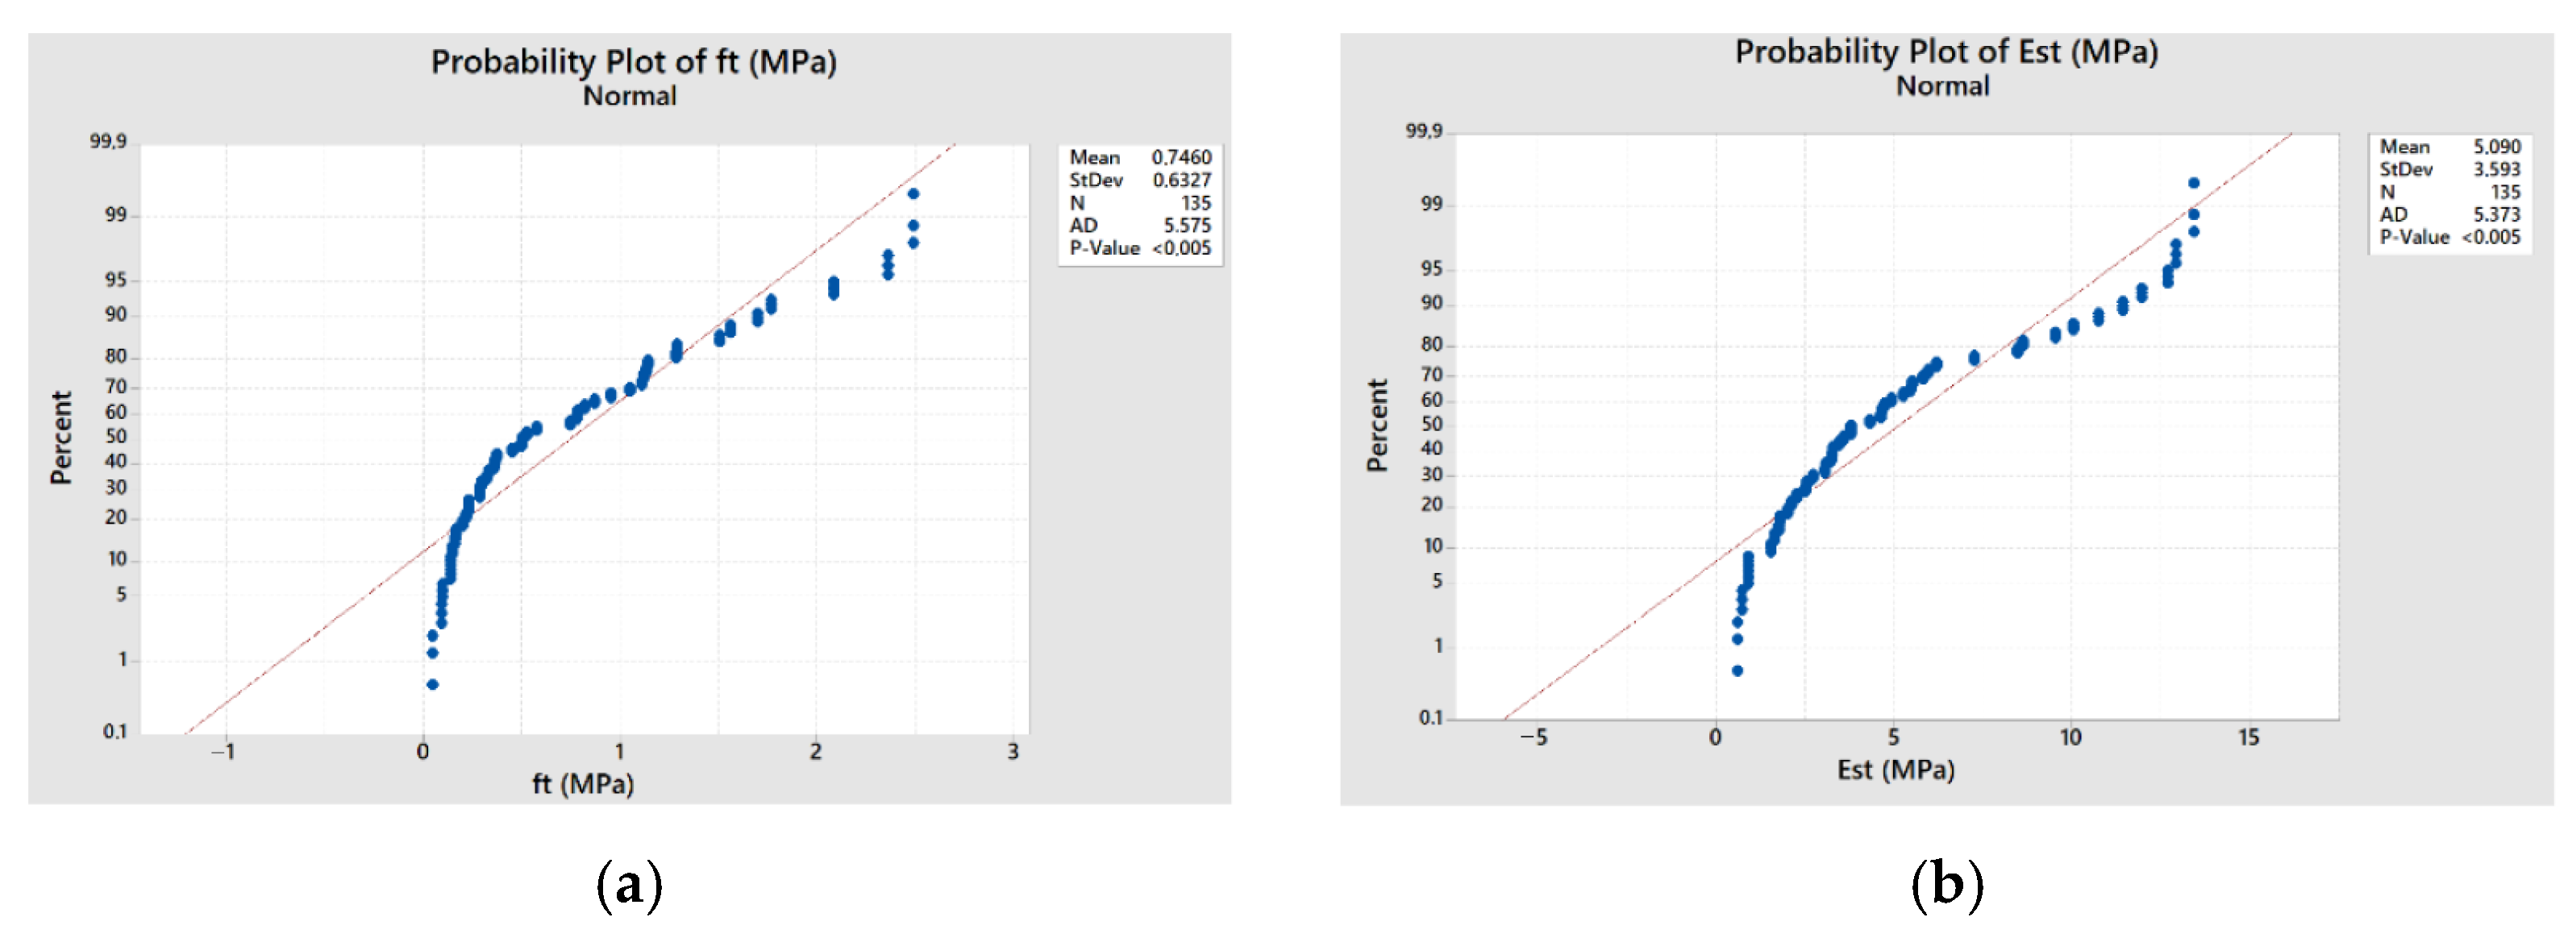
The database (presented in Appendix A) contains 135 measurements of indirect tensile strength (ft) and static modulus of elasticity (Est). Descriptive statistics of the dataset are presented in Table 1. For the observed dependent variables, Anderson–Darling tests of normality were performed. The null hypothesis states that the data follow a normal distribution, and the significance level was set to 0.05. Probability plots for each dependent variable are shown in Figure 3a,b. According to the results of the Anderson–Darling test (Table 1, Figure 3a,b), the p-values are lower than the specified threshold, leading to rejection of the null hypothesis. This indicates that none of the observed data groups follow a normal distribution.
In accordance with the results of the database analysis (Table 2), the non-parametric Spearman’s rho test was selected for the correlation analysis. Unlike the Pearson correlation coefficient, Spearman’s correlation does not require continuous-level data. The correlation matrix for indirect tensile strength and static modulus of elasticity is presented in Table 2.
As expected, rubber exhibits a negative correlation with all other mechanical properties and UPV, as an increase in rubber content leads to a decrease in strength and stiffness [37]. Furthermore, curing time and cement content are correlated only with mechanical properties and UPV, whereas mechanical characteristics and UPV show a correlation with all other input parameters. Additionally, since all obtained values reached statistical significance (p < 0.05), comprehensive models including all input parameters were established for both output variables.
Analysis conducted in this research resulted in ten models. The primary objective of the developed models, in addition to predicting mechanical and elastic properties—which is only possible for licensed users of the specific software in which the analysis was conducted—is to analyse the influence of individual parameters on the mechanical and elastic properties. The analysis of developed models is based on statistical parameters and relation between actual and predicted values, as well as analysis of residuals. The statistical results are presented in Table 3.
Results from Table 3 show that the optimal number of neurons in the hidden layer is lower for ft models than for Est models. In this regard, all models exhibit a very high coefficient of determination (0.936–0.995) and strong correlation (0.966–0.997). Similarly, the coefficient of determination increases with the number of input parameters, as expected, since this approach accounts for a greater number of factors influencing the observed outputs. Consequently, the correlation also increases. From a practical application standpoint, increasing the number of input parameters is not the desired approach. However, even though these parameters indicate a very high reliability of the developed models, considering that the models are not based on linear regression it is necessary to further analyse additional aspects of their performance.
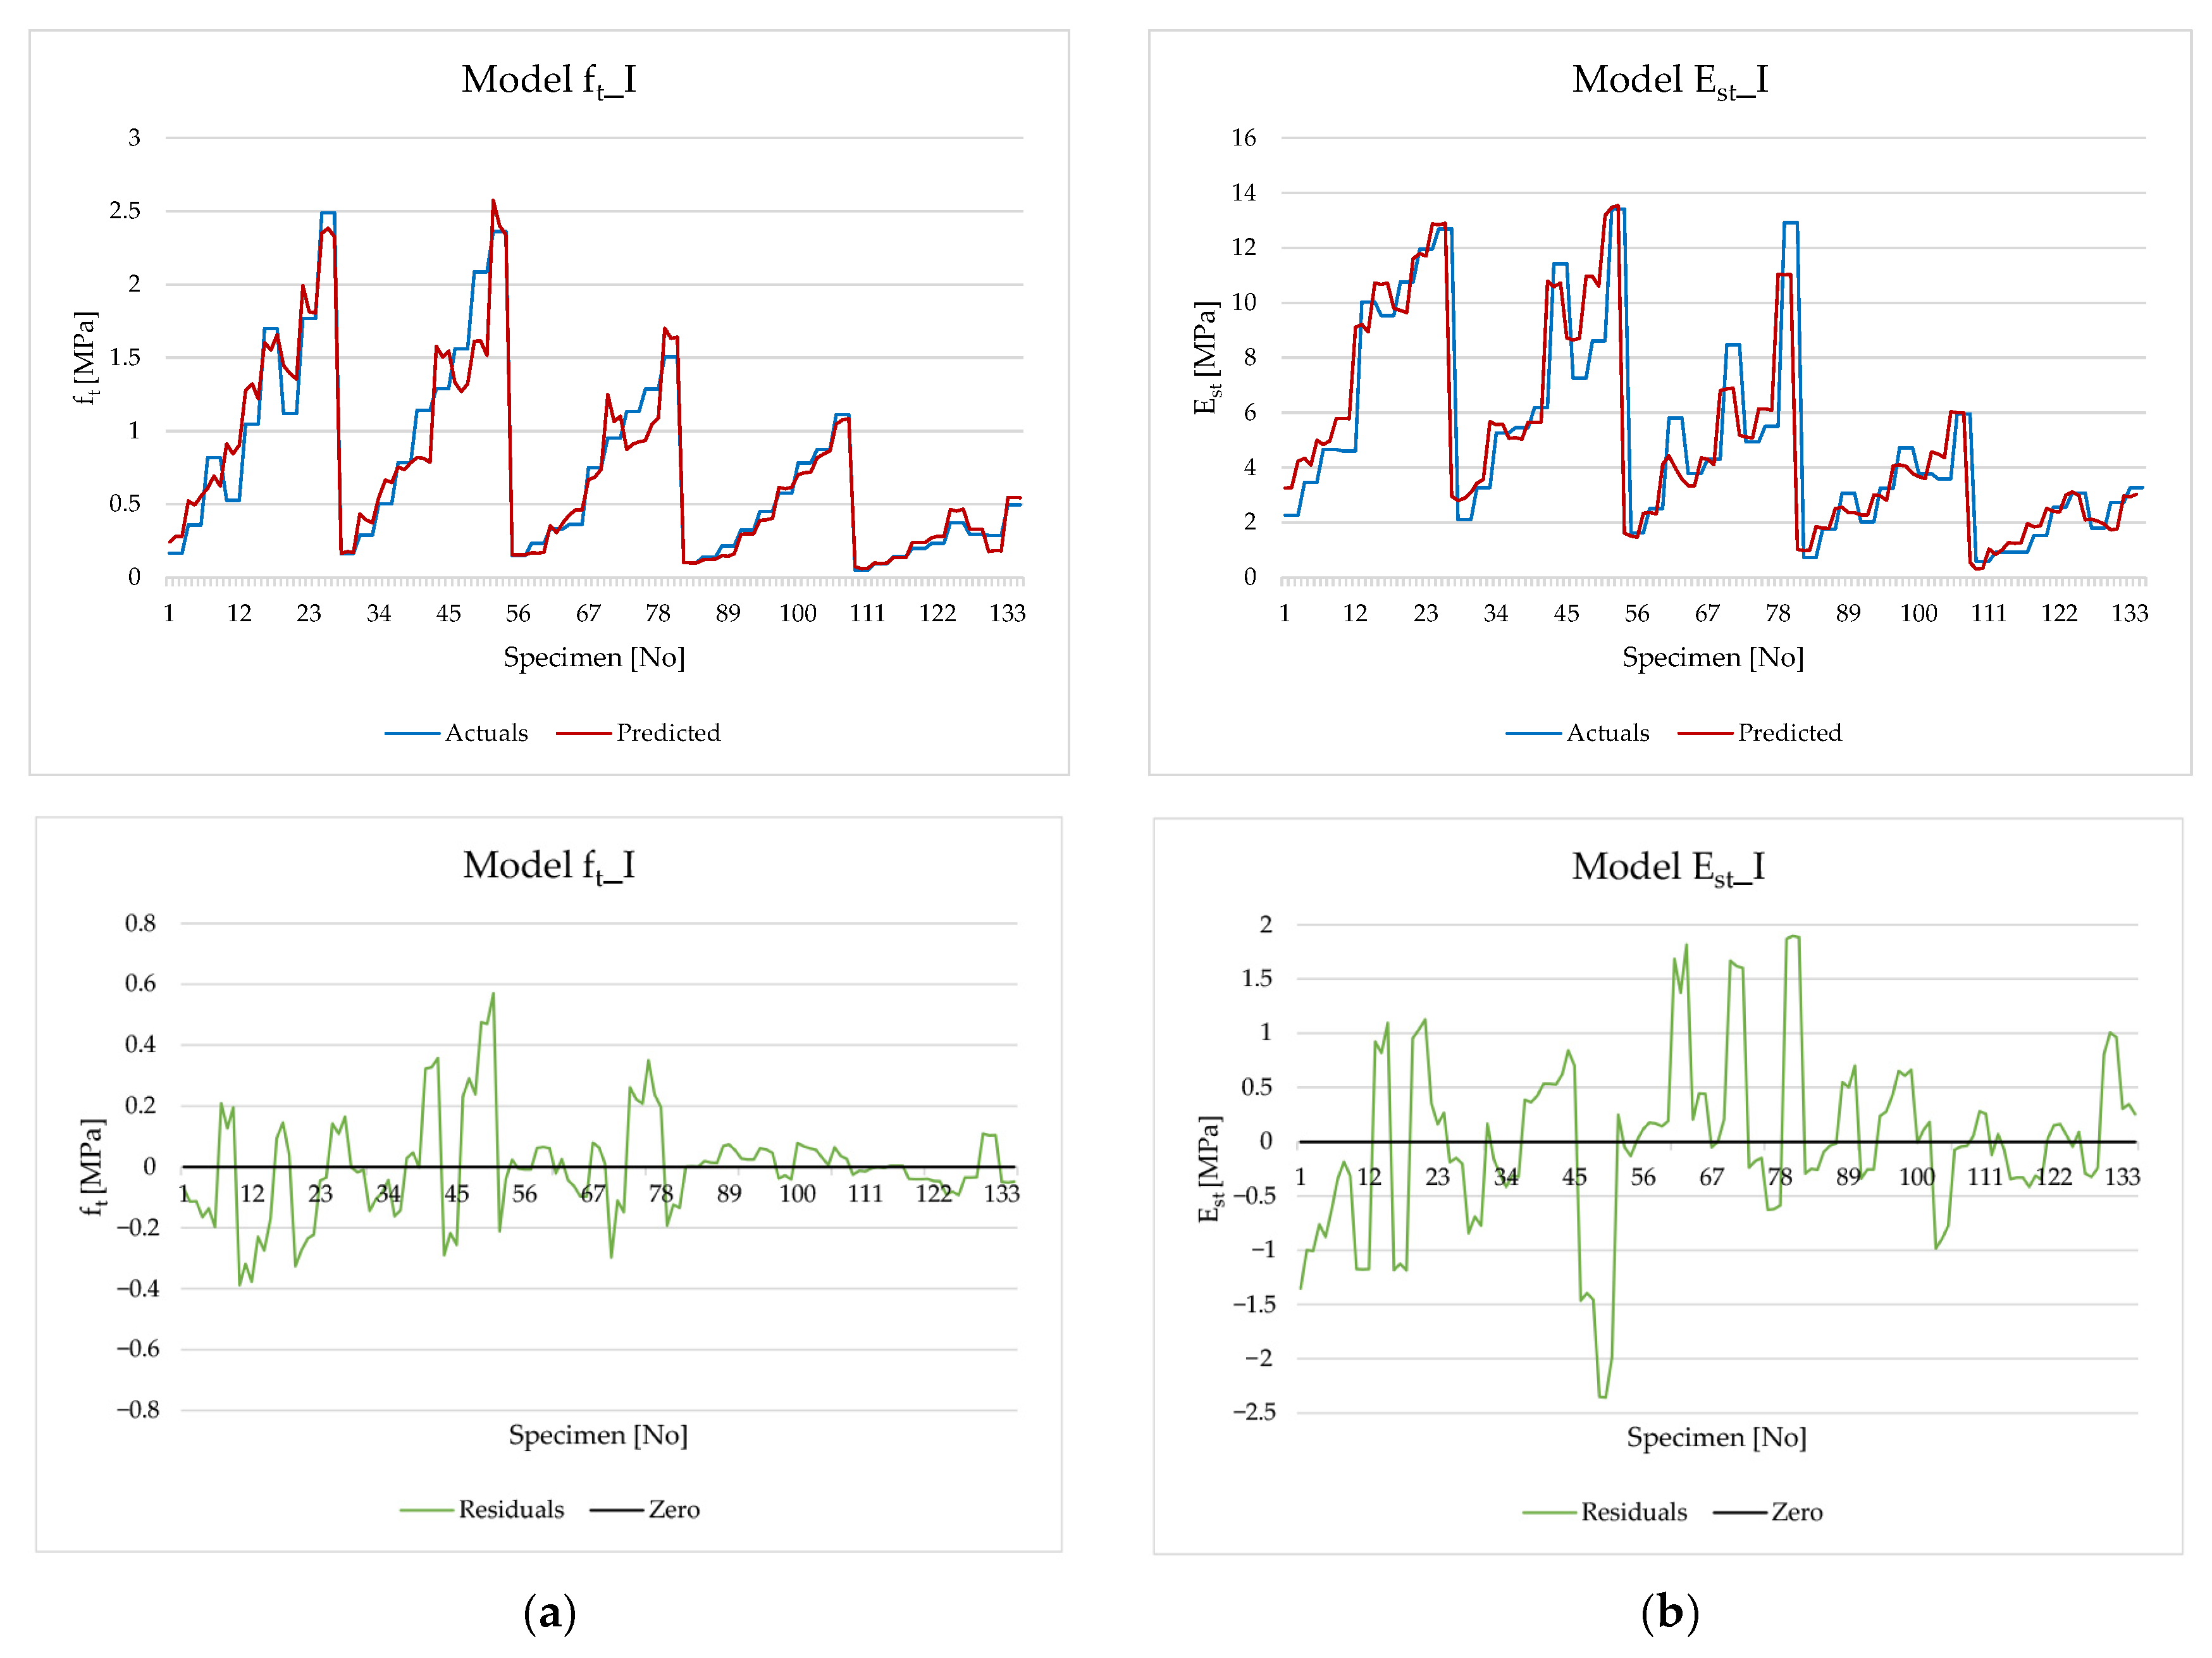
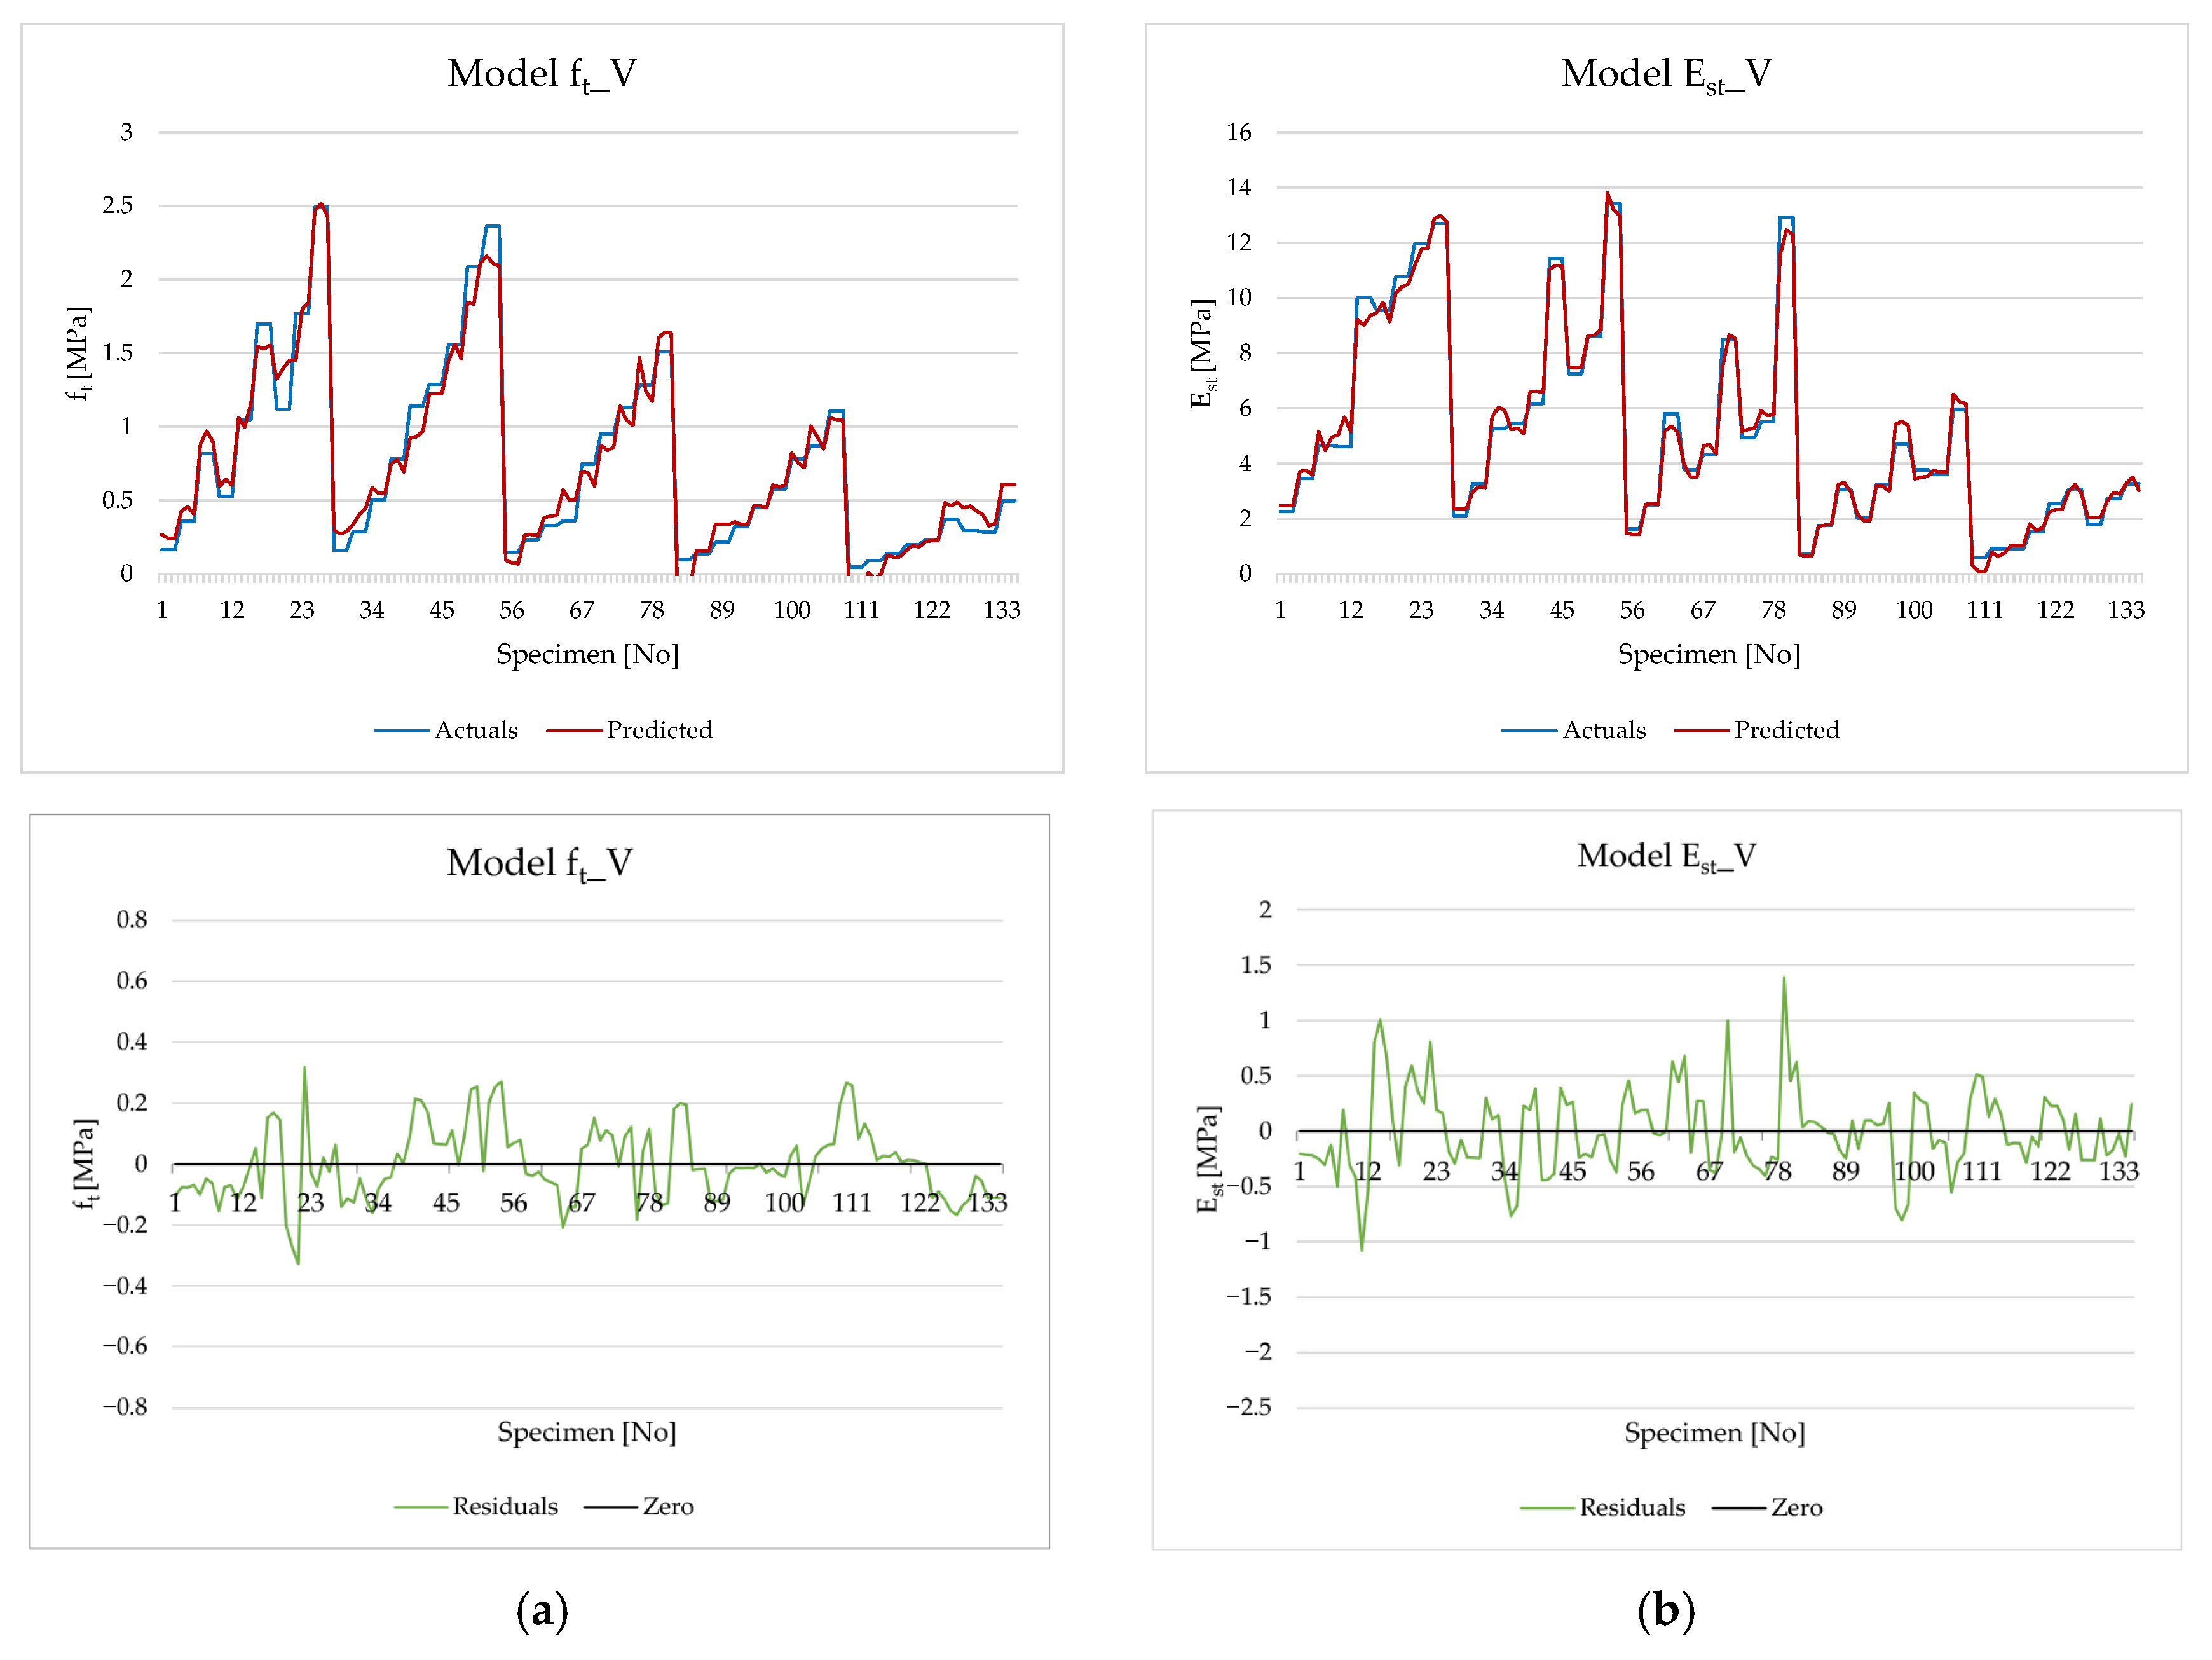
Figure 4, Figure 5, and Figure 6 provides a graphical representation of the actual and predicted ft and Est values, as well as their corresponding residuals. Models ft_I and Est_I exhibit poor agreement between the actual and predicted values, as indicated by the relatively high residuals. This effect is particularly evident in model Est_I, where residuals range from −2.5 MPa to 2.0 MPa—a considerable deviation given that the modulus of elasticity reaches up to 15 MPa (residuals amounting to about 20% of the modulus value). A similar pattern between residuals and indirect tensile strength values can be observed for model ft_I. Hence, the input parameters UPV and fc do not yield a reliable predictive model. The analysis of input parameter importance (Table 1) for model ft_I indicate that fc and UPV have comparable influence, with fc showing slightly higher importance (0.561) than UPV (0.439). Hence, in predicting the mechanical property (ft), the mechanical parameter (fc) proves to be more influential than the dynamic parameter (UPV). The high importance of fc for the prediction of ft of fibre-reinforced concrete is also stated in [31]. On the other hand, sensitivity analysis for model ft_II shows that fc has significantly higher importance (0.833) than UPV (0.167). Considering the fact that Est was measured in a static test during compression load, the importance of this parameter is clear.
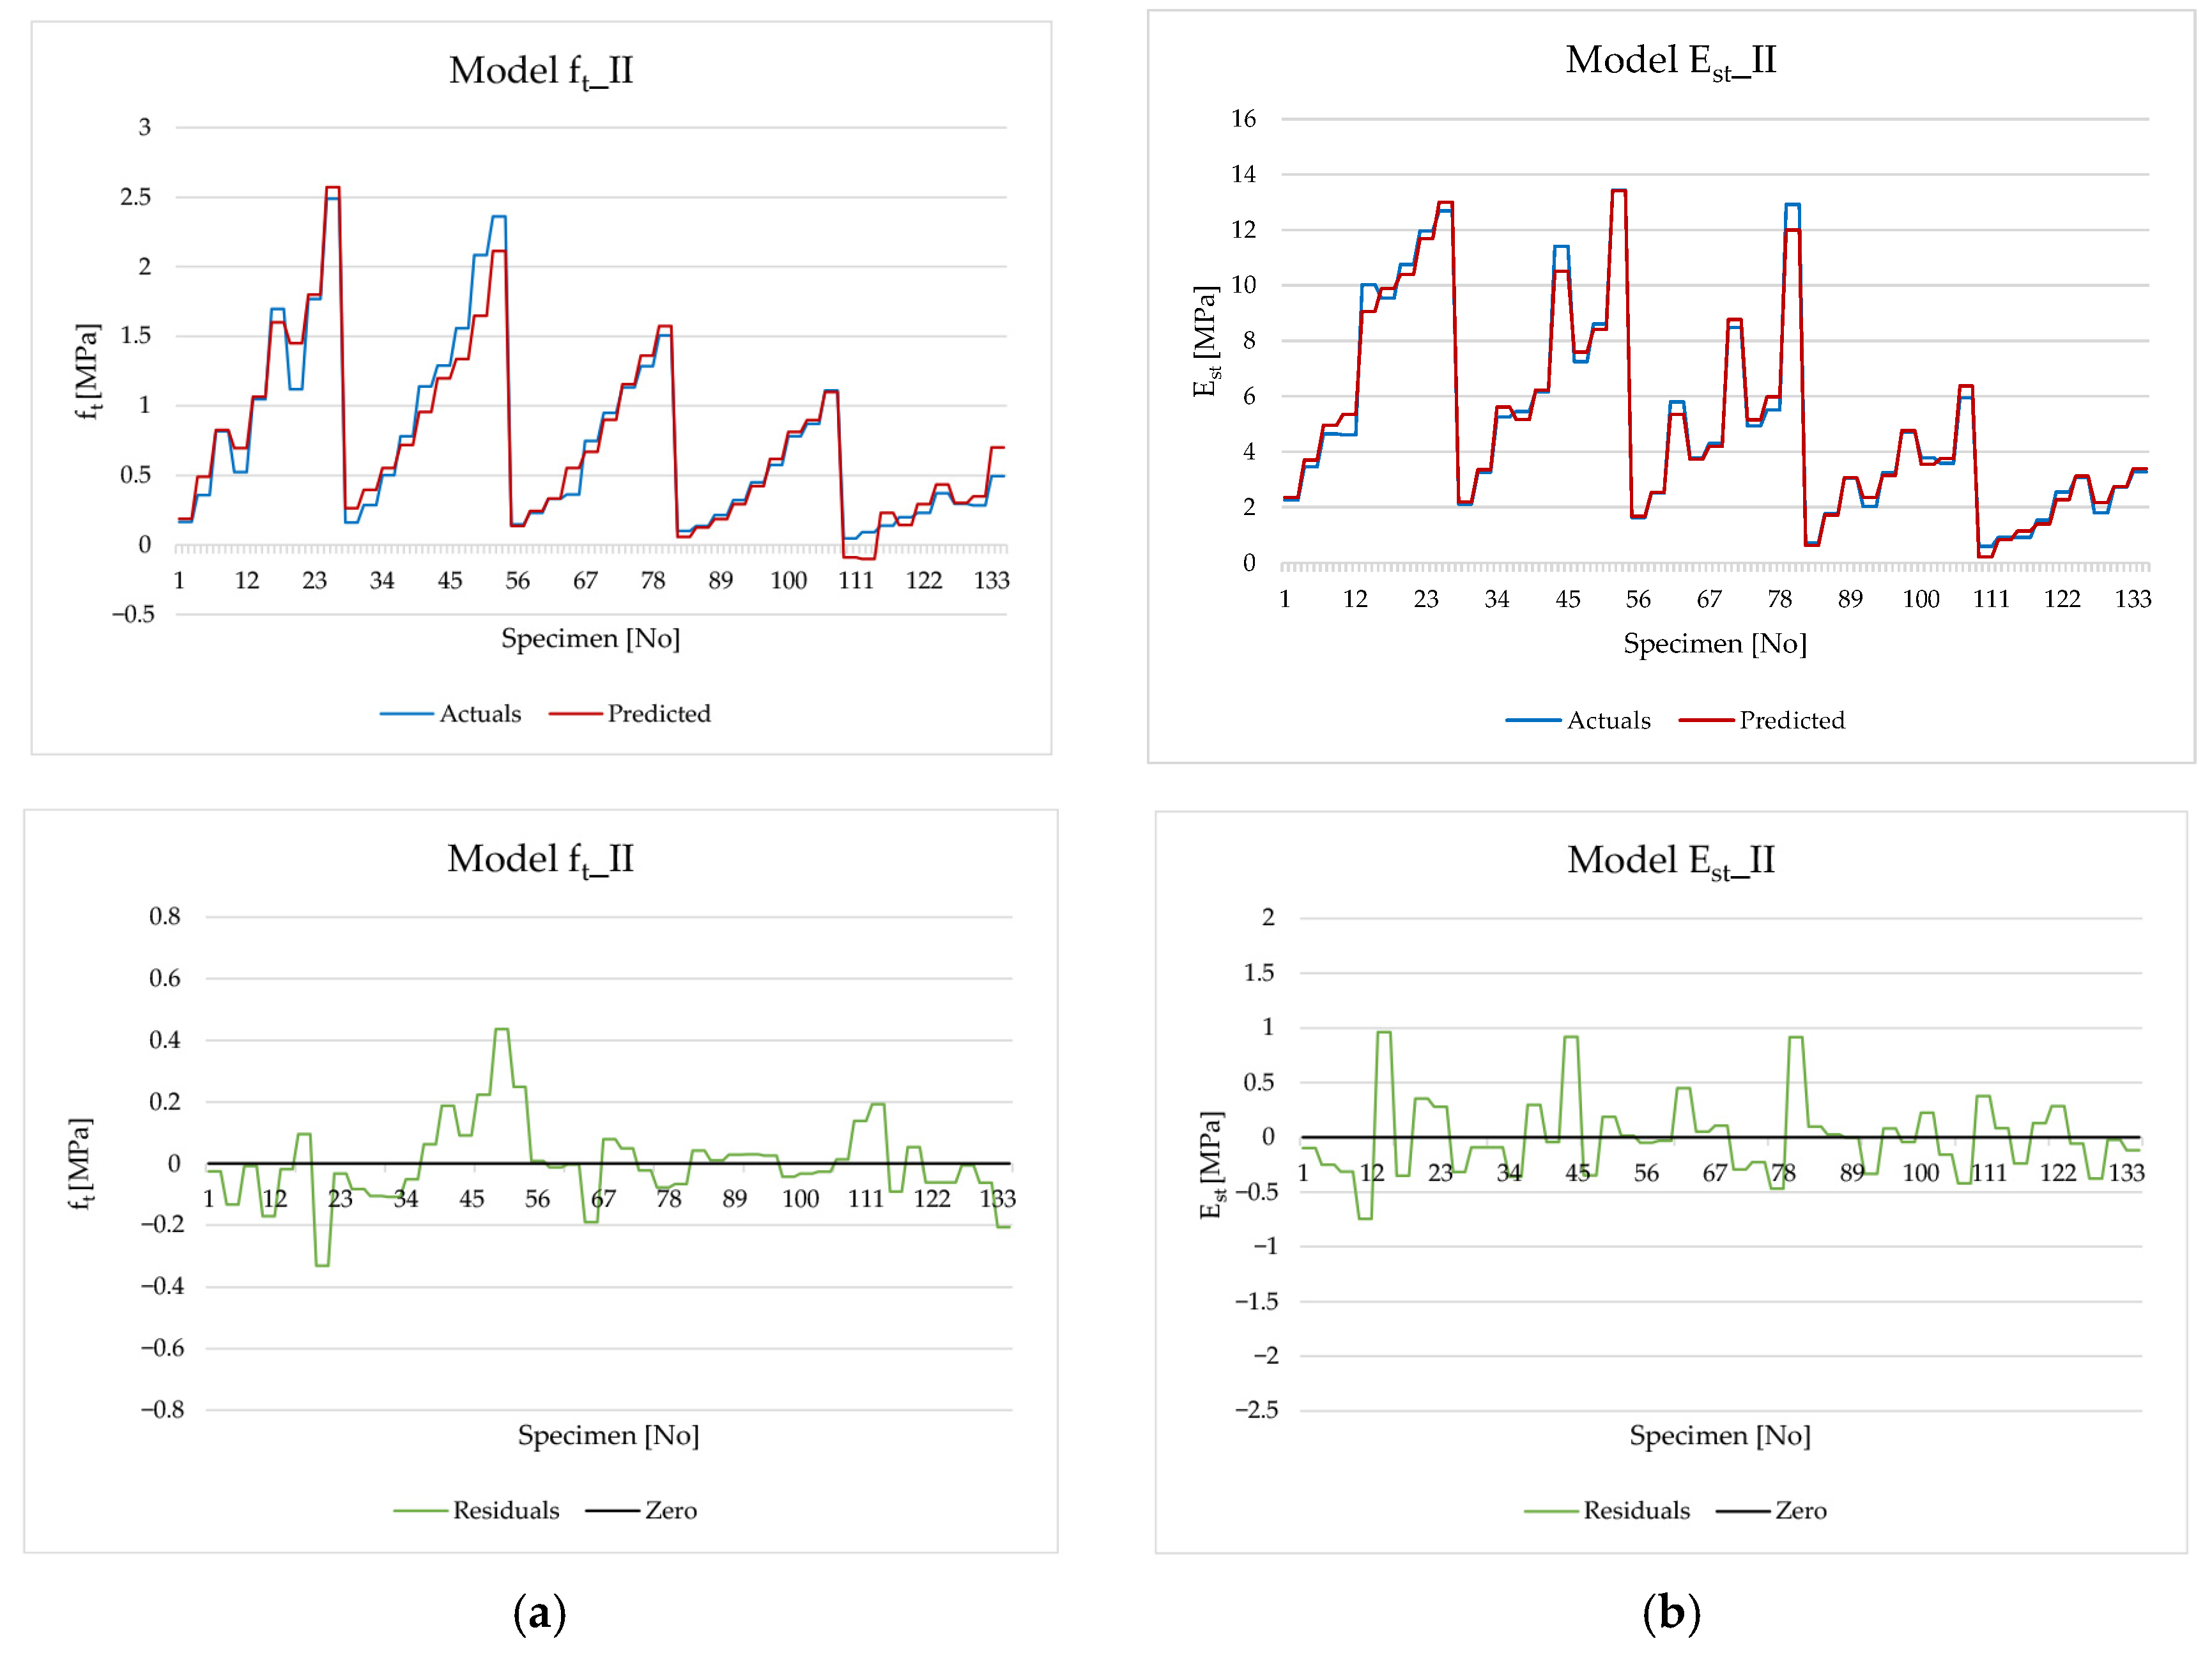
Furthermore, models ft_II and Est_II predict the ft and Est values based on the mixture composition. A visual inspection of the graphs presented in Figure 5a,b suggests that these models yield more reliable results than those previously analysed. The agreement between the actual and predicted values is much better, and the residuals are substantially lower. In model ft_II, the significance levels of the input parameters are as follows: cement content (0.535), specimen age (0.409), and rubber content (0.057). Accordingly, the development of tensile strength is primarily governed by the cement content and the specimen’s age, whereas the rubber content exerts a negligible effect on predicting this property. This is likely a result of the generally low proportion and variability of rubber compared to the amount of cement and curing time. Moreover, rubber primarily affects the increase in material ductility. Contrary, the input parameters of Model Est_II have significance as follows: specimen age (0.621), rubber content (0.315) and cement content (0.065). In this model, curing time again emerges as the most influential parameter, suggesting that specimen age has the strongest effect on the development of both mechanical and elastic properties of the material. The second most significant parameter is rubber. While previous laboratory studies made it difficult to quantify the contribution of rubber to mechanical and elastic performance, the present analysis clearly indicates that rubber plays a key role in the development of the material’s elastic properties. This finding applies to laboratory-produced specimens during the first 90 days of curing. It should be emphasized that this conclusion does not extend to significantly older specimens or to drilled cores.
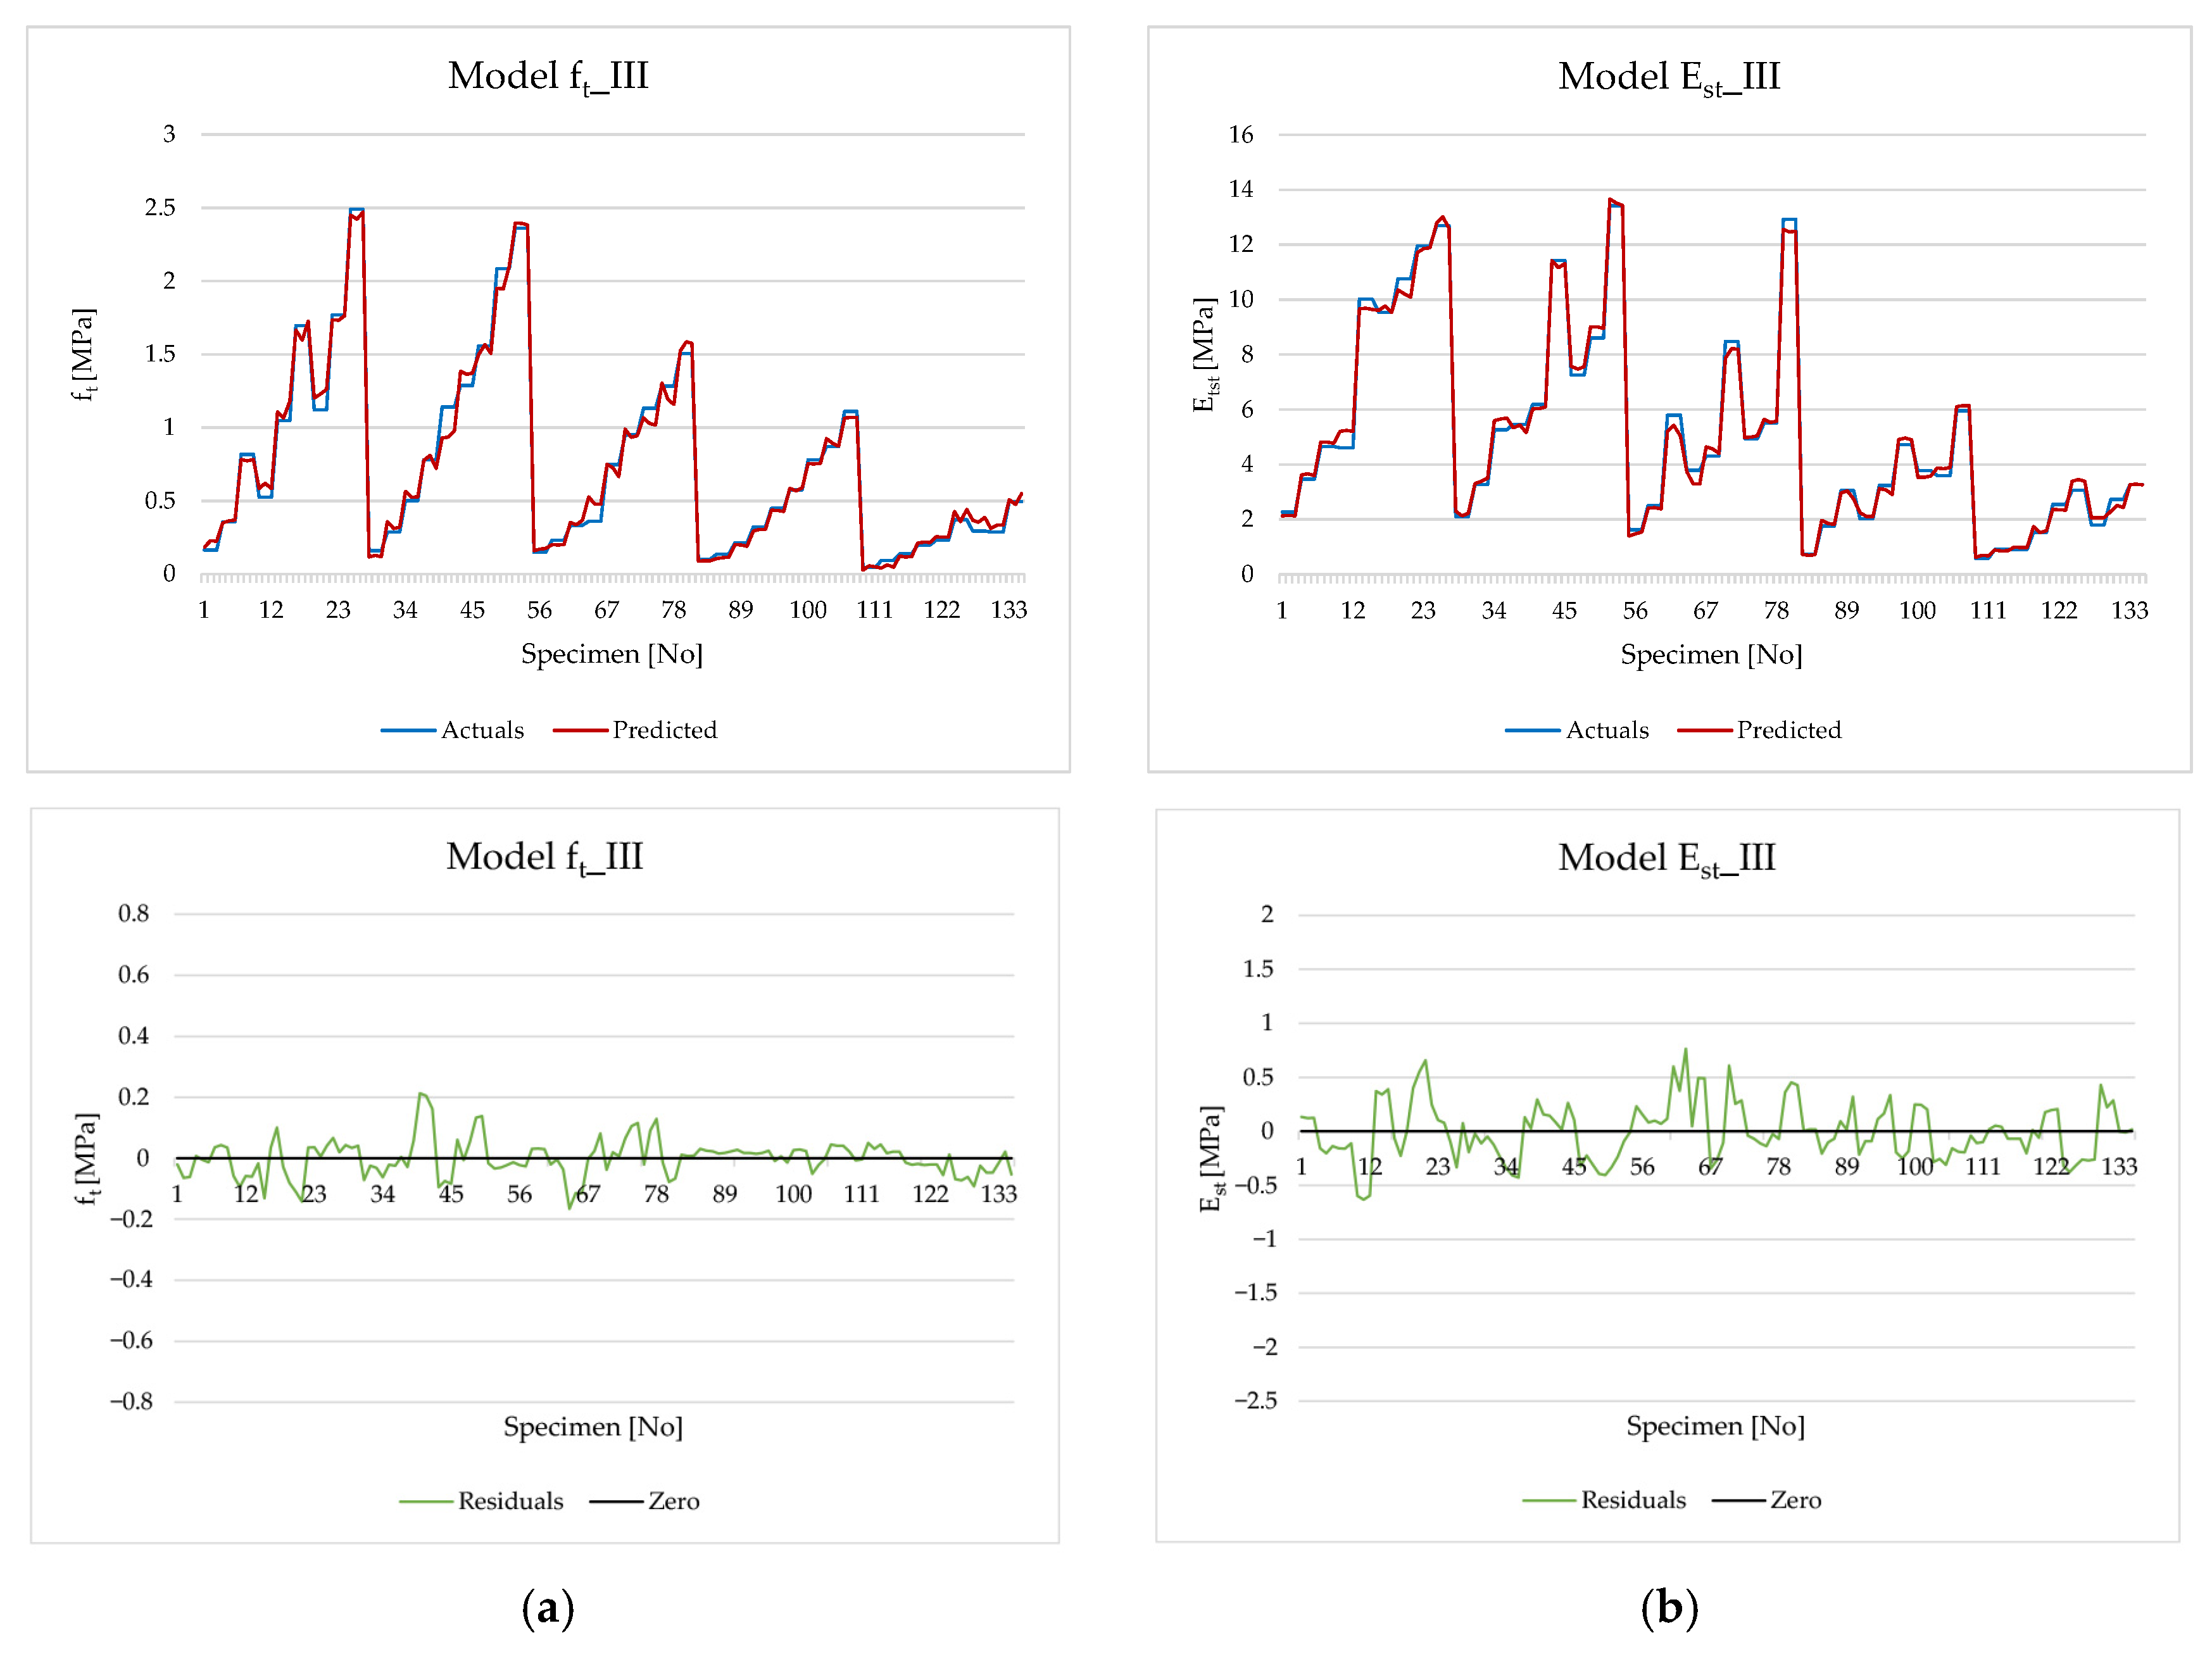
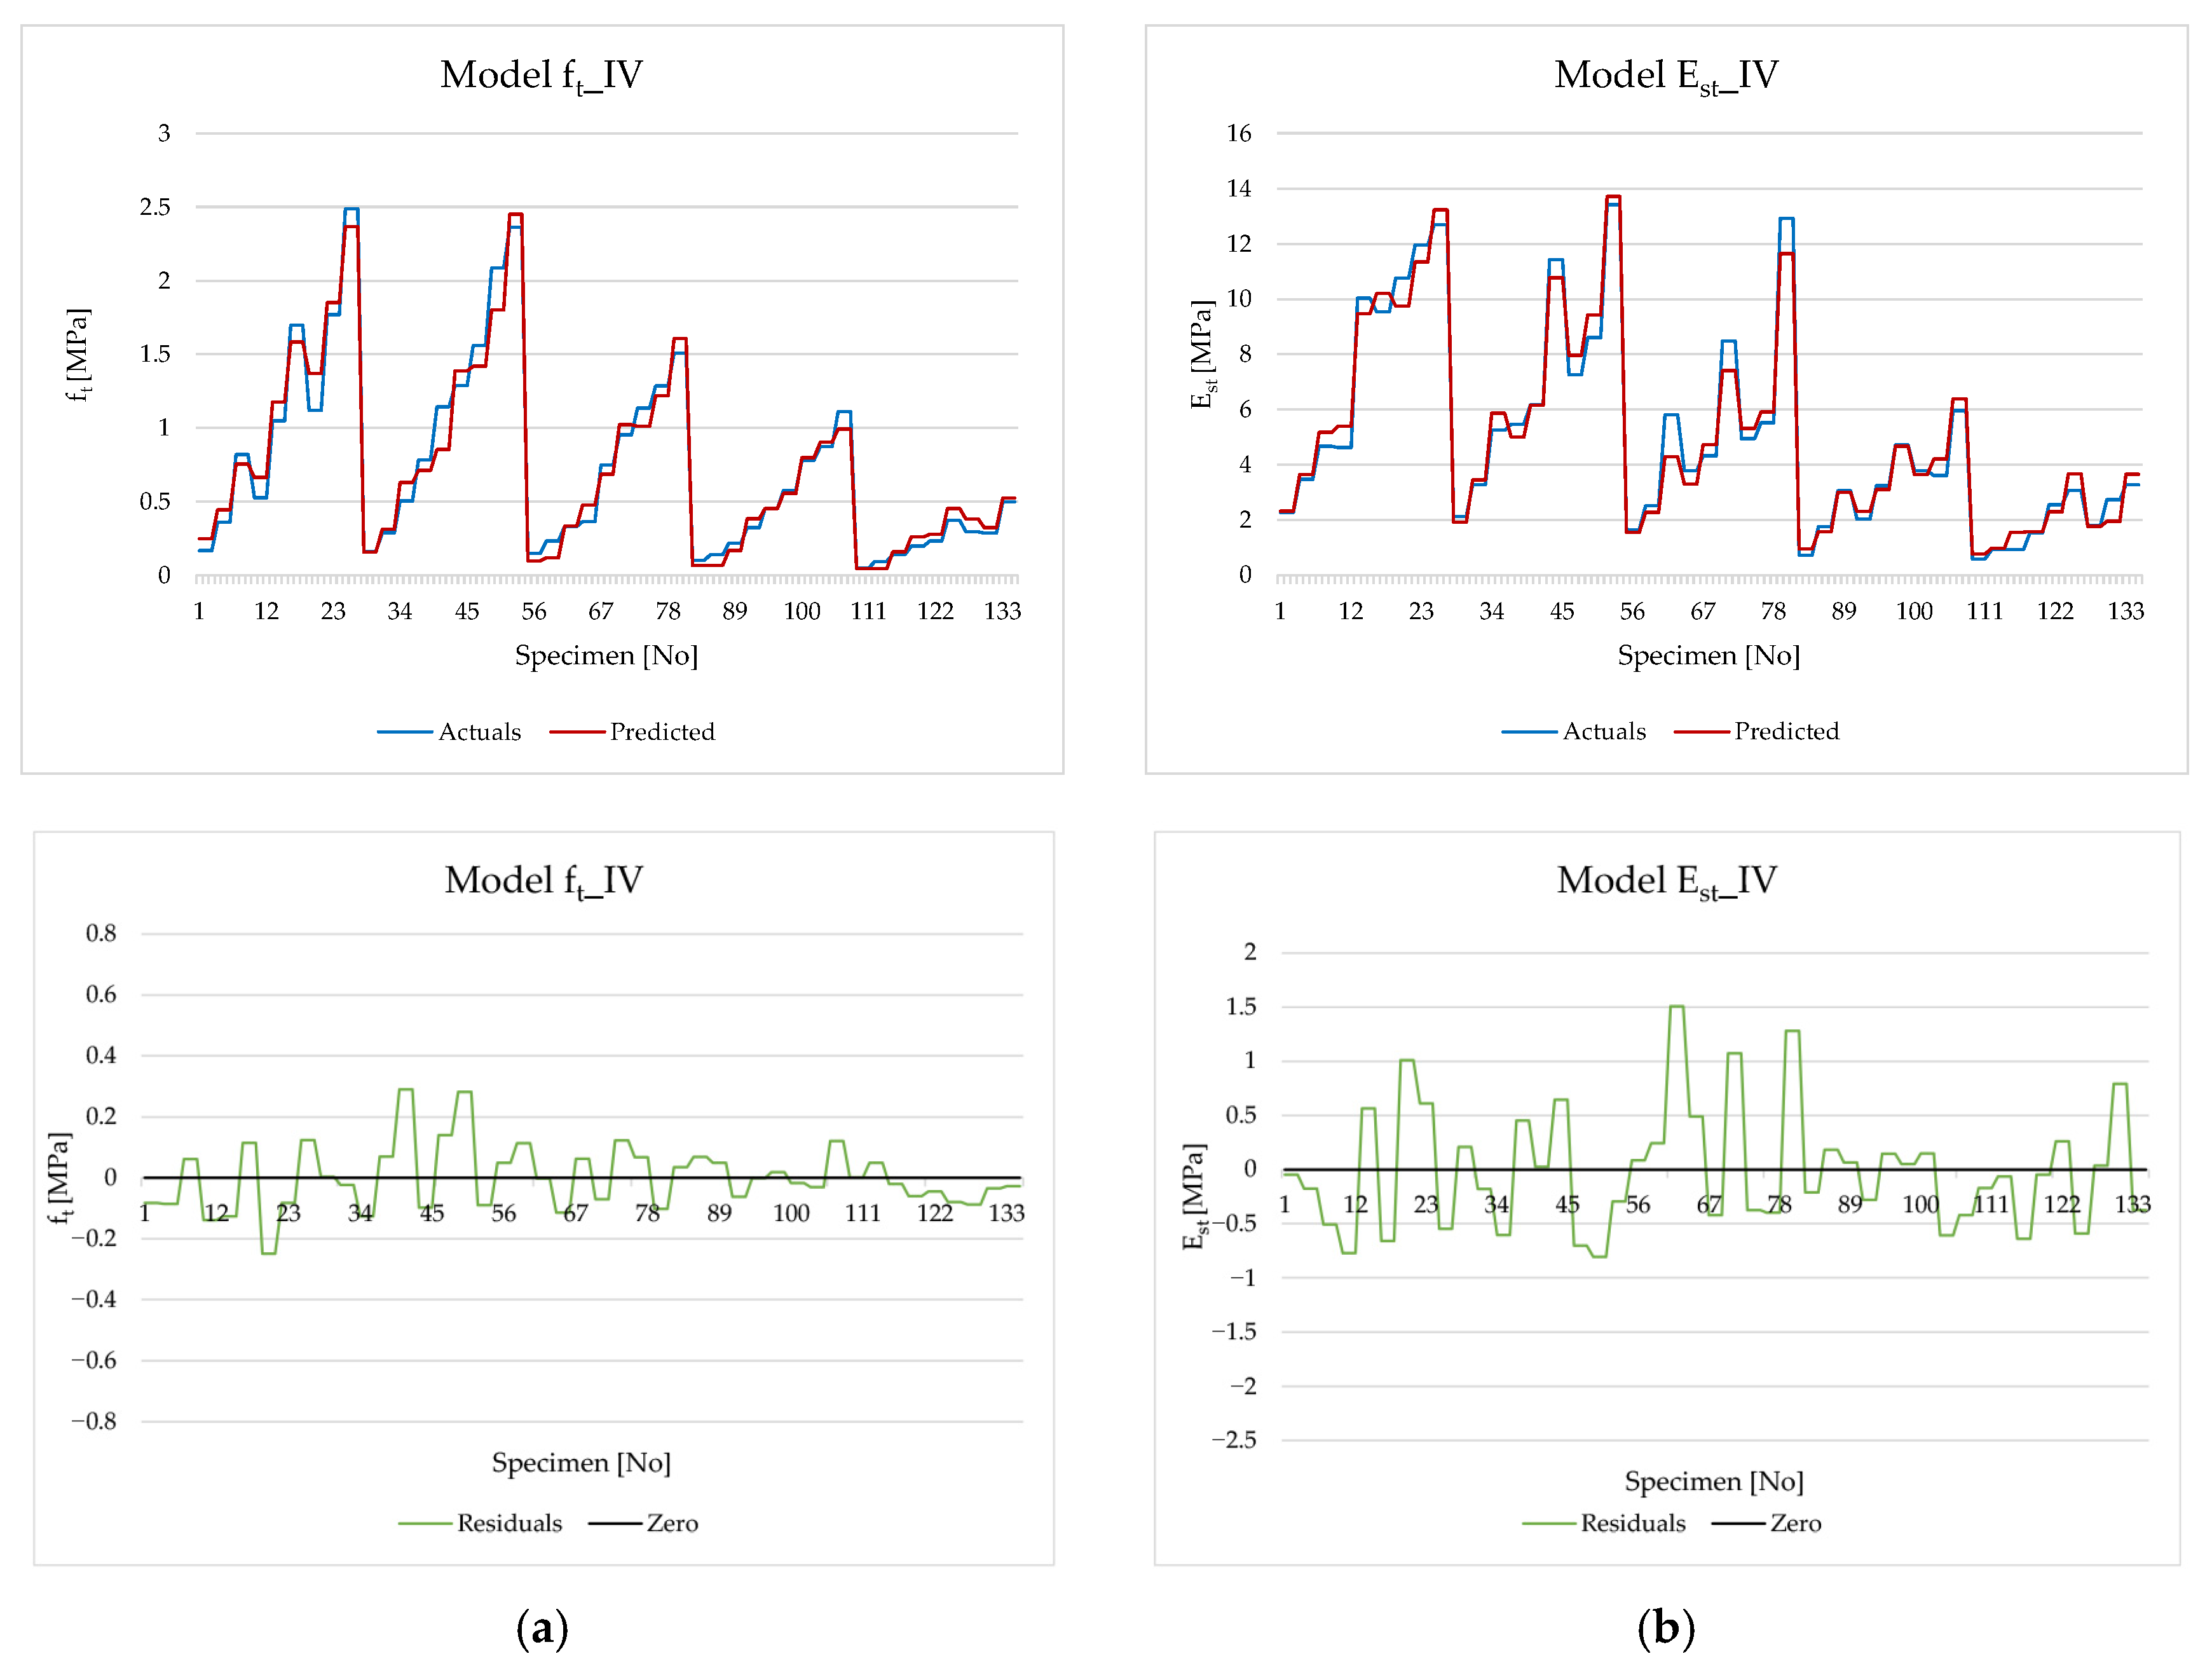
Finally, the models that consider all input parameters demonstrate the best agreement between actual and predicted values and, consequently, the smallest residuals. Furthermore, in both models ft_III and Est_III, the significance of the UPV input parameter remained nearly unchanged compared to models ft_I and Est_I (0.439/0.456 for model ft_III and 0.167/0.168 for model Est_III), while the significance of the fc parameter was distributed among the other input parameters. This confirms that compressive strength (fc) is an inherent outcome of the material composition and curing time, whereas UPV values are influenced by additional factors not analysed in this study. Such factors could include material inhomogeneity, the presence of voids in the specimens, the development of microcracks, and many others. Such results indicate the need to develop a fourth model in which UPV would be excluded as an input parameter, and the model would instead use the mixture composition and compressive strength as input parameters. To obtain a complete picture of the situation, a fifth model was also analysed in which fc was removed from the input data. Actual vs. predicted graphs, along with residual graphs, are presented in Figure 7 and Figure 8.
The statistical parameters of the final models show very similar results. They are slightly less accurate than the third model, which uses all parameters as inputs, as is to be expected.
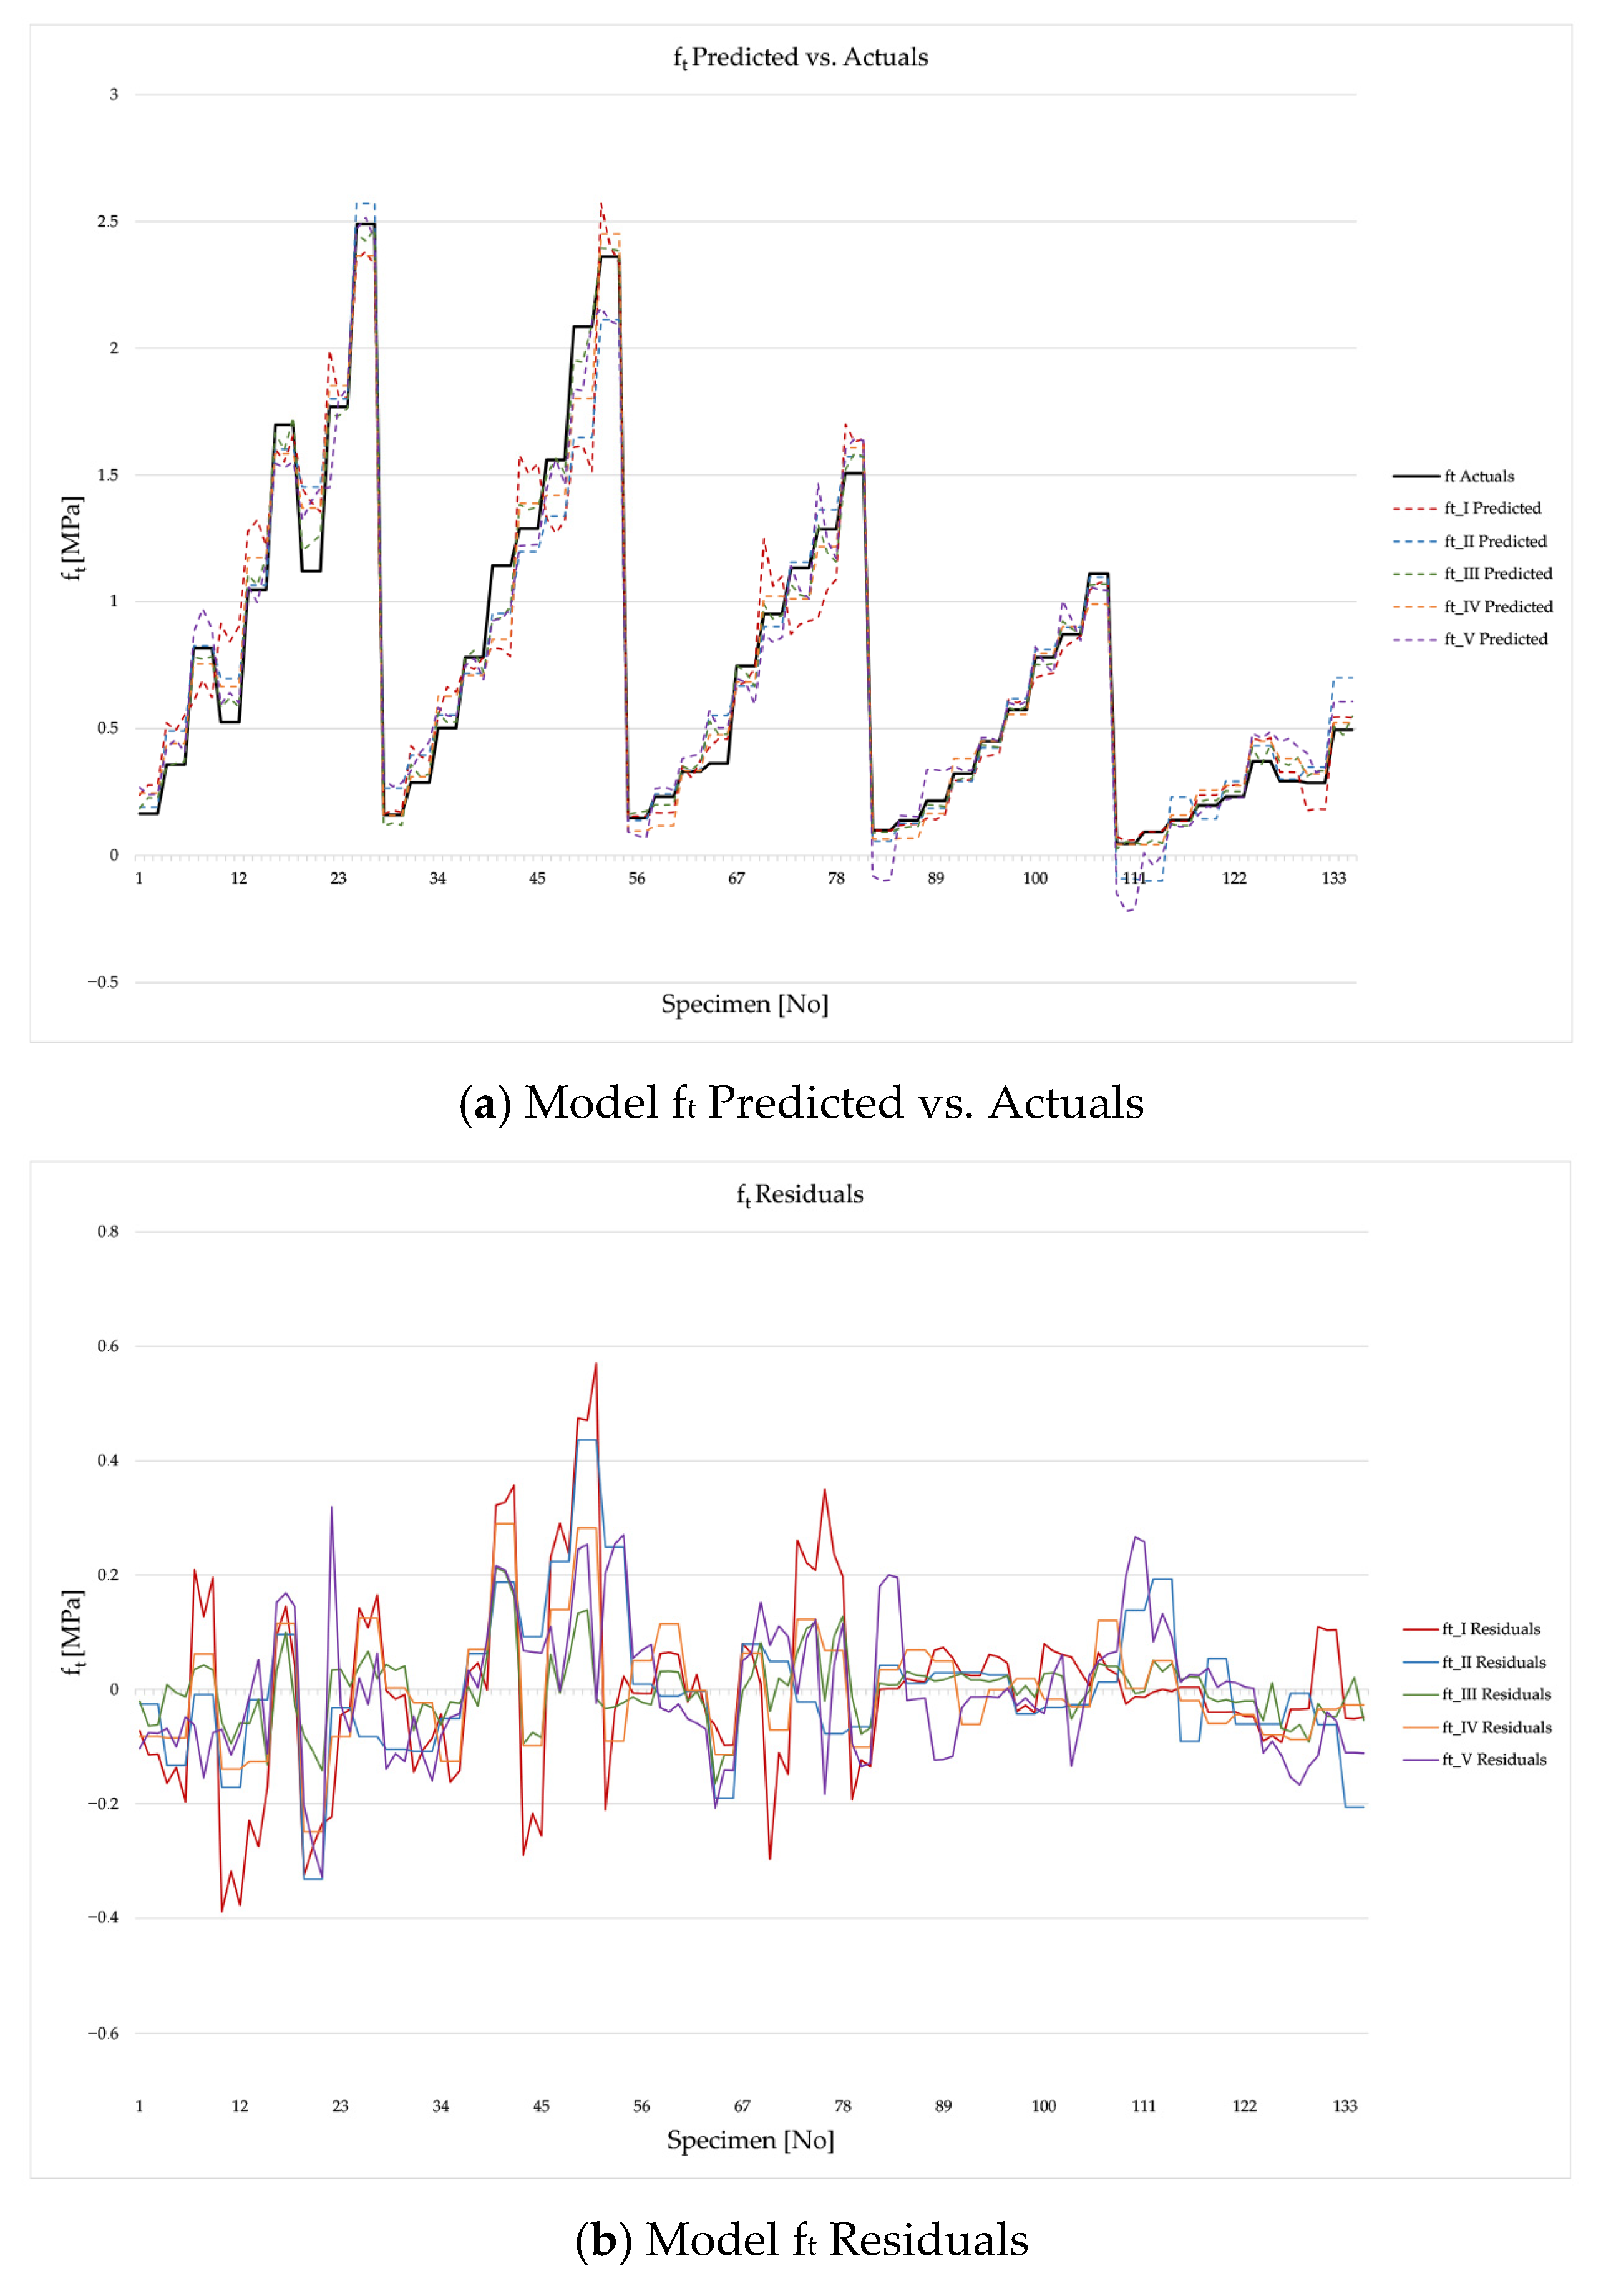
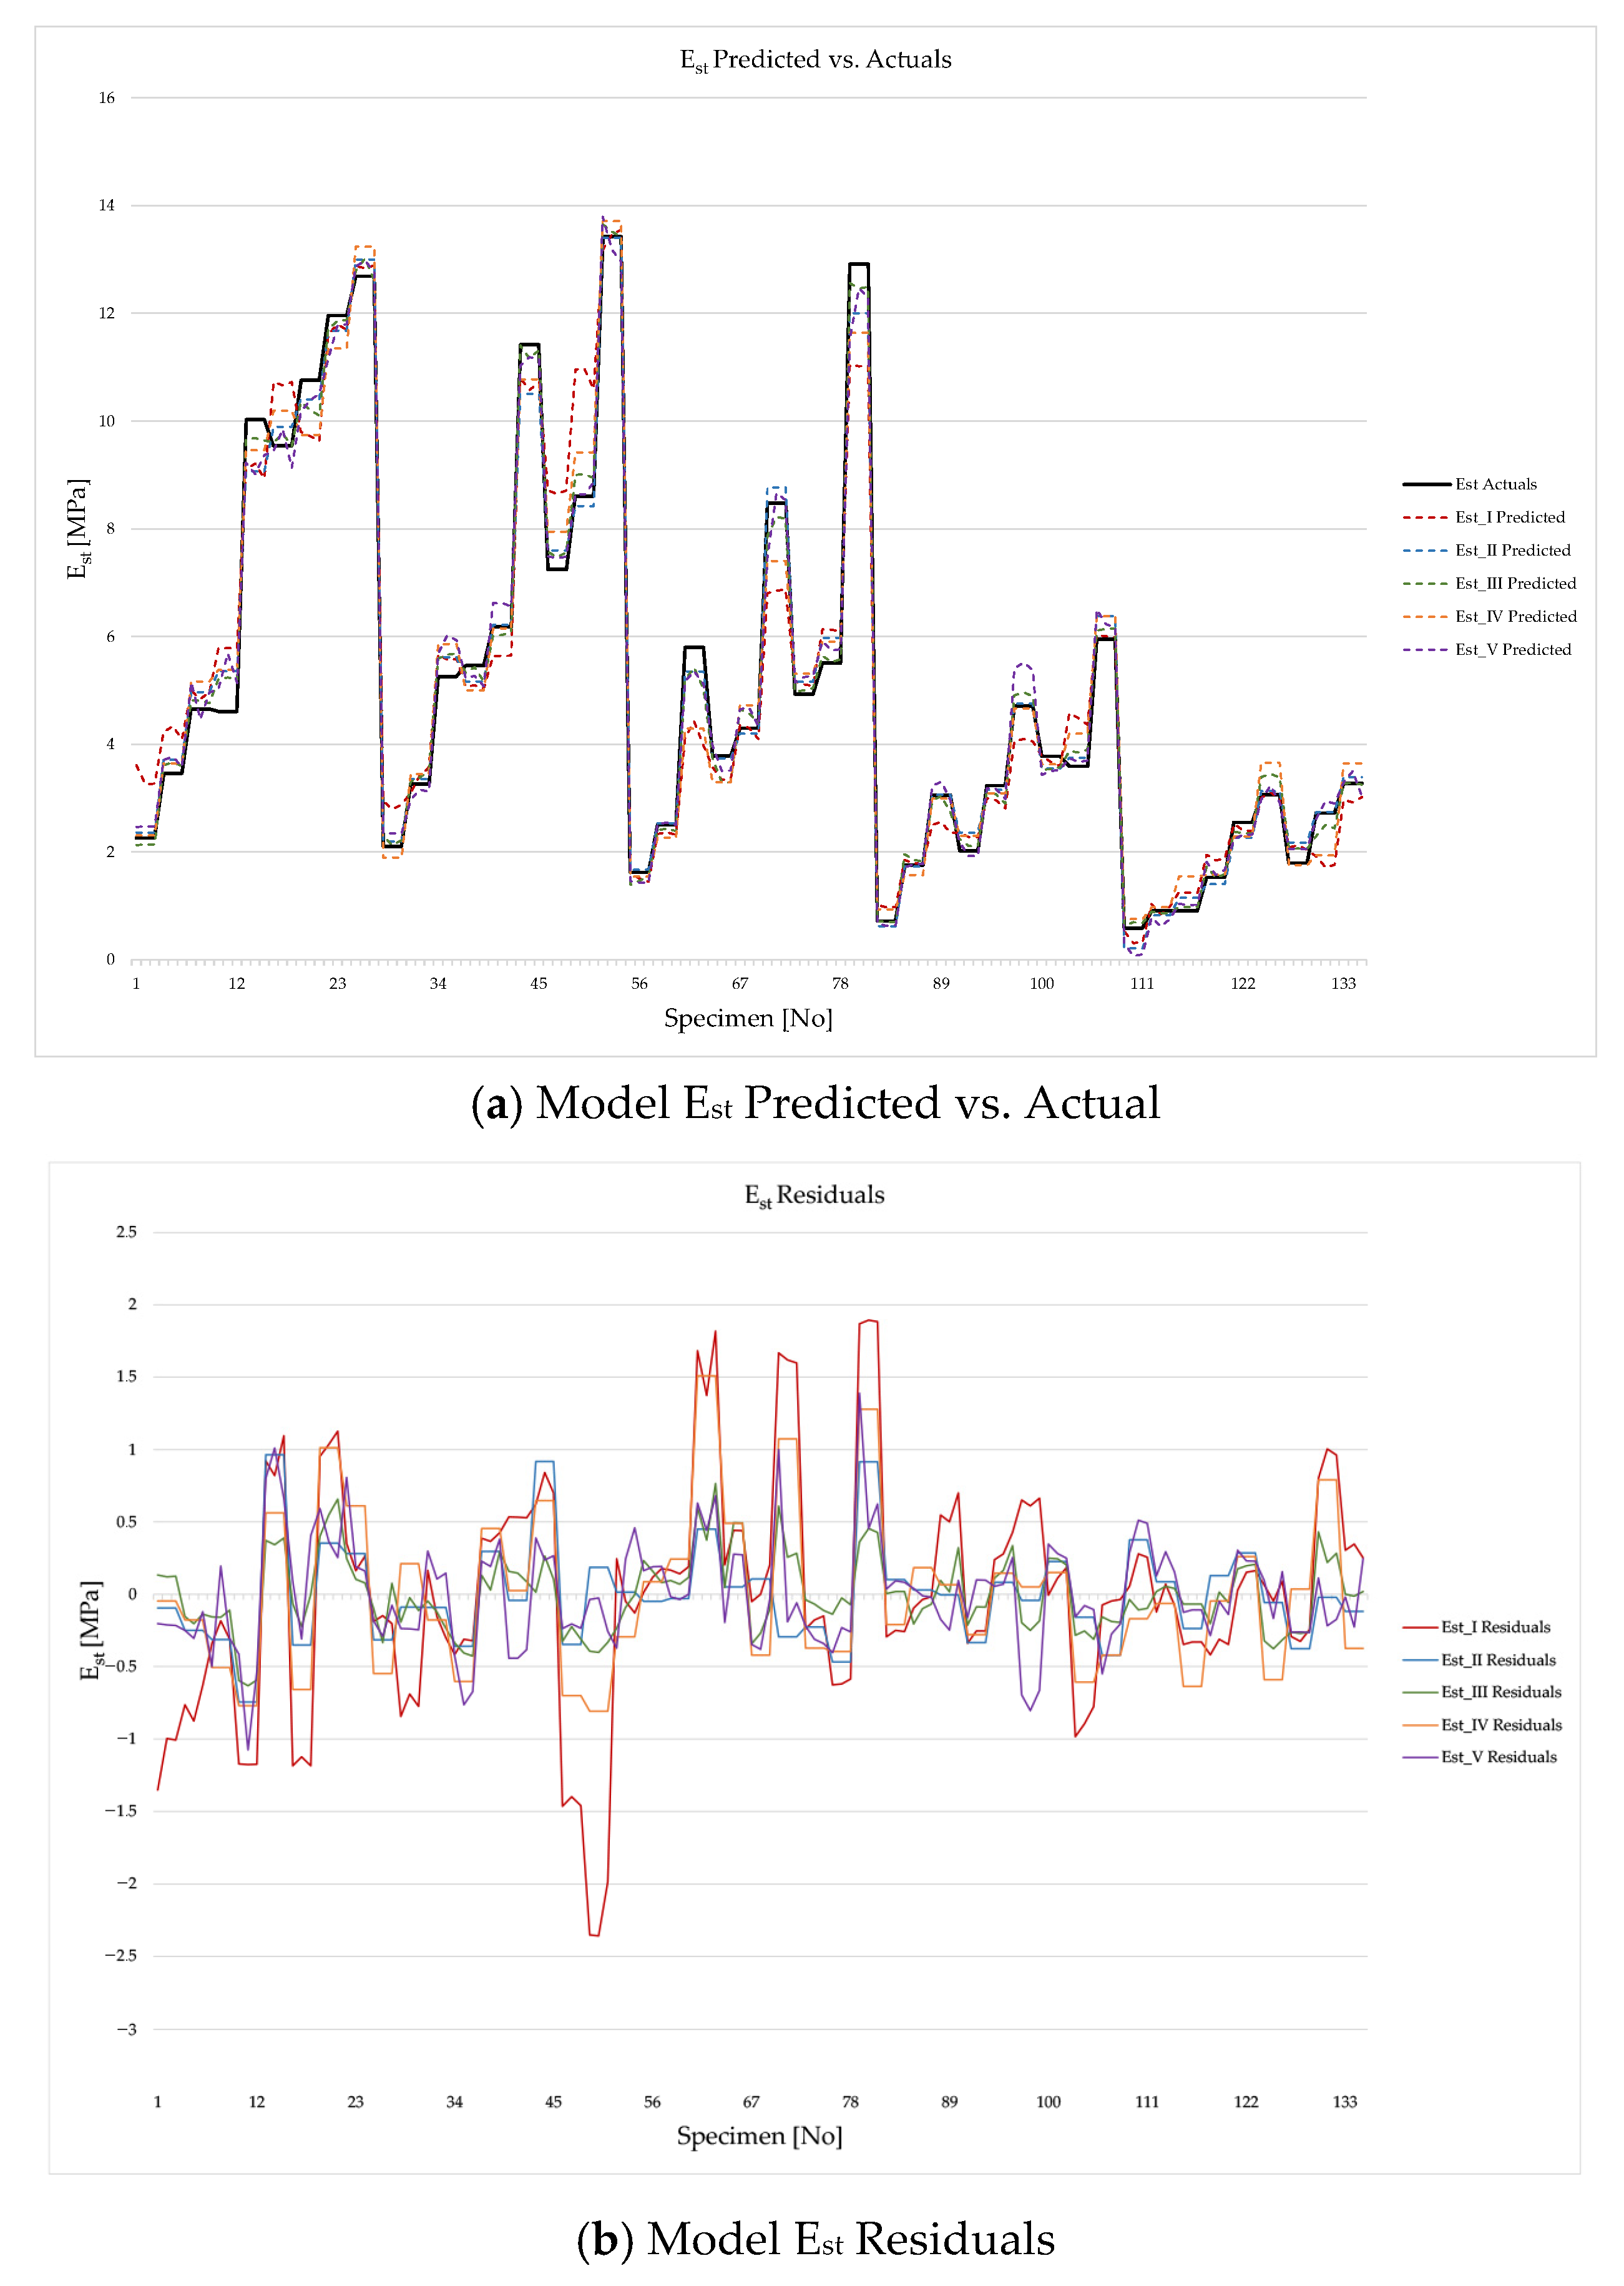
The calculated predicted values for tensile strength and modulus of elasticity are overlaid and presented alongside the actual measured values in Figure 9a,b for ft and Figure 10a,b for the Est. The same figures also display the residual overlaps for each individual model.
From the presented graphs, a very high degree of correlation between the predicted and actual values can be observed across all models. Indeed, the differences between the ft models are quite small and decrease as the specimen index increases, suggesting that the results are more consistent for specimens with a higher cement content. Specifically, the specimens are ordered from lower to higher cement content. Furthermore, a more precise conclusion can be drawn from the residual plots, where it is evident that model ft_III (green line) exhibits the smallest residuals, while model ft_I (red line) shows the largest. Regarding the Est models, the predicted and actual values also align very closely for all models, although the residuals are somewhat larger. The highest predictive reliability for the static modulus of elasticity is likewise provided by model Est_III (green line), whereas the largest residuals were recorded for model Est_I (red line).
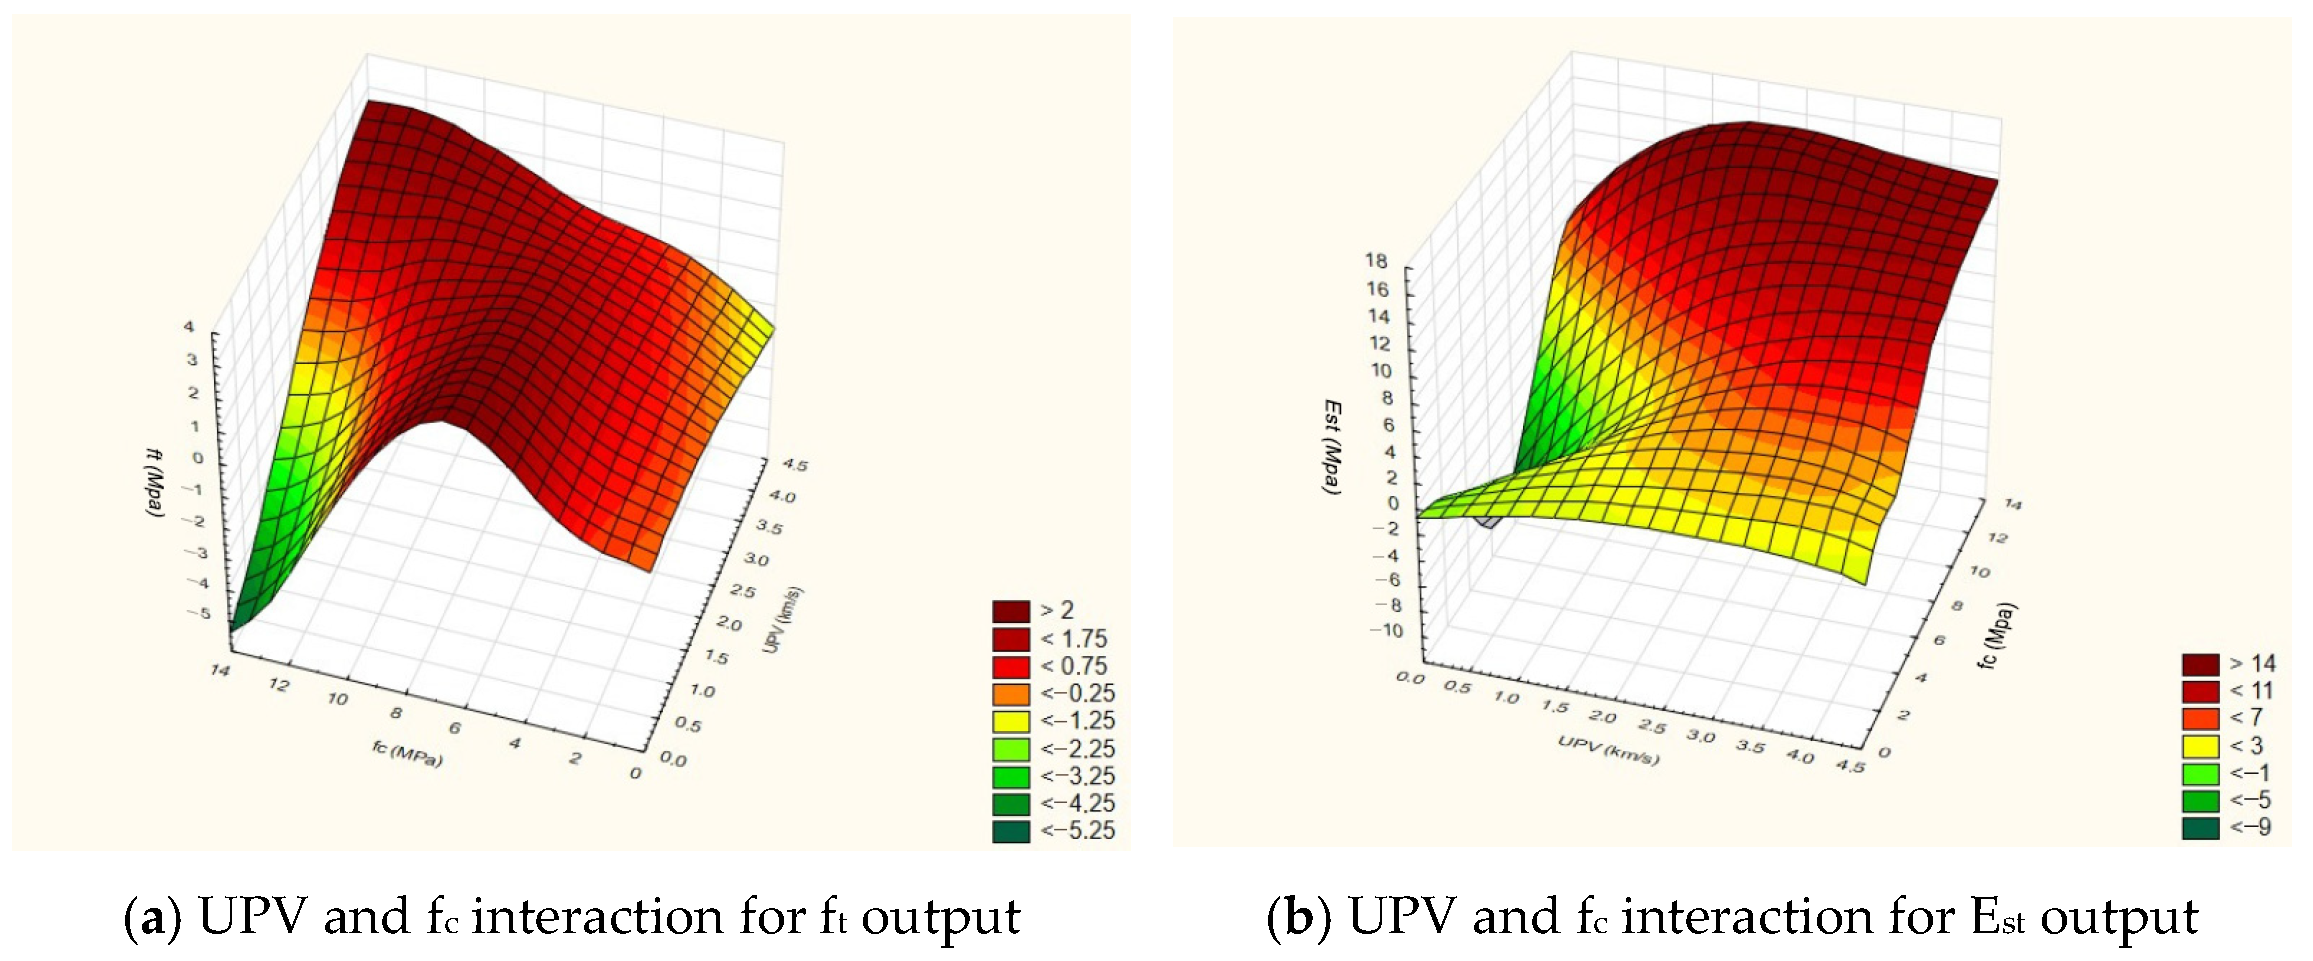
Table 2 shows that rubber, cement, and curing days are not correlated values. Therefore, for the most accurate models, ft_III, and Est_III, a 3D surface plot was developed to analyse the interaction between these two variables on the output data. The resulting graphs are shown in Figure 11a,b. Both graphs demonstrate mutual interdependence and a significant effect of one variable on the other. In the case of the static modulus of elasticity, the slope of the curved surface is slightly lower than that of the indirect tensile strength, indicating that the influence of the dominant variable is less pronounced for Est. Furthermore, both surfaces follow an S-shaped curve, which signifies a stronger interaction between individual elements than their separate effects. This serves as evidence of the synergy between the input parameters UPV and fc and provides an explanation for the results obtained by these models.
Based on the analysis of the results for all models, it can be concluded that, in the estimation of ft, UPV consistently retains a stable level of importance. This is in compliance with [34], where the authors claim that UPV is a good predictor for compressive strength. A similar situation is observed in the estimation of Est. The importance of compressive strength as an input parameter varies considerably across all models, depending on which additional input variables are included. The rubber content plays a significant role in Est prediction, particularly when compressive strength is not used as an input parameter. The situation is more complex for cement content. For the estimation of ft, the cement content becomes more important when UPV is not included in the analysis. Conversely, for the estimation of Est, the cement content does not exhibit a logical pattern of fluctuation. The fluctuation in the influence of cement content can likely be explained by the hydration time. The duration of hydration strongly affects the development of both strength and stiffness, and therefore, we conclude that the binder parameter cannot be separated from the age of the specimens. A similar situation arises with compressive strength; however, its behaviour is influenced not only by hydration but also by the strength and shape of the aggregates, making it considerably more complex to analyse. The specimen age proved to be an important parameter for estimating the modulus of elasticity, whereas this was not the case for indirect tensile strength.
It should be emphasized that such models are very difficult to compare quantitatively, and each material, due to its specific characteristics, requires the analysis of different parameters. What unites all construction materials is their strength and modulus of elasticity and, more recently, the trend toward the implementation of non-destructive testing methods. Consequently, it is concluded that models intended for preliminary material qualification should be limited to these parameters.
In general, the results of the conducted analysis produced highly reliable models. However, it is important to consider that the analysed data originated from a single study and pertained to a material of very low strength, meaning that the models, as such, can only be applied to low-strength materials. Most of the available research has been based on databases compiled from multiple studies via scientific and national platforms. In such analyses, potential issues may arise from inconsistencies in specimen preparation procedures, measurement of specific parameters, the precision of measuring instruments, and similar factors.

4. Conclusions

Through the application of neural network methodologies, this study developed five predictive models for indirect tensile strength (ft) and five models for the static modulus of elasticity (Est) of a cement-stabilised base layer incorporating waste rubber. The investigated input parameters included rubber and cement content, curing duration, compressive strength and ultrasonic pulse velocity (UPV). A comprehensive assessment of the statistical indicators and parameter-importance measures supports the following conclusions:
  • UPV was identified as a dominant predictor, capturing not only the mechanical response of the material but also subtle microstructural effects, such as heterogeneity, crack formation and the presence of entrapped moisture.
  • Curing duration exhibited a pronounced influence on the prediction of the modulus of elasticity, highlighting its fundamental role in governing hydration kinetics and stiffness development.
  • The predictive performance of the models demonstrates high sensitivity to the selection of input-parameter combinations, emphasising the need for careful parameter configuration in data-driven modelling of cement-based materials.
  • The model with the most input data achieved the smallest residuals as a result of variable synergy.
  • Neural network models proved capable of providing reliable and generalisable predictions of both mechanical and elastic properties for cement-based composites containing waste rubber.
  • Cross-comparison of different models remains inherently limited, primarily due to the absence of a standardised and universally adopted modelling framework encompassing data preparation, network architecture selection and validation procedures.
  • Reproducibility of the modelling approach is constrained, as replication is dependent on the specific software environment and computational settings employed during model development.
  • The limitations of this study relate to the use of local materials and the limited number of tested specimens.

Author Contributions

Conceptualization, M.Z.; methodology, M.Z.; software, I.I.O.; formal analysis, M.Z., I.I.O. and I.B.; investigation, M.Z., I.I.O. and I.B.; writing—original draft preparation, M.Z.; writing—review and editing, I.I.O. and I.B.; project administration, I.B.; funding acquisition, I.B. All authors have read and agreed to the published version of the manuscript.

Funding

This research was funded by European Union-NextGenerationEU, grant number 581-UNIOS-73—Harmonization of Innovation and smart Traffic Infrastructure—HIPI.

Institutional Review Board Statement

Not applicable.

Informed Consent Statement

Not applicable.

Data Availability Statement

The raw data supporting the conclusions of this article will be made available by the authors on request.

Conflicts of Interest

The authors declare no conflicts of interest.

Appendix A

Table A1 presents the dataset of 15 tested mixtures. Each mixture property was tested after 7, 28, and 90 days of curing, using three specimens for each curing period. The table displays all values in the units of measurement used for the development of the presented models.
Table A1. Dataset used for model development.
SpecimenUPV (km/s)fc (MPa)Rubber
(mass %)
Cement
(mass %)
Age (Days)ft (MPa)Est (MPa)
12.64231.73180.00003.070.16442.265
22.45291.73180.00003.070.16442.265
32.45811.73180.00003.070.16442.265
42.89842.68750.00003.0280.35733.463
52.98752.68750.00003.0280.35733.463
62.78172.68750.00003.0280.35733.463
73.27473.32300.00003.0900.81744.657
83.06843.32300.00003.0900.81744.657
93.24123.32300.00003.0900.81744.657
103.17214.10680.00005.070.52564.612
113.32014.10680.00005.070.52564.612
123.19694.10680.00005.070.52564.612
133.75026.45370.00005.0281.047710.028
143.68016.45370.00005.0281.047710.028
153.84186.45370.00005.0281.047710.028
163.70767.55130.00005.0901.69769.540
173.78987.55130.00005.0901.69769.540
183.62657.55130.00005.0901.69769.540
193.64756.82110.00007.071.120110.756
203.72836.82110.00007.071.120110.756
213.78856.82110.00007.071.120110.756
223.62018.88920.00007.0281.768711.960
233.99048.88920.00007.0281.768711.960
244.04628.88920.00007.0281.768711.960
254.059111.56810.00007.0902.490112.688
264.102011.56810.00007.0902.490112.688
274.026511.56810.00007.0902.490112.688
282.29711.31220.99533.070.16042.111
292.21121.31220.99533.070.16042.111
302.25961.31220.99533.070.16042.111
312.22832.07260.99533.0280.28753.267
322.49402.07260.99533.0280.28753.267
332.59692.07260.99533.0280.28753.267
343.73463.87980.99533.0900.50255.260
353.52803.87980.99533.0900.50255.260
363.56353.87980.99533.0900.50255.260
373.10373.53830.99535.070.78085.461
383.14693.53830.99535.070.78085.461
393.02473.53830.99535.070.78085.461
403.29423.99180.99535.0281.14156.179
413.30523.99180.99535.0281.14156.179
423.36543.99180.99535.0281.14156.179
433.79717.66710.99535.0901.288611.421
443.93447.66710.99535.0901.288611.421
453.85767.66710.99535.0901.288611.421
463.49866.04480.99537.071.55907.251
473.58726.04480.99537.071.55907.251
483.50806.04480.99537.071.55907.251
493.80917.81480.99537.0282.08518.610
503.80267.81480.99537.0282.08518.610
514.00717.81480.99537.0282.08518.610
524.174412.95470.99537.0902.361613.422
534.070512.95470.99537.0902.361613.422
544.024012.95470.99537.0902.361613.422
551.41410.94312.02173.070.14731.628
561.32470.94312.02173.070.14731.628
571.27690.94312.02173.070.14731.628
581.93501.15482.02173.0280.23112.509
591.95341.15482.02173.0280.23112.509
601.91971.15482.02173.0280.23112.509
612.90642.23572.02173.0900.33185.800
623.05152.23572.02173.0900.33185.800
632.83262.23572.02173.0900.33185.800
642.57212.20432.02175.070.36243.785
652.37302.20432.02175.070.36243.785
662.37472.20432.02175.070.36243.785
672.79483.00932.02175.0280.74724.306
682.73073.00932.02175.0280.74724.306
692.48633.00932.02175.0280.74724.306
703.00004.84922.02175.0900.95138.475
713.34744.84922.02175.0900.95138.475
723.28034.84922.02175.0900.95138.475
732.92493.69432.02177.071.13294.935
742.80933.69432.02177.071.13294.935
752.76533.69432.02177.071.13294.935
763.30004.36212.02177.0281.28505.509
773.06574.36212.02177.0281.28505.509
782.97454.36212.02177.0281.28505.509
793.67997.85442.02177.0901.507112.917
803.79147.85442.02177.0901.507112.917
813.77247.85442.02177.0901.507112.917
821.02070.60043.08093.070.09950.725
830.98660.60043.08093.070.09950.725
840.99340.60043.08093.070.09950.725
851.64550.84723.08093.0280.13781.760
861.59830.84723.08093.0280.13781.760
871.58230.84723.08093.0280.13781.760
882.05091.13163.08093.0900.21503.058
892.08001.13163.08093.0900.21503.058
901.95201.13163.08093.0900.21503.058
911.82571.55683.08095.070.32202.026
921.75361.55683.08095.070.32202.026
931.75411.55683.08095.070.32202.026
942.20391.94233.08095.0280.45053.240
952.17031.94233.08095.0280.45053.240
962.03851.94233.08095.0280.45053.240
972.67922.78153.08095.0900.57504.715
982.72362.78153.08095.0900.57504.715
992.66732.78153.08095.0900.57504.715
1002.32362.84443.08097.070.78033.782
1012.21902.84443.08097.070.78033.782
1022.15942.84443.08097.070.78033.782
1032.66533.32153.08097.0280.87153.593
1042.55753.32153.08097.0280.87153.593
1052.43683.32153.08097.0280.87153.593
1063.02364.30243.08097.0901.11045.956
1072.95784.30243.08097.0901.11045.956
1082.93594.30243.08097.0901.11045.956
1090.70800.51264.17433.070.04710.591
1100.59110.51264.17433.070.04710.591
1110.60290.51264.17433.070.04710.591
1121.03650.58524.17433.0280.09290.913
1130.89450.58524.17433.0280.09290.913
1141.00120.58524.17433.0280.09290.913
1151.15370.84234.17433.0900.13940.915
1161.14090.84234.17433.0900.13940.915
1171.14230.84234.17433.0900.13940.915
1181.56801.32014.17435.070.19771.533
1191.48201.32014.17435.070.19771.533
1201.51061.32014.17435.070.19771.533
1211.97811.51164.17435.0280.23152.552
1221.87511.51164.17435.0280.23152.552
1231.86581.51164.17435.0280.23152.552
1242.11102.12734.17435.0900.37153.071
1252.21032.12734.17435.0900.37153.071
1262.08572.12734.17435.0900.37153.071
1271.56591.66144.17437.070.29431.799
1281.58921.66144.17437.070.29431.799
1291.53071.66144.17437.070.29431.799
1301.62831.08564.17437.0280.28632.727
1311.45541.08564.17437.0280.28632.727
1321.49231.08564.17437.0280.28632.727
1331.95742.34124.17437.0900.49553.274
1341.92432.34124.17437.0900.49553.274
1351.99892.34124.17437.0900.49553.274

References

  1. Chandwani, V.; Agrawal, V.; Nagar, R. Applications of Artificial Neural Networks in Modeling Compressive Strength of Concrete: A State of the Art Review. Int. J. Curr. Eng. Technol. 2014, 4, 2949–2956. [Google Scholar]
  2. Yeh, O.-C. Modeling of strength of high-performance concrete using artificial neural networks. Cem. Concr. Res. 1998, 28, 1797–1808. [Google Scholar] [CrossRef] [Scilit]
  3. Alwash, M.; Breysse, D.; Sbartaï, Z.M. Non-destructive strength evaluation of concrete: Analysis of some key factors using synthetic simulations. Constr. Build. Mater. 2015, 99, 235–245. [Google Scholar] [CrossRef] [Scilit]
  4. Kouddane, B.; Sbartaï, Z.M.; Alwash, M.; Ali-Benyahia, K.; Elachachi, S.M.; Lamdouar, N.; Kenai, S. Assessment of Concrete Strength Using the Combination of NDT—Review and Performance Analysis. Appl. Sci. 2022, 12, 12190. [Google Scholar] [CrossRef] [Scilit]
  5. Alwash, M.; Breysse, D.; Sbartaï, Z.M.; Szilágyi, K.; Borosnyói, A. Factors affecting the reliability of assessing the concrete strength by rebound hammer and cores. Constr. Build. Mater. 2017, 140, 354–363. [Google Scholar] [CrossRef] [Scilit]
  6. Ju, M.; Park, K.; Oh, H. Estimation of Compressive Strength of High Strength Concrete Using Non-Destructive Technique and Concrete Core Strength. Appl. Sci. 2017, 7, 1249. [Google Scholar] [CrossRef] [Scilit]
  7. Rashid, K.; Waqas, R. Compressive strength evaluation by non-destructive techniques: An automated approach in construction industry. J. Build. Eng. 2017, 12, 147–154. [Google Scholar] [CrossRef] [Scilit]
  8. Ali-Benyahia, K.; Sbartaï, Z.M.; Breysse, D.; Kenai, S.; Ghrici, M. Analysis of the single and combined non-destructive test approaches for on-site concrete strength assessment: General statements based on a real case-study. Case Stud. Constr. Mater. 2017, 6, 109–119. [Google Scholar] [CrossRef] [Scilit]
  9. Amini, K.; Jalalpour, M.; Delatte, N. Advancing concrete strength prediction using non-destructive testing: Development and verification of a generalizable model. Constr. Build. Mater. 2016, 102, 762–768. [Google Scholar] [CrossRef] [Scilit]
  10. Ngo, T.Q.L.; Wang, Y.-R.; Chiang, D.-L. Applying Artificial Intelligence to Improve On-Site Non-Destructive Concrete Compressive Strength Tests. Crystals 2021, 11, 1157. [Google Scholar] [CrossRef] [Scilit]
  11. Quyhn, L.N.T.; Wang, Y.-R. Using Support Vector Machine to Improve Ultrasonic Pulse Velocity Test for Concrete. MATEC Web Conf. 2018, 207, 01001. [Google Scholar] [CrossRef] [Scilit]
  12. Park, J.Y.; Yoon, Y.G.; Oh, T.K. Prediction of Concrete Strength with P-, S-, R-Wave Velocities by Support Vector Machine (SVM) and Artificial Neural Network (ANN). Appl. Sci. 2019, 9, 4053. [Google Scholar] [CrossRef] [Scilit]
  13. Shih, Y.-F.; Wang, Y.-R.; Lin, K.-L.; Chen, C.-W. Improving Non-Destructive Concrete Strength Tests Using Support Vector Machines. Materials 2015, 8, 7169–7178. [Google Scholar] [CrossRef] [Scilit] [PubMed]
  14. Al-Shamiri, A.K.; Yuan, T.-F.; Kim, J.H. Non-Tuned Machine Learning Approach for Predicting the Compressive Strength of High-Performance Concrete. Materials 2020, 13, 1023. [Google Scholar] [CrossRef] [Scilit] [PubMed]
  15. Golafshani, E.M.; Behnood, A.; Arashpour, M. Predicting the compressive strength of normal and High-Performance Concretes using ANN and ANFIS hybridized with Grey Wolf Optimizer. Constr. Build. Mater. 2019, 232, 117266. [Google Scholar] [CrossRef] [Scilit]
  16. Mustapha, R.; Mohamed, E.A. High-Performance Concrete Compressive Strength Prediction Based Weighted Support Vector Machines. Int. J. Eng. Res. Appl. 2017, 7, 68–75. [Google Scholar] [CrossRef] [Scilit]
  17. Behnood, A.; Behnood, V.; Gharehveran, M.M.; Alyamac, K.E. Prediction of the compressive strength of normal and high-performance concretes using M5P model tree algorithm. Constr. Build. Mater. 2017, 142, 199–207. [Google Scholar] [CrossRef] [Scilit]
  18. Behnood, A.; Golafshani, E.M. Predicting the compressive strength of silica fume concrete using hybrid artificial neural network with multi-objective grey wolves. J. Clean. Prod. 2018, 202, 54–64. [Google Scholar] [CrossRef] [Scilit]
  19. Chou, J.-S.; Chiu, C.-K.; Farfoura, M.; Al-Taharwa, I. Optimizing the Prediction Accuracy of Concrete Compressive Strength Based on a Comparison of Data-Mining Techniques. J. Comput. Civ. Eng. 2011, 25, 242–253. [Google Scholar] [CrossRef] [Scilit]
  20. Al-Shamiri, A.K.; Kim, J.H.; Yuan, T.-F.; Yoon, Y.S. Modeling the compressive strength of high-strength concrete: An extreme learning approach. Constr. Build. Mater. 2019, 208, 204–219. [Google Scholar] [CrossRef] [Scilit]
  21. Behnood, A.; Golafshani, E.M. Machine learning study of the mechanical properties of concretes containing waste foundry sand. Constr. Build. Mater. 2020, 243, 118152. [Google Scholar] [CrossRef] [Scilit]
  22. Cheng, M.-Y.; Firdausi, P.M.; Prayogo, D. High-performance concrete compressive strength prediction using Genetic Weighted Pyramid Operation Tree (GWPOT). Eng. Appl. Artif. Intell. 2014, 29, 104–113. [Google Scholar] [CrossRef] [Scilit]
  23. Golafshani, E.M.; Behnood, A. Estimating the optimal mix design of silica fume concrete using biogeography-based programming. Cem. Concr. Compos. 2018, 96, 95–105. [Google Scholar] [CrossRef] [Scilit]
  24. Golafshani, E.M.; Behnood, A. Automatic regression methods for formulation of elastic modulus of recycled aggregate concrete. Appl. Soft Comput. 2018, 64, 377–400. [Google Scholar] [CrossRef] [Scilit]
  25. Golafshani, E.M.; Behnood, A. Application of soft computing methods for predicting the elastic modulus of recycled aggregate concrete. J. Clean. Prod. 2018, 176, 1163–1176. [Google Scholar] [CrossRef] [Scilit]
  26. Han, Q.; Gui, C.; Xu, J.; Lacidogna, G. A generalized method to predict the compressive strength of high-performance concrete by improved random forest algorithm. Constr. Build. Mater. 2019, 226, 734–742. [Google Scholar] [CrossRef] [Scilit]
  27. Trtnik, G.; Kavčić, F.; Turk, G. Prediction of concrete strength using ultrasonic pulse velocity and artificial neural networks. Ultrasonics 2009, 49, 53–60. [Google Scholar] [CrossRef] [Scilit]
  28. Na, U.J.; Park, T.W.; Feng, M.Q.; Chung, L. Neuro-fuzzy application for concrete strength prediction using combined non-destructive tests. Mag. Concr. Res. 2009, 61, 245–256. [Google Scholar] [CrossRef] [Scilit]
  29. Zhang, J.; Ma, G.; Huang, Y.; Sun, J.; Nener, B. Modelling uniaxial compressive strength of lightweight self-compacting concrete using random forest regression. Constr. Build. Mater. 2019, 210, 713–719. [Google Scholar] [CrossRef] [Scilit]
  30. Chou, J.-S.; Tsai, C.-F.; Pham, A.-D.; Lu, Y.-H. Machine learning in concrete strength simulations: Multi-nation data analytics. Constr. Build. Mater. 2014, 73, 771–780. [Google Scholar] [CrossRef] [Scilit]
  31. Behnood, A.; Verian, K.P.; Gharehveran, M.M. Evaluation of the splitting tensile strength in plain and steel fiber-reinforced concrete based on the compressive strength. Constr. Build. Mater. 2015, 98, 519–529. [Google Scholar] [CrossRef] [Scilit]
  32. Yoon, Y.G.; Choi, H.; Oh, T.K. Study on Prediction and Application of Initial Chord Elastic Modulus with Resonance Frequency Test of ASTM C 215. Appl. Sci. 2020, 10, 5464. [Google Scholar] [CrossRef] [Scilit]
  33. Alshihri, M.M.; Azmy, A.M.; Mousa, S.E.-B. Neural networks for predicting compressive strength of structural light weight concrete. Constr. Build. Mater. 2009, 23, 2214–2219. [Google Scholar] [CrossRef] [Scilit]
  34. Tenza-Abril, A.J.; Villacampa, Y.; Solak, A.M.; Baeza-Brotons, F. Prediction and sensitivity analysis of compressive strength in segregated lightweight concrete based on artificial neural network using ultrasonic pulse velocity. Constr. Build. Mater. 2018, 189, 1173–1183. [Google Scholar] [CrossRef] [Scilit]
  35. Altun, F.; Kişi, Ö.; Aydin, K. Predicting the compressive strength of steel fiber added lightweight concrete using neural network. Comput. Mater. Sci. 2008, 42, 259–265. [Google Scholar] [CrossRef] [Scilit]
  36. Castaneda-Lopez, M.; Lenoir, T.; Sanfratello, J.-P.; Thorel, L. Data-Driven Prediction of Cement-Stabilized Soils Tensile Properties. Infrastructures 2023, 8, 146. [Google Scholar] [CrossRef] [Scilit]
  37. Zvonarić, M.; Barišić, I.; Dokšanović, T. Effect of rubber granules and rubber threads on mechanical properties of cement-bound base course. Constr. Build. Mater. 2024, 437, 137094. [Google Scholar] [CrossRef] [Scilit]
  38. HRN EN 13286-51:2004; Unbound and Hydraulically Bound Mixtures—Part 51: Methods for The manufacture of Test Specimens of Hydraulically Bound Mixtures Using Vibrating Hammer Compaction. European Committee for Standardization: Brussels, Belgium, 2004.
  39. Zvonarić, M.; Barišić, I.; Galić, M.; Minažek, K. Influence of Laboratory Compaction Method on Compaction and Strength Characteristics of Unbound and Cement-Bound Mixtures. Appl. Sci. 2021, 11, 4750. [Google Scholar] [CrossRef] [Scilit]
  40. HRN EN 13286-41:2021; Unbound and Hydraulically Bound Mixtures—Part 41: Test Method for the Determination of the Compressive Strenght of Hydraulically Bound Mixtures. European Committee for Standardization: Brussels, Belgium, 2021.
  41. HRN EN 13286-42:2021; Unbound and Hydraulically Bound Mixtures—Part 42: Test Method for the Determination of the Indirect Tensile Strength of Hydraulically Bound Mixtures. European Committee for Standardization: Brussels, Belgium, 2021.
  42. EN 12504-4:2004; Testing Concrete—Part 4: Determination of Ultrasonic Pulse Velocity. Technical Committee CEN/TC: Brussels, Belgium, 2004.
  43. Barišić, I.; Dokšanović, T.; Draganić, H. Characterization of hydraulically bound base materials through digital image correlation. Constr. Build. Mater. 2015, 83, 299–307. [Google Scholar] [CrossRef] [Scilit]
  44. Zvonarić, M.; Dimter, S. Prevention and remediation measures for reflective cracks in flexible pavements. J. Croat. Assoc. Civ. Eng. 2022, 74, 189–197. [Google Scholar] [CrossRef] [Scilit]
  45. Fahlman, S.; Lebiere, S. The Cascade-Correlation Learning Architecture. In Advances in Neural Information Processing Systems 2; MIT Press: Cambridge, MA, USA, 1990. [Google Scholar]
  46. Mohamed, S.A.E.-M.; Mohamed, M.H.; Farghally, M.F. A New Cascade-Correlation Growing Deep Learning Neural Network Algorithm. Algorithms 2021, 14, 158. [Google Scholar] [CrossRef] [Scilit]
Figure 1. Constituent materials (mm).
Eng 07 00223 g001
Figure 2. Model development scheme. Legend: Ultrasonic pulse velocity (UPV), compressive strength (fc), rubber amount (R), cement amount (C), specimen age (A).
Eng 07 00223 g002
Figure 3. The probability plot of (a) indirect tensile strength; (b) static modulus of elasticity.
Eng 07 00223 g003
Figure 4. Actuals vs. predicted and residual results for (a) Model ft_I, and (b) Model Est_I.
Eng 07 00223 g004
Figure 5. Actuals vs. predicted and residual results for (a) Model ft_II, and (b) Model Est_II.
Eng 07 00223 g005
Figure 6. Actuals vs. predicted and residual results for (a) Model ft_III, and (b) Model_Est_III.
Eng 07 00223 g006
Figure 7. Actuals vs. predicted and residual results for (a) Model ft_IV, and (b) Model Est_IV.
Eng 07 00223 g007
Figure 8. Actuals vs. predicted and residual results for (a) Model ft_V, and (b) Model Est_V.
Eng 07 00223 g008
Figure 9. Overlapped (a) Actual and Predicted, and (b) Residuals for ft models.
Eng 07 00223 g009
Figure 10. Overlapped (a) Actuals and Predicted, and (b) Residuals for Est models.
Eng 07 00223 g010
Figure 11. 3D surface plots of interaction between UPV and fc for (a) ft, and (b) Est output values.
Eng 07 00223 g011
Table 1. Descriptive statistics for dependent variables.
NoMeanStDevMedianMinMaxA–Dp
ft1350.7460.63270.50250.04712.49015.5750.000
Est1355.0903.5933.7850.59113.4225.3730.000
Table 2. The correlation matrix for indirect tensile strength and the static modulus of elasticity.
UPVfcRubberCementAgeftEst
UPV10.956−0.7820.4270.3390.8950.955
0.0000.0000.0000.0000.0000.000
fc0.9561−0.6550.6250.3140.8950.964
0.0000.0000.0000.0000.0000.000
Rubber−0.782−0.65510.0000.000−0.547−0.639
0.0000.0001.0001.0000.0000.000
Cement0.4270.6250.00010.0000.7150.557
0.0000.0001.0001.0000.0000.000
Age0.3390.3140.0000.00010.3140.404
0.0000.0001.0001.0000.0000.000
ft0.8950.895−0.5470.7150.3141-
0.0000.0000.0000.0000.000
Est0.9550.964−0.6390.5570.404-1
0.0000.0000.0000.0000.000
Cell contents:Spearman rho correlation coefficient
p-value
Table 3. Statistical results of developed models.
ModelftEst
IIIIIIIVVIIIIIIIVV
Number of neurons in hidden layer802880323280808045100
Optimal number of hidden neurons79236231307780804393
R20.9360.9590.9910.9720.9640.9510.990.9950.9760.989
Average error0.1140.090.0460.0820.0951.5820.260.210.4390.293
Correlation0.9660.980.9950.9860.9820.9750.9950.9970.9880.995
MSE0.0260.0160.0040.0110.0140.6290.1240.070.3080.141
RMSE0.1620.1280.6130.1050.120.7930.3520.2650.5550.375
Importance of
inputs
UPV (km/s)0.439x0.456x0.4970.167x0.168x0.225
fc (MPa)0.561x0.2180.39x0.833x0.0620.026x
R (mass %)x0.0570.2180.2140.408x0.3150.2910.1910.309
C (mass %)x0.5350.0430.3030.07x0.0650.2420.2160.028
A (days)x0.4090.0660.0930.025x0.6210.2360.5670.438
Disclaimer/Publisher’s Note: The statements, opinions and data contained in all publications are solely those of the individual author(s) and contributor(s) and not of MDPI and/or the editor(s). MDPI and/or the editor(s) disclaim responsibility for any injury to people or property resulting from any ideas, methods, instructions or products referred to in the content.