1. Introduction
With ongoing social development and the modernization of industrial electricity consumption, traditional coal-fired power generation is increasingly inadequate for meeting rising energy demands. Furthermore, its continued use exacerbates environmental challenges, including the greenhouse effect and acid rain [
1,
2]. In contrast, natural gas offers cleaner and more efficient energy production, particularly when combined with specialized equipment, and it can effectively compensate for the intermittency of other renewable energy sources. Consequently, increasing the proportion of gas-fired power generation has emerged as a mainstream trend in contemporary power systems.
However, as coupling between electricity and gas systems deepens, failures within a single subsystem can propagate across networks and compromise overall stability [
3,
4]. For instance, in several U.S. states, large-scale blackouts were triggered by disruptions in the natural gas supply, affecting up to 1.3 million electricity users at the peak of the outage [
5]. These events underscore the necessity of examining the coupling mechanisms between electricity and gas systems to enhance their robustness and resilience.
In the research domain of integrated electricity–gas systems, numerous scholars have concentrated on operational optimization. Chen Jian et al. [
6] introduced a distributed optimization framework based on an enhanced Alternating Direction Method of Multipliers (ADMM), addressing the challenge of information asymmetry among electricity, gas, and heat systems. Building on this foundation, Meng Lina et al. [
7] incorporated a rolling optimization strategy into the ADMM-based model. Similarly, Zhang Yachao et al. [
8] proposed a decentralized coordination scheduling mechanism for multi-region interconnected electricity–gas systems.
In addition, heuristic algorithms such as the Krill Herd Optimization Algorithm [
9], the Beetle Antennae Search and Guidance Method [
10], and the Fruit Fly Optimization Algorithm [
11] have been applied to improve scheduling efficiency and solution accuracy. Nonetheless, the majority of studies focus on resource reallocation within already coupled systems, while insufficient attention is given to the initial design of robust coupling architectures.
To address this gap, network components can be abstracted into topological models of nodes and edges, thereby simplifying the planning process and reducing computational complexity. Complex network theory has been increasingly adopted for such analysis in power systems. Under the framework of Transmission Expansion Planning (TEP), Quentin Ploussard et al. [
12] performed regional partitioning and iterative reduction to construct compact yet representative system models. Improvements to partitioning algorithms, such as through extensions of adjacency matrices [
13], have further enhanced network simplification strategies.
However, effective partitioning must be accompanied by rigorous assessment methods. The Balanced Depth Detection Algorithm proposed in [
14] allows for high-quality and efficient partitioning, while also providing quantitative metrics for evaluating partition outcomes. Zhou Dongyue et al. [
15] introduced robustness evaluation indices grounded in both structural and functional attributes of power systems, demonstrating that complex network-based assessments outperform traditional power flow methods. Reinforcing these findings, Konwar P et al. [
16] affirmed the applicability of graph–theoretic approaches in robust network analysis.
As energy networks become increasingly integrated, modeling the power system in isolation is no longer adequate for capturing complex intersystem interactions. In 2010, Buldyrev et al. [
17] introduced the concept of interdependent networks, whereby node failures in one network can cascade and induce failures in another. This paradigm provides a framework for assessing cascading risks [
18] and supports network modeling through correlation and association matrix methodologies [
19].
Building on this foundation, Wang Zixin et al. [
20] applied complex network theory to examine coupling mechanisms between power and communication networks, successfully identifying critical nodes. Similarly, reference [
21] employed topological features to model cascading failures in smart grids. Wang P et al. [
22] explored node–edge interactions to investigate how coupling dynamics and failure propagation influence system robustness. Within the electricity–gas domain, Zhang C et al. [
23] refined the traditional betweenness index by incorporating power output as a weighting factor, enabling more accurate identification of vulnerable components. Reference [
24] analyzed how various coupling methods impact smart grid robustness, albeit with an exclusive focus on node degree. Pan Hua et al. [
25] demonstrated that systems employing complex network-based coupling are inherently more resilient to adversarial attacks.
Despite notable advancements in the structural characterization of electricity–gas coupled systems—particularly through applications of graph theory and complex network analysis—existing approaches largely emphasize static topological attributes while neglecting dynamic behavior. Similarly, trend-based computational methods remain limited in their ability to capture real-time interactions among system components.
To address these limitations, this study proposes a novel integrative framework that fuses operational metrics with topological characteristics, thereby enhancing analytical rigor. By concurrently considering the physical network structure and actual operating conditions, this dual-perspective methodology improves the depth and precision of system assessments. The paper introduces innovative node-ranking indicators that synthesize topological and operational dimensions. Specifically, the electric network employs the Electric Potential–Closeness Fusion Indicator (EPFI), which combines electric potential with closeness centrality. In parallel, the gas network utilizes the Pressure Difference–Closeness Comprehensive Indicator (PDCI), integrating pressure differential with closeness centrality. These composite indicators serve as the foundation for constructing three interdependent system paradigms: assortative coupling, disassortative coupling, and random coupling.
To evaluate the robustness of each paradigm, attack simulations were conducted using degree-based, betweenness-based, and random strategies. Key metrics—network efficiency and the size of the largest connected component—were monitored to assess system resilience. The experimental setup features an asymmetric configuration comprising the IEEE 118-node power grid and the Belgium 20-node gas network, operating under a unidirectional gas-to-electricity energy conversion mode. Simulation results reveal that the disassortative coupling model, informed by EPFI and PDCI indicators, demonstrates exceptional robustness against targeted attacks.
2. Materials and Methods
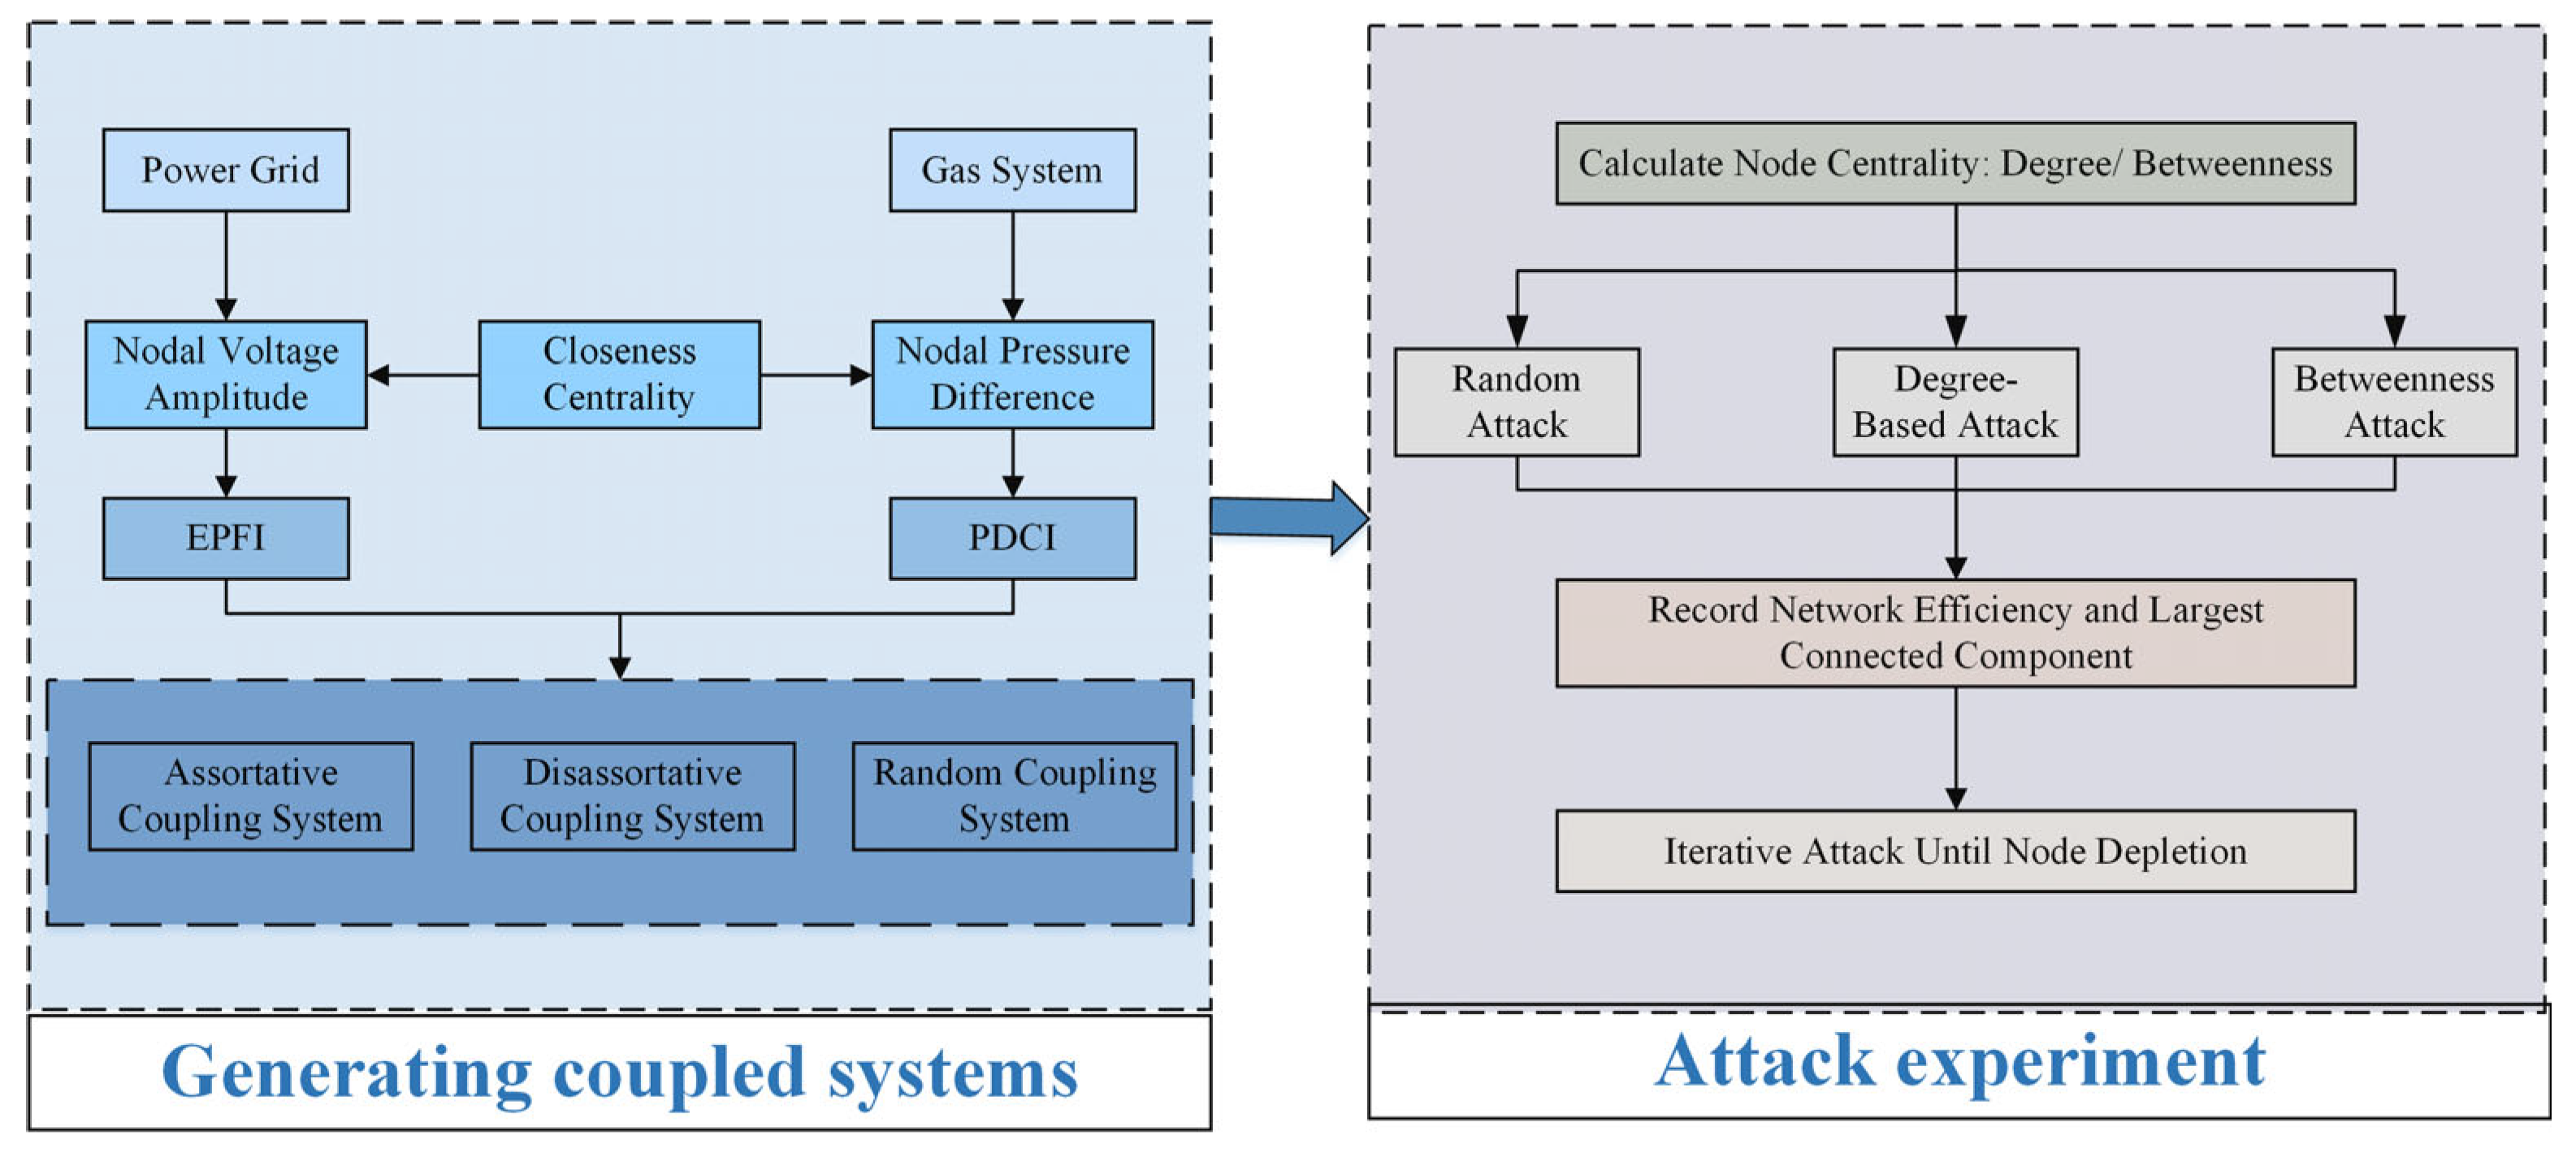
This article combines the network topology parameters of proximity centrality and the voltage amplitude of the power grid in complex networks, as well as the upper and lower limits of node pressure (pressure difference) in natural gas networks, to propose two new node ranking indicators: EPFI and PDCI. Based on these two indicators, the assortative coupling system, the disassortative coupling system, and the random system are constructed. Attack experiments are conducted through three attack methods: degree attack, betweenness centrality attack, and random attack; the changes in network efficiency and the maximum connected subgraph are observed; and the robustness of the corresponding system is analyzed. The technical roadmap of this article is shown in
Figure 1. The specific procedure is as follows:
Power Grid Dataset: Includes node-level and edge-level information describing the electrical transmission infrastructure. Gas Network Dataset: Encompasses nodes and pipeline connections of the gas transportation system. Coupling Edges: Define the interdependent links between the electricity and gas networks, derived from cross-system operational or geographical associations.
- 2.
Interdependent Network Construction
Nodes representing power grid and gas network entities are incorporated. Edges are added to denote internal connections within each subsystem and coupling interfaces across systems. The resulting interdependent network is modeled as an undirected graph using standard network modeling libraries.
- 3.
Centrality-Based Node Characterization
Degree Centrality (DC): Quantifies the number of direct connections of a node. Betweenness Centrality (BC): Measures the extent to which a node lies on the shortest paths between other node pairs. Centrality values are calculated for all nodes and exported to CSV format for traceability and reproducibility.
- 4.
Node Attack Simulation
Sort nodes in descending order of degree centrality, simulate their removal, and record changes in network efficiency and the size of the largest connected component. Repeat the process using betweenness centrality. For random attacks, perform multiple simulations and calculate the average network efficiency and the proportion of the largest connected component.
Figure 1.
Technical roadmap for electricity–gas coupling system analysis.
Figure 1.
Technical roadmap for electricity–gas coupling system analysis.
2.1. Closeness Centrality
From the perspective of complex networks, closeness centrality measures the importance of a node within the local or global structure of the network. It is generally defined as the reciprocal of the sum of the shortest path distances from the node to all other nodes [
26]:
The summation term in the expression represents the distances from node pk to the other n − 1 nodes, so can be interpreted as the reciprocal of the average distance from node pk to all other nodes. However, since n − 1 also represents the minimum possible sum of distances for a node directly connected to all other nodes, can also be interpreted as the reciprocal of the ratio by which node pk exceeds this minimum distance.
It is important to emphasize that, since the total distance from a node to all other nodes inherently accounts for the network size (i.e., the sum over N − 1 nodes), the closeness centrality metric does not require further normalization.
2.2. Node Ranking Indicators
- (1)
Electric Potential–Proximity Fusion Indicator (EPFI)
In a power network, assuming a node experiences a unit load increase, the change in voltage magnitude at the node after the system reaches a stable operating state is given by:
Here,
represents the voltage magnitude at node
i under the initial steady-state of the network, and
is the voltage magnitude at node
i after the system reaches a new steady state following a unit load increase at node
k. Based on closeness centrality, the Electric Potential–Proximity Fusion Indicator (EPFI) is defined as follows:
Here, is the closeness centrality of node i, and N is the total number of nodes in the network. Moreover, the formula is defined in such a way that the use of an exponential form will amplify the abrupt behavior of the nodes more than a linear combination.
- (2)
Pressure Difference–Closeness Comprehensive Indicator (PDCI)
In natural gas networks, pressure limits are key to ensuring system safety and stability. These limits are set based on equipment capacity, user demand, physical laws, and regulations. Proper upper limits prevent overpressure and leakage, while lower limits ensure adequate supply. Key influencing factors include pipeline tolerance, demand, and network topology.
The upper limit of node pressure in the natural gas network is
:
Here, is the safety factor (typically between 0.8 and 0.9), and is the ideal upper pressure limit for the node in the planning and design stage.
The lower limit of node pressure in the natural gas network is
:
Here, is the minimum pressure required by the user, is the pipeline pressure drop, and is the regulator efficiency.
Therefore, the gas node pressure difference can be expressed as follows:
The Pressure Difference–Closeness Comprehensive Indicator (PDCI) is defined as follows:
The multiplication operation enables direct amplification of the weights of the high-voltage differential nodes.
2.3. Coupling Mode
When coupling the power grid and the gas network, three coupling methods can be applied: assortative coupling, disassortative coupling, and random coupling. Based on the node ranking indicators EPFI and PDCI, the coupling rules for each method are shown in
Table 1. Specifically, coupling nodes with high EPFI in the power grid and high PDCI in the gas network forms an assortative coupling system; coupling nodes with low EPFI in the power grid and high PDCI in the gas network forms a disassortative coupling system; randomly pairing nodes from both networks results in a random coupling system.
2.4. Network Attacks
Node attack strategies in simulation experiments are generally categorized into two types: random attacks and intentional (targeted) attacks. Random attacks offer limited insights into the degradation of network performance, whereas intentional attacks are theoretically more robust, as they prioritize the removal of nodes with high importance. Accordingly, both attack strategies are employed to simulate disruptions within the coupled network, with the resulting performance degradation used to evaluate the effectiveness and robustness of each coupling method.
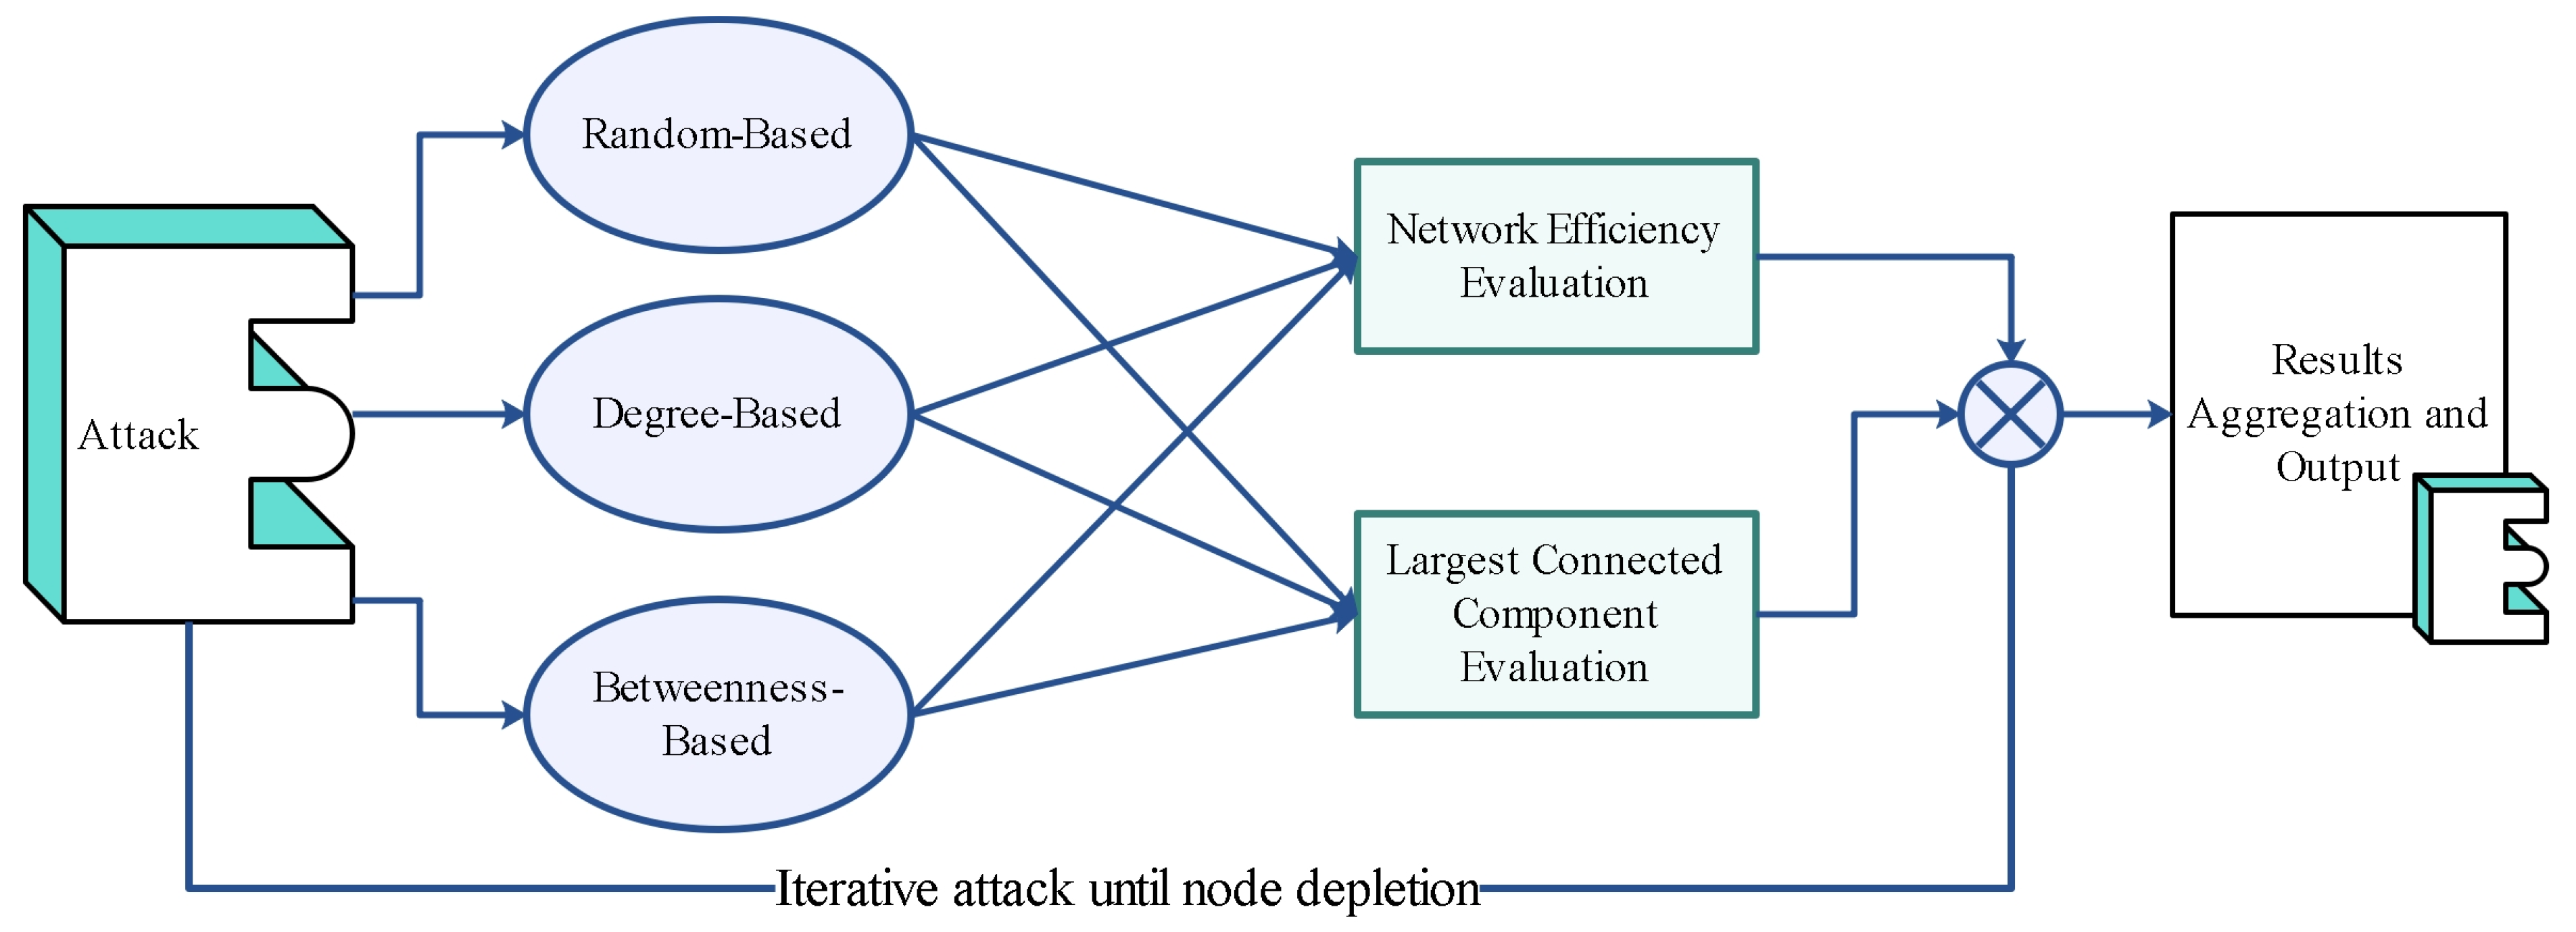
This study aims to preliminarily quantify the isolated impact of the topological characteristics of coupled nodes on system vulnerability. Introducing a cascading failure model at this stage would increase the complexity of fault propagation paths, potentially obscuring the topological significance of individual nodes. Therefore, cascading failures are not considered in the current attack experiments. Instead, each attack is limited to the removal of a single node. The detailed procedure of the attack experiment is illustrated in
Figure 2.
Network resilience is evaluated under three distinct attack strategies:
Degree-Based Attack: Nodes are sequentially removed in descending order of degree centrality.
Betweenness-Based Attack: Nodes are removed based on their betweenness centrality rankings.
Random Attack: Nodes are removed in randomly shuffled orders across multiple simulation runs to establish statistical reliability.
For each removal scenario, two robustness indicators are recorded:
Network Efficiency: Quantifies the average inverse shortest path length among all node pairs.
Size of the Largest Connected Component (LCC): Measures the proportion of nodes remaining in the largest surviving subnetwork.
Results Aggregation and Output:
All simulation outcomes, including network efficiency and LCC values under various attack strategies, are compiled and exported to a CSV file for subsequent visualization and comparative analysis.
2.5. Robustness Evaluation Metrics
- (1)
Network efficiency
Network efficiency is an important metric for evaluating the connectivity efficiency of a network. It reflects how well the network structure maintains connectivity and indicates the effectiveness of any given node. In the electricity–gas model, if a node is removed or fails due to an attack, the overall efficiency of the system decreases. By analyzing the efficiency decay curves under different numbers of attacks and attack strategies, the robustness of various coupling methods can be assessed.
The definition of network efficiency is as follows:
Here, dij is the length of the shortest path between nodes vi and vj, ηij represents the efficiency between nodes vj and vi, and N is the total number of nodes in the network. When multiple coupling systems undergo the same number of attacks, a larger η indicates a greater decline in network efficiency, implying lower stability of the corresponding coupling system.
- (2)
Largest connected component
For electricity–gas networks, the largest connected component refers to the size of the largest subgraph that remains connected after targeted node removal, which fragments the original fully connected network into several smaller components. Under either targeted or random attacks, the largest connected component represents the size of the largest remaining cluster. It is defined as follows:
In the formula, represents the total number of nodes in the network, and is the size of the largest connected component after node removal. Clearly, a smaller indicates that the largest connected subgraph formed after the attack is smaller. The slower the decline of , the stronger the network’s connectivity and its robustness against node failures or removals.
3. Case Study
3.1. Case Study System
This paper verifies the robustness of coupling systems—constructed based on the proposed node ranking indicators—using an electricity–gas integrated system composed of the IEEE 118-bus power system and the 20-node Belgian gas network [
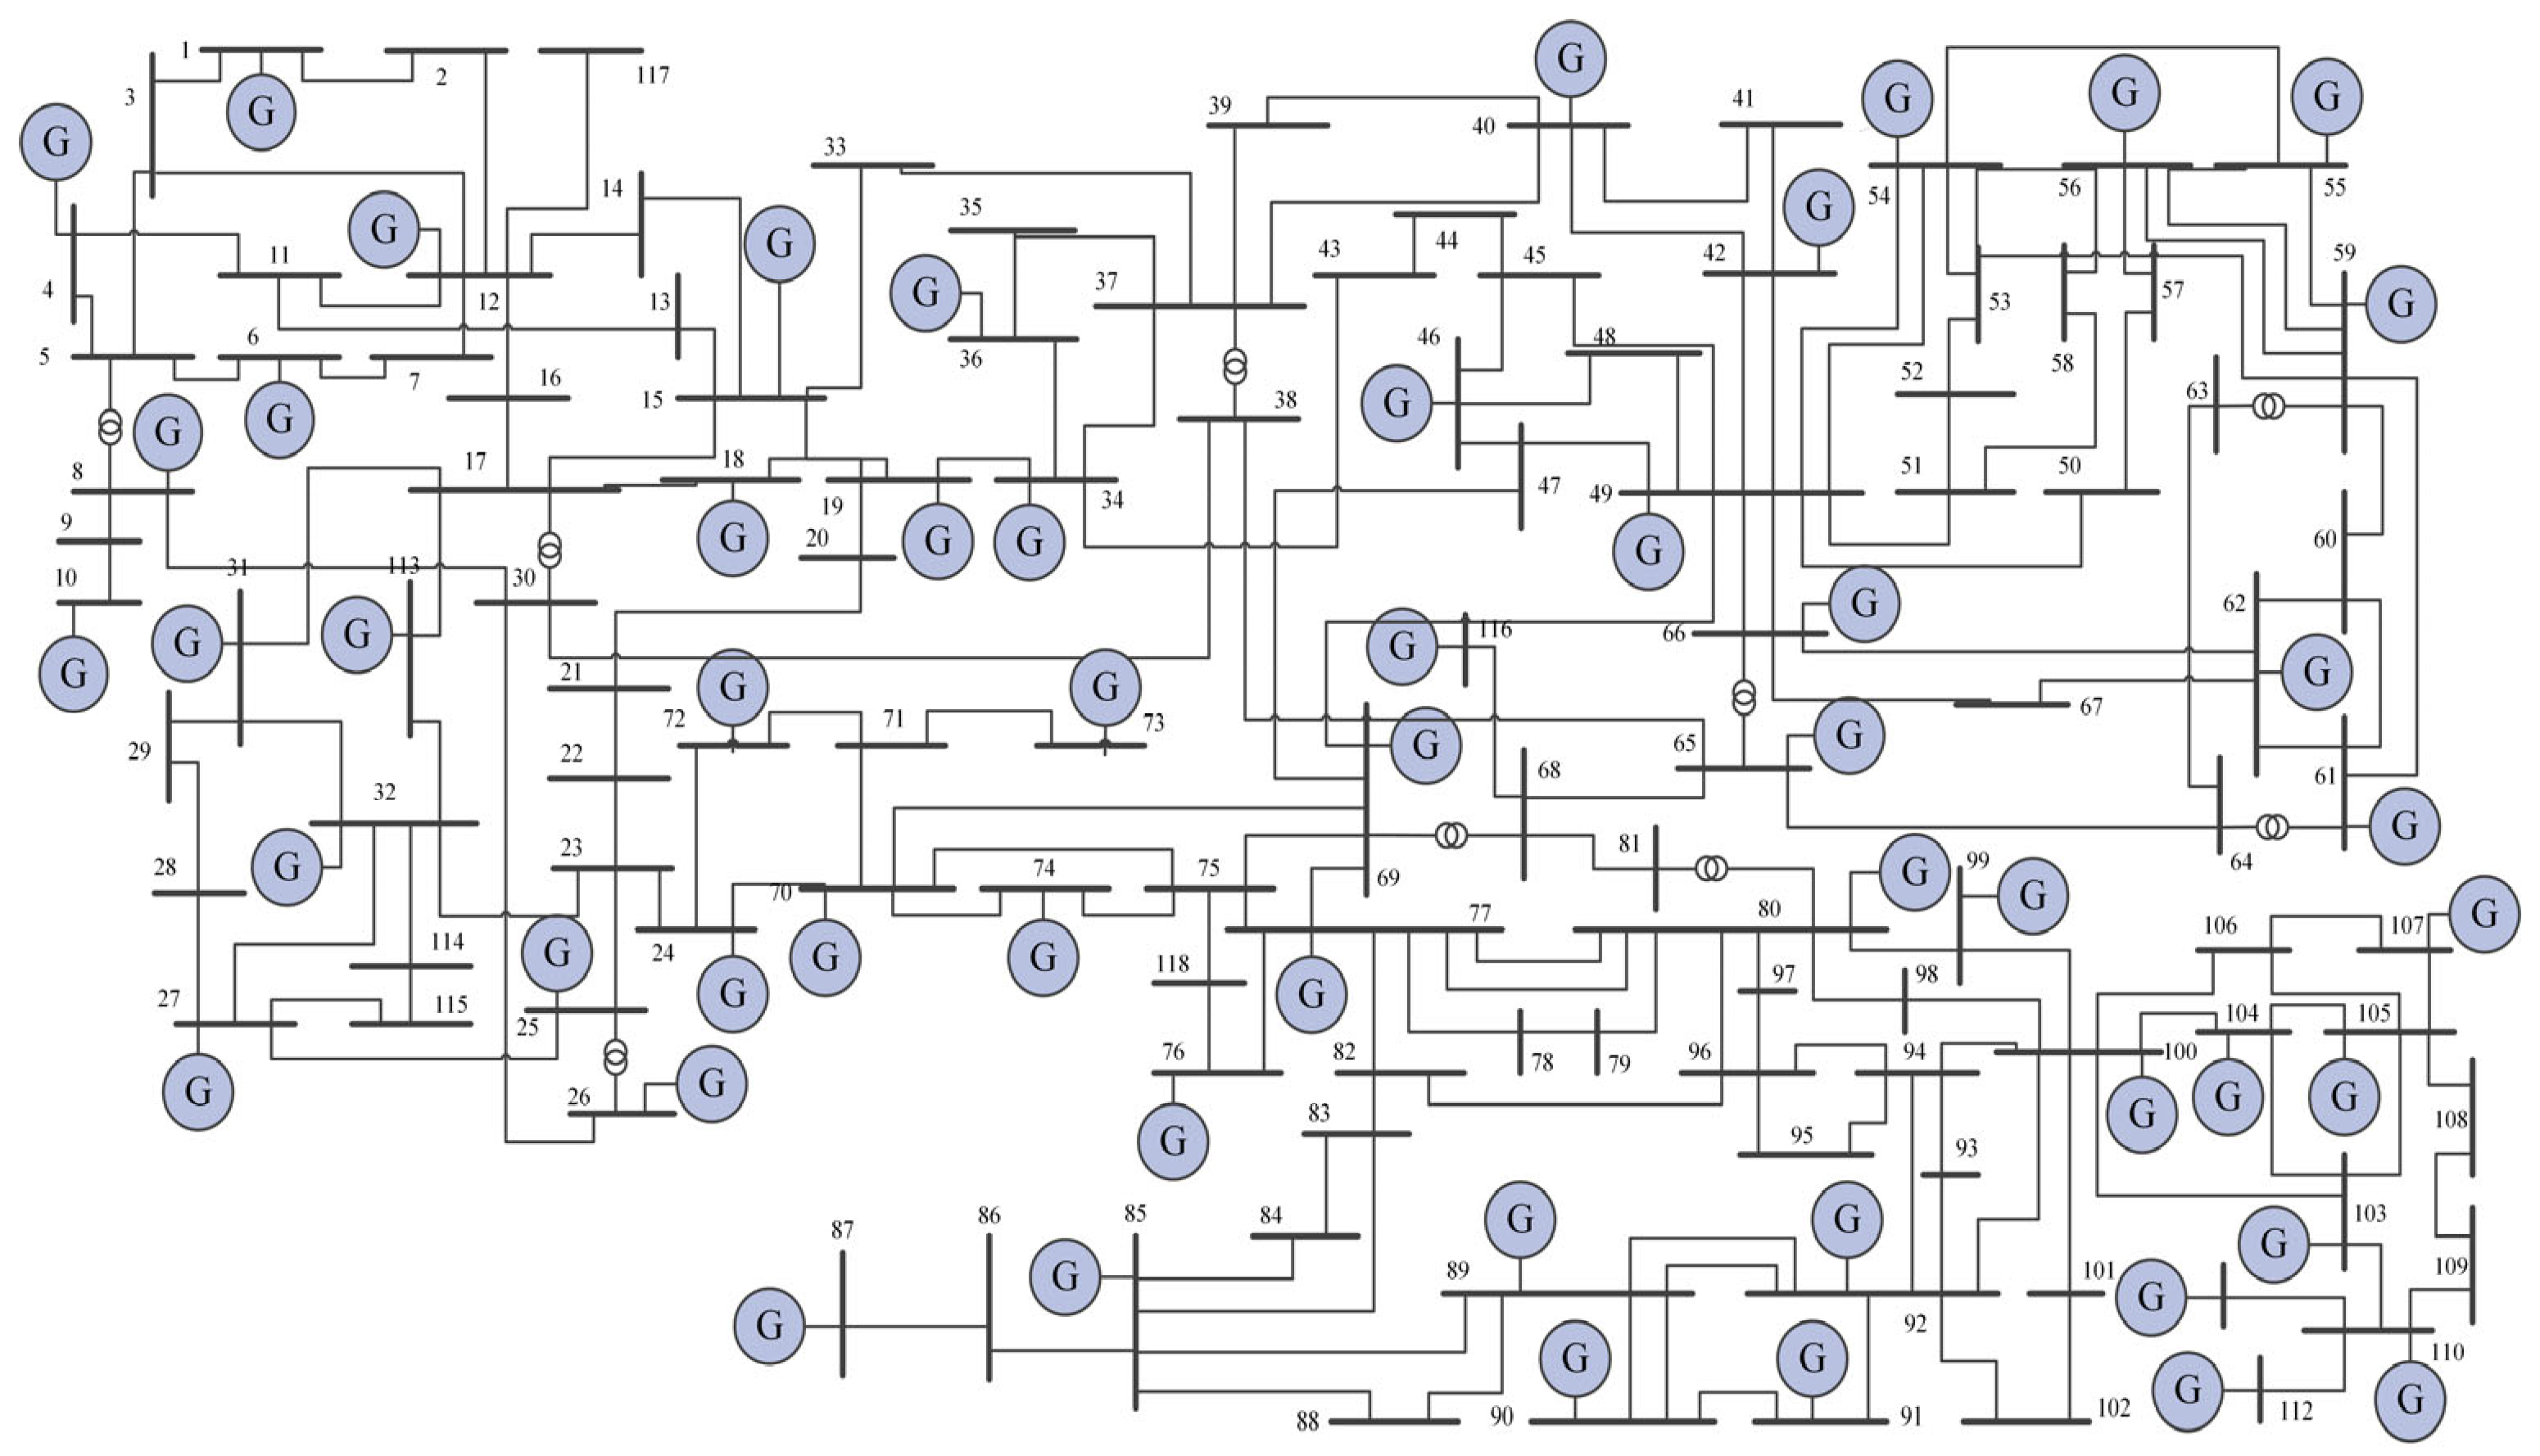
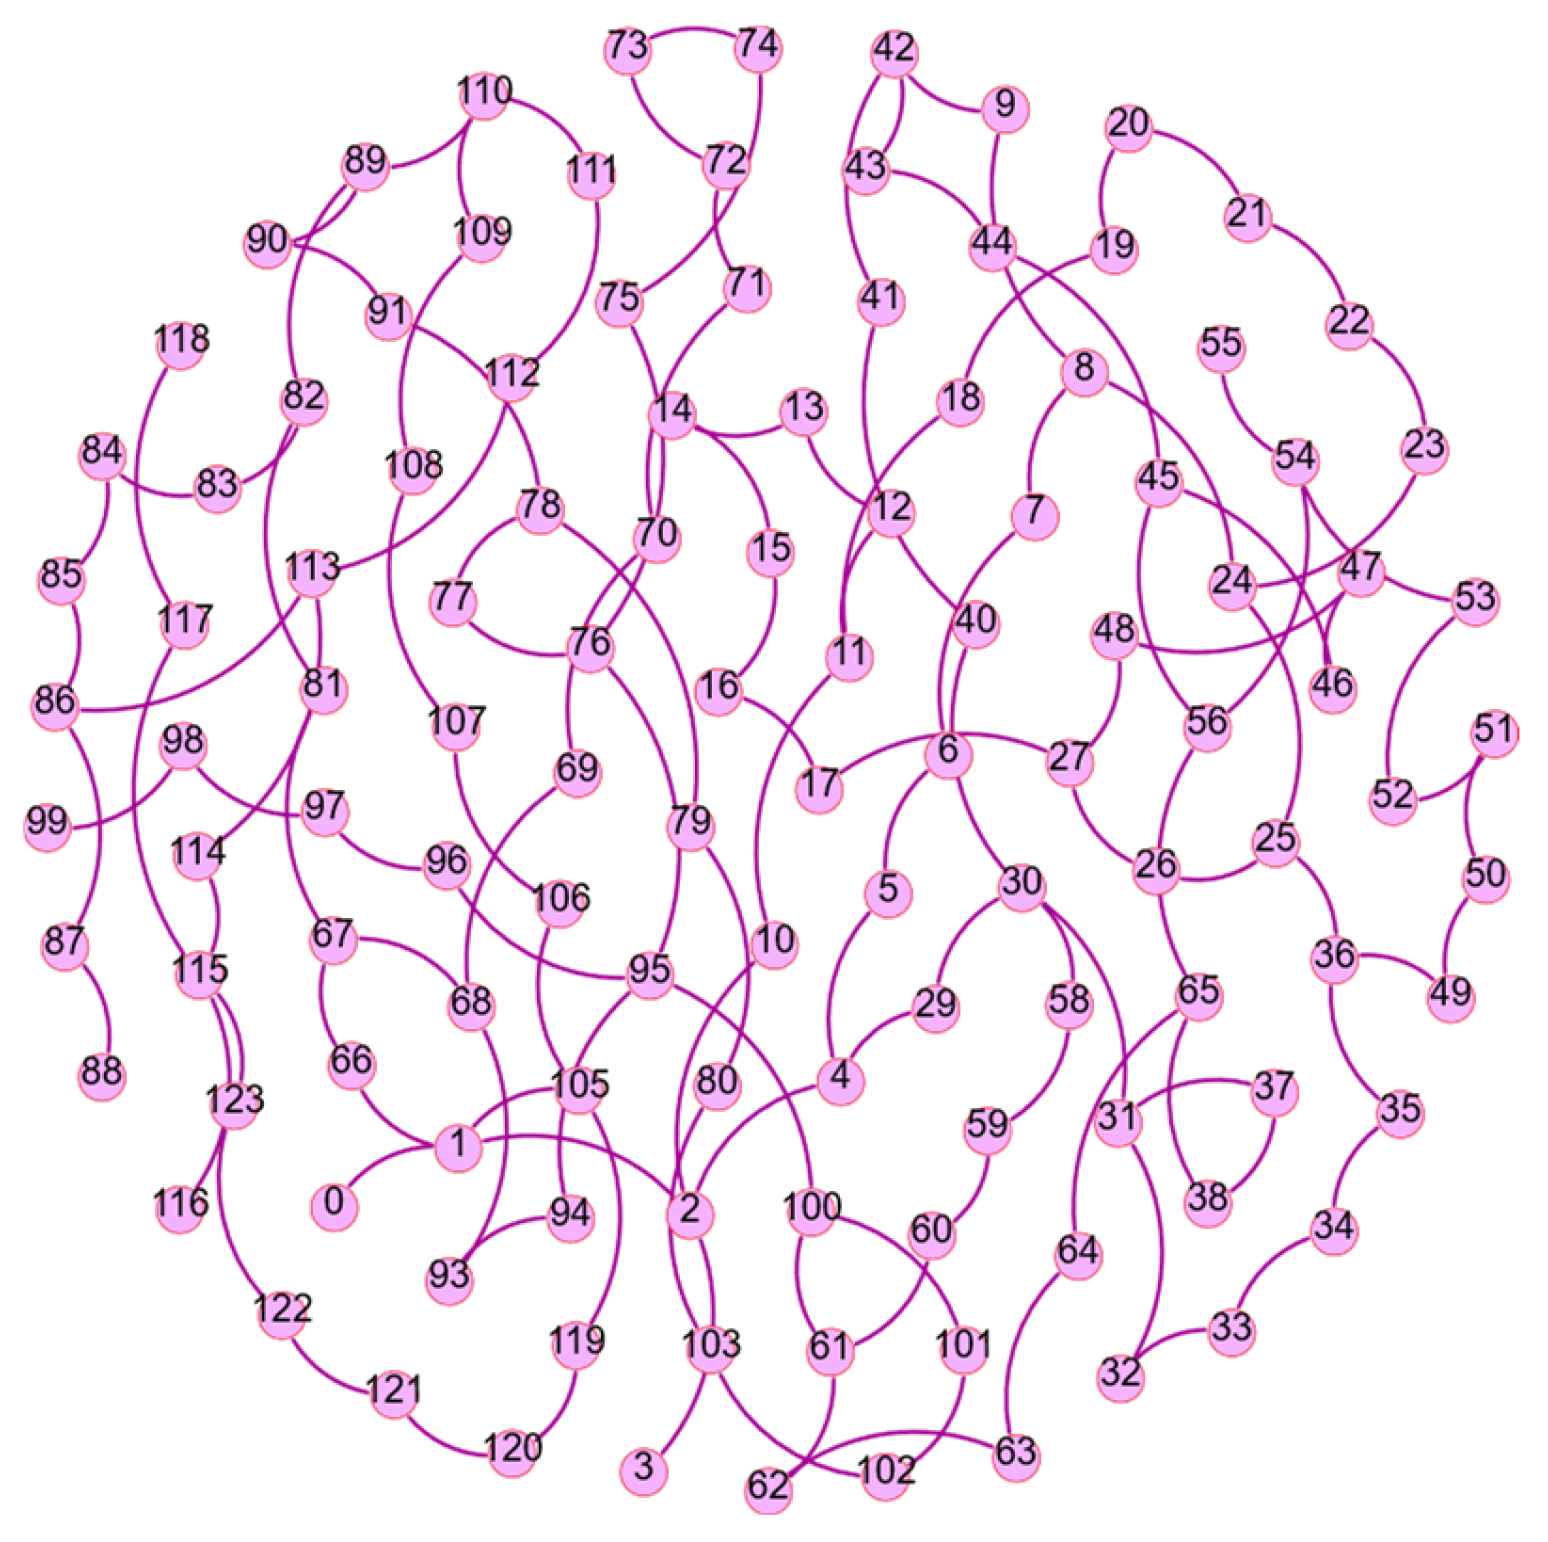
27]. The IEEE 118 bus system and the Belgian 20-node natural gas system are both internationally recognized engineering benchmark models. The IEEE 118 system is derived from the actual topology and parameters of the US regional power grid and has been classified as a standard test case by the North American Electric Reliability Corporation (NERC); meanwhile, the Belgian 20-node natural gas system is a classic research model in the field of energy and is often coupled with the power system. The bus connection diagram of the IEEE 118 system is shown in
Figure 3, and the network topology in
Figure 4. The power network consists of 118 nodes and 186 transmission lines, with 54 generator nodes. Since the predefined energy conversion mode is gas-to-power, only generator nodes are selected as coupling nodes in the power system model. (Also, it should be noted that the research in this paper focuses on coupling models that make the system more robust; therefore, scheduling and other economic issues are not considered for the time being.)
Since the predefined energy conversion mode in the coupled system is gas-to-power—i.e., replacing the coal-fired units at generator nodes in the power grid with gas-fired units—the coupling nodes in the power network are selected from the generator nodes. In the IEEE 118-bus system, the generator nodes are ranked by EPFI in ascending order, and the sequence of nodes is as follows: 69, 65, 49, 77, 70, 66, 80, 42, 24, 40, 54, 116, 74, 76, 99, 46, 62, 26, 34, 8, 32, 25, 59, 61, 15, 100, 72, 31, 56, 113, 19, 55, 18, 27, 85, 73, 36, 92, 104, 103, 12, 89, 4, 6, 91, 105, 110, 10, 107, 90, 1, 87, 112, 111.
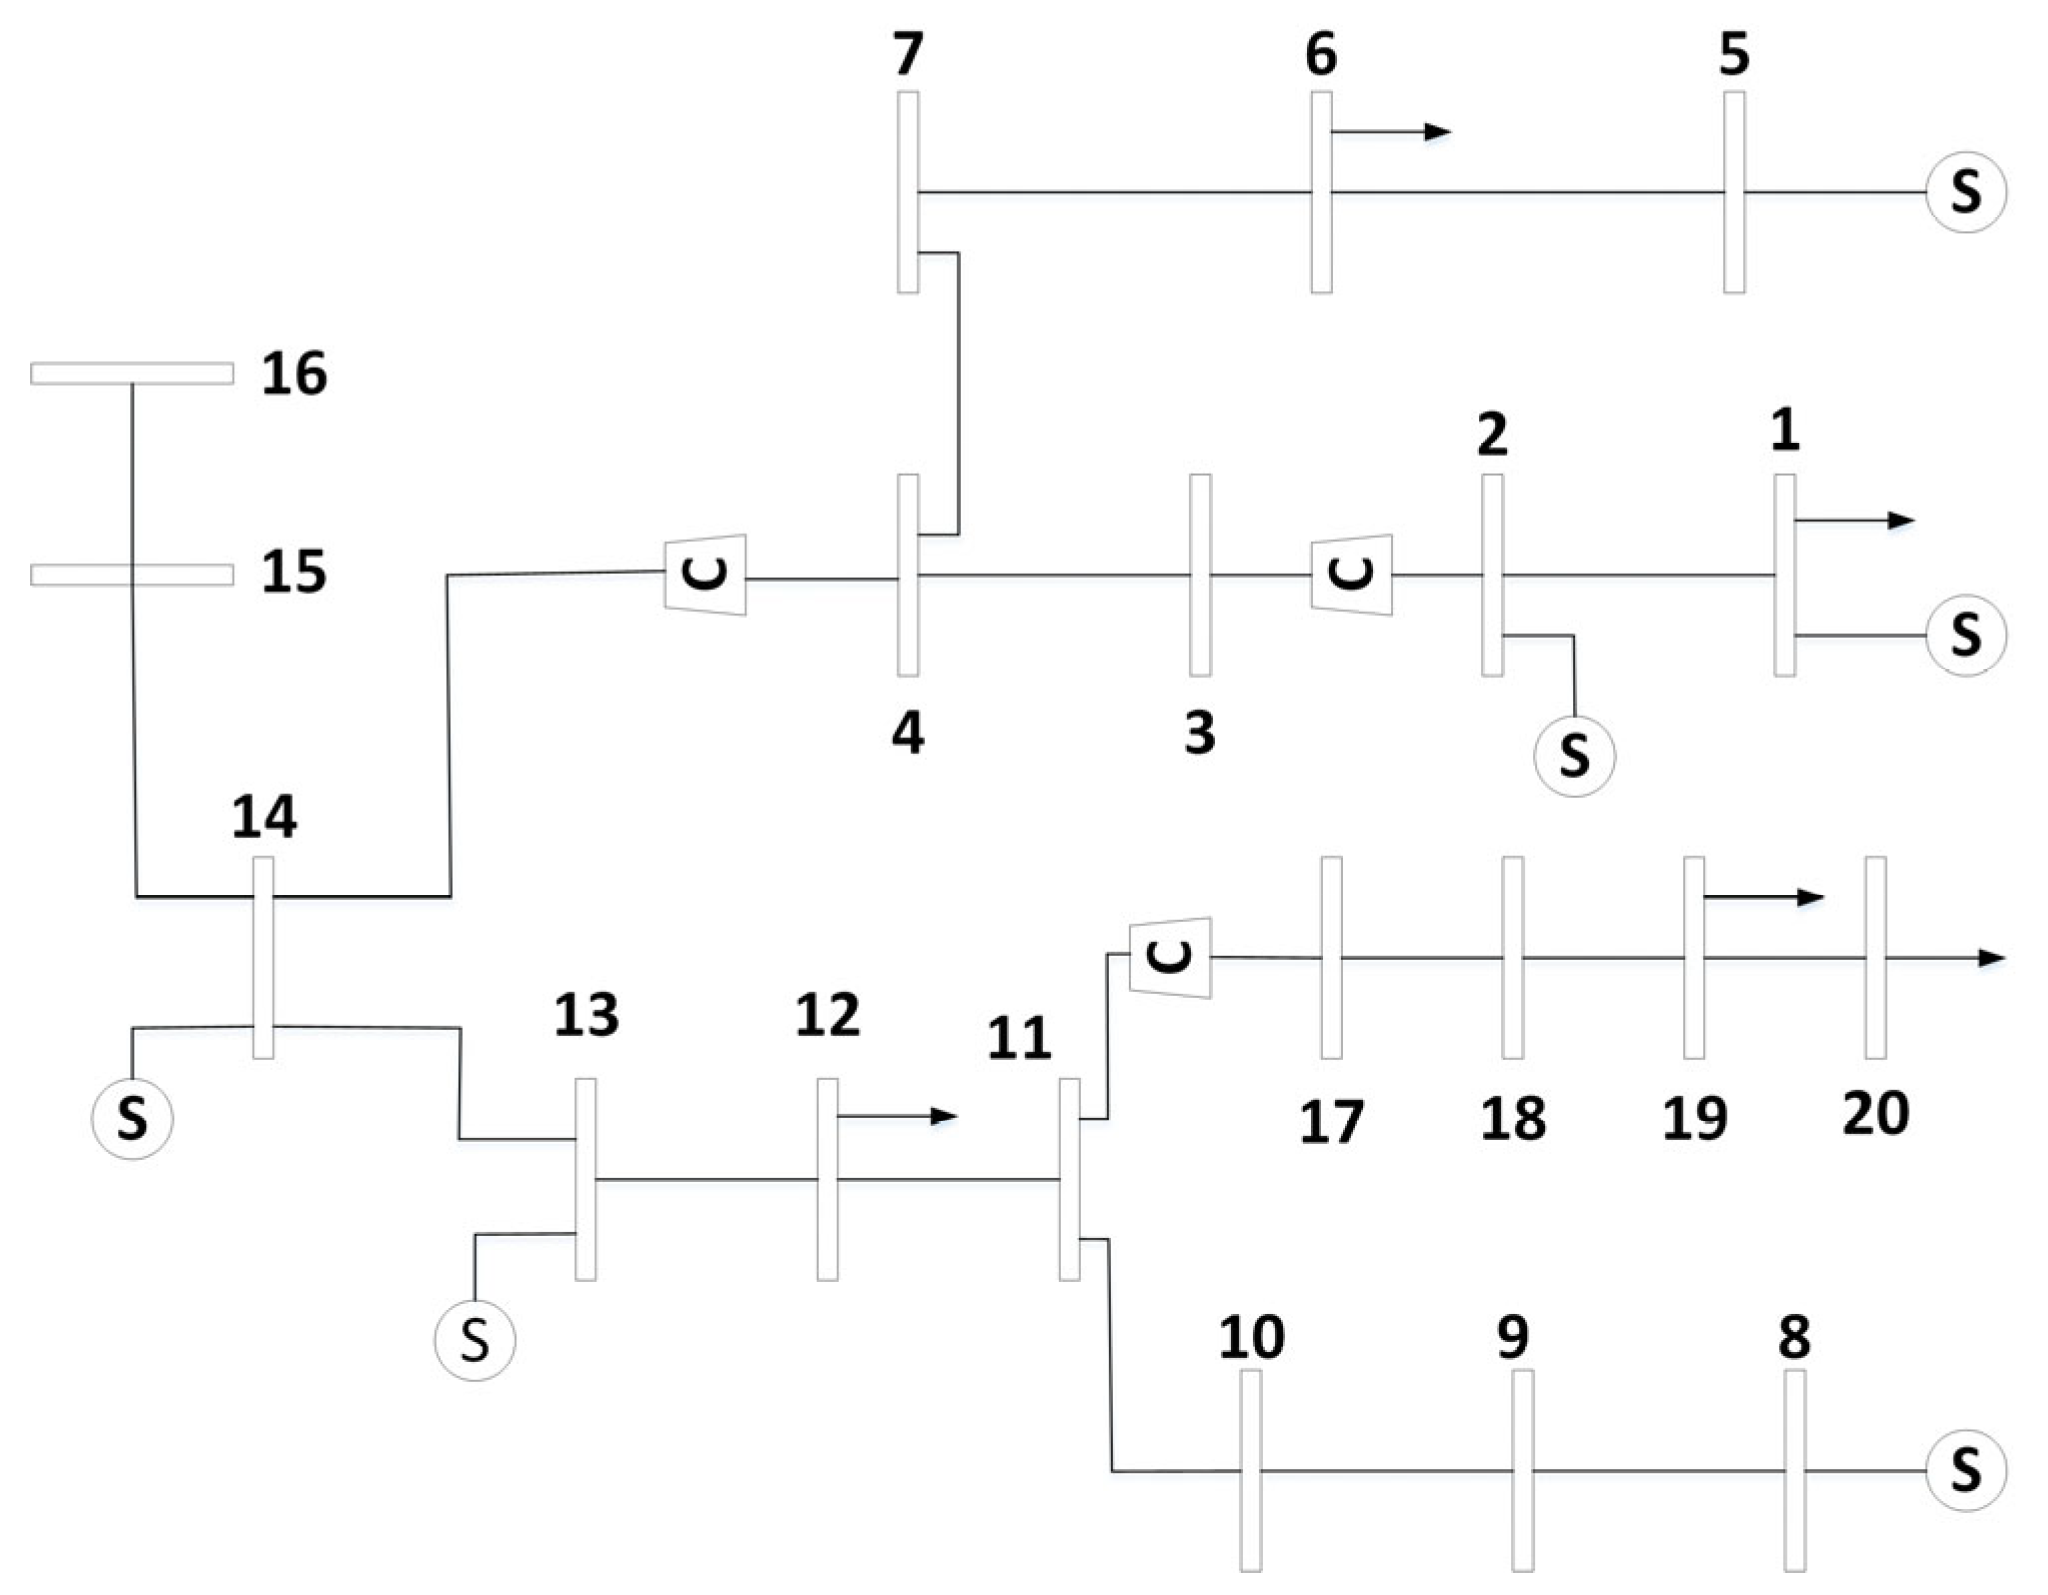
The node connection diagram of the 20-node Belgian gas network is shown in
Figure 5.
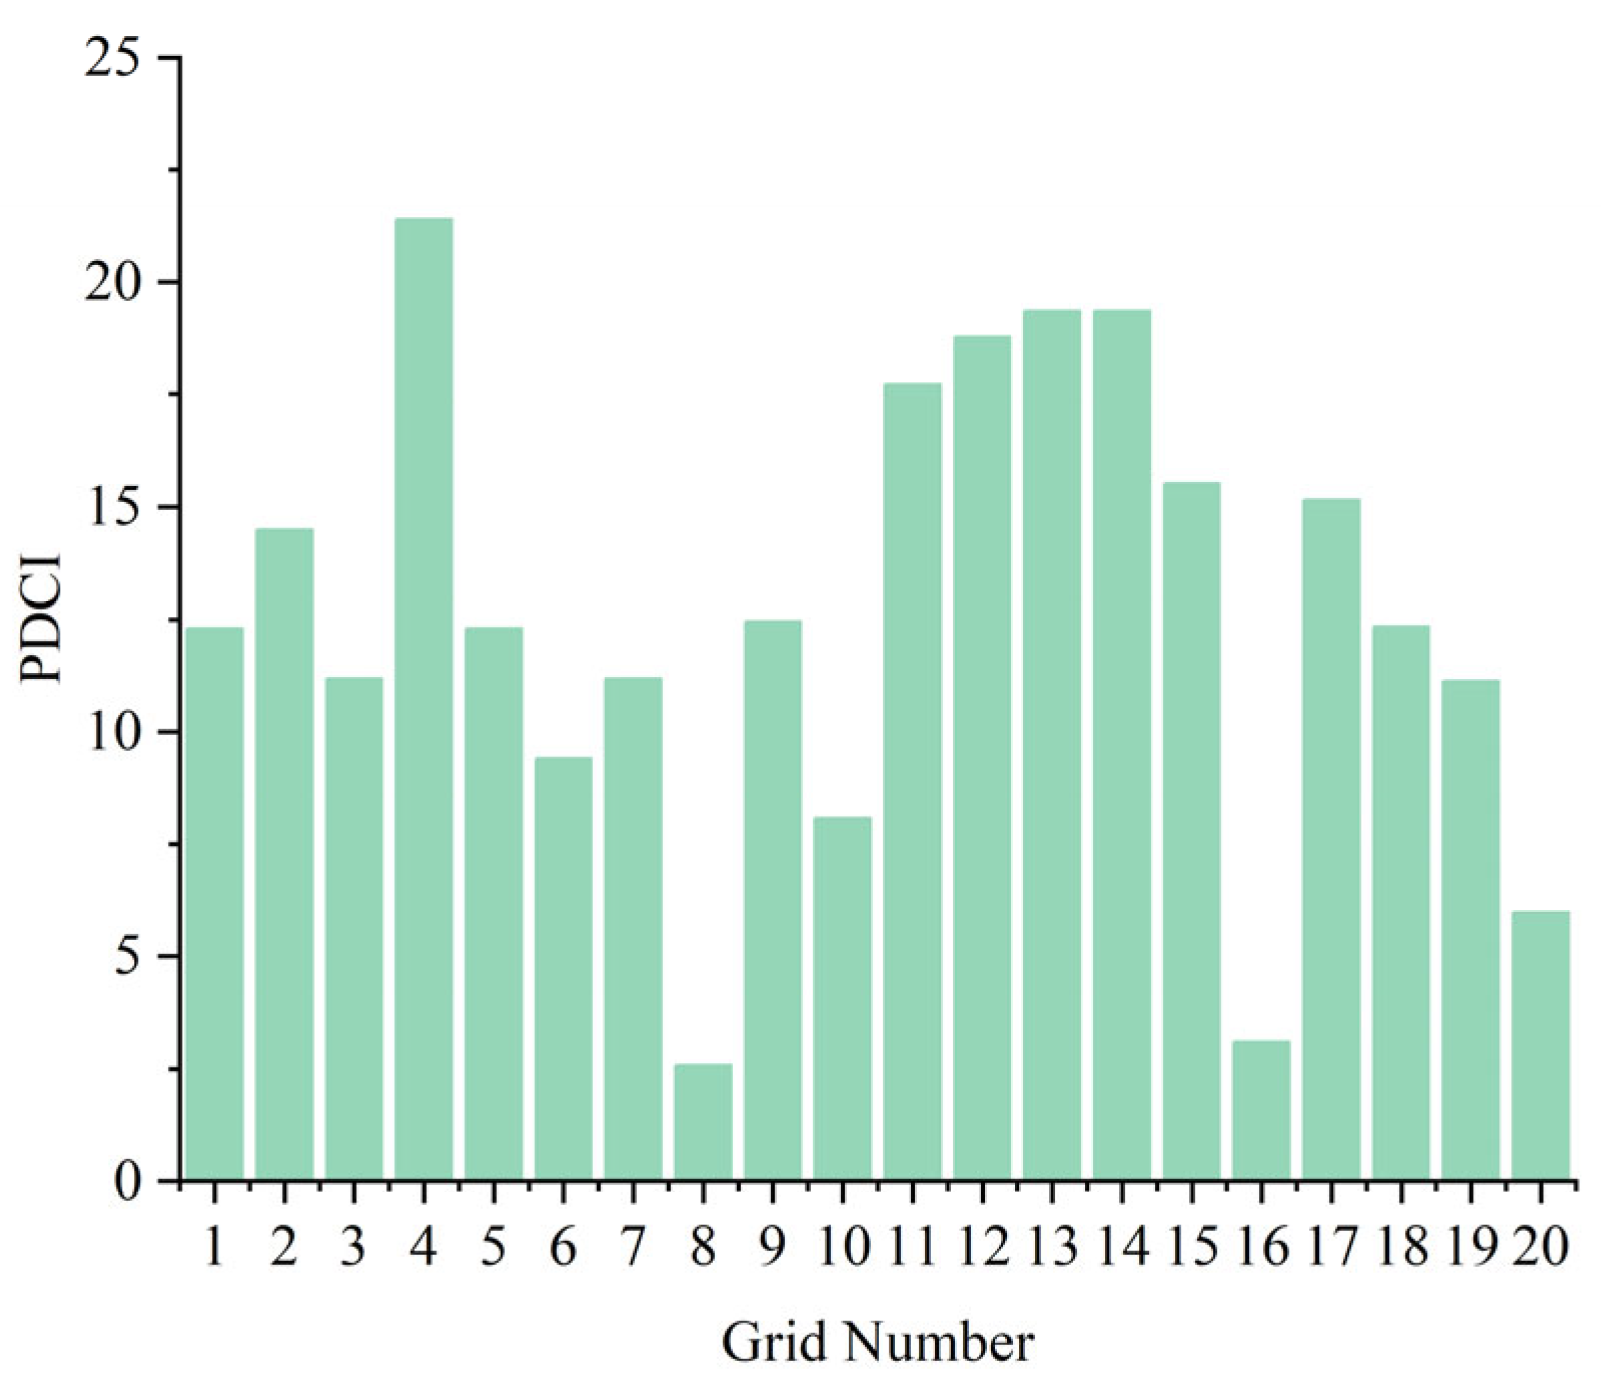
For the gas network, the coupling process is equivalent to adding a load, with the power grid representing that load. Therefore, any of the 20 nodes in the gas network can serve as coupling nodes. The results of the node ranking based on the PDCI are shown in
Figure 6, where the horizontal coordinates represent the nodes of the natural gas network and the vertical coordinates represent the results of the numerical calculation of the PDCI of the nodes. The 20 nodes, ranked in ascending order of PDCI, are as follows: 8, 16, 20, 10, 6, 19, 3, 7, 1, 5, 18, 9, 2, 17, 15, 11, 12, 13, 14, 4.
3.2. Coupling Schemes
EPFI is calculated for generator nodes in the power grid, while PDCI is calculated for nodes in the gas network. Based on the results, both EPFI and PDCI are sorted in ascending and descending order. Using these node ranking indicators and coupling strategies, the corresponding coupling systems are constructed.
- (1)
Assortative coupling system
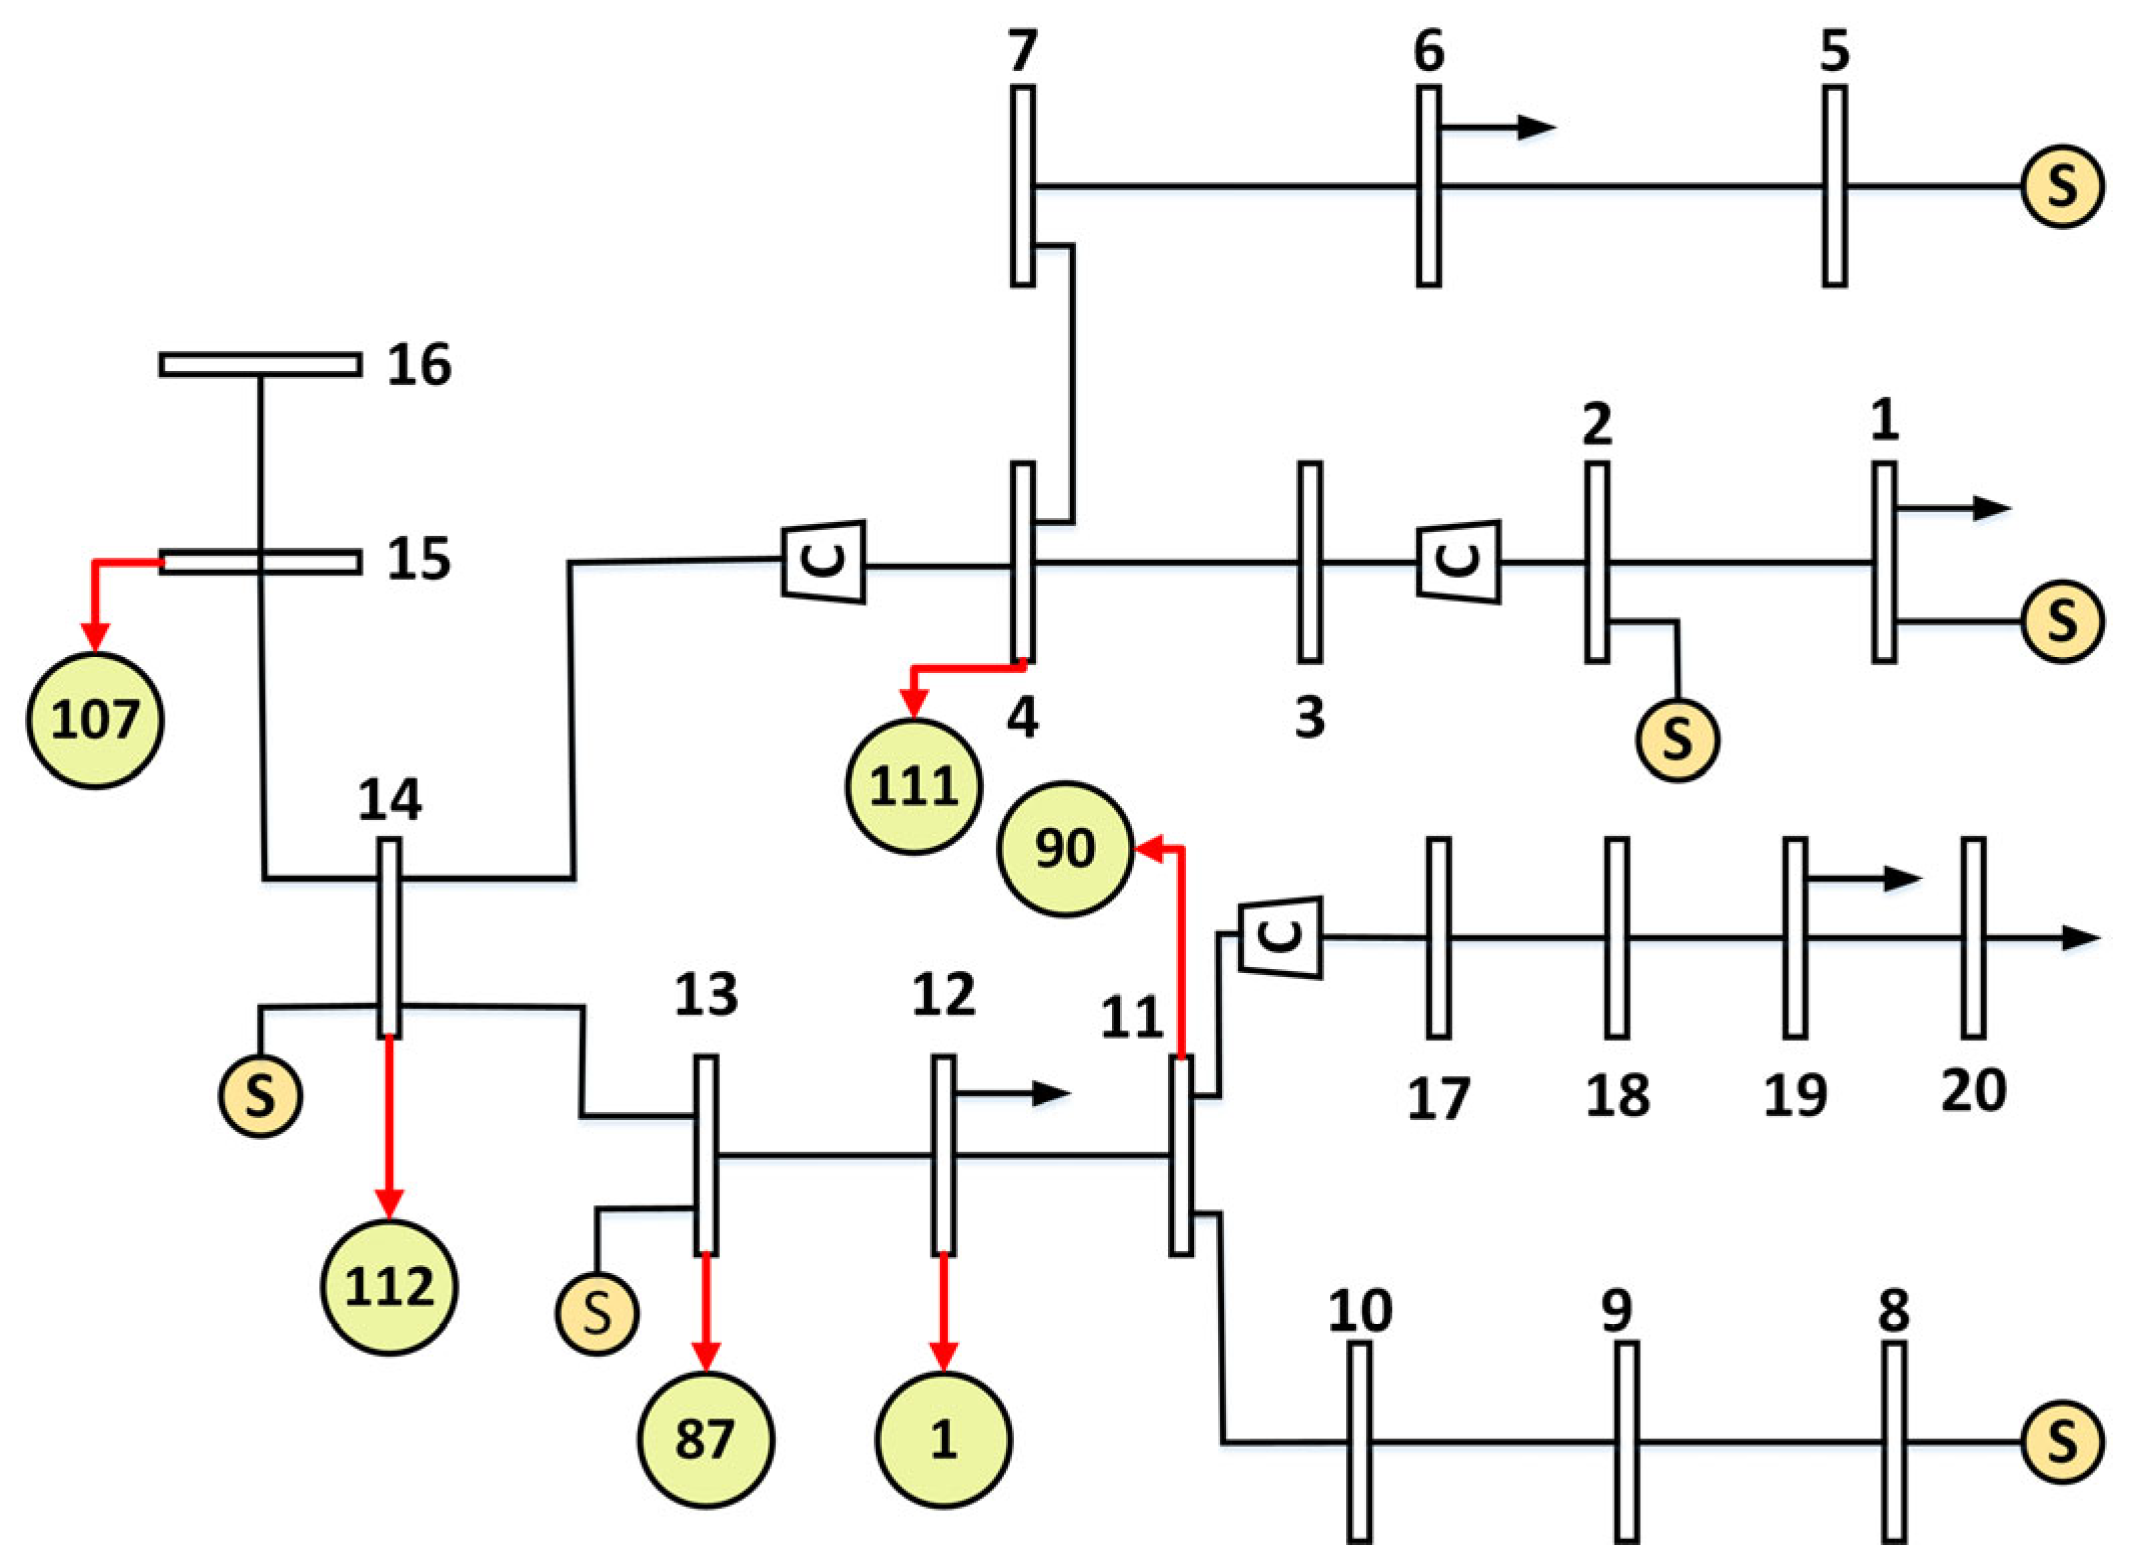
The EPFI values of generator nodes in the power grid are sorted in descending order, and the top six nodes are selected. Similarly, the PDCI values of gas network nodes are sorted in descending order, and the top six nodes are also selected. (Firstly, a node ratio of 5–10% was used to match the size difference between the two systems to strike a balance between simulation accuracy and computational resources; secondly, six coupled nodes were chosen due to the need for comparability of cases and results in the relevant literature.) These nodes are then paired one-to-one in descending order to form an assortative (homophilic) coupling system. Specifically, power grid nodes 111, 112, 87, 1, 90, and 107 are coupled with gas network nodes 4, 14, 13, 12, 11, and 15, respectively. The assortative coupling structure is shown in
Figure 7. The numbers in the yellow circles are the corresponding coupling nodes of the grid.
- (2)
Disassortative coupling system
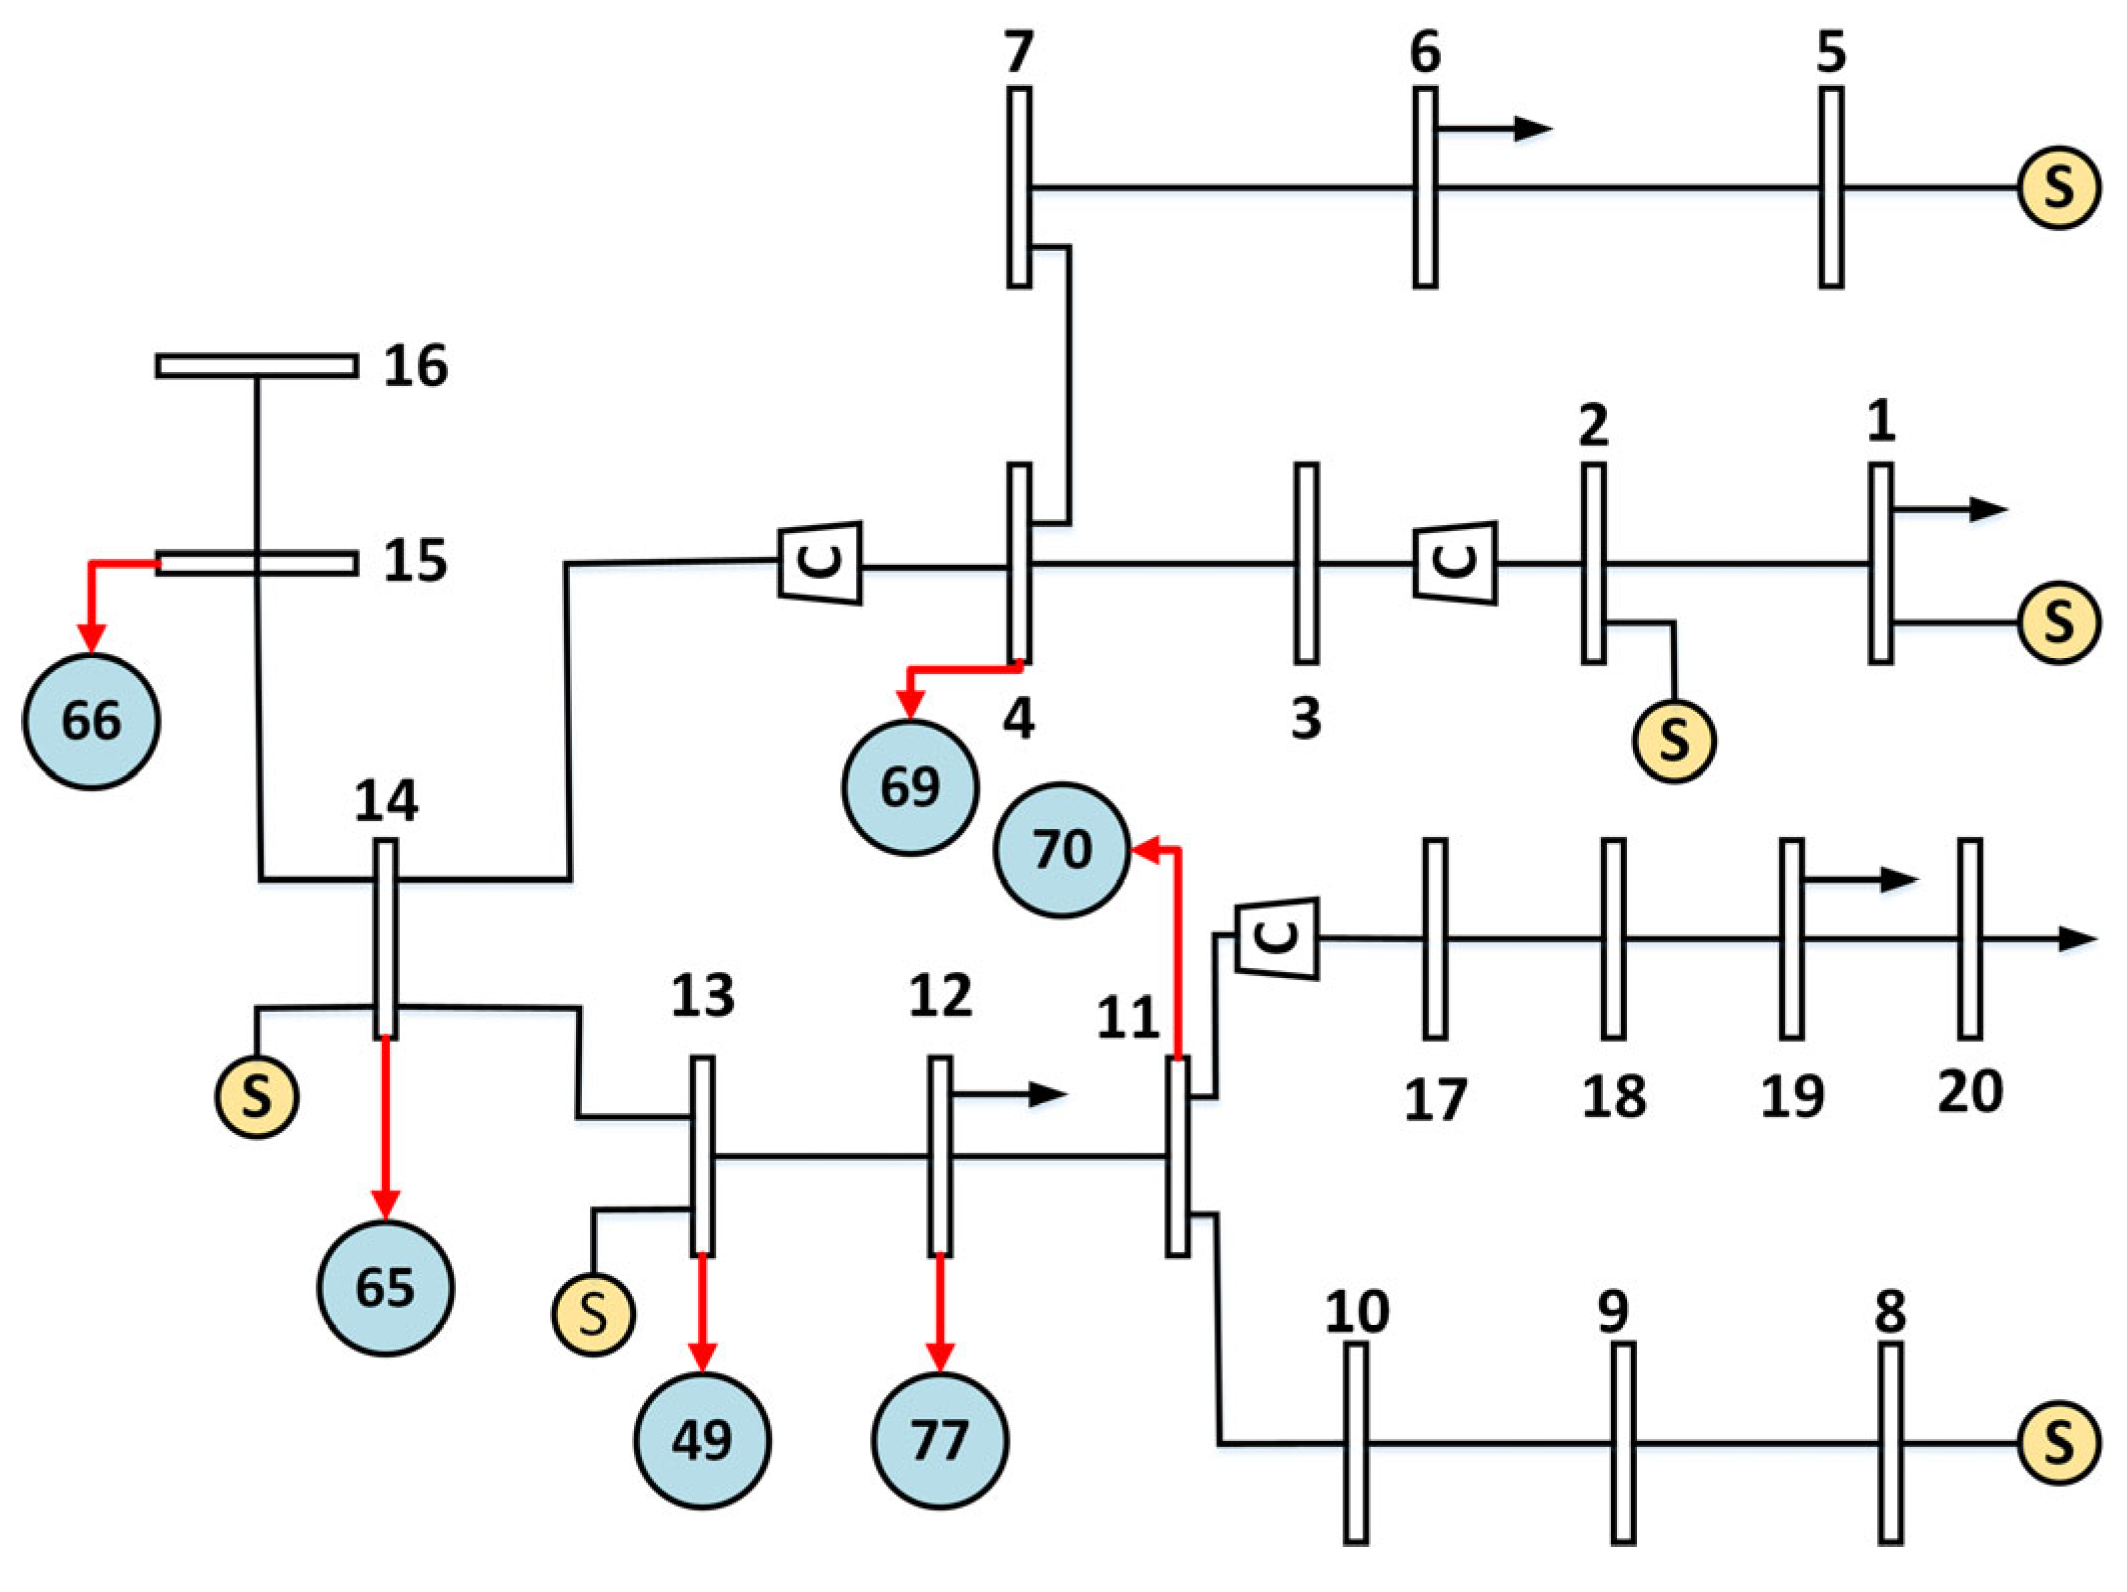
The EPFI values of generator nodes in the power grid are sorted in ascending order, and the top six nodes are selected. Meanwhile, the PDCI values of gas network nodes are sorted in descending order, and the top six nodes are also selected. These nodes are then paired one-to-one in order to form a disassortative coupling system. Specifically, power grid nodes 69, 65, 49, 77, 70, and 66 are coupled with gas network nodes 4, 14, 13, 12, 11, and 15, respectively. The disassortative coupling structure is shown in
Figure 8, where the numbers in the blue circles represent the corresponding coupling nodes of the grid.
- (3)
Random coupling system
The random coupling system has no fixed connection pattern; coupling nodes are randomly selected from the generator nodes in the power grid and the nodes in the gas network. Moreover, the coupling nodes of the stochastic coupling system for testing the network efficiency and the maximum connectivity subgraph were selected by random sampling by SPSS software 26.0.
4. Results and Discussion
Based on the coupling schemes, different assortative, disassortative, and random coupling systems are constructed and subjected to attack experiments. For each type of attack, the results from the first 10 iterations are recorded. (Collaborative attacks in real energy systems are usually limited by the resources of the attacker, making it difficult to damage more than 10 critical facilities with high levels of protection at the same time in a short period of time). Intentional attacks are more effective in disrupting the network, often causing greater damage with fewer attacks. For example, high-degree nodes act as hubs, responsible for significant energy transmission or conversion. Once such nodes are attacked, it not only affects their individual functions but also severely impacts the overall energy flow and processing capacity of the network.
- (1)
Network efficiency
Figure 9A–C show network efficiency under degree, betweenness, and random attacks, respectively (The results of network efficiency and maximum connectivity subgraph obtained from all random attacks are averaged after 35 random attacks). The x-axis represents the number of attacked nodes, and the y-axis represents network efficiency. The black line shows the assortative system, the blue line the random system, and the red line the disassortative system.
The results clearly indicate that the disassortative coupling system consistently outperforms the others in robustness across all attack types. Under equal attack intensity, its network efficiency remains the highest. This is due to its ability to reroute energy or reschedule operations, ensuring stable performance and adaptive response. Moreover, unaffected parts of the system help compensate for losses, maintaining overall balance.
- (2)
Largest Connected Component
Figure 10A–C show the changes in the largest connected component under degree, betweenness, and random attacks, respectively. The x-axis represents the number of attacked nodes, and the y-axis represents the size of the largest connected component. The black line represents the assortative coupling system, the blue line the random coupling system, and the red line the disassortative coupling system.
As shown in the figures, during the first three rounds of degree attacks, there is little difference between the largest connected components of the assortative and disassortative systems. However, starting from the fourth attack, the largest connected component of the assortative system drops significantly by 3.7%. From the fifth attack onward, the random system also begins to show a clear gap compared to the disassortative system. By the tenth attack, the largest connected component of the disassortative system is larger than both others—1.09 times that of the random system and 1.12 times that of the assortative system.
Under betweenness attacks, the disassortative coupling system also consistently maintains a larger connected component than the other two systems. The assortative system shows significant fluctuations, dropping sharply by 5.4% starting from the 8th attack. By the 10th attack, the largest connected component of the disassortative system is 1.09 times that of the assortative system.
Across the same number of attacks, the disassortative system maintains a higher largest connected component, indicating that the coupling model—based on both actual operational parameters and topological characteristics—offers superior robustness, redundancy, and intelligent response capabilities. This design ensures that the system can withstand various external threats (e.g., targeted attacks, natural disasters, and equipment failures) and recover stability quickly, thereby ensuring energy supply security and enhancing system adaptability and self-healing ability.
In the previous analyses, it is known that disassortative coupling is the coupling mode that makes the coupled system more robust; therefore, to further verify the robustness of the proposed coupling model, the disassortative system from this study is compared with systems from other literature using the same attack experiments. The results from the first 10 attacks are analyzed, as shown in
Figure 11 and
Figure 12.
Figure 11A–C show the network efficiency under degree attacks, betweenness attacks, and random attacks, respectively. The horizontal axis represents the number of attacks, and the vertical axis represents network efficiency. The red curve represents the disassortative coupling system proposed in this paper; the black curve corresponds to Literature 1 [
28]; the blue curve to Literature 2 [
29]; and the green curve to Literature 3 [
30]. The coupling schemes of the three control literature are shown in
Table 2. The approach presented in this paper is consistent with the scale of the coupled electricity–gas system of the control literature, which consists of an electric power system at the IEEE 118 node and a natural gas system at the Belgian 20 node.
As shown in the figure, the network efficiency of the disassortative coupling system proposed in this study is consistently higher than that of the three reference systems. Moreover, its efficiency remains relatively stable throughout the first 10 attacks. In contrast, Literature 1 exhibits a significant fluctuation under betweenness attacks, with a noticeable drop in efficiency between the 7th and 8th attacks.
Figure 12A–C represent the changes in the largest connected component under degree attacks, betweenness attacks, and random attacks, respectively. The horizontal axis indicates the number of attacks, and the vertical axis represents the size of the largest connected component. The red curve corresponds to the disassortative coupling system proposed in this chapter, while the black, blue, and green curves correspond to Literature 1, Literature 2, and Literature 3, respectively.
From the figure, it can be observed that regardless of the attack type—degree, betweenness, or random—the disassortative coupling system consistently has a higher largest connected component compared to the reference systems. Notably, under betweenness attacks, Reference 1 experiences a significant drop in the largest connected component after the 8th attack, with a decrease of 22.6%. By the 10th attack, the largest connected component of the disassortative coupling system is 1.29 times that of Literature 1.
In summary, under all attack types (degree, betweenness, and random attacks), the disassortative coupling system outperforms the reference systems in terms of both network efficiency and the largest connected component. This means that for the same number of attacks, the coupling system proposed in this chapter—considering both network topology and actual operational parameters—demonstrates significantly higher robustness and attack resistance.
5. Conclusions
This study systematically explores the concept of closeness centrality within network topology and introduces two novel node ranking indicators—Electrical Power Failure Impact (EPFI) for power grids and Pipeline Delivery Criticality Index (PDCI) for natural gas networks—by integrating actual operational parameters. Utilizing these indicators, three coupling configurations are constructed: assortative-coupled, disassortative-coupled, and random-coupled systems.
To verify the effectiveness of the proposed coupling strategies, system robustness was evaluated under varying coupling modes using three attack methodologies: degree-based, betweenness-based, and random attacks. Comparative analysis based on network efficiency and the size of the largest connected component under each attack scenario reveals that disassortative coupling, guided by EPFI and PDCI indicators, consistently improves the resilience of the electricity–gas integrated system.
Accordingly, the disassortative coupling mode is recommended as a priority consideration in the planning and design of integrated electricity–natural gas infrastructures. Future research will investigate how bidirectional energy flow between power grids and gas networks influences optimal coupling configurations, aiming to further enhance system stability and reliability. Follow-up work could build on this paper with further consideration of economics.
