Abstract
Slope stability assessment is a critical component of engineering safety. Conventional analytical methods frequently struggle to integrate heterogeneous slope data and model intricate failure mechanisms, thereby constraining their efficacy in practical engineering scenarios. To tackle these issues, this study presents a novel slope stability classification model grounded in the Optuna-TPE-CatBoost framework. By leveraging the Tree-structured Parzen Estimator (TPE) within the Optuna framework, the model adaptively optimizes CatBoost hyperparameters, thus enhancing prediction accuracy and robustness. It incorporates six key features—slope height, slope angle, unit weight, cohesion, internal friction angle, and the pore pressure ratio—to establish a comprehensive and intelligent assessment system. Utilizing a dataset of 272 slope cases, the model was trained with k-fold cross-validation and dynamic class imbalance strategies to ensure its generalizability. The optimized model achieved impressive performance metrics: an area under the receiver operating characteristic curve (AUC) of 0.926, an accuracy of 0.901, a recall of 0.874, and an F1-score of 0.881, outperforming benchmark algorithms such as XGBoost, LightGBM, and the unoptimized CatBoost. Validation via engineering case studies confirms that the model accurately evaluates slope stability across diverse scenarios and effectively captures the complex interactions between key parameters. This model offers a reliable and interpretable solution for slope stability assessment under complex failure mechanisms.
1. Introduction
Slope stability is influenced by a combination of factors, including geological structures, geotechnical properties, hydrological conditions, and mining practices, leading to significant nonlinearity and complexity in its behavior. Traditional analytical methods, including limit equilibrium and finite element approaches, are supported by sound theoretical foundations and engineering experience. However, they exhibit significant limitations in modeling nonlinear interactions among complex variables, integrating heterogeneous slope data, and expressing system uncertainty. Therefore, these methods often fall short of meeting the demands for rapid and accurate slope stability prediction under complex working conditions, including large terrain elevation differences, steep slopes, and deep excavation scenarios.
In recent years, with the rapid advancement of artificial intelligence and data science, machine learning techniques have seen increasingly deep applications in geological disaster analysis, particularly showing promising potential in slope stability evaluation. In China, Li X et al. proposed a slope stability prediction model driven by multi-source monitoring data and based on ensemble learning techniques, which enhanced both feature integration and prediction accuracy [1]; Zhang Weilong developed a predictive model based on feedforward neural networks, optimizing its structure and parameters through grid search and cross-validation to improve model robustness [2]; Zhang Lingfan et al. adopted gradient-boosting decision trees (GBDTs) to integrate multi-source geological information, improving model generalization performance [3]; Zhang Huajin et al. introduced an automatic machine learning (AutoML) framework for slope stability prediction, automating algorithm selection and hyperparameter tuning to increase modeling efficiency on large-scale datasets [4]. Internationally, Khan and Rahman proposed an XGBoost-TreeSHAP model that combines high predictive accuracy with strong interpretability [5]; Chen and Fan demonstrated that convolutional neural networks (CNNs) excel in extracting spatiotemporal features of landslides [6]; Ghobanzadeh et al. developed a landslide detection model using the Landslide4Sense benchmark dataset and multi-source satellite imagery, improving detection accuracy [7]; Wang et al. proposed an enhanced Mask R-CNN-based approach for rapid seismic landslide detection, demonstrating its high efficiency and precision [8]. Among these approaches, gradient-boosting decision trees (GBDTs) have gained popularity for their outstanding capabilities in modeling feature interactions, adaptive parameter tuning, and generalization.
CatBoost, as one of the latest GBDT implementations, is particularly well-suited for modeling complex structures and high-dimensional data. Its performance, however, is highly reliant on the proper configuration of hyperparameters. To mitigate this issue, optimization frameworks such as Optuna—which incorporates advanced sampling algorithms like the Tree-structured Parzen Estimator (TPE)—provide promising solutions for automated and efficient hyperparameter tuning. Despite these advancements, a research gap persists in the application of optimized CatBoost models to slope stability assessment, particularly regarding model interpretability, feature importance, and comparisons with alternative machine learning approaches.
Against this backdrop, this study proposes an Optuna-based optimization framework for the CatBoost model. As a new-generation gradient-boosting algorithm, CatBoost is well-suited for modeling complex structures and high-dimensional data, though its performance heavily depends on appropriate hyperparameter configurations. By incorporating the Tree-structured Parzen Estimator (TPE) algorithm from the Optuna framework, this study dynamically optimizes critical hyperparameters and establishes an Optuna-TPE-CatBoost evaluation system. The primary objective of this research is to develop and validate a robust machine learning model for slope stability assessment, with a focus on model interpretability, sensitivity analysis, and comparative performance evaluation against existing machine learning methods.
The model incorporates cross-validation and class imbalance handling techniques to enhance its robustness and generalizability. Validation through engineering case studies shows that the proposed evaluation model performs well in practical applications and is useful and informative for slope stability analysis. The remainder of this paper is organized as follows: Section 2 presents the methodology, including feature selection and sample data analysis (Section 2.1), model algorithm principles (Section 2.2), and model construction and performance evaluation (Section 2.3); Section 3 discusses engineering case verification; Section 4 provides conclusions and future prospects.
2. Methodology
This Section introduces the research methods applied in this study, including the data collection process, preprocessing techniques, and modeling approaches. Detailed descriptions of each step are provided below.
2.1. Feature Selection and Sample Data Analysis
2.1.1. Feature Identification and Sample Selection
Selecting appropriate evaluation indicators as features is essential to effectively reflect the characteristics of the target system. Slope stability is inherently a complex nonlinear problem influenced by multiple factors. In practical engineering applications, slope stability is affected by various conditions, including stratigraphy, lithology, geological structures, in situ stress, rock mass structure, groundwater, and slope geometry (e.g., height and angle) [9]. Among them, slope height and angle are fundamental geometric parameters that directly influence failure conditions in geomaterials. According to the Mohr–Coulomb failure criterion, cohesion and internal friction angle are two critical indicators for evaluating stability. When the internal friction angle equals the angle between the resultant force and the normal stress, the system reaches a limited equilibrium state, and failure occurs due to shear action [10]. The role of slope water can be characterized by the pore pressure ratio to reflect changes in injection volume and rainfall processes [11]. Although structural discontinuity parameters such as joint orientation and bedding plane attitudes are crucial for slope stability, they were not directly included as independent input features.
The geometric parameters, height (H) and slope angle (β), represent the morphological influence of the slope; the key physical and mechanical properties of the rock–soil mass are reflected by unit weight (γ), cohesion (C), and the internal friction angle (φ). Stability tends to increase with decreasing γ and increasing C and φ. However, a higher pore pressure ratio (ru) tends to reduce slope stability. Therefore, six indicators were selected as the input features for this study: slope height (H), slope angle (β), unit weight (γ), cohesion (C), the internal friction angle (φ), and the pore pressure ratio (ru).
To ensure the quality and reliability of the evaluation model, 272 slope stability data samples were collected based on the six selected features, including 120 failure cases and 152 stable cases [12,13,14,15]. These samples cover various types of slopes with practical engineering backgrounds. Partial data samples are presented in Table 1. A subset of the dataset is available in the Supplementary Materials (Table S1).

Table 1.
Partial slope sample data.
2.1.2. Statistical Characteristics and Correlation Analysis of Slope Data
The violin plots of the slope feature variables are presented in Figure 1. In these plots, the left side illustrates the distribution of individual data points, while the right contour width indicates the density of the data distribution. The figure shows that height, cohesion, and pore pressure ratio values are predominantly concentrated within specific intervals, with a few scattered outliers. The internal friction angle exhibits a pattern that is consistent with a normal distribution. However, slope angle and unit weight are relatively evenly distributed across their respective ranges. Regarding slope height, the dataset covers a wide spectrum, including low, medium, high, and ultra-high slopes. In terms of slope angle, the samples include gentle, moderate, and steep slopes. Considering the combined characteristics of the internal friction angle, cohesion, and unit weight, it can be inferred that the dataset comprises diverse slope types, including both soil and rock slopes, as well as composite slopes with varying lithological compositions. In summary, this dataset integrates a broad range of slope conditions and properties, making it well-suited for robust model training and generalization.
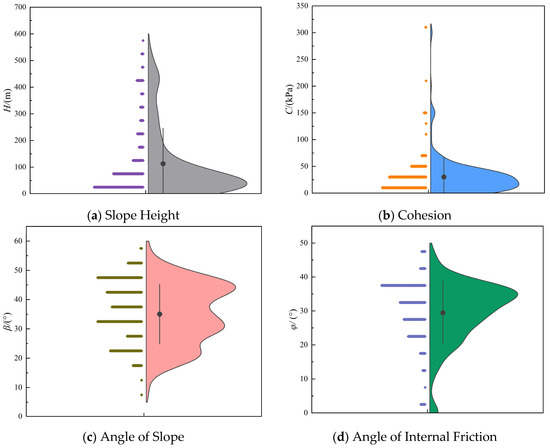
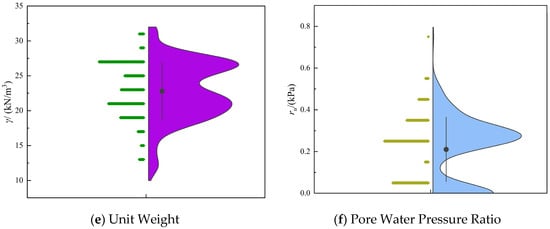
Figure 1.
Violin plots of slope characteristics. (a) Slope Height; (b) Cohesion; (c) Angle of Slope; (d) Angle of Internal Friction; (e) Unit Weight; (f) Pore Water Pressure Ratio.
Strong correlations between input features can negatively impact model performance by increasing model complexity, reducing generalizability, and elevating computational costs, which in turn may lower both the efficiency and accuracy of predictions [16]. Therefore, it is essential to assess the correlations among the selected features. The Pearson correlation coefficient, ranging from −1 to 1, is commonly used to measure the strength and direction of linear relationships between two variables. A coefficient close to 1 indicates a strong positive correlation, while a value near −1 suggests a strong negative correlation. In general, the absolute value of the Pearson correlation coefficient is interpreted as follows: 0–0.3 indicates negligible correlation; 0.3–0.5 indicates low correlation; 0.5–0.8 indicates moderate correlation; and values above 0.8 indicate strong correlation. As shown in Figure 2, among the six selected features, the highest correlation coefficients were observed between unit weight and internal friction angle (0.46), and between unit weight and slope height (0.49). All absolute correlation coefficients are below 0.5, indicating no strong linear relationships among the features. Therefore, the selected features in the dataset are appropriate, and no further dimensionality reduction or decorrelation processing is required.
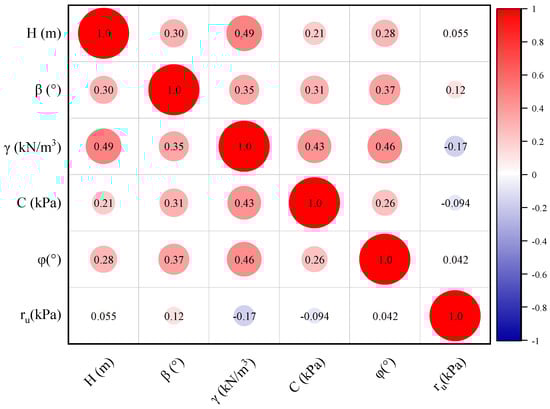
Figure 2.
Pearson correlation coefficient matrix of slope features.
2.2. Model Algorithm Principle
2.2.1. CatBoost
CatBoost (Categorical Boosting) is an improved gradient-boosting decision tree (GBDT) algorithm specifically designed to efficiently handle categorical features. It employs completely symmetric binary trees for gradient-boosting and introduces two major innovations: Ordered Target Statistics and Ordered Boosting [17].
In conventional GBDT models, categorical features are typically replaced by the mean of the target label for each category, calculated as follows:
However, this approach oversimplifies feature representation by replacing categorical values with target means, which may result in target leakage and conditional shift. To address this, CatBoost improves the target statistics method by incorporating a prior term and an associated weight factor, reducing the influence of noise and infrequent categories on the data distribution. The improved formulation is as follows:
where p is the prior value and α is the smoothing coefficient, typically set between 0.1 and 10 to balance model stability and convergence, so α > 0.
By applying random permutations to the training samples, CatBoost generates multiple encoding schemes, mitigating the issue of target leakage commonly encountered in traditional target encoding.
CatBoost also proposes the Ordered Boosting technique, which ensures unbiased gradient estimates during the selection of the best tree structure. Specifically, for each sample, CatBoost builds an independent model using a training set that excludes the target sample. The resulting model is then used to compute an unbiased gradient estimate for that sample, which is further used to train the base learner and update the final model.
Through these strategies, CatBoost successfully overcomes gradient bias and prediction shift issues that are inherent in traditional GBDT algorithms. Compared with XGBoost and LightGBM, CatBoost demonstrates superior classification accuracy and generalization performance, especially in scenarios that do not require extensive feature preprocessing.
2.2.2. Optuna-TPE Hyperparameter Optimization
Optuna is an automated hyperparameter optimization framework specifically designed for machine learning applications [18]. Within Optuna, the Tree-structured Parzen Estimator (TPE) is a Bayesian optimization algorithm that addresses global optimization problems of black-box functions. It operates under the Sequential Model-Based Optimization (SMBO) framework to enable efficient exploration of the search space, particularly in high-dimensional optimization scenarios.
The TPE algorithm divides the parameter space into two probabilistic distributions: one representing better-performing trials, denoted as l(x), and the other representing all remaining trials, denoted as g(x). Candidate parameters are selected by maximizing the ratio l(x)/g(x), dynamically guiding the search toward more promising regions. This layered modeling approach provides a distinct advantage in high-dimensional spaces, especially when handling conditional hyperparameters—for instance, where the choice of activation function determines the subsequent set of tunable parameters. In such cases, TPE can automatically construct a tree-structured search pathway.
Compared to traditional Bayesian optimization methods, TPE uses Parzen window density estimation instead of Gaussian processes and integrates the CMA-ES (Covariance Matrix Adaptation Evolution Strategy) to refine the search process. After an initial phase of random sampling (commonly the first 10 trials), the algorithm progressively narrows the search space, facilitating a smooth transition from global exploration to local exploitation.
2.2.3. Optuna-TPE Optimization of CatBoost
The integration of the Optuna-TPE algorithm with the CatBoost classifier offers an efficient framework for building an intelligent slope stability analysis model through advanced hyperparameter optimization. The Optuna framework employs the Tree-structured Parzen Estimator (TPE) algorithm as its core optimization engine. By building probabilistic models based on historical trial results, it enables the intelligent exploration of the CatBoost hyperparameter space. Specifically, the TPE algorithm constructs two probability density functions for each hyperparameter: one based on the top-performing trials, and the other based on the remaining trials. By comparing the ratio between these distributions, the algorithm guides the selection of new sampling points. This mechanism allows for adaptive search strategies, beginning with broad exploration and gradually narrowing the focus to more promising parameter regions [19,20].
CatBoost has demonstrated significant advantages in handling complex geological conditions and high-dimensional feature interactions [21], particularly in applications such as slope sensitivity mapping and failure prediction [22,23,24,25]. Building upon these strengths, this study introduces the Optuna-TPE algorithm to further enhance parameter search efficiency and overall model performance.
During optimization, Optuna dynamically tunes the critical hyperparameters of the CatBoost training process, including but not limited to the Learning rate (0.001–0.3); Tree depth (3–10); Number of iterations (100–1000); and the L2 regularization coefficient (1 × 10⁻⁵–10).
In addition, the algorithm optimizes CatBoost-specific parameters related to feature combination, which govern the model’s ability to automatically discover latent interactions between features during tree construction. This capability is particularly vital for capturing complex interactions that are relevant to slope stability, including those between pore water pressure and the internal friction angle.
2.3. Model Construction and Performance Evaluation
2.3.1. Construction of the Optuna-TPE-CatBoost Model
To evaluate slope stability, this study constructs an Optuna-TPE-CatBoost model with broad application potential. The area under the curve (AUC) is used as the primary optimization objective within the Optuna-TPE framework. The model construction process is shown in Figure 3:
Figure 3.
Flowchart of Optuna-TPE-CatBoost model construction.
- 1.
- Dataset Partitioning
The dataset is randomly divided into a training set (80%) and a test set (20%) using stratified sampling. A fixed random seed is applied to ensure experimental reproducibility. The feature matrix and label vector are partitioned synchronously to maintain sample correspondence. Both subsets are independent and follow the same distribution. The categorical variable representing slope stability status is encoded into numerical labels: stable = 1 and failure = 0.
- 2.
- Hyperparameter Optimization for CatBoost
The Optuna optimization objective function is defined with a search space covering 11 key hyperparameters: the number of iterations (200–1000), tree depth (3–6), learning rate (log scale: 0.01–0.2), the L2 regularization coefficient (3–10), the minimum samples per leaf (5–30), random strength (1–10), model size regularization (0–1), the feature sampling rate (0.7–1.0), and an early stopping mechanism (20 rounds without improvement) that is implemented to prevent overfitting. Class imbalance in slope failure samples is addressed through balanced training strategies, including the use of the auto_class_weights parameter in CatBoost, which is incorporated into the Optuna optimization loop to jointly optimize both model performance and class balance.
- 3.
- Execution of TPE Optimization
The TPESampler is configured with 10 initial warm-up trials. The optimization process is guided by prior distributions based on the best historical trials. A learning objective is defined to maximize the AUC metric. A total of 50 optimization trials are conducted, with each trial recording the tested hyperparameter combination and the corresponding AUC value on the test set.
- 4.
- Construction of the Final Model
Based on the optimal hyperparameter set recommended by the Optuna-TPE algorithm, the final CatBoost model is trained and fine-tuned accordingly.
- 5.
- Model Evaluation
The trained CatBoost model is evaluated on the independent test set using key performance metrics: accuracy, precision, recall, and AUC-ROC. The AUC is emphasized as the primary indicator for optimization. Additionally, 5-fold cross-validation is conducted to assess the model’s stability and ensure generalizability and robustness.
2.3.2. Model Performance Evaluation Metrics
To validate the superiority of the Optuna-TPE-CatBoost-optimized model, three baseline models—XGBoost, LightGBM, and unoptimized CatBoost—are selected for comparative experiments. All models are trained and tested on the same dataset, with an 80% training set and a 20% test set. Additionally, 5-fold cross-validation is employed to ensure model stability and reliability.
The model performance is comprehensively evaluated using the following metrics:
Accuracy represents the overall proportion of correctly predicted samples.
Precision measures the proportion of samples actually classified as failure among those predicted as failures, reflecting the risk of false positives.
Recall measures the proportion of actual failure cases that are correctly identified, reflecting the model’s false negative rate.
F1-Score: The harmonic mean of precision and recall, offering a balanced performance evaluation, which is particularly valuable under class imbalance conditions.
The AUC (area under the ROC curve) quantifies the area under the receiver operating characteristic (ROC) curve. A higher AUC value signifies better discriminative power between stable and failed slopes, with values closer to 1 indicating superior model performance.
The calculation of these evaluation metrics is based on the confusion matrix (Table 2) and the ROC curve. The corresponding formulas are as follows:
Table 2.
Confusion matrix for slope stability prediction results.
In the above formulas, TP (True Positive) refers to cases where the predicted label is positive and the actual label is also positive; TN (True Negative) refers to cases where both the predicted and actual labels are negative; FP (False Positive) denotes cases where the model predicts a positive outcome, but the actual label is negative; FN (False Negative) indicates cases where the model predicts a negative outcome, but the actual label is positive.
To mitigate the risks of overfitting and selection bias during hyperparameter tuning, cross-validation is commonly employed to provide more reliable model evaluation and improve generalizability. In this study, 5-fold cross-validation was selected as it offers a good balance between computational efficiency and performance stability. In contrast, approaches like Leave-One-Out or stratified k-fold cross-validation are more computationally intensive and may lead to high variance, especially when applied to ensemble models like CatBoost. Moreover, 5-fold cross-validation is widely adopted in geotechnical machine learning studies, facilitating consistency and comparability with previous research.
In 5-fold cross-validation, the dataset is evenly divided into five subsets. In each iteration, four subsets are used for training, and the remaining one is used for validation. This process is repeated five times, with each subset serving once as the validation set. The results are averaged to identify the optimal combination of hyperparameters, thereby maximizing both the predictive accuracy and generalization ability of the model [26].
In addition to standard performance metrics such as accuracy, precision, recall, and the AUC, we also conducted a sensitivity analysis by introducing SHAP summary plots to evaluate the model’s responsiveness to variations in key geotechnical parameters. This approach not only enhances model interpretability but also provides insights into the physical mechanisms underlying slope stability prediction.
2.3.3. Model Comparison Results
As illustrated in Figure 4, the CatBoost model optimized by Optuna-TPE outperforms all baseline models across all evaluation metrics. Specifically, it achieves a higher accuracy, precision, recall, and F1-score compared to XGBoost, LightGBM, and the unoptimized CatBoost model. Notably, all performance metrics for CatBoost exceed 0.85, indicating a significantly better predictive capability than the other three models.
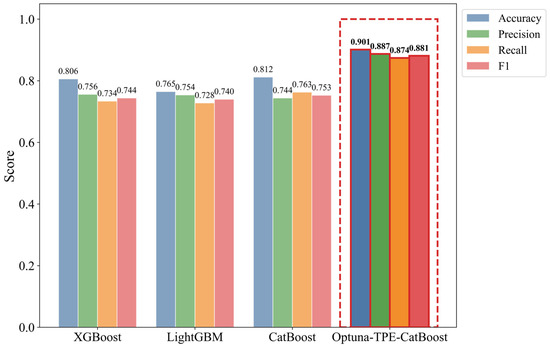
Figure 4.
Comparison of model performance metrics.
The ROC curves of the four models are presented in Figure 5, with the corresponding AUC values as follows: XGBoost (0.818); LightGBM (0.828); CatBoost (0.833); Optuna-TPE-CatBoost (0.926). Clearly, the ROC curve of the Optuna-TPE-CatBoost model is closest to the top-left corner, indicating a substantial improvement in classification performance after hyperparameter optimization.
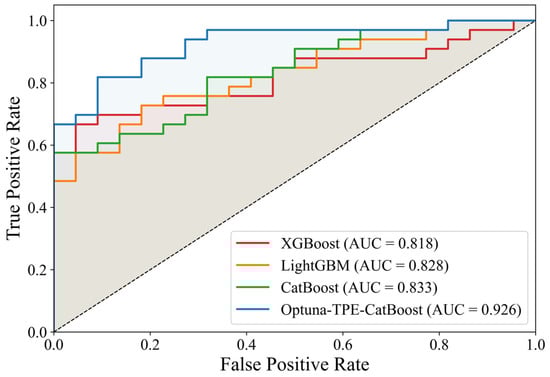
Figure 5.
ROC curves of different models.
The summary of evaluation metrics for all models is presented in Table 3. The CatBoost model optimized by Optuna-TPE clearly outperforms the baseline models, confirming the effectiveness of the hyperparameter search strategy. Specifically, the precision improved by 11.2% (Δ = 0.093) and the accuracy increased by 10.9% compared to the baseline CatBoost model. The substantial improvement in recall (0.874) and F1-score (0.912) further validates that the TPE algorithm effectively mitigates class imbalance through dynamic parameter adjustment. In particular, the optimized model achieved an AUC-ROC of 0.926, which is 18.0% higher than that of the unoptimized CatBoost. It also achieved the best overall performance in terms of accuracy (0.901), precision (0.887), recall (0.874), and F1-score (0.881), indicating that hyperparameter tuning significantly enhanced the model’s predictive capability and robustness.
Table 3.
Summary of model evaluation metrics.
The 5-fold cross-validation results for each model are presented in Figure 6. The Optuna-TPE-CatBoost model consistently achieved validation scores above 0.90 across all five folds, outperforming the other three models, whose validation scores all exceeded 0.85. The highest individual score—excluding the optimized model—was obtained in the first fold of the baseline CatBoost. Importantly, the performance curve of Optuna-TPE-CatBoost remains consistently higher than those of the other three models, indicating its superior generalization capability. As shown in Figure 7, the standard deviations of the cross-validation results for each model are as follows: XGBoost (0.007); LightGBM (0.007); CatBoost (0.012); Optuna-TPE-CatBoost (0.005). CatBoost exhibited the highest variability with a standard deviation of 0.012, while the optimized Optuna-TPE-CatBoost model achieved the lowest standard deviation at 0.005, indicating greater consistency and robustness in its predictions.
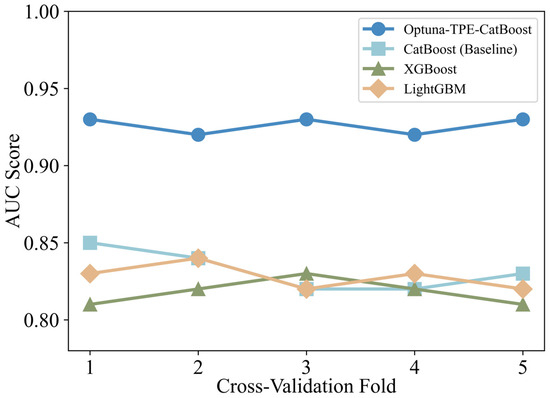
Figure 6.
Five-fold cross-validation results.
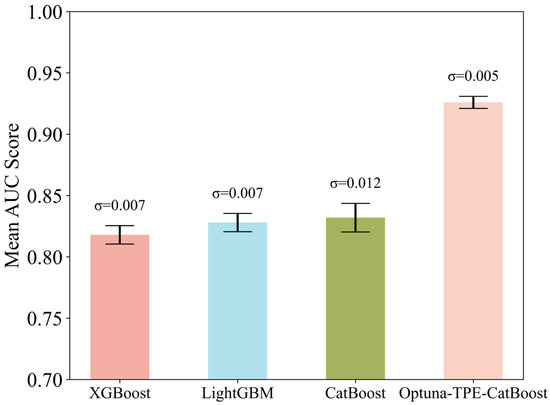
Figure 7.
AUC values and standard deviations.
Furthermore, as illustrated in Figure 6 and Figure 7, the validation curve of the Optuna-TPE-CatBoost model consistently lies above those of the other models across all five folds, demonstrating its superior performance throughout the cross-validation process. Compared with the unoptimized CatBoost model, the optimized model exhibits a notable improvement in stability, as reflected by its lower standard deviation (0.005), compared to the range of 0.007 to 0.012 observed in the other models. This enhanced performance may be partially attributed to the integration of the auto_class_weights parameter in the CatBoost model, which dynamically adjusts class weights to mitigate the impact of data imbalance. This strategy, combined with hyperparameter optimization via Optuna, contributes to improved generalization and robustness of the model.
Figure 8 illustrates the SHAP summary plot for the Optuna-TPE-CatBoost model, providing insights into the contribution and direction of each geotechnical feature toward the prediction of slope stability. From a geotechnical perspective, the internal friction angle (φ) shows the strongest influence, with a wide spread of SHAP values. High φ values (red) are generally associated with positive SHAP values, indicating improved stability—consistent with the Mohr–Coulomb failure criterion. The pore pressure ratio (ru) exhibits mostly negative SHAP values, particularly at higher values, reflecting its destabilizing role by reducing effective stress. Slope angle (β) also contributes negatively, especially for steeper slopes, aligning with the increased driving force on failure surfaces. Cohesion (C) has a more dispersed impact, where high values enhance stability, but its influence is less concentrated than that of φ. Slope height (H) and unit weight (γ) show moderate effects, with taller slopes and heavier materials sometimes contributing slightly to instability. Overall, the SHAP-based sensitivity analysis confirms that the model correctly captures known geomechanical relationships and nonlinear interactions among features. From a geotechnical perspective, this is consistent with the understanding that factors such as the internal friction angle and the pore pressure ratio exert a critical influence on slope stability, and that SHAP values can effectively reveal such mechanisms in interpretable machine learning frameworks [27]. This enhances the interpretability, transparency, and engineering applicability of the proposed model, making it a reliable tool for practical slope stability assessment.
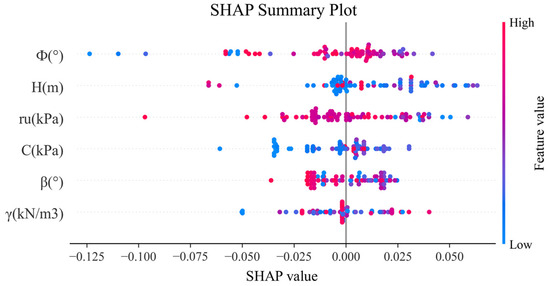
Figure 8.
SHAP summary plot of feature importance for slope stability analysis.
In summary, the proposed Optuna-TPE-CatBoost model shows significant advantages in predictive accuracy, resilience to imbalanced data, and stability, making it a reliable choice for slope stability classification tasks.
3. Engineering Case Verification
To further validate the generalizability and practical robustness of the Optuna-TPE-optimized CatBoost model beyond internal validation, ten slope engineering cases outside the original dataset were selected [28,29]. While five-fold cross-validation ensures the model’s internal reliability and prevents overfitting, external validation on truly unseen cases provides an additional, more rigorous test of its real-world applicability. These external cases were not included in the training or cross-validation stages in order to preserve their independence and avoid data leakage, which could otherwise inflate performance metrics and compromise the evaluation’s objectivity. The use of external validation is particularly important in geotechnical engineering, where geological variability and site-specific conditions are difficult to replicate in limited datasets.
The data were sourced from published engineering reports and one real-world open-pit slope project, with no overlap with the original 272-case dataset. The ten cases were selected based on the following criteria: (1) a wide range of geological and engineering conditions; (2) well-documented stability outcomes; (3) the availability of reliable input parameters; and (4) data sourced from peer-reviewed publications and real-world projects. The selected cases were evaluated using the Optuna-TPE-CatBoost framework, and the corresponding results are summarized in Table 4. The findings indicate that the model’s predictions were fully consistent with the actual stability status of all ten slopes. Of particular note are Cases 4 and 9, which involved slope failures. Figure 9 shows the field failure pattern of Case 4, where the model accurately identified critical feature combinations, including low cohesion (C = 0 kPa) together with high pore pressure ratios (ru > 0.3). This highlights the model’s strong ability to capture the coupled interaction between strength parameters and pore water pressure, thus validating the TPE algorithm’s deep optimization of CatBoost’s feature interaction mechanism. Such optimization allows the model to identify nonlinear interactions that are crucial for assessing slope failure mechanisms.
Table 4.
Case validation results.
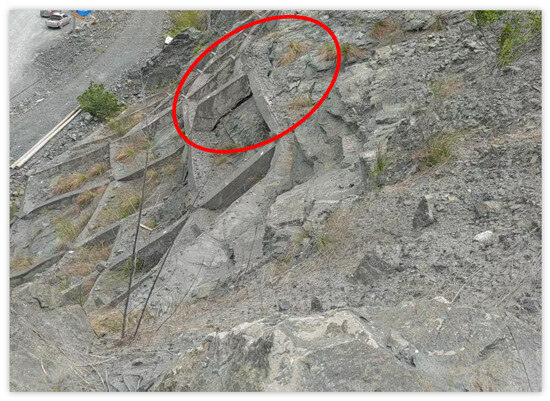
Figure 9.
Field failure pattern of Case 4.
However, one notable limitation of the current framework lies in its omission of structural discontinuity orientations, such as joint, fault, or bedding plane directions. Since the current model relies primarily on scalar geotechnical parameters, it may not fully capture the mechanical behavior of slopes where structural controls dominate. Future work should consider integrating additional parameters—such as dominant joint orientations and structural plane attitudes—to improve the model’s predictive performance for structure-controlled landslides. In conclusion, the engineering validation demonstrates that the Optuna-TPE-CatBoost model can provide reliable and practical support for slope stability assessment.
4. Discussion
The proposed Optuna-TPE-CatBoost model demonstrates robust performance in classifying slope stability, as evidenced by its high predictive accuracy, stability across cross-validation folds, and resilience to data imbalance. Compared to traditional machine learning algorithms such as Random Forest and XGBoost, the proposed model demonstrates superior performance in terms of F1-score and ROC-AUC values, validating the effectiveness of the Optuna-TPE framework in hyperparameter optimization. These improvements are particularly meaningful in geotechnical engineering contexts, where class imbalance and nonlinear feature interactions are common challenges. The model’s architecture, which integrates Bayesian optimization with gradient-boosting decision trees, enables the effective handling of heterogeneous input data and complex geomechanical relationships. This provides practitioners with a transparent and reliable tool for early risk identification and preventive design. The SHAP-based interpretability analysis further confirms that key features such as the internal friction angle and the pore pressure ratio influence predictions in a manner that is consistent with classical geotechnical principles, thus reinforcing the model’s credibility and practical relevance. Compared to previous studies relying on conventional machine learning methods without systematic hyperparameter tuning, the framework demonstrates higher adaptability to imbalanced datasets and varying geological conditions, highlighting its potential for real-world slope monitoring and early warning systems.
However, the current model uses a concise set of six input features—slope height, slope angle, cohesion, friction angle, unit weight, and the pore pressure ratio—which, while facilitating scalability and deployment, may limit its applicability to highly complex or heterogeneous geological environments. Future research will focus on integrating multi-source heterogeneous data fusion, such as real-time sensor inputs and remote sensing information, to enhance the model’s scalability, generalization, and robustness, thereby supporting efficient large-scale and network-level slope monitoring.
Overall, this study contributes to the advancement of intelligent slope stability assessment by combining state-of-the-art optimization and interpretable machine learning techniques, offering a promising pathway for practical engineering applications and further academic exploration.
5. Conclusions
To improve the accuracy and engineering applicability of slope stability assessment, and to overcome the limitations of traditional physical-mechanical models in handling complex geological conditions and heterogeneous slope data integration, this study proposed an intelligent slope stability identification model based on Optuna-TPE-CatBoost. By integrating a Bayesian optimization strategy with a gradient-boosting decision tree algorithm, the model enables adaptive hyperparameter tuning and nonlinear interaction modeling in high-dimensional feature spaces. The main conclusions are as follows:
- (1)
- Based on heterogeneous slope data, a feature system was constructed using six core parameters: slope height (H), slope angle (β), unit weight (γ), cohesion (C), internal friction angle (φ), and the pore pressure ratio (ru). Pearson correlation analysis verified the independence of these features, ensuring the scientific validity and effectiveness of the model inputs.
- (2)
- By introducing the Optuna-TPE algorithm for the dynamic hyperparameter optimization of the CatBoost model, and integrating class imbalance mitigation and cross-validation, the model’s classification performance and generalization ability were significantly improved. The final optimized model outperformed the baseline models (XGBoost, LightGBM, and unoptimized CatBoost) across core metrics including AUC, F1-score, accuracy, and recall, while also demonstrating a lower standard deviation in 5-fold cross-validation, indicating enhanced robustness and stability.
- (3)
- External validation using real-world slope engineering cases showed a high degree of consistency between the model predictions and actual stability conditions. In particular, the model effectively identified instability caused by the coupling of high pore water pressure and low strength parameters, demonstrating its practicality and adaptability under complex nonlinear conditions.
- (4)
- This study highlights the effectiveness and engineering feasibility of machine learning methods in slope stability identification. However, the model’s performance may still be constrained by the quality and diversity of the training data, suggesting that future studies should incorporate broader datasets and integrate more complex geotechnical conditions to enhance generalization.
- (5)
- Furthermore, despite the model’s strong performance in prediction and interpretability, it currently lacks integration with real-time monitoring systems and large-scale automated data pipelines. This limits its immediate applicability in dynamic or spatially extensive environments such as transportation corridors or regional slope monitoring networks. Future work will focus on embedding the model within real-time sensor frameworks and geospatial monitoring platforms to enable continuous slope risk assessment at scale.
Future Prospects:
Although the proposed model utilizes a concise set of six input features, this design choice enhances its scalability and practical deployability. The selected parameters—slope height, angle, cohesion, friction angle, unit weight, and the pore pressure ratio—are commonly available in most geotechnical investigations and can be obtained through standard site surveys, remote sensing, or in situ monitoring systems. Furthermore, the lightweight structure of the CatBoost algorithm, combined with the optimized hyperparameters via Optuna-TPE, enables fast inference and a low computational cost, making it suitable for integration into real-time or edge-computing platforms. These characteristics support network-level applications, such as stability monitoring across transportation corridors (e.g., highways, railways), where consistent data structures and automated data flows can be established. In future work, the framework can be extended to incorporate data from multi-source data, enabling true multi-source data fusion for enhanced slope stability assessment.
Supplementary Materials
The following supporting information can be downloaded at: https://www.mdpi.com/article/10.3390/eng6080185/s1, Table S1: Selected slope stability data samples available for public reference.
Author Contributions
Conceptualization, C.Z.; data curation, L.W. and C.Z.; methodology, L.W.; project administration, W.W., T.M., and P.S.; resources, C.Z.; validation, L.W.; visualization, L.W.; writing—original draft, L.W.; writing—review and editing, C.Z. and T.D. All authors have read and agreed to the published version of the manuscript.
Funding
This research received no external funding.
Data Availability Statement
Some or all data that support the findings of this study are available from the corresponding author upon reasonable request.
Conflicts of Interest
Author Wei Wang, Tao Ma, Pei Shuai were employed by the company Pangang Group Mining Co., Ltd. The remaining authors declare that the research was conducted in the absence of any commercial or financial relationships that could be construed as a potential conflict of interest.
References
- Li, X.; Huang, F.; Yang, Z. Multisource monitoring data-driven slope stability prediction using ensemble learning techniques. Comput. Geotech. 2024, 169, 106255. [Google Scholar] [CrossRef]
- Zhang, W. Study on Slope Stability Analysis Based on Machine Learning. Master’s Thesis, Taiyuan University of Technology, Taiyuan, China, 2020. [Google Scholar] [CrossRef]
- Zhang, L.; Chen, Z.; Zhou, T.; Nian, G.; Wang, J.; Zhou, Z. Multisource information fusion and stability prediction of open-pit mine slopes based on gradient boosting decision trees. J. China Coal Soc. 2020, 45, 173–180. [Google Scholar] [CrossRef]
- Zhang, H.; Wu, S.; Zhang, Z.; Sun, J.; Han, L. Study on automatic machine learning prediction method for slope stability. China Saf. Sci. J. 2023, 19, 35–40. [Google Scholar]
- Khan, M.; Rahman, M. Landslide susceptibility mapping using XGBoost and interpretable machine learning. In Proceedings of the 2023 International Conference on Machine Intelligence for GeoAnalytics and Remote Sensing (MIGARS), Hyderabad, India, 27–29 January 2025; Volume 40, pp. 301–320. [Google Scholar] [CrossRef]
- Chen, H.; Fan, Y. An attribution deep learning interpretation model for landslide susceptibility mapping in the Three Gorges Reservoir area. IEEE Trans. Geosci. Remote Sens. 2023, 61, 3000515. [Google Scholar] [CrossRef]
- Ghorbanzadeh, O.; Xu, Y.; Zhao, H.; Wang, J.; Zhong, Y.; Zhao, D.; Zang, Q.; Wang, S.; Zhang, F.; Shi, Y.; et al. The outcome of the 2022 Landslide4Sense competition: Advanced landslide detection from multisource satellite imagery. IEEE J. Sel. Top. Appl. Earth Obs. Remote Sens. 2022, 15, 9927–9942. [Google Scholar] [CrossRef]
- Fu, R.; He, J.; Liu, G.; Li, W.; Mao, J.; He, M.; Lin, Y. Fast seismic landslide detection based on improved Mask R-CNN. Remote Sens. 2022, 14, 3928. [Google Scholar] [CrossRef]
- Jiang, D.; Zhu, H.; Du, Y. Slope Stability Analysis and Landslide Prevention; Chongqing University Press: Chongqing, China, 2005. [Google Scholar]
- Duncan, J.M.; Wright, S.G. Soil Strength and Slope Stability; John Wiley & Sons: New York, NY, USA, 2005. [Google Scholar]
- Zang, K.; Li, M. Open-pit mine slope stability prediction based on GA-BP model. China Min. 2019, 28, 144–148. [Google Scholar]
- Su, G.; Song, Y.; Yan, L. Application of Gaussian process machine learning in slope stability assessment. Chin. J. Geotech. Eng. 2009, 30, 675–679+687. [Google Scholar]
- Jin, A.; Zhang, J.; Sun, H.; Wang, B. Intelligent prediction and early-warning model for slope instability based on SSA-SVM. J. Huazhong Univ. Sci. Technol. (Nat. Sci. Ed.) 2022, 50, 142–148. [Google Scholar]
- Xiong, Z. Optimization of Slope Stability Prediction Models Based on Machine Learning. Master’s Thesis, Kunming University of Science and Technology, Kunming, China, 2023. [Google Scholar]
- Wang, J.; Xu, Y.; Li, J. Prediction of slope stability factors based on grid-search SVM. Railw. Constr. 2019, 59, 94–97. [Google Scholar]
- Kurnaz, T.F.; Erden, C.; Dağdeviren, U.; Demir, A.S.; Kökçam, A.H. Comparison of machine learning algorithms for slope stability prediction using an automated machine learning approach. Nat. Hazards 2024, 120, 6991–7014. [Google Scholar] [CrossRef]
- Hancock, J.T.; Khoshgoftaar, T.M. CatBoost for big data: An interdisciplinary review. J. Big Data 2020, 7, 94. [Google Scholar] [CrossRef]
- Akiba, T.; Sano, S.; Yanase, T.; Ohta, T.; Koyama, M. Optuna: A next-generation hyperparameter optimization framework. In Proceedings of the 25th ACM SIGKDD International Conference on Knowledge Discovery & Data Mining (KDD), Anchorage, AK, USA, 4–8 August 2019; pp. 2623–2631. [Google Scholar] [CrossRef]
- He, J.; Feng, X.; Liu, T. Predicting sand–soil liquefaction using CatBoost combined with the Optuna framework. J. Nat. Sci. Jinan Univ. 2024, 38, 496–502. [Google Scholar] [CrossRef]
- Babu, T.; Nair, R.R. Optimized rainfall prediction model using Optuna-CatBoost: An innovative approach. In Proceedings of the 3rd Odisha International Conference on Electrical Power Engineering, Communication and Computing Technology (ODICON), Bhubaneswar, India, 8–9 November 2024; IEEE: Piscataway, NJ, USA, 2024; pp. 1–6. [Google Scholar]
- Zhang, K.; Wu, H. Optimized CatBoost-based landslide detection in complex terrain. Landslides 2023, 20, 1121–1134. [Google Scholar]
- Pham, B.T.; Tien Bui, D.; Pourghasemi, H.; Prakash, I.; Dholakia, M. A review of soft computing models in slope stability prediction. Environ. Earth Sci. 2021, 80, 1–17. [Google Scholar]
- Azarafza, M.; Azarafza, M.; Akgün, H.; Atkinson, P.M.; Derakhshani, R. Deep learning-based landslide susceptibility mapping. Sci. Rep. 2021, 11, 24112. [Google Scholar] [CrossRef]
- Kavzoglu, T.; Teke, A. Predictive performances of ensemble machine learning algorithms in landslide susceptibility mapping using random forest, extreme gradient boosting (XGBoost) and natural gradient boosting (NGBoost). Arab. J. Sci. Eng. 2022, 47, 7367–7385. [Google Scholar] [CrossRef]
- Wei, Q.; Zhang, Y.; Ma, Y.; Yang, R.; Lei, K. ASTER GDEM Correction Based on Stacked Ensemble Learning and ICEsat-2/ATL08: A Case Study from the Qilian Mountains. Remote Sens. 2025, 17, 1839. [Google Scholar] [CrossRef]
- Yang, X.; Duan, S.; Jiang, L.; Liu, G. Research on slope stability prediction method based on intelligent optimization algorithms. Hydropower Energy Sci. 2024, 42, 96–100. [Google Scholar] [CrossRef]
- Wu, S.; Wang, X.; Han, L.; He, P.; Cui, J.; Shen, H.; Li, Z. Analysis of slope instability factors: An application study of a novel interpretable ensemble model. Earth Sci. Inform. 2025, 18, 413. [Google Scholar] [CrossRef]
- Bai, G.; Hou, Y.; Wan, B.; An, N.; Yan, Y.; Tang, Z.; Yan, M.; Zhang, Y.; Sun, D. Performance evaluation and engineering verification of machine learning-based prediction models for slope stability. Appl. Sci. 2022, 12, 7890. [Google Scholar] [CrossRef]
- Ahmad, F.; Tang, X.W.; Qiu, J.N.; Wróblewski, P.; Ahmad, M.; Jamil, I. Prediction of slope stability using Tree-Augmented Naive-Bayes classifier: Modeling and performance evaluation. Math. Biosci. Eng. 2022, 19, 4526–4546. [Google Scholar] [CrossRef] [PubMed]


Disclaimer/Publisher’s Note: The statements, opinions and data contained in all publications are solely those of the individual author(s) and contributor(s) and not of MDPI and/or the editor(s). MDPI and/or the editor(s) disclaim responsibility for any injury to people or property resulting from any ideas, methods, instructions or products referred to in the content. |
© 2025 by the authors. Licensee MDPI, Basel, Switzerland. This article is an open access article distributed under the terms and conditions of the Creative Commons Attribution (CC BY) license (https://creativecommons.org/licenses/by/4.0/).